cancer incidence and mortality in massachusetts … · natalie nguyen durham, director, office of...
TRANSCRIPT

CANCER INCIDENCE AND
MORTALITY
IN MASSACHUSETTS
2011 – 2015:
STATEWIDE REPORT
With a Special Overview: Using Environmental Public Health Tracking
for Radon Awareness and Cancer Prevention
Office of Data Management and Outcomes Assessment
Office of Population Health
Massachusetts Department of Public Health
July 2018

This page intentionally left blank.

CANCER INCIDENCE AND
MORTALITY
IN MASSACHUSETTS
2011 – 2015:
STATEWIDE REPORT
With a Special Overview: Using Environmental Public Health Tracking
for Radon Awareness and Cancer Prevention
Charlie Baker, Governor
Karyn Polito, Lieutenant Governor
Marylou Sudders, Secretary of Health and Human Services
Monica Bharel, Commissioner of Public Health
Abigail Averbach, Assistant Commissioner and Director,
Office of Population Health
Natalie Nguyen Durham, Director, Office of Data Management and
Outcomes Assessment
Susan T. Gershman, Director, Massachusetts Cancer Registry
Massachusetts Department of Public Health
July 2018

ACKNOWLEDGMENTS
This report was prepared by Susan T. Gershman, Director, Massachusetts Cancer Registry, and
Massachusetts Cancer Registry staff and consultants. Special thanks are given to Annie MacMillan
and Richard Knowlton for their diligent work in preparing the data for this report. Thanks are also
given to consultant Nancy Weiss for her editing efforts. Thanks are given to Vanessa Neergheen of
the Massachusetts Registry of Vital Records and Statistics for providing the mortality data and
Malena Hood of the Office of Special Analytic Projects, Office of Population Health for providing
the population data. Thanks are also given to Vannalyn Abille, Lisa Hebert, Melanie Jetter, Sharon
Lee, Brenda Netreba, all of the Bureau of Environmental Health (BEH), and Greg Tocco, formerly of
the BEH, for the special section “Using Environmental Public Health Tracking for Radon Awareness
and Cancer Prevention”.
Massachusetts Cancer Registry Staff
Susan T. Gershman, MS, MPH, PhD, CTR, Director
Nancy Donovan, MA, CTR, Cancer Registrar
Richard Knowlton, MS, Epidemiologist
Ann MacMillan, MPH, Epidemiologist
Mary Mroszczyk, CTR, Geocoding/ Special
Projects Coordinator
Jeremiah Nesser, Technical Assistant for Special
Projects
Jayne Nussdorfer, CTR, Cancer Registrar
Barbara J. Rhodes, CMA, CTR, Cancer
Registrar/Death Clearance Coordinator
Pamela Shuttle, CTR, RHIT, Cancer Registrar/Non-
Hospital Reporting Coordinator
Hung Tran, Software Developer
Massachusetts Cancer Registry Advisory Committee Lindsay Frazier, MD, ScM (Chair)
Martie Carnie, Community Representative
Anita Christie, RN, MHA, CPHQ
Deborah Dillon, MD
Joanna Haas, MD
Joseph Jacobson, MD
Nancy Keating, MD, MPH
Carol Lowenstein, CTR, MBA
Gail Merriam, MSW, MPH
Larissa Nekhlyudov, MD, MPH
Al Ozonoff, MA, PhD
Sigalle Reiss, MPH, RS/REHS
Paul C. Shroy, MD, MPH
Ingrid Stendhal, CTR
Susan Sturgeon, DrPH, MPH
Jan Sullivan, MS
Michelle A. Williams, MS, SM, ScD
The data in this report are intended for public use and may be reproduced without permission. Proper acknowledgement of the
source is requested.
For further information, please contact the following:
Massachusetts Cancer Registry……………………………………………(617) 624-5642
Research and Epidemiology……………………………………………….(617) 624-5642
Occupational Health Surveillance…………………………………………(617) 624-5632
Bureau of Environmental Health…………………………………………..(617) 624-5757
Cancer Prevention and Control Initiative………………………………….(617) 624-5479
Massachusetts Department of Public Health website……………………...www.mass.gov/dph
We acknowledge the Centers for Disease Control and Prevention for its support of the staff and the printing and distribution of this
report under cooperative agreement 5 NU58DP006271-01-00 awarded to the Massachusetts Cancer Registry at the Massachusetts
Department of Public Health. Its contents are solely the responsibility of the authors and do not necessarily represent the official
views of the Centers for Disease Control and Prevention.

TABLE OF CONTENTS
Page Executive Summary………………………………………………………………………………… 1
Introduction………………………………………………………………………………...………. 6
Overall Content………………………………………………………………………………… 7
Special Overview: Using Environmental Public Health Tracking for Radon Awareness and
Cancer Prevention…………...…………………………………...………………………………… 8
Figures & Tables……………………………………………………………………………………13
Figure 1. Percentage of cancer incident cases by cancer type and sex, Massachusetts,
2011-2015…………………………………………………………………………………...14
Figure 2. Incidence rates for ten leading cancer types by sex, Massachusetts, 2011-2015……15
Figure 3. Percentage of cancer deaths by cancer type and sex, Massachusetts, 2011-2015…...16
Figure 4. Mortality rates for ten leading cancer types by sex, Massachusetts, 2011-2015…….17
Table 1. Age-specific incidence rates and median ages at diagnosis for selected cancer sites,
Massachusetts, 2011-2015, males …………………………………………………………18
Table 2. Age-specific incidence rates and median ages at diagnosis for selected cancer sites,
Massachusetts, 2011-2015, females …………………………………………………. 19
Table 3. Age-specific incidence rates and median ages at diagnosis for selected cancer sites,
Massachusetts, 2011-2015, total ………………………………………………………….. 20
Figure 5. Annual Percent Change (APC) in age-adjusted cancer rates
among males, Massachusetts, 2011-2015 ………………………………………………… 21
Figure 6. Annual Percent Change (APC) in age-adjusted cancer rates
among females, Massachusetts, 2011-2015……………………………………….……… 22
Table 4. Annual age-adjusted incidence rates for selected cancer sites,
Massachusetts, 2011-2015, males………………………………………………………… 23
Table 5. Annual age-adjusted incidence rates for selected cancer sites,
Massachusetts, 2011-2015, females……………………………………………………….. 24
Table 6. Annual age-adjusted incidence rates for selected cancer sites,
Massachusetts, 2011-2015, total ………………………………………………………….. 25
Table 7. Annual age-adjusted mortality rates for selected cancer sites,
Massachusetts, 2011-2015, males …………………………………………………………. 26
Table 8. Annual age-adjusted mortality rates for selected cancer sites,
Massachusetts, 2011-2015, females……………………………………… ……………….. 27

Table 9. Annual age-adjusted mortality rates for selected cancer sites,
Massachusetts, 2011-2015, total. …………………………………………………………..28
Table 10. Five leading cancer incidence rates by race/ethnicity and sex,
Massachusetts, 2011-2015 ………………………………………………………………… 29
Table 11. Number and percentage of incident cases for selected cancer sites
by race/ethnicity, Massachusetts, males, 2011-2015 ……………………………………… 30
Table 12. Number and percentage of incident cases for selected cancer sites
by race/ethnicity, Massachusetts, females, 2011-2015 ……………………………………. 31
Table 13. Number and percentage of incident cases for selected cancer sites
by race/ethnicity, Massachusetts, total, 2011-2015 ……………………… ………………. 32
Table 14. Age-adjusted incidence rates and 95% confidence limits (95% CL) for
selected cancer sites by race/ethnicity, Massachusetts, 2011-2015, males……………….. 33
Table 15. Age-adjusted incidence rates and 95% confidence limits (95% CL) for
selected cancer sites by race/ethnicity, Massachusetts, 2011-2015, females……………… 34
Table 16. Age-adjusted incidence rates and 95% confidence limits (95% CL) for
selected cancer sites by race/ethnicity, Massachusetts, 2011-2015, total…………………. 35
Table 17. Five leading cancer mortality rates by race/ethnicity and sex,
Massachusetts, 2011-2015 ………………………………………………………………… 36
Table 18. Number and percentage of deaths for selected cancer sites by
race/ethnicity, Massachusetts, 2011-2015, males …………………………………………. 37
Table 19. Number and percentage of deaths for selected cancer sites by
race/ethnicity, Massachusetts, 2011-2015, females ………………………………………. 38
Table 20. Number and percentage of deaths for selected cancer sites by
race/ethnicity, Massachusetts, 2011-2015, total …………………………………………... 39
Table 21. Age-adjusted mortality rates and 95% confidence limits (95% CL) for
selected cancer sites by race/ethnicity, Massachusetts, 2011-2015, males ………………...40
Table 22. Age-adjusted mortality rates and 95% confidence limits (95% CL) for
selected cancer sites by race/ethnicity, Massachusetts, 2011-2015, females……..……….. 41
Table 23. Age-adjusted mortality rates and 95% confidence limits (95% CL) for
selected cancer sites by race/ethnicity, Massachusetts, 2011-2015, total ………………… 42
Table 24. Incidence rates for selected cancer sites by sex,
Massachusetts and U.S. (2011-2015) …………………………………………………….. 43
Table 25. Mortality rates for selected cancer sites by sex,
Massachusetts and U.S. (2011-2015) …………………………………………………….. 44

Appendices…………………………………………………………………………………………. 45
Appendix I. ICD codes used for this report …………………………………………………… 46
Appendix II. Population and rate changes ……………………………………………………... 49
Appendix III. Population estimates by age, race/ethnicity, and sex,
Massachusetts, 2011-2015………………………………………………………………… 50
Appendix IV. Racial/ethnic breakdown of the Massachusetts and NAACCR
populations, 2011-2015……………………………………………………………………. 51
References ………………………………………………………………………………………….. 52

1
EXECUTIVE SUMMARY

2
EXECUTIVE SUMMARY
Cancer Incidence and Mortality in Massachusetts, 2011-2015: Statewide Report presents cancer
incidence and mortality data for the Commonwealth from 2011 through 2015. The report includes
numbers and rates for 24 types of cancer, information on age-specific patterns, an examination of
patterns by race/ethnicity, and a comparison of Massachusetts and national cancer rates. A special
section on Environmental Public Health Tracking and Radon is also included. Data are provided
on invasive cancers only with the exceptions of urinary bladder (which includes in situ and
invasive cancers combined) and in situ breast cancer. In situ means the cancer cells are still in the
place that they started and have not spread at all.
All counts and average annual age-adjusted rates presented in this Executive Summary are
for the period 2011-2015 and are for Massachusetts residents, unless otherwise stated.
OVERALL:
Total number of new cases – 183,661, an average of 36,732 annually (males= 87,884;
females = 95,757)
Total number of cancer deaths – 64,097, an average of 12,819 annually (males=32,392;
females=31,705)
Incidence rate (age-adjusted) for all cancers combined for total population – 466.1 per
100,000 persons
Mortality rate (age-adjusted) for all cancer deaths combined for total population – 156.1
per 100,000 persons.
MOST COMMONLY DIAGNOSED CANCERS & CANCER DEATH CAUSES BY SEX:
Incidence (newly diagnosed cases)
Males – prostate cancer accounted for 23.2% of all newly diagnosed cancers among males
Females – invasive breast cancer accounted for 30.0% of all newly diagnosed cancers
among females.
Mortality (cancer deaths)
Males – cancer of the bronchus and lung accounted for 26.3% of all cancer deaths among
males
Females – cancer of the bronchus and lung also accounted for 27.1% of all cancer deaths
among females.
TRENDS 2011-2015:
Trend Calculation Update: The annual percent change (APC) is a summary measure of the trend
over a specific time period. As of this report, we will be using the coefficient of variation (CV) to
determine which APC rates to suppress and which to flag as being unreliable. The CV is
calculated by dividing the mean incidence or mortality age-adjusted rate for each of the five years
by the standard error and multiplying that by 100. According to the US Census, a CV less than
15% indicates a high reliability and can presented without caution, a CV between

3
15‐30% indicates a medium reliability and can be presented with care, and a CV over
30% indicates a low reliability and can only be presented with extreme caution (footnote). This
report presents all trends with a high reliability and all trends with a medium reliability with a
footnote. Any trends with a low reliability are not presented and are indicated with ‘NA’.
Footnote- Barbara M. Parmenter and Janet Lau, ‘Estimating and Mapping Reliability for American
Community Survey Data’, revised 2/14/2013, available: http://ocw.tufts.edu/data/74/1624027.pdf
Statistically Significant Incidence Trends – Males
All cancers combined decreased 3.1% per year.
Bronchus & lung cancer decreased 2.9% per year.
Esophageal cancer decreased 5.2% per year.
Hodgkin’s lymphoma decreased 6.3% per year.
Kidney and renal pelvis cancer increased 4.1% per year.
Melanoma of skin decreased 7.1% per year.
Non-Hodgkin’s lymphoma increased 1.5% per year.
Testicular cancer decreased by 2.2% per year.
Statistically Significant Mortality Trends – Males
All cancers deaths combined decreased 2.4% per year.
Bronchus and lung cancer decreased 2.2% per year.
Kidney and renal pelvis cancer increased 6.7% per year.
Statistically Significant Incidence Trends – Females
All cancers combined decreased 0.7% per year.
Multiple myeloma decreased 4.7% per year.
Pancreatic cancer increased 3.0% per year.
Urinary bladder cancer decreased 3.1% per year.
Statistically Significant Mortality Trends – Females
All cancers deaths combined decreased 1.7% per year.
Breast cancer deaths decreased 1.5% per year.
RATES BY RACE/ETHNICITY: (Unless otherwise noted, the term ‘racial/ethnic groups’ in this
report refers to white non-Hispanic, black non-Hispanic, Asian non-Hispanic and Hispanic).
Males Incidence
Black, non-Hispanic males had the highest total age-adjusted incidence rates, significantly
higher than Asian, non-Hispanic and Hispanic males.
Cancers of prostate, bronchus and lung, and colon/rectum were the top 3 leading cancer
types in each racial/ethnic group except White, non Hispanics. For White, non-Hispanic
males, urinary bladder cancer was among the top 3, (after prostate and bronchus and lung).
White, non-Hispanic males had significantly higher rates of cancers of the brain and other
nervous system, esophagus, leukemia, oral cavity and pharynx, and urinary bladder when
compared to all other race/ethnic groups.

4
Black, non-Hispanic males had significantly higher rates of multiple myeloma and prostate
cancer when compared to all other race/ethnic groups.
Black, non-Hispanic, Asian, non-Hispanic, and Hispanic males had significantly higher
rates of liver and intrahepatic bile duct cancer when compared to white, non-Hispanic
males.
Males Mortality
Black, non-Hispanic males had the highest total cancer mortality rate, significantly higher
compared to Asian, non-Hispanics and Hispanic but not significantly higher than white,
non-Hispanic males.
Cancer of the bronchus and lung was the leading cause of cancer death for each
racial/ethnic group. White and black, non-Hispanics had comparable rates but significantly
elevated rates compared to the other two racial/ethnic groups.
The mortality rate for prostate cancer was significantly elevated among black, non-
Hispanic males compared to the other racial/ethnic groups.
The mortality rate for liver and intrahepatic cancer was highest among Asian, non-
Hispanics, significantly elevated compared to white, non-Hispanics and Hispanics, but not
compared to black, non-Hispanics.
Females Incidence
White, non-Hispanic females had the highest total age-adjusted incidence rates,
significantly higher than those of all other racial/ethnic groups.
Breast cancer was the most commonly diagnosed cancer for each racial/ethnic group.
The second most common cancer diagnosed was bronchus and lung for each racial/ethnic
group except Hispanics. Thyroid was the second most common cancer for Hispanics,
followed by bronchus and lung.
Compared to all other racial/ethnic groups, white, non-Hispanic females had significantly
higher rates of the following cancer types: invasive breast, in situ breast, and bronchus and
lung.
Black, non-Hispanic females had significantly higher rates of multiple myeloma compared
to all other racial/ethnic groups.
Black, non-Hispanic and Hispanic females had significantly higher rates of cervical cancer
compared to white, non-Hispanic females, but not compared to Asian, non-Hispanic
females.
Asian, non-Hispanic females had significantly higher liver and intrahepatic bile duct cancer
rates compared to white non-Hispanics and black non-Hispanics, but not compared to
Hispanics.
Hispanic females had significantly higher rates of multiple myeloma compared to white,
non-Hispanic and Asian, non-Hispanic females, but not compared to Black, non-Hispanic
females.
Females Mortality
Black and white, non-Hispanic females had the highest total cancer mortality rates,
significantly higher than for Asian, non-Hispanic and Hispanic females.
5
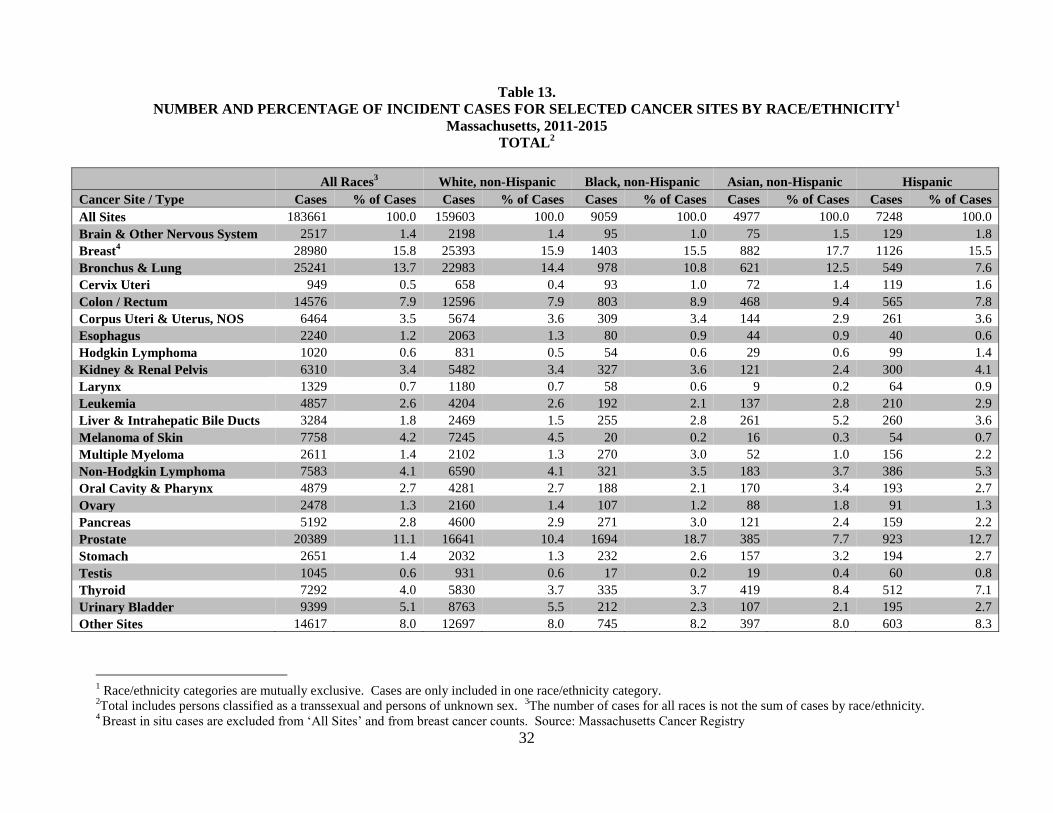
Cancer of the bronchus and lung was the leading cause of cancer death among all
racial/ethnic groups. White, non-Hispanic females had significantly elevated rates
compared to the other racial/ethnic groups.
Black, non-Hispanic females had significantly elevated uterine cancer and multiple
myeloma mortality rates when compared to the other racial/ethnic groups. Their breast
cancer mortality rate was significantly elevated compared to that of Asian, non-Hispanic
and Hispanic females, but was not significantly elevated compared to white, non-Hispanic
females.
MASSACHUSETTS VS. NATIONAL RATES
Males and Females Incidence
Overall age-adjusted cancer incidence rates in Massachusetts were significantly lower than
national rates for males, and were significantly higher than national rates for females. Among the
cancers significantly elevated for females were invasive and in situ breast, bronchus and lung,
uterine, esophageal, oral cavity and pharynx, thyroid, and urinary bladder. Among those cancers
significantly elevated for males were esophageal, liver and intrahepatic bile ducts, testicular,
thyroid and urinary bladder. Incidence rates that were significantly lower compared to the U.S.
among females were cervix uteri, colon and rectum, leukemia , and liver and intrahepatic bile
ducts, while among males the cancer types included bronchus and lung, colon and rectum, larynx,
leukemia, melanoma of skin, and prostate.
Males and Females Mortality
Overall age-adjusted cancer mortality rates in Massachusetts were significantly lower from
national rates for both males and females. However, male esophageal cancer mortality rates were
significantly elevated compared to the U.S. Several cancers had significantly lower mortality rates
compared to the U.S. For males, these were colon/rectum, bronchus and lung, kidney and renal
pelvis, larynx, multiple myeloma, non-Hodgkin lymphoma, and prostate cancer. For females,
these were breast, cervix uteri, colon/rectum, kidney and renal pelvis, and liver and intrahepatic
bile duct cancer.

6
INTRODUCTION

7
INTRODUCTION
The Massachusetts Cancer Registry (MCR) collects reports of newly diagnosed cases of cancer and
routinely compiles summaries of cancer incidence and mortality data. This report, Cancer Incidence and
Mortality in Massachusetts, 2011-2015: Statewide Report is produced annually with the most recently
available statewide data. Another report, Cancer Incidence in Massachusetts: City and Town Supplement, is
also produced annually and contains information for the 351 cities and towns in Massachusetts. Electronic
versions of these reports may be found on the internet at www.mass.gov/dph/mcr.
Overall Content
This report:
Provides statewide information on cancer incidence and mortality in Massachusetts for twenty-four
types of cancer and for all cancers combined for 2011 through 2015;*
Provides detailed information on the most commonly occurring types of cancer for 2011 through
2015;
Examines cancer incidence patterns by age, sex, and race/ethnicity;
Reviews Massachusetts cancer incidence and mortality trends for 2011 through 2015;
Compares Massachusetts incidence and mortality data with respective national data; and
Features a special section on “Using Environmental Public Health Tracking for Radon Awareness
and Cancer Prevention.”
The report is organized into the following sections:
SPECIAL OVERVIEW which provides more detailed information on a specific topic of interest
in Massachusetts. This report has a special overview of radon awareness and cancer prevention.
FIGURES & TABLES which present cancer incidence and mortality data for 24 types of cancer
for 2011-2015. There are 6 figures and 24 tables in this section with breakdowns by sex,
race/ethnicity, year, age group, state and national comparisons, and cancer type.
APPENDICES which provide information supplemental to this report, including a listing of codes
used to prepare the report, information on population and rate changes, and population estimates.
REFERENCES
*The Massachusetts incidence data in this report include only invasive cancers for 22 of the 24 types of
cancer. Cancer of the urinary bladder includes both in situ and invasive cases. Cancer of the breast in situ
is presented as a separate category but is not included in the “all sites combined” data.
Note: For more detailed information on the methods of the Massachusetts Cancer Registry, please refer
to Cancer Incidence and Mortality in Massachusetts 2006-2010: Statewide Report (1). For national
trends, please refer to the Annual Report to the Nation on the Status of Cancer, 1975-2014, Featuring
Survival (2).

8
SPECIAL OVERVIEW:
Using Environmental Public Health Tracking
for Radon Awareness and Cancer Prevention

9
Using Environmental Public Health Tracking for Radon Awareness and
Cancer Prevention
The Massachusetts Environmental Public Health Tracking (EPHT)
website (www.mass.gov/dph/matracking) hosted by the
Massachusetts Department of Public Health/Bureau of
Environmental Health (MDPH/BEH) and funded by the U.S.
Centers for Disease Control and Prevention (CDC) provides an
opportunity for the public to look at environmental data and chronic
disease rates statewide and locally.
Chronic diseases - such as heart disease, stroke, cancer, and diabetes - are among the most
prevalent, costly, and preventable of all health problems. With the help of MA EPHT, we can
reduce the burden of these diseases by using data to:
Inform decision makers
Develop stronger, evidence-based programs, targeted interventions, and policies
Evaluate programs and progress
In support of the goals of the 2017-2021 Massachusetts State Cancer Plan, the MA EPHT website
provides information on both cancer incidence and radon to fulfill the objectives to:
1) Reduce exposure to radon by increasing testing in homes, and
2) Provide access to information on cancer risks from environmental exposures to increase
awareness and prevention.
Cancer Incidence Data on MA EPHT
Cancer incidence data is just one of many health datasets that are available on the MA EPHT
website. Two different types of statistics are presented for many different cancer types and are
calculated using data from the MCR:
Direct Age-Adjusted Incidence Rates - These are most appropriate for large, stable study
populations such as a states or counties. They may be used to compare cancer incidence in
one relatively large area to another relatively large area (such as one county to another).
Standardized Incidence Ratios (SIRs) - These are most appropriate for small areas, such as
communities or census tracts within a community. They are used to evaluate whether the
incidence of cancer within a small area differs from that of the state as a whole.

10
This information may be viewed and downloaded as maps, tables, and charts.
Radon Information on MA EPHT
Did you know that radon is the second leading cause of lung cancer in the U.S.? The U.S.
Environmental Protection Agency (EPA) estimates that over 21,000 lung cancer deaths in the U.S.
each year are related to radon.
Radon gas decays into microscopic particles
that can be inhaled into the lungs. Radon
particles trapped in the lungs continue to
breakdown, damaging the lung tissue during
this decay process. This damage increases the
risk of developing lung cancer. Among people
who have never smoked, radon is the leading
cause of lung cancer.
Radon also increases the chance of lung cancer in people that smoke. For those who are exposed to
elevated indoor radon levels, people who smoke have up to 10 times the risk of developing lung
cancer than people who have never smoked. The MA EPHT website provides information on
radon as well as a radon risk table and a map of radon zones in Massachusetts.
How does radon enter homes?
Radon is a naturally occurring radioactive gas that is odorless,
colorless, and tasteless. As a gas, radon can move through
pathways in soil and rock formations.
Radon can enter homes through:
cracks and crevices in the foundation floors and walls
floor wall joints
penetrations of utility lines and sump holes
private water well
Once inside an enclosed space, such as a home, radon can
collect. Most radon gas found in a home comes up from the
ground, so the amount of radon is likely to be greater in the lowest
levels of the home. Radon levels are usually higher in the winter
time because, during the heating season, warm air rises and
escapes. This creates a vacuum in the lowest part of the house that causes the house to draw air,
including radon, from below the home. Any equipment that exhausts air or requires venting can
also contribute to the vacuum effect.

11
Testing the air in a home is the only way to know if indoor radon levels are elevated. If you
test your home in warm weather and get a low result, it is wise to test again during the heating
season. If you have a private well, you should have your water tested for radon too. For more
information, see the resources listed below.
For More Information
MDPH Resources:
Massachusetts Environmental Public Health Tracking (MA EPHT):
www.mass.gov/dph/matracking
Massachusetts State Cancer Plan: www.mass.gov/2017-2021-massachusetts-cancer-plan
MDPH/BEH Radon Fact Sheet:
http://www.mass.gov/eohhs/docs/dph/environmental/iaq/radon-fact-sheet-2016.pdf
Massachusetts Cancer Registry (MCR): www.mass.gov/dph/mcr
Additional Resources:
CDC’s National Environmental Public Health Tracking (EPHT) Program:
www.cdc.gov/nceh/tracking
EPA’s Citizen’s Guide to Radon: www.epa.gov/radon/pubs/citguide.html
EPA’s Home Buyer’s and Seller’s Guide to Radon:
https://www.epa.gov/radon/home-buyers-and-sellers-guide-radon
MassDEP’s Guide to Water Quality Testing for Private Wells:
http://www.mass.gov/eea/agencies/massdep/water/drinking/protect-your-family-a-guide-to-
water-quality-testing-f.html
Contact:
Bureau of Environmental Health
Massachusetts Department of Public Health
www.mass.gov/dph/environmental_health
Phone: 617-624-5757 | Fax: 617-624-5183 | TTY: 617-624-5286

12
Radon Unit
Massachusetts Department of Public Health/Bureau of Environmental Health
www.mass.gov/eohhs/gov/departments/dph/programs/environmental-health/exposure-
topics/iaq/radon/
Phone: 1-800-RADON-95 or (800) 723-6695 or (413) 586-7525 ext. 3185
Tobacco Cessation and Prevention Program
Massachusetts Department of Public Health
www.makesmokinghistory.org
Phone: 1-800-QUIT-NOW or (800) 784-8669

13
FIGURES & TABLES

14
Figure 1.
PERCENTAGE OF CANCER INCIDENT CASES BY CANCER TYPE AND SEX Massachusetts, 2011-2015
MALES (N=87,884) FEMALES (N=95,757)
Bronchus &
Lung
13.7%
Urinary
Bladder
7.8%
Other
47.0%
Colon/
Rectum
8.3%
Prostate
23.2%
Bronchus &
Lung
13.8%
Other
41.8%
Corpus Uteri
& Uterus,
NOS
6.7%
Colon/
Rectum
7.6%
Breast
30.0%
Source: Massachusetts Cancer Registry

15
Figure 2.
INCIDENCE RATES1 FOR TEN LEADING CANCER TYPES BY SEX
Massachusetts, 2011-2015
MALES
14.5
16.5
17.8
22.4
23.4
24.8
40.4
41.8
69.3
106.3
0 50 100 150 200
Pancreas
Leukemia
Oral Cavity & Pharynx
Kidney & Renal Pelvis
Non-Hodgkin Lymphoma
Melanoma
Urinary Bladder
Colon/Rectum
Bronchus & Lung
Prostate
FEMALES
11.2
11.5
11.6
16.3
29.6
60.2
137.6
16.8
33.1
29.4
0 50 100 150 200
Urinary Bladder
Pancreas
Ovary
Non-Hodgkin Lymphoma
Melanoma
Corpus Uteri & Uterus, NOS
Thyroid
Colon/Rectum
Bronchus & Lung
Breast
1Rates are age-adjusted to the 2000 U.S. Standard Population. NOS – Not Otherwise Specified.
Source: Massachusetts Cancer Registry

16
Figure 3.
PERCENTAGE OF CANCER DEATHS BY CANCER TYPE AND SEX Massachusetts, 2011-2015
MALES (N=32,392) FEMALES (N=31,705)
Pancreas
6.7%
Other Sites
50.2%
Bronchus &
Lung
26.0%
Prostate
9.3%
Colon/
Rectum
7.8%
Breast
13.2%
Pancreas
7.4%
Other Sites
45.0%
Bronchus &
Lung
26.2%
Colon/
Rectum
8.2%
_______________________________
Source: Massachusetts Vital Statistics

17
Figure 4.
MORTALITY RATES1 FOR TEN LEADING CANCER TYPES BY SEX
Massachusetts, 2011-2015
MALES
6.7
7.9
8.5
8.5
9.7
12.3
14.7
48.4
5.3
18.2
0 10 20 30 40 50 60
Brain & Other Nervous System
Non-Hodgkin Lymphoma
Urinary Bladder
Esophagus
Leukemia
Liver &Intrahepatic Bile Ducts
Pancreas
Colon/Rectum
Prostate
Bronchus & Lung
FEMALES
3.4
3.5
4.2
4.6
4.7
7.3
9.8
10.6
18.1
36.2
0 10 20 30 40 50 60
Liver & Intrahepatic Bile Ducts
Brain & Other Nervous System
Non-Hodgkin Lymphoma
Corpus Uteri & Uterus, NOS
Leukemia
Ovary
Pancreas
Colon/Rectum
Breast
Bronchus & Lung
1Rates are age-adjusted to the 2000 U.S. Standard Population. *NOS – Not Otherwise Specified.
Source: Massachusetts Vital Statistics

18
Table 1.
Massachusetts, 2011-2015
AGE-SPECIFIC INCIDENCE RATES1 AND MEDIAN AGE AT DIAGNOSIS FOR SELECTED CANCER SITES
MALES
1 per 100,000
2 Breast in situ is excluded from ‘All Sites’.
3 Dashes indicate age groups with no incident cases. Source: Massachusetts Cancer Registry
Cancer Site / Type 0-4 5-9 10-14 15-19 20-24 25-29 30-34 35-39 40-44 45-49 50-54 55-59 60-64 65-69 70-74 75-79 80-84 85+
Median
Age
All Sites 28.4 13.9 11.9 23.5 38.5 55.1 74.3 98.5 161.1 280.6 552.0 899.5 1342.4 1839.5 2405.9 2665.8 2821.0 2807.7 66 Brain & Other Nervous
System 5.2 3.8 2.7 2.8 2.5 4.9 4.1 3.5 4.4 5.9 8.6 11.5 16.5 20.4 27.2 29.5 31.0 21.3 60
Breast -- 0.1 -- -- -- -- 0.3 0.2 0.6 0.9 1.3 2.1 3.3 5.0 7.8 5.9 11.0 8.5 68
Breast in situ2 -- -- -- -- -- -- -- 0.1 0.2 0.1 0.2 0.3 0.3 0.4 1.0 1.4 0.4 0.8 68
Bronchus & Lung 0.1 0.1 0.5 0.5 1.5 2.7 7.6 19.2 50.5 101.9 160.1 259.7 414.5 514.1 547.4 441.4 71
Colon / Rectum -- -- 0.1 0.5 0.8 2.4 5.6 9.5 21.1 33.7 67.1 66.5 85.4 123.5 176.1 217.8 261.6 331.8 67
Esophagus -- -- -- -- 0.1 0.2 0.3 0.8 1.9 6.1 9.5 19.6 30.7 36.8 54.7 51.8 58.7 51.1 67
Hodgkin Lymphoma -- 0.5 1.1 2.7 5.4 5.6 4.9 2.9 3.6 3.4 2.7 3.1 4.3 4.2 5.2 5.9 3.8 3.6 42
Kidney & Renal Pelvis 2.8 0.6 0.1 0.3 0.5 1.5 3.5 8.2 14.8 22.3 35.4 46.8 63.4 80.9 98.8 102.0 90.9 66.9 63
Larynx -- -- 0.1 -- -- 0.2 0.3 0.5 0.8 2.8 6.5 14.1 16.8 23.1 29.6 29.5 34.8 18.9 66
Leukemia 8.5 3.8 2.5 3.8 3.0 3.1 3.9 3.5 7.3 9.9 12.0 20.6 33.1 47.7 67.8 91.5 101.5 114.8 67 Liver & Intrahepatic Bile
Ducts 1.3 -- 0.3 0.3 0.4 0.2 0.4 1.3 2.1 6.1 18.1 39.2 52.0 49.9 51.1 63.5 65.1 47.5 64
Melanoma of Skin 0.1 0.4 1.6 3.7 6.5 7.5 12.2 18.5 26.2 42.4 54.5 76.8 109.1 142.5 160.9 153.8 67
Multiple Myeloma -- -- -- -- -- 0.3 0.2 1.2 2.6 6.2 8.2 14.0 21.3 27.5 43.1 44.2 60.2 46.7 67
Non-Hodgkin Lymphoma 1.4 1.4 1.3 2.5 4.0 2.9 5.7 9.0 12.2 16.4 24.8 36.4 50.7 73.2 96.0 118.7 157.1 146.6 66
Oral Cavity & Pharynx -- 0.2 0.1 0.4 0.6 1.4 2.1 3.5 8.6 20.6 33.9 48.0 61.6 65.1 68.2 74.2 56.4 49.1 62
Pancreas -- -- 0.1 -- 0.1 0.2 0.6 1.4 3.3 8.0 13.6 25.4 35.3 54.2 71.4 87.5 104.1 108.7 69
Prostate 0.1 -- -- -- -- -- 0.1 0.3 8.1 34.7 142.4 272.9 447.9 589.9 621.9 479.9 316.1 324.2 65
Stomach -- -- -- 0.1 -- 0.4 1.0 1.9 2.8 5.1 9.7 14.7 20.9 31.3 47.1 55.8 66.2 70.9 69
Testis 0.3 0.1 0.1 2.9 11.0 16.2 14.9 14.0 10.7 8.3 6.7 3.5 2.2 1.5 1.6 0.6 1.5 1.2 35
Thyroid 0.2 -- 0.4 1.1 3.4 6.0 9.9 13.6 15.3 16.4 17.1 22.2 22.1 23.1 24.5 23.2 19.3 8.1 54
Urinary Bladder -- -- -- 0.3 0.6 0.7 1.3 2.4 5.8 12.2 26.4 43.3 82.0 135.9 221.5 281.3 344.5 405.1 72
Other Sites 8.4 3.1 3.0 5.5 4.1 4.8 7.2 10.4 15.1 23.7 31.2 51.5 78.3 109.8 168.6 246.4 329.0 387.4 70

19
Table 2.
AGE-SPECIFIC INCIDENCE RATES1 AND MEDIAN AGE AT DIAGNOSIS FOR SELECTED CANCER SITES
Massachusetts, 2011-2015
FEMALES
1 per 100,000
2 Breast in situ is excluded from ‘All Sites’.
3 Dashes indicate age groups with no incident cases. Source: Massachusetts Cancer Registry
Cancer Site / Type 0-4 5-9 10-14 15-19 20-24 25-29 30-34 35-39 40-44 45-49 50-54 55-59 60-64 65-69 70-74 75-79 80-84 85+
Median
Age
All Sites 23.6 12.4 15.8 21.4 44.5 75.4 129.4 201.2 330.7 473.7 659.0 812.1 1090.2 1462.4 1827.6 2038.6 2079.2 1799.4 66
Brain & Other Nervous System 3.6 3.7 3.6 2.8 2.4 2.7 3.2 3.8 4.7 4.2 5.7 8.7 11.4 14.7 17.5 19.3 21.9 17.1 61
Breast -- -- 0.1 0.1 1.8 10.7 30.4 70.6 141.2 216.0 254.4 274.1 365.8 465.7 508.3 490.2 451.2 322.1 62
Breast in situ2 -- -- -- 0.2 0.2 1.1 4.9 14.0 65.1 101.8 101.3 93.3 101.9 124.3 115.1 104.5 64.6 25.8 57
Bronchus & Lung 0.1 -- 0.1 0.4 0.5 0.4 0.8 2.9 10.3 23.9 57.7 95.5 145.1 238.7 383.1 435.7 396.5 267.0 71
Cervix Uteri -- -- -- 0.1 0.4 2.6 6.7 8.9 10.4 8.9 8.4 6.7 9.0 9.6 7.5 7.3 8.7 7.4 51
Colon / Rectum 0.1 0.3 0.7 1.2 2.5 5.0 11.3 20.7 28.6 52.1 46.4 60.5 86.3 129.9 181.7 222.7 254.7 71
Corpus Uteri & Uterus, NOS -- -- 0.1 -- 0.2 1.9 2.7 9.7 14.8 26.8 52.9 81.6 112.6 135.1 124.4 96.5 84.3 52.8 63
Esophagus -- -- -- -- -- -- 0.3 -- 0.8 1.2 1.2 3.5 6.3 9.4 13.0 11.8 13.9 14.2 71
Hodgkin Lymphoma -- -- 0.9 3.4 6.0 4.3 3.9 2.9 3.0 1.4 2.4 2.8 2.9 2.5 2.8 3.4 4.5 1.7 38
Kidney & Renal Pelvis 1.9 0.8 0.3 0.3 0.3 1.3 2.6 4.2 7.1 10.0 16.3 20.8 27.2 35.7 46.4 54.1 47.2 35.1 66
Larynx -- -- -- -- -- -- -- 0.1 0.2 1.0 2.9 4.5 2.9 6.7 8.3 5.6 4.5 5.5 67
Leukemia 7.6 4.1 1.9 1.2 2.8 3.2 2.4 3.5 5.0 5.3 9.1 13.7 18.4 24.6 34.1 50.4 54.4 61.5 68
Liver & Intrahepatic Bile Ducts 0.3 -- 0.2 0.3 0.3 0.1 0.5 0.5 1.1 1.7 4.1 8.6 12.9 12.4 15.1 22.5 23.1 19.9 68
Melanoma of Skin 0.2 0.2 0.5 0.7 4.1 9.8 12.7 11.1 16.7 19.9 25.8 29.6 37.1 42.1 50.5 56.4 65.9 58.7 61
Multiple Myeloma -- -- -- -- -- 0.3 0.2 1.0 1.2 3.2 6.1 9.9 13.4 20.9 23.3 31.3 35.8 31.5 70
Non-Hodgkin Lymphoma 0.1 0.6 0.9 1.2 1.8 2.5 3.7 5.9 8.9 12.7 19.7 26.6 40.7 53.9 66.8 82.4 105.2 80.9 68
Oral Cavity & Pharynx -- -- 0.3 0.5 0.6 0.8 1.8 2.6 4.1 6.2 10.6 15.3 18.9 25.8 29.3 31.3 31.1 32.5 66
Ovary 0.2 0.1 0.5 1.1 1.5 2.4 3.7 4.5 6.2 13.8 22.3 25.4 30.5 35.4 42.4 48.3 44.7 38.9 63
Pancreas -- -- -- 0.1 0.1 -- 0.5 1.4 2.3 4.2 9.4 15.2 24.7 42.7 61.4 75.3 89.5 101.4 74
Stomach -- -- -- 0.2 0.4 0.4 0.5 1.5 3.4 4.2 4.7 7.6 9.0 12.9 19.3 24.2 33.1 35.3 71
Thyroid 0.2 0.1 1.9 4.5 17.0 24.4 40.1 43.8 49.8 54.5 52.1 48.5 46.1 47.8 41.1 36.5 24.4 12.7 50
Urinary Bladder -- -- 0.3 0.3 0.2 0.1 0.5 1.1 2.4 3.2 9.0 16.2 26.0 38.1 62.4 79.2 88.7 81.1 73
Other Sites 9.3 2.7 3.7 3.5 2.9 4.9 7.2 10 16.4 23.0 31.8 51.0 68.9 101.1 140.8 195.2 228.0 267.0 71

20
Table 3.
AGE-SPECIFIC INCIDENCE RATES1 AND MEDIAN AGE AT DIAGNOSIS FOR SELECTED CANCER SITES
Massachusetts, 2011-2015
TOTAL
1 per 100,000
2 Breast in situ is excluded from ‘All Sites’.
3 Dashes indicate age groups with no incident cases or cancers found in only one sex. Source: Massachusetts
Cancer Registry
Cancer Site / Type 0-4 5-9 10-14 15-19 20-24 25-29 30-34 35-39 40-44 45-49 50-54 55-59 60-64 65-69 70-74 75-79 80-84 85+ Median
Age
All Sites 26.1 13.1 13.8 22.5 41.5 65.3 102.2 150.9 248.2 379.6 606.9 854.4 1210.5 1639.0 2089.5 2308.9 2373.4 2122.7 66
Brain & Other Nervous System 4.4 3.7 3.1 2.8 2.4 3.8 3.6 3.7 4.6 5.1 7.1 10.0 13.8 17.4 21.9 23.7 25.5 18.5 60
Breast -- 0.1 0.1 0.0 0.9 5.4 15.5 36.1 72.7 111.1 131.2 142.9 193.2 250.1 281.9 281.5 276.7 221.6 62
Breast in situ2 -- -- -- 0.1 0.1 0.6 2.5 7.2 33.5 52.2 52.0 48.4 53.5 66.3 63.5 60.1 39.2 17.8 57
Bronchus & Lung 0.1 -- 0.1 0.3 0.5 0.5 1.1 2.8 9.0 21.6 54.2 98.7 152.3 248.5 397.4 469.5 456.3 322.9 71
Cervix Uteri -- -- -- -- -- -- -- -- -- -- -- -- -- -- -- -- -- -- --
Colon / Rectum -- 0.1 0.2 0.6 1.0 2.5 5.3 10.4 21.0 31.1 59.4 56.1 72.3 103.7 150.8 197.3 238.1 279.4 69
Corpus Uteri & Uterus, NOS -- -- -- -- -- -- -- -- -- -- -- -- -- -- -- -- -- -- --
Esophagus -- -- -- -- 0.0 0.1 0.3 0.4 1.3 3.6 5.2 11.2 17.9 22.3 31.9 29.1 31.7 26.1 68
Hodgkin Lymphoma -- 0.3 1.0 3.1 5.7 5.0 4.4 2.9 3.3 2.4 2.6 2.9 3.5 3.4 3.9 4.5 4.2 2.3 40
Kidney & Renal Pelvis 2.4 0.7 0.2 0.3 0.4 1.4 3.1 6.2 10.9 16.0 25.6 33.3 44.5 56.9 70.1 74.7 64.5 45.3 64
Larynx -- -- 0.1 -- -- 0.1 0.1 0.3 0.5 1.8 4.7 9.1 9.5 14.4 17.9 15.9 16.5 9.8 66
Leukemia 8.1 4.0 2.2 2.5 2.9 3.1 3.2 3.5 6.1 7.5 10.5 17.0 25.4 35.4 49.3 68.1 73.1 78.6 67
Liver & Intrahepatic Bile Ducts 0.8 -- 0.3 0.3 0.4 0.1 0.4 0.9 1.6 3.9 10.9 23.4 31.6 30.0 31.4 40.2 39.8 28.8 64
Melanoma of Skin 0.1 0.2 0.3 0.6 2.8 6.8 9.6 9.3 14.5 19.2 26.0 35.8 45.4 58.3 77.0 93.5 103.7 89.2 65
Multiple Myeloma -- -- -- -- -- 0.3 0.2 1.1 1.9 4.7 7.2 11.9 17.2 24.0 32.2 36.9 45.5 36.4 69
Non-Hodgkin Lymphoma 0.8 1.1 1.1 1.9 2.9 2.7 4.7 7.5 10.5 14.5 22.2 31.3 45.4 63.0 80.1 98.0 125.7 102.0 67
Oral Cavity & Pharynx -- 0.1 0.2 0.5 0.6 1.1 2.0 3.1 6.3 13.2 21.9 31.0 39.2 44.2 46.9 49.8 41.1 37.8 63
Ovary -- -- -- -- -- -- -- -- -- -- -- -- -- -- -- -- -- -- --
Pancreas -- -- 0.1 0.0 0.1 0.1 0.5 1.4 2.8 6.0 11.4 20.1 29.8 48.1 65.9 80.6 95.3 103.8 71
Prostate -- -- -- -- -- -- -- -- -- -- -- -- -- -- -- -- -- -- --
Stomach -- -- 0.1 0.1 0.2 0.4 0.8 1.7 3.1 4.6 7.1 11.0 14.6 21.5 31.9 37.8 46.2 46.7 70
Testis -- -- -- -- -- -- -- -- -- -- -- -- -- -- -- -- -- -- --
Thyroid 0.2 0.1 1.2 2.8 10.2 15.2 25.2 29.0 33.0 35.9 35.1 35.8 34.7 36.3 33.6 30.8 22.4 11.2 51
Urinary Bladder -- -- 0.2 0.3 0.4 0.4 0.9 1.7 4.1 7.6 17.5 29.2 52.7 83.9 134.4 166.3 190.1 184.9 72
Other Sites 8.9 2.9 3.4 4.5 3.5 4.8 7.2 10.2 15.7 23.4 31.5 51.3 73.4 105.2 153.5 217.3 268.0 305.7 70

21
Figure 5.
ANNUAL PERCENT CHANGE (APC) IN AGE-ADJUSTED CANCER RATES AMONG MALES
Massachusetts, 2011-2015
-1.8
-2.2
0.0
-7.8
1.1
-0.7
1.5
-0.9
-7.1
-0.6
-3.2
0.5
4.1
-6.3
-5.2
-1.7
-2.9
-1.3
-1.6
-3.1
-15 -10 -5 0 5 10 15
Urinary Bladder
Thyroid
Testis
Stomach
Prostate
Pancreas
Oral Cavity & Pharynx
Non-Hodgkin ('s) Lymphoma
Multiple Myeloma
Melanoma of Skin
Liver & Intrahepatic Bile Ducts
Leukemia
Larynx
Kidney & Renal Pelvis
Hodgkin Lymphoma
Esophagus
Colon / Rectum
Bronchus & Lung
Breast
Brain & Other Nervous System
All Sites
APC (% per year)
INCIDENCE
*
*
2.0
*
*
*
*
1.7
-1.8
NA
4.5
0.4
0.9
-1.2
-1.2
1.0
-2.6
1.0
-3.0
-4.6
6.7*
8.4^
0.3
-2.4
*-2.2
NA
3.4
*-2.4
-15 -10 -5 0 5 10 15
Urinary Bladder
Thyroid
Testis
Stomach
Prostate
Pancreas
Oral Cavity & Pharynx
Non-Hodgkin('s) Lymphoma
Multiple Myeloma
Melanoma of Skin
Liver & Intrahepatic Bile Ducts
Leukemia
Larynx
Kidney & Renal Pelvis
Hodgkin Lymphoma
Esophagus
Colon / Rectum
Bronchus & Lung
Breast
Brain & Other Nervous System
All Sites
APC (% per year)
MORTALITY
*APC is statistically significant (p < 0.05). Values appearing directly on a bar have been bolded for ease of reading only. ^ indicates a medium reliability trend (CV between 15
and 30). NA indicates an unreliable trend (CVgreater than 30) therefore the APC is not presented. Source: Massachusetts Cancer Registry

22
Figure 6.
ANNUAL PERCENT CHANGE (APC) IN AGE-ADJUSTED CANCER RATES AMONG FEMALES
Massachusetts, 2011-2015
-3.1
-0.6
4.1
3.0
-2.8
2.2
-2.1
-4.7
-4.5
2.5
-1.1
-4.0
0.5
0.7
7.3
-1.0
-1.2
1.0
-0.8
-1.7
0.2
0.3
-0.7
-15 -10 -5 0 5 10 15
Urinary Bladder
Thyroid
Stomach
Pancreas
Ovary
Oral Cavity & Pharynx
Non-Hodgkin ('s) Lymphoma
Multiple Myeloma
Melanoma of Skin
Liver & Intrahepatic Bile Ducts
Leukemia
Larynx
Kidney & Renal Pelvis
Hodgkin Lymphoma
Esophagus
Corpus Uteri & Uterus, NOS
Colon / Rectum
Cervix Uteri
Bronchus & Lung
Breast in situ
Breast
Brain & Other Nervous System
All Sites
APC (% per year)
INCIDENCE
*
*
*
-1.7
^-1.6
-0.4
1.9
-3.0
6.1
-0.2
-2.9
-2.9
3.1
-2.8
^-4.4
-1.0
NA
8.4
2.8
0.5
-6.5
-1.0
*-1.5
0.5
-1.7
-15 -10 -5 0 5 10 15
Urinary Bladder
Thyroid
Stomach
Pancreas
Ovary
Oral Cavity & Pharynx
Non-Hodgkin('s) Lymphoma
Multiple Myeloma
Melanoma of Skin
Liver & Intrahepatic Bile Ducts
Leukemia
Larynx
Kidney & Renal Pelvis
Hodgkin Lymphoma
Esophagus
Corpus Uteri & Uterus, NOS
Colon / Rectum
Cervix Uteri
Bronchus & Lung
Breast
Brain & Other Nervous System
All Sites
APC (% per year)
MORTALITY
*
*APC is statistically significant (p < 0.05). Values appearing directly on a bar have been bolded for ease of reading only. ^ indicates a medium reliability trend (CV between 15
and 30). NA indicates an unreliable trend (CVgreater than 30) therefore the APC is not presented Source: Massachusetts Cancer Registry.

23
Table 4.
ANNUAL AGE-ADJUSTED1 INCIDENCE RATES
2 FOR SELECTED CANCER SITES
Massachusetts, 2011-2015
MALES
Cancer Site / Type 2011 2012 2013 2014 2015
All Sites 538.9 500.6 483.5 480.9 470.4
Brain & Other Nervous System 7.9 7.4 9.1 7.6 7.2
Breast 1.5 1.2 1.5 1.4 1.3
Breast in situ3 0.2 0.2 0.1 0.1 0.3
Bronchus & Lung 74.5 71.2 67.1 68.6 65.5
Colon / Rectum 43.5 42.2 40.7 44.2 39.0
Esophagus 11.0 9.8 9.8 9.2 8.7
Hodgkin Lymphoma 3.6 3.6 3.1 3.1 2.8
Kidney & Renal Pelvis 20.6 20.9 23.2 23.3 23.8
Larynx 5.3 5.2 6.3 5.7 5.2
Leukemia 17.3 17.6 16.0 16.4 15.2
Liver & Intrahepatic Bile Ducts 12.4 14.2 12.5 12.5 12.8
Melanoma of Skin 29.2 25.8 25.0 22.8 21.5
Multiple Myeloma 8.0 8.2 8.9 7.5 8.0
Non-Hodgkin Lymphoma 22.6 22.9 23.6 24.0 23.8
Oral Cavity & Pharynx 18.0 18.7 16.7 18.0 17.7
Pancreas 14.3 14.3 14.8 13.9 15.3
Prostate 138.2 107.0 97.7 93.3 98.4
Stomach 9.0 8.9 10.3 10.0 8.5
Testis 6.7 6.7 6.6 6.5 6.1
Thyroid 10.8 10.4 9.3 11.4 11.4
Urinary Bladder 41.6 42.4 39.7 39.1 39.6
Rates are age-adjusted to the 2000 U.S. Standard Population. 2per 100,000 males
3Breast in situ is excluded from “All Sites”
Source: Massachusetts Cancer Registry

24
Table 5.
ANNUAL AGE-ADJUSTED1 INCIDENCE RATES
2 FOR SELECTED CANCER SITES
Massachusetts, 2011-2015
FEMALES
Cancer Site / Type 2011 2012 2013 2014 2015
All Sites 457.4 457.0 447.3 447.3 446.0
Brain & Other Nervous System 6.3 5.6 6.1 5.6 6.4
Breast 137.3 137.1 137.4 138.7 137.6
Breast in situ3 41.6 42.6 42.6 40.9 39.0
Bronchus & Lung 60.8 61.1 60.8 58.7 59.6
Cervix Uteri 5.1 5.0 4.9 5.5 5.1
Colon / Rectum 34.3 33.2 33.2 32.3 32.8
Corpus Uteri & Uterus, NOS 31.2 28.3 29.8 27.6 30.0
Esophagus 2.0 1.7 2.4 2.6 2.3
Hodgkin Lymphoma 2.7 2.6 2.4 2.8 2.7
Kidney & Renal Pelvis 10.6 10.9 10.7 10.8 10.9
Larynx 1.4 1.8 1.2 1.2 1.4
Leukemia 10.2 9.9 10.2 9.0 10.1
Liver & Intrahepatic Bile Ducts 3.3 3.8 4.1 4.1 3.6
Melanoma of Skin 18.6 17.8 16.2 15.7 15.7
Multiple Myeloma 6.0 5.2 5.3 5.0 4.8
Non-Hodgkin Lymphoma 15.8 17.9 16.9 15.9 15.1
Oral Cavity & Pharynx 6.2 7.9 7.3 6.7 7.5
Ovary 12.1 12.9 10.5 11.3 11.2
Pancreas 10.9 11.0 11.6 12.2 12.0
Stomach 4.5 4.3 4.3 5.0 5.1
Thyroid 30.7 29.7 27.0 31.4 29.0
Urinary Bladder 12.1 11.7 10.8 10.9 10.7
Rates are age-adjusted to the 2000 U.S. Standard Population. 2per 100,000 males
3Breast in situ is excluded from “All Sites”
Source: Massachusetts Cancer Registry

25
Table 6.
ANNUAL AGE-ADJUSTED1 INCIDENCE RATES
2 FOR SELECTED CANCER SITES
Massachusetts, 2011-2015
TOTAL
Cancer Site / Type 2011 2012 2013 2014 2015
All Sites 489.8 472.6 459.8 457.9 452.5
Brain & Other Nervous System 7.0 6.4 7.5 6.5 6.8
Breast -- -- -- -- --
Breast in situ3 -- -- -- -- --
Bronchus & Lung 66.4 65.0 63.2 62.6 61.8
Cervix Uteri -- -- -- -- --
Colon / Rectum 38.3 37.2 36.5 37.6 35.5
Corpus Uteri & Uterus, NOS -- -- -- -- --
Esophagus 5.9 5.3 5.7 5.5 5.2
Hodgkin Lymphoma 3.1 3.1 2.7 3.0 2.8
Kidney & Renal Pelvis 15.3 15.5 16.4 16.5 16.8
Larynx 3.2 3.3 3.5 3.2 3.1
Leukemia 13.3 13.3 12.7 12.2 12.3
Liver & Intrahepatic Bile Ducts 7.5 8.5 8.0 7.9 7.7
Melanoma of Skin 23.0 21.0 19.8 18.7 18.0
Multiple Myeloma 6.9 6.5 6.9 6.1 6.2
Non-Hodgkin Lymphoma 18.7 20.0 19.9 19.5 18.9
Oral Cavity & Pharynx 11.6 12.9 11.7 11.9 12.3
Ovary -- -- -- -- --
Pancreas 12.5 12.6 13.0 13.0 13.5
Prostate -- -- -- -- --
Stomach 6.5 6.4 6.9 7.2 6.5
Testis 3.3 3.3 3.3 3.2 3.0
Thyroid 21.0 20.3 18.5 21.7 20.4
Urinary Bladder 24.6 24.8 23.1 22.8 23.0
Rates are age-adjusted to the 2000 U.S. Standard Population. 2per 100,000 total population
3Breast in situ is excluded from “All Sites”
4Dashes indicate cancers found in only one sex or predominantly in one sex (breast cancer).
Source: Massachusetts Cancer Registry

26
Table 7.
ANNUAL AGE-ADJUSTED1 MORTALITY RATES
2 FOR SELECTED CANCER SITES
Massachusetts, 2011-2015
MALES
Cancer Site / Type 2011 2012 2013 2014 2015
All Sites 197.5 190.1 185.9 184.6 177.1
Brain & Other Nervous System 5.0 5.0 5.2 5.2 5.8
Breast 0.2 0.4 0.4 0.4 0.1
Bronchus & Lung 47.6 48.3 46.2 45.7 43.7
Colon / Rectum 14.7 14.6 13.8 14.7 13.0
Esophagus 8.3 8.4 7.5 8.1 8.6
Hodgkin Lymphoma 0.2 0.3 0.3 0.3 0.3
Kidney & Renal Pelvis 4.0 4.5 4.7 5.3 5.1
Larynx 1.7 1.2 1.4 1.5 1.2
Leukemia 8.4 8.1 9.0 7.9 7.3
Liver & Intrahepatic Bile Ducts 9.0 8.8 10.2 9.5 9.1
Melanoma of Skin 3.7 3.7 4.0 3.8 3.2
Multiple Myeloma 3.8 3.7 3.3 4.1 3.8
Non-Hodgkin Lymphoma 7.2 5.9 6.2 6.4 6.5
Oral Cavity & Pharynx 3.5 3.6 3.5 3.2 3.5
Pancreas 11.8 11.2 12.4 11.7 12.1
Prostate 17.4 17.4 17.5 17.9 17.5
Stomach 3.7 3.9 3.4 4.1 4.5
Testis 0.1 0.2 0.2 0.03 0.1
Thyroid 0.7 0.6 0.7 0.5 0.7
Urinary Bladder 7.5 7.1 7.7 7.6 7.9
1 Rates are age-adjusted to the 2000 U.S. Standard Population.
2 per 100,000 males
Source: Massachusetts Vital Statistics

27
Table 8
ANNUAL AGE-ADJUSTED1 MORTALITY RATES
2 FOR SELECTED CANCER SITES
Massachusetts, 2011-2015
FEMALES
Cancer Site / Type 2011 2012 2013 2014 2015
All Sites 139.4 138.6 136.2 130.1 131.8
Brain & Other Nervous System 3.6 3.4 3.4 3.4 3.7
Breast 18.1 18.2 17.6 17.3 17.2
Bronchus & Lung 35.7 35.9 34.5 34.5 34.6
Cervix Uteri 1.4 1.2 0.9 1.2 1.0
Colon / Rectum 9.9 10.6 11.0 10.1 10.4
Corpus Uteri & Uterus, NOS 4.3 3.9 4.8 4.3 4.7
Esophagus 1.4 1.4 1.2 1.9 1.8
Hodgkin Lymphoma 0.2 0.2 0.2 0.1 0.2
Kidney & Renal Pelvis 2.2 2.0 2.0 1.8 2.2
Larynx 0.5 0.3 0.4 0.3 0.4
Leukemia 4.7 4.9 5.0 4.2 4.4
Liver & Intrahepatic Bile Ducts 3.0 3.2 3.7 3.6 3.3
Melanoma of Skin 1.8 1.8 2.1 1.7 1.6
Multiple Myeloma 2.5 2.7 2.6 2.6 2.2
Non-Hodgkin Lymphoma 4.1 4.0 4.3 4.1 4.0
Oral Cavity & Pharynx 1.1 1.0 1.2 1.3 1.3
Ovary 7.8 6.7 7.6 6.5 6.8
Pancreas 9.4 9.3 8.9 9.5 10.2
Stomach 2.1 2.3 2.4 2.2 2.1
Thyroid 0.5 0.3 0.5 0.4 0.4
Urinary Bladder 2.3 2.5 2.6 2.1 2.3
1 Rates are age-adjusted to the 2000 U.S. Standard Population.
2 per 100,000 females
Source: Massachusetts Vital Statistics

28
Table 9.
ANNUAL AGE-ADJUSTED1 MORTALITY RATES
2 FOR SELECTED CANCER SITES
Massachusetts, 2011-2015
TOTAL3
Cancer Site / Type 2011 2012 2013 2014 2015
All Sites 162.7 159.6 156.4 152.4 150.0
Brain & Other Nervous System 4.3 4.1 4.2 4.2 4.7
Breast - - - - -
Bronchus & Lung 40.7 41.1 39.3 39.2 38.3
Cervix Uteri - - - - -
Colon / Rectum 12.0 12.3 12.2 12.1 11.6
Corpus Uteri & Uterus, NOS - - - - -
Esophagus 4.4 4.5 4.0 4.6 4.8
Hodgkin Lymphoma 0.2 0.2 0.2 0.2 0.2
Kidney & Renal Pelvis 3.0 3.1 3.2 3.4 3.5
Larynx 1.0 0.7 0.8 0.8 0.8
Leukemia 6.2 6.2 6.7 5.7 5.7
Liver & Intrahepatic Bile Ducts 5.7 5.7 6.7 6.2 5.8
Melanoma of Skin 2.6 2.6 2.9 2.6 2.3
Multiple Myeloma 3.1 3.2 2.9 3.2 2.9
Non-Hodgkin Lymphoma 5.4 4.8 5.1 5.1 5.1
Oral Cavity & Pharynx 2.2 2.2 2.3 2.2 2.3
Ovary - - - - -
Pancreas 10.5 10.2 10.5 10.5 11.1
Prostate - - - - -
Stomach 2.8 3.0 2.8 3.0 3.1
Testis - - - - -
Thyroid 0.6 0.4 0.6 0.4 0.5
Urinary Bladder 4.4 4.3 4.7 4.3 4.5
1 Rates are age-adjusted to the 2000 U.S. Standard Population.
2 per 100,000 total population
3Dashes indicate cancers found in only one sex or predominantly in one sex (breast cancer).

29
Table 10.
FIVE LEADING CANCER INCIDENCE RATES BY RACE/ETHNICITY AND SEX
Massachusetts, 2011-2015
MALES
AGE-ADJUSTED1 INCIDENCE RATE
2
RANK White, non-Hispanic Black, non-Hispanic Asian, non-Hispanic Hispanic
1
Prostate
100.2
Prostate
182.5
Bronchus & Lung
57.7
Prostate
107.5
2
Bronchus & Lung
71.2
Bronchus & Lung
64.8
Prostate
56.5
Bronchus & Lung
38.9
3
Urinary Bladder
42.9
Colon / Rectum
46.9
Colon / Rectum
32.4
Colon / Rectum
35.3
4
Colon / Rectum
41.9
Kidney and Renal
Pelvis
21.8
Liver and Intrahepatic
Bile Ducts
25.9
Liver and
Intrahepatic Bile
Ducts
21.8
5
Melanoma of Skin
27.3
Liver and Intrahepatic
Bile Ducts
19.4
Urinary Bladder
14.6
Non-Hodgkin
Lymphoma
20.1
FEMALES
AGE-ADJUSTED1 INCIDENCE RATE
2
RANK White, non-Hispanic Black, non-Hispanic Asian, non-Hispanic Hispanic
1
Breast
143.7
Breast
121.5
Breast
90.8
Breast
90.0
2
Bronchus & Lung
63.8
Bronchus & Lung
43.3
Bronchus & Lung
33.1
Thyroid
28.5
3
Colon / Rectum
33.3
Colon / Rectum
35.4
Thyroid
29.6
Bronchus & Lung
27.8
4
Corpus Uteri &
Uterus, NOS
30.4
Corpus Uteri &
Uterus, NOS
26.7
Colon / Rectum
28.4
Colon / Rectum
25.3
5
Thyroid
29.7
Thyroid
22.8 Corpus Uteri &
Uterus, NOS
15.4
Corpus Uteri &
Uterus, NOS
21.2
1 Rates are age-adjusted to the 2000 U.S. Standard Population.
2 per 100,000
3Breast cancer rates do not include in situ cases.
Source: Massachusetts Cancer Registry

30
Table 11.
NUMBER AND PERCENTAGE OF INCIDENT CASES FOR SELECTED CANCER SITES BY RACE/ETHNICITY1
Massachusetts, 2011-2015
MALES
All Races2 White, non-Hispanic Black, non-Hispanic Asian, non-Hispanic Hispanic
Cancer Site / Type Cases % of Cases Cases % of Cases Cases % of Cases Cases % of Cases Cases % of Cases
All Sites 87884 100.0 76121 100.0 4535 100.0 2216 100.0 3344 100.0
Brain & Other Nervous System 1347 1.5 1193 1.6 46 1.0 32 1.4 65 1.9
Breast3 242 0.3 210 0.3 12 0.3 11 0.5 9 0.3
Bronchus & Lung 11999 13.7 10799 14.2 503 11.1 364 16.4 281 8.4
Colon / Rectum 7291 8.3 6282 8.3 404 8.9 233 10.5 292 8.7
Esophagus 1747 2.0 1618 2.1 58 1.3 35 1.6 26 0.8
Hodgkin Lymphoma 547 0.6 445 0.6 32 0.7 17 0.8 48 1.4
Kidney & Renal Pelvis 4028 4.6 3506 4.6 198 4.4 80 3.6 189 5.7
Larynx 1013 1.2 896 1.2 41 0.9 6 0.3 56 1.7
Leukemia 2793 3.2 2441 3.2 111 2.4 72 3.2 104 3.1
Liver & Intrahepatic Bile Ducts 2436 2.8 1823 2.4 196 4.3 190 8.6 199 6.0
Melanoma of Skin 4305 4.9 4047 5.3 8 0.2 10 0.5 16 0.5
Multiple Myeloma 1429 1.6 1188 1.6 120 2.6 33 1.5 70 2.1
Non-Hodgkin Lymphoma 4045 4.6 3543 4.7 167 3.7 95 4.3 193 5.8
Oral Cavity & Pharynx 3327 3.8 2931 3.9 129 2.8 111 5.0 128 3.8
Pancreas 2556 2.9 2277 3.0 131 2.9 54 2.4 76 2.3
Prostate 20389 23.2 16641 21.9 1694 37.4 385 17.4 923 27.6
Stomach 1624 1.8 1266 1.7 138 3.0 83 3.7 111 3.3
Testis 1045 1.2 931 1.2 17 0.4 19 0.9 60 1.8
Thyroid 1851 2.1 1564 2.1 60 1.3 104 4.7 80 2.4
Urinary Bladder 6872 7.8 6422 8.4 136 3.0 89 4.0 141 4.2
Other Sites 6998 8.0 6098 8.0 334 7.4 193 8.7 277 8.3
1 Race/ethnicity categories are mutually exclusive. Cases are only included in one race/ethnicity category.
2 The number of cases for all races is not the sum of cases by race/ethnicity.
3Breast in situ cases are excluded from ‘All Sites’ and breast cancer counts.
Source: Massachusetts Cancer Registry

31
Table 12.
NUMBER AND PERCENTAGE OF INCIDENT CASES FOR SELECTED CANCER SITES BY RACE/ETHNICITY1
Massachusetts, 2011-2015
FEMALES
All Races2 White, non-Hispanic Black, non-Hispanic Asian, non-Hispanic Hispanic
Cancer Site / Type Cases % of Cases Cases % of Cases Cases % of Cases Cases % of Cases Cases % of Cases
All Sites 95757 100.0 83467 100.0 4522 100.0 2760 100.0 3904 100.0
Brain & Other Nervous System 1169 1.2 1004 1.2 49 1.1 43 1.6 64 1.6
Breast3 28737 30.0 25182 30.2 1391 30.8 871 31.6 1117 28.6
Bronchus & Lung 13239 13.8 12182 14.6 475 10.5 257 9.3 268 6.9
Cervix Uteri 949 1.0 658 0.8 93 2.1 72 2.6 119 3.0
Colon / Rectum 7284 7.6 6313 7.6 399 8.8 235 8.5 273 7.0
Corpus Uteri & Uterus, NOS 6463 6.7 5673 6.8 309 6.8 144 5.2 261 6.7
Esophagus 493 0.5 445 0.5 22 0.5 9 0.3 14 0.4
Hodgkin Lymphoma 472 0.5 385 0.5 22 0.5 12 0.4 51 1.3
Kidney & Renal Pelvis 2281 2.4 1975 2.4 129 2.9 41 1.5 111 2.8
Larynx 316 0.3 284 0.3 17 0.4 3 0.1 8 0.2
Leukemia 2064 2.2 1763 2.1 81 1.8 65 2.4 106 2.7
Liver & Intrahepatic Bile Ducts 847 0.9 646 0.8 59 1.3 70 2.5 61 1.6
Melanoma of Skin 3452 3.6 3197 3.8 12 0.3 6 0.2 38 1.0
Multiple Myeloma 1182 1.2 914 1.1 150 3.3 19 0.7 86 2.2
Non-Hodgkin Lymphoma 3536 3.7 3046 3.6 153 3.4 88 3.2 193 4.9
Oral Cavity & Pharynx 1552 1.6 1350 1.6 59 1.3 59 2.1 65 1.7
Ovary 2477 2.6 2159 2.6 107 2.4 88 3.2 91 2.3
Pancreas 2636 2.8 2323 2.8 140 3.1 67 2.4 83 2.1
Stomach 1027 1.1 766 0.9 94 2.1 74 2.7 83 2.1
Thyroid 5440 5.7 4266 5.1 274 6.1 315 11.4 432 11.1
Urinary Bladder 2526 2.6 2340 2.8 76 1.7 18 0.7 54 1.4
Other Sites 7615 8.0 6596 7.9 411 9.1 204 7.4 326 8.4
1 Race/ethnicity categories are mutually exclusive. Cases are only included in one race/ethnicity category.
2 The number of cases for all races is not the sum of cases by race/ethnicity.
3Breast in situ cases are excluded from ‘All Sites’ and from breast cancer counts.
Source: Massachusetts Cancer Registry
32
Table 13.
NUMBER AND PERCENTAGE OF INCIDENT CASES FOR SELECTED CANCER SITES BY RACE/ETHNICITY1
Massachusetts, 2011-2015
TOTAL2
All Races3 White, non-Hispanic Black, non-Hispanic Asian, non-Hispanic Hispanic
Cancer Site / Type Cases % of Cases Cases % of Cases Cases % of Cases Cases % of Cases Cases % of Cases
All Sites 183661 100.0 159603 100.0 9059 100.0 4977 100.0 7248 100.0
Brain & Other Nervous System 2517 1.4 2198 1.4 95 1.0 75 1.5 129 1.8
Breast4 28980 15.8 25393 15.9 1403 15.5 882 17.7 1126 15.5
Bronchus & Lung 25241 13.7 22983 14.4 978 10.8 621 12.5 549 7.6
Cervix Uteri 949 0.5 658 0.4 93 1.0 72 1.4 119 1.6
Colon / Rectum 14576 7.9 12596 7.9 803 8.9 468 9.4 565 7.8
Corpus Uteri & Uterus, NOS 6464 3.5 5674 3.6 309 3.4 144 2.9 261 3.6
Esophagus 2240 1.2 2063 1.3 80 0.9 44 0.9 40 0.6
Hodgkin Lymphoma 1020 0.6 831 0.5 54 0.6 29 0.6 99 1.4
Kidney & Renal Pelvis 6310 3.4 5482 3.4 327 3.6 121 2.4 300 4.1
Larynx 1329 0.7 1180 0.7 58 0.6 9 0.2 64 0.9
Leukemia 4857 2.6 4204 2.6 192 2.1 137 2.8 210 2.9
Liver & Intrahepatic Bile Ducts 3284 1.8 2469 1.5 255 2.8 261 5.2 260 3.6
Melanoma of Skin 7758 4.2 7245 4.5 20 0.2 16 0.3 54 0.7
Multiple Myeloma 2611 1.4 2102 1.3 270 3.0 52 1.0 156 2.2
Non-Hodgkin Lymphoma 7583 4.1 6590 4.1 321 3.5 183 3.7 386 5.3
Oral Cavity & Pharynx 4879 2.7 4281 2.7 188 2.1 170 3.4 193 2.7
Ovary 2478 1.3 2160 1.4 107 1.2 88 1.8 91 1.3
Pancreas 5192 2.8 4600 2.9 271 3.0 121 2.4 159 2.2
Prostate 20389 11.1 16641 10.4 1694 18.7 385 7.7 923 12.7
Stomach 2651 1.4 2032 1.3 232 2.6 157 3.2 194 2.7
Testis 1045 0.6 931 0.6 17 0.2 19 0.4 60 0.8
Thyroid 7292 4.0 5830 3.7 335 3.7 419 8.4 512 7.1
Urinary Bladder 9399 5.1 8763 5.5 212 2.3 107 2.1 195 2.7
Other Sites 14617 8.0 12697 8.0 745 8.2 397 8.0 603 8.3
1 Race/ethnicity categories are mutually exclusive. Cases are only included in one race/ethnicity category.
2Total includes persons classified as a transsexual and persons of unknown sex.
3The number of cases for all races is not the sum of cases by race/ethnicity.
4 Breast in situ cases are excluded from ‘All Sites’ and from breast cancer counts. Source: Massachusetts Cancer Registry

33
Table 14.
AGE-ADJUSTED1 INCIDENCE RATES
2 AND 95% CONFIDENCE LIMITS (95% CL)
FOR SELECTED CANCER SITES BY RACE/ETHNICITY3
Massachusetts, 2011-2015
MALES
All Races White, non-Hispanics Black, non-Hispanics Asian, non-Hispanics Hispanics
Cancer Site / Type Rates 95% CL Rates 95% CL Rates 95% CL Rates 95% CL Rates 95% CL
All Sites 493.9 490.6-497.3 498.2 494.5-501.8 514.6 498.4-530.7 312.4 298.6-326.2 376.6 362.0-391.1
Brain & Other Nervous System 7.9 7.4-8.3 8.5 8.0-9.0 4.5 3.1-5.9 3.5 2.3-4.8 4.9 3.5-6.4
Breast 1.4 1.2-1.6 1.4 1.2-1.6 * * * * * *
Breast in situ4 0.2 0.1-0.2 0.2 0.1-0.2 * * * * * *
Bronchus & Lung 69.3 68.0-70.6 71.2 69.8-72.5 64.8 58.7-70.9 57.7 51.5-64.0 38.9 33.9-44.0
Colon / Rectum 41.8 40.9-42.8 41.9 40.9-43.0 46.9 41.9-51.8 32.4 28.0-36.8 35.3 30.6-40.1
Esophagus 9.7 9.2-10.1 10.3 9.8-10.8 6.8 4.9-8.7 5.2 3.3-7.0 3.5 2.0-4.9
Hodgkin Lymphoma 3.2 3.0-3.5 3.4 3.1-3.8 2.8 1.8-3.8 * * 3.5 2.2-4.8
Kidney & Renal Pelvis 22.4 21.7-23.1 23.0 22.2-23.8 21.8 18.6-25.1 10.3 7.9-12.7 18.7 15.7-21.7
Larynx 5.5 5.2-5.9 5.6 5.3-6.0 4.8 3.3-6.4 * * 6.3 4.5-8.2
Leukemia 16.5 15.9-17.1 17.0 16.3-17.7 12.4 9.9-15.0 9.5 7.1-11.8 10.0 7.6-12.3
Liver & Intrahepatic Bile Ducts 12.9 12.4-13.4 11.2 10.7-11.7 19.4 16.5-22.3 25.9 22.0-29.7 21.8 18.4-25.2
Melanoma of Skin 24.8 24.0-25.6 27.3 26.4-28.1 * * * * * *
Multiple Myeloma 8.1 7.7-8.5 7.8 7.3-8.2 14.5 11.7-17.3 4.4 2.8-5.9 7.4 5.5-9.3
Non-Hodgkin Lymphoma 23.4 22.6-24.1 23.9 23.1-24.7 17.6 14.7-20.4 12.5 9.8-15.2 20.1 16.8-23.4
Oral Cavity & Pharynx 17.8 17.2-18.4 18.3 17.6-19.0 14.2 11.6-16.8 13.9 11.2-16.6 14.3 11.5-17.1
Pancreas 14.5 13.9-15.1 14.8 14.2-15.4 16.3 13.3-19.3 7.9 5.7-10.2 9.5 7.0-11.9
Prostate 106.3 104.8-107.8 100.2 98.6-101.7 182.5 173.3-191.8 56.5 50.6-62.4 107.5 99.9-115.1
Stomach 9.3 8.9-9.8 8.4 7.9-8.8 17.8 14.6-21.1 12.2 9.4-14.9 13.9 10.9-16.8
Testis 6.5 6.1-6.9 8.0 7.4-8.5 * * * * 3.1 2.3-4.0
Thyroid 10.6 10.2-11.1 11.2 10.6-11.8 6.1 4.5-7.7 10.7 8.6-12.9 6.5 4.9-8.1
Urinary Bladder 40.4 39.4-41.4 42.9 41.8-43.9 18.1 14.8-21.3 14.6 11.3-17.8 19.2 15.6-22.7
1 Rates are age-adjusted to the 2000 U.S. Standard Population.
2 per 100,000
3 Race/ethnicity categories are mutually exclusive. Cases are only included in one race/ethnicity category.
4 Breast in situ is excluded from ‘All Sites’.
*An age-adjusted incidence rate was not calculated when there were fewer than 20 cases.
Source: Massachusetts Cancer Registry

34
Table 15.
AGE-ADJUSTED1 INCIDENCE RATES
2 AND 95% CONFIDENCE LIMITS (95% CL)
FOR SELECTED CANCER SITES BY RACE/ETHNICITY3
Massachusetts, 2011-2015
FEMALES
All Races White, non-Hispanics Black, non-Hispanics Asian, non-Hispanics Hispanics
Cancer Site / Type Rates 95% CL Rates 95% CL Rates 95% CL Rates 95% CL Rates 95% CL
All Sites 450.9 448.0-453.8 464.5 461.2-467.8 399.1 387.3-410.9 307.2 295.3-319.1 327.0 315.9-338.0
Brain & Other Nervous System 6.0 5.6-6.3 6.3 5.9-6.7 4.2 3.0-5.3 4.4 3.1-5.8 4.8 3.5-6.1
Breast 137.6 136.0-139.3 143.7 141.9-145.6 121.5 115.0-128.0 90.8 84.6-97.0 90.0 84.4-95.6
Breast in situ4 41.4 40.5-42.3 43.3 42.3-44.4 38.0 34.4-41.6 31.4 27.8-35.0 28.6 25.5-31.6
Bronchus & Lung 60.2 59.1-61.2 63.8 62.6-64.9 43.3 39.3-47.3 33.1 28.9-37.3 27.8 24.3-31.3
Cervix Uteri 5.1 4.8-5.5 4.6 4.2-4.9 8.2 6.5-9.8 7.1 5.4-8.8 9.5 7.6-11.3
Colon / Rectum 33.1 32.3-33.9 33.3 32.5-34.2 35.4 31.9-39.0 28.4 24.6-32.1 25.3 22.1-28.5
Corpus Uteri & Uterus, NOS 29.4 28.7-30.1 30.4 29.6-31.2 26.7 23.7-29.8 15.4 12.8-18.0 21.2 18.5-23.9
Esophagus 2.2 2.0-2.4 2.2 2.0-2.5 1.9 1.1-2.7 * * * *
Hodgkin Lymphoma 2.6 2.4-2.9 2.8 2.6-3.1 1.7 1.0-2.5 * * 3.3 2.3-4.3
Kidney & Renal Pelvis 10.8 10.3-11.2 11.0 10.5-11.5 11.1 9.2-13.1 4.9 3.3-6.5 9.1 7.2-10.9
Larynx 1.4 1.3-1.6 1.5 1.3-1.7 * * * * * *
Leukemia 9.9 9.4-10.3 10.0 9.5-10.5 7.0 5.4-8.5 6.9 5.1-8.6 8.3 6.6-10.1
Liver & Intrahepatic Bile Ducts 3.8 3.5-4.0 3.3 3.0-3.6 5.0 3.7-6.3 9.2 7.0-11.5 6.4 4.7-8.1
Melanoma of Skin 16.8 16.2-17.3 19.0 18.3-19.7 * * * * 3.0 1.9-4.0
Multiple Myeloma 5.3 5.0-5.6 4.6 4.3-5.0 13.7 11.5-16.0 2.4 1.3-3.5 8.1 6.3-10.0
Non-Hodgkin Lymphoma 16.3 15.8-16.9 16.4 15.8-17.0 13.4 11.2-15.6 10.2 8.0-12.4 17.3 14.6-19.9
Oral Cavity & Pharynx 7.1 6.8-7.5 7.2 6.8-7.6 4.9 3.6-6.2 6.9 5.1-8.7 5.8 4.3-7.3
Ovary 11.6 11.1-12.1 12.0 11.5-12.5 9.1 7.3-10.8 9.4 7.4-11.5 7.0 5.5-8.5
Pancreas 11.5 11.1-12.0 11.6 11.1-12.1 12.9 10.8-15.1 9.0 6.8-11.3 8.0 6.1-9.8
Stomach 4.7 4.4-5.0 3.9 3.7-4.2 8.8 7.0-10.6 9.2 7.0-11.3 7.4 5.7-9.1
Thyroid 29.6 28.7-30.4 29.7 28.8-30.7 22.8 20.0-25.5 29.6 26.3-33.0 28.5 25.7-31.4
Urinary Bladder 11.2 10.8-11.7 12.0 11.5-12.5 7.3 5.6-8.9 * * 5.4 3.8-6.9
1 Rates are age-adjusted to the 2000 U.S. Standard Population.
2 per 100,000
3 Race/ethnicity categories are mutually exclusive. Cases are only included in one race/ethnicity category.
4 Breast in situ cases are excluded from ‘All Sites’.
* An age-adjusted incidence rate was not calculated when there were fewer than 20 cases.
Source: Massachusetts Cancer Registry

35
Table 16.
AGE-ADJUSTED1 INCIDENCE RATES
2 AND 95% CONFIDENCE LIMITS (95% CL)
FOR SELECTED CANCER SITES BY RACE/ETHNICITY3
Massachusetts, 2011-2015
TOTAL
All Races White, non-Hispanics Black, non-Hispanics Asian, non-Hispanics Hispanics
Cancer Site / Type Rates 95% CL Rates 95% CL Rates 95% CL Rates 95% CL Rates 95% CL
All Sites 466.1 463.9-468.2 475.2 472.8-477.6 445.3 435.8-454.8 307.9 298.9-316.9 345.4 336.7-354.2
Brain & Other Nervous System 6.8 6.6-7.1 7.3 7.0-7.6 4.3 3.4-5.2 4.0 3.1-5.0 4.9 3.9-5.9
Breast --5 -- -- -- -- -- -- -- -- --
Breast in situ4 -- -- -- -- -- -- -- -- -- --
Bronchus & Lung 63.8 63.0-64.6 66.6 65.7-67.4 51.6 48.2-54.9 44.1 40.5-47.7 32.4 29.5-35.3
Cervix Uteri -- -- -- -- -- -- -- -- -- --
Colon / Rectum 37.0 36.4-37.6 37.1 36.5-37.8 40.0 37.2-42.9 30.2 27.3-33.1 29.4 26.7-32.1
Corpus Uteri & Uterus, NOS -- -- -- -- -- -- -- -- -- --
Esophagus 5.5 5.3-5.8 5.9 5.6-6.1 4.0 3.1-4.9 2.9 2.0-3.8 2.2 1.5-3.0
Hodgkin Lymphoma 2.9 2.7-3.1 3.1 2.9-3.3 2.3 1.6-2.9 1.2 0.7-1.7 3.3 2.6-4.1
Kidney & Renal Pelvis 16.1 15.7-16.5 16.5 16.1-17.0 15.7 13.9-17.5 7.4 6.0-8.8 13.3 11.6-14.9
Larynx 3.3 3.1-3.4 3.3 3.2-3.5 2.9 2.1-3.7 * * 3.1 2.3-3.9
Leukemia 12.8 12.4-13.1 13.1 12.6-13.5 9.1 7.8-10.5 8.0 6.6-9.4 9.0 7.6-10.4
Liver & Intrahepatic Bile Ducts 7.9 7.7-8.2 6.9 6.6-7.2 11.5 10.0-12.9 17.0 14.8-19.1 13.2 11.4-14.9
Melanoma of Skin 20.0 19.6-20.5 22.4 21.8-22.9 1.0 0.6-1.5 * * 2.4 1.7-3.1
Multiple Myeloma 6.5 6.3-6.8 6.0 5.8-6.3 14.1 12.3-15.8 3.3 2.4-4.3 7.9 6.6-9.2
Non-Hodgkin Lymphoma 19.4 19.0-19.9 19.7 19.2-20.2 15.3 13.6-17.1 11.3 9.5-13.0 18.5 16.5-20.6
Oral Cavity & Pharynx 12.1 11.7-12.4 12.4 12.0-12.8 8.9 7.6-10.2 10.2 8.6-11.8 9.5 8.0-11.0
Ovary -- -- -- -- -- -- -- -- -- --
Pancreas 12.9 12.5-13.3 13.1 12.7-13.5 14.6 12.8-16.4 8.5 6.9-10.1 8.6 7.1-10.0
Prostate -- -- -- -- -- -- -- -- -- --
Stomach 6.7 6.4-7.0 5.9 5.6-6.1 12.4 10.8-14.1 10.6 8.8-12.3 10.1 8.5-11.7
Testis -- -- -- -- -- -- -- -- -- --
Thyroid 20.4 19.9-20.9 20.7 20.1-21.2 15.0 13.4-16.7 20.7 18.6-22.7 18.2 16.5-19.8
Urinary Bladder 23.6 23.1-24.1 25.2 24.6-25.7 11.6 10.0-13.2 7.8 6.2-9.3 11.1 9.4-12.8
1 Rates are age-adjusted to the 2000 U.S. Standard Population.
2 per 100,000
3 Race/ethnicity categories are mutually exclusive. Cases are only included in one race/ethnicity category.
4 Breast in situ cases are excluded from ‘All Sites’.
5 Dashes indicate cancers found in only one sex or predominantly in one sex (breast cancer). * An age-adjusted incidence rate was not calculated when there
were fewer than 20 cases. Source: Massachusetts Cancer Registry

36
Table 17.
FIVE LEADING CANCER MORTALITY RATES BY RACE/ETHNICITY AND SEX
Massachusetts, 2011-2015
MALES
AGE-ADJUSTED1 MORTALITY RATE
2
RANK White, non-Hispanic Black, non-Hispanic Asian, non-Hispanic Hispanic
1 Bronchus & Lung
50.0
Bronchus & Lung
46.6
Bronchus & Lung
35.4
Bronchus & Lung
23.3
2 Prostate
17.9
Prostate
36.3
Liver & Intrahepatic
Bile Duct
14.4
Prostate
15.5
3 Colon/Rectum
15.0
Colon/Rectum
16.0
Colon/Rectum
9.2
Liver & Intrahepatic
Bile Duct
12.9
4 Pancreas
12.7
Liver & Intrahepatic
Bile Duct
14.5
Prostate
7.2
Colon/Rectum
9.9
5 Esophagus
9.1
Pancreas
12.7
Pancreas
5.7
Stomach
8.1
FEMALES
AGE-ADJUSTED1 MORTALITY RATE
2
RANK White, non-Hispanic Black, non-Hispanic Asian, non-Hispanic Hispanic
1 Bronchus & Lung
38.5
Bronchus & Lung
28.0
Bronchus & Lung
18.3
Bronchus & Lung
12.0
2 Breast
18.7 Breast
20.6
Colon/Rectum
8.9
Breast
10.7
3 Colon/Rectum
10.6
Colon/Rectum
12.8
Breast
7.6 Colon/Rectum
9.0
4 Pancreas
10.0
Pancreas
9.5
Pancreas
7.6
Pancreas
5.0
5 Ovary
7.8
Corpus Uteri & Uterus,
NOS
8.6
Liver & Intrahepatic
Bile Duct
5.3
Non-Hodgkin
Lymphoma
4.5
1 Rates are age-adjusted to the 2000 U.S. Standard Population.
2 per 100,000
Source: Massachusetts Vital Statistics

37
Table 18.
NUMBER AND PERCENTAGE OF DEATHS FOR SELECTED CANCER SITES BY RACE/ETHNICITY1
Massachusetts, 2011-2015
MALES
All Races2 White, non-Hispanic Black, non-Hispanic Asian, non-Hispanic Hispanic
Cancer Site / Type Deaths % of Deaths Deaths % of Deaths Deaths % of Deaths Deaths % of Deaths Deaths % of Deaths
All Sites 32,392 100.0 29105 100.0 1469 100.0 747 100.0 905 100.0
Brain & Other Nervous System 945 2.9 873 3.0 28 2.0 13 1.7 25 2.8
Breast 59 0.2 57 0.2 1 0.1 1 0.1 0 0.0
Bronchus & Lung 8409 26.0 7657 26.3 345 23.5 210 28.1 166 18.3
Colon / Rectum 2544 7.8 2278 7.8 129 8.8 60 8.0 63 7.0
Esophagus 1544 4.8 1444 5.0 45 3.1 23 3.1 23 2.5
Hodgkin Lymphoma 48 0.2 37 0.1 2 0.1 2 0.3 7 0.8
Kidney & Renal Pelvis 879 2.7 807 2.8 36 2.5 9 1.2 25 2.8
Larynx 263 0.8 232 0.8 11 0.7 5 0.7 12 1.3
Leukemia 1409 4.3 1283 4.4 45 3.1 27 3.6 45 5.0
Liver & Intrahepatic Bile Ducts 1809 5.6 1416 4.9 137 9.3 132 17.7 112 12.4
Melanoma of Skin 666 2.1 649 2.2 6 0.4 1 0.1 5 0.5
Multiple Myeloma 663 2.0 568 2.0 53 3.6 13 1.7 26 2.9
Non-Hodgkin Lymphoma 1128 3.5 1027 3.5 37 2.5 20 2.7 35 3.9
Oral Cavity & Pharynx 666 2.1 576 2.0 35 2.4 21 2.8 28 3.1
Pancreas 2181 6.7 1978 6.8 94 6.4 37 5.0 60 6.6
Prostate 3005 9.3 2651 9.1 217 14.8 34 4.5 87 9.6
Stomach 705 2.2 545 1.9 52 3.5 39 5.2 63 7.0
Testis 24 0.1 23 0.1 0 0.0 0 0.0 1 0.1
Thyroid 114 0.3 104 0.4 3 0.2 2 0.3 4 0.4
Urinary Bladder 1318 4.1 1258 4.3 30 2.0 10 1.6 14 1.5
Other Sites 4013 12.4 3642 12.5 163 11.1 88 11.8 104 11.5
1 Race/ethnicity categories are mutually exclusive. Deaths are only included in one race/ethnicity category.
2 The number of deaths for all races is not the sum of deaths by race/ethnicity.
Source: Massachusetts Vital Statistics

38
Table 19.
NUMBER AND PERCENTAGE OF DEATHS FOR SELECTED CANCER SITES BY RACE/ETHNICITY1
Massachusetts, 2011-2015
FEMALES
All Races2 White, non-Hispanic Black, non-Hispanic Asian, non-Hispanic Hispanic
Cancer Site / Type Deaths % of Deaths Deaths % of Deaths Deaths % of Deaths Deaths % of Deaths Deaths % of Deaths
All Sites 31,705 100.0 28,599 100.0 1478 100.0 623 100.0 860 2.7
Brain & Other Nervous System 757 2.4 692 2.4 21 1.4 20 3.2 23 2.7
Breast 4178 13.2 3730 13.0 231 15.6 69 11.1 123 14.3
Bronchus & Lung 8327 26.2 7746 27.1 303 20.5 137 22.0 114 13.3
Cervix Uteri 253 0.8 195 0.7 26 1.8 7 1.1 21 2.4
Colon / Rectum 2591 8.2 2286 8.0 142 9.6 66 10.6 85 9.9
Corpus Uteri & Uterus, NOS 1078 3.4 913 3.2 96 6.5 22 3.5 39 4.5
Esophagus 382 1.2 350 1.2 12 0.8 7 1.1 11 1.3
Hodgkin Lymphoma 45 0.1 40 0.1 0 0.0 1 0.2 3 0.3
Kidney & Renal Pelvis 511 1.6 478 1.7 14 0.9 2 0.3 13 1.5
Larynx 92 0.3 85 0.3 2 0.1 1 0.2 3 0.3
Leukemia 1110 3.5 997 3.5 52 3.5 17 2.7 41 4.8
Liver & Intrahepatic Bile Ducts 809 2.5 675 2.4 44 3.0 43 6.9 43 5.0
Melanoma of Skin 422 1.3 413 1.4 2 0.1 2 0.3 4 0.5
Multiple Myeloma 640 2.0 544 1.9 66 4.5 4 0.6 23 2.7
Non-Hodgkin Lymphoma 1015 3.2 921 3.2 33 2.2 22 3.5 37 4.3
Oral Cavity & Pharynx 300 0.9 269 0.9 10 0.7 9 1.4 10 1.2
Ovary 1689 5.3 1552 5.4 74 5.0 26 4.2 29 3.4
Pancreas 2346 7.4 2125 7.4 103 7.0 55 8.8 53 6.2
Stomach 534 1.7 419 1.5 42 2.8 33 5.3 36 4.2
Thyroid 105 0.3 86 0.3 7 0.5 3 0.5 9 1.1
Urinary Bladder 612 1.9 581 2.0 20 1.4 4 0.6 6 0.7
Other Sites 3909 12.3 3502 12.2 178 12.0 73 11.7 134 15.6
1 Race/ethnicity categories are mutually exclusive. Deaths are only included in one race/ethnicity category.
2 The number of deaths for all races is not the sum of deaths by race/ethnicity.
Source: Massachusetts Vital Statistics

39
Table 20.
NUMBER AND PERCENTAGE OF DEATHS FOR SELECTED CANCER SITES BY RACE/ETHNICITY1
Massachusetts, 2011-2015
TOTAL
All Races2 White, non-Hispanic Black, non-Hispanic Asian, non-Hispanic Hispanic
Cancer Site / Type Deaths % of Deaths Deaths % of Deaths Deaths % of Deaths Deaths % of Deaths Deaths % of Deaths
All Sites 64097 100.0 57707 100.0 2947 100.0 1370 110.0 1765 100.0
Brain & Other Nervous System 1702 2.7 1565 2.7 49 1.7 33 2.4 48 2.7
Breast 4237 6.6 3790 6.6 232 7.9 70 5.1 123 7.0
Bronchus & Lung 16736 26.1 15403 26.7 648 22.0 347 25.3 280 15.9
Cervix Uteri 253 0.4 195 0.3 26 0.9 7 0.5 21 1.2
Colon / Rectum 5135 8.0 4564 7.9 271 9.2 126 9.2 148 8.4
Corpus Uteri & Uterus, NOS 1078 1.7 913 1.6 96 3.3 22 1.6 39 2.2
Esophagus 1926 3.0 1794 3.1 57 1.9 30 2.2 34 1.9
Hodgkin Lymphoma 93 0.2 77 0.1 2 0.1 3 0.2 10 0.6
Kidney & Renal Pelvis 1390 2.2 1285 2.2 50 1.7 11 0.8 38 2.2
Larynx 355 0.6 317 0.5 13 0.4 6 0.4 15 0.9
Leukemia 2519 3.9 2280 4.0 97 3.3 44 3.2 86 4.9
Liver & Intrahepatic Bile Ducts 2618 4.1 2091 3.6 181 6.1 175 12.8 155 8.8
Melanoma of Skin 1088 1.7 1062 1.8 8 0.3 3 0.2 9 0.5
Multiple Myeloma 1303 2.0 1112 1.9 119 4.1 17 1.2 49 2.8
Non-Hodgkin Lymphoma 2143 3.3 1948 3.4 70 2.4 42 3.1 72 4.1
Oral Cavity & Pharynx 966 1.5 845 1.5 45 1.5 30 2.2 38 2.1
Ovary 1689 2.6 1552 2.7 74 2.5 26 1.9 29 1.6
Pancreas 4527 7.1 4103 7.1 197 6.7 92 6.7 113 6.4
Prostate 3005 4.7 2651 4.6 217 7.4 34 2.5 87 4.9
Stomach 1239 1.9 964 1.7 94 3.2 72 5.3 99 5.6
Testis 24 0.04 23 0.04 0 0.0 0 0.0 1 0.1
Thyroid 219 0.3 190 0.3 10 0.3 5 0.4 13 0.7
Urinary Bladder 1930 3.0 1839 3.2 50 1.7 14 1.0 20 1.0
Other Sites 7922 12.4 7144 12.4 341 11.5 161 11.7 238 13.5
1 Race/ethnicity categories are mutually exclusive. Deaths are only included in one race/ethnicity category.
2 The number of deaths for all races is not the sum of deaths by race/ethnicity.
Source: Massachusetts Vital Statistics

40
Table 21.
AGE-ADJUSTED1 MORTALITY RATES
2 AND 95% CONFIDENCE LIMITS (95% CL)
FOR SELECTED CANCER SITES BY RACE/ETHNICITY3
Massachusetts, 2011-2015
MALES
All Races White, non-Hispanics Black, non-Hispanics Asian, non-Hispanics Hispanics
Cancer Site / Type Rates 95% CL Rates 95% CL Rates 95% CL Rates 95% CL Rates 95% CL
All Sites 186.8 184.8-188.9 190.8 188.6-192.9 198.2 188.1-208.3 119.8 111.2-128.4 122.9 114.9-130.9
Brain & Other Nervous System 5.3 4.9-5.6 5.7 5.3-6.1 2.6 1.7-3.7 * * 2.4 1.4-3.3
Breast 0.3 0.2-0.4 0.4 0.3-0.5 * * * * * *
Bronchus & Lung 48.4 47.4-49.4 50.0 48.9-51.1 46.6 41.7-51.4 35.4 30.6-40.2 23.3 19.8-26.9
Colon / Rectum 14.7 14.1-15.3 15.0 14.4-15.6 16.0 13.2-18.7 9.2 6.8-11.5 9.9 7.5-12.4
Esophagus 8.5 8.1-9.0 9.1 8.6-9.6 5.8 4.1-7.5 4.3 2.5-6.1 3.1 1.8-4.3
Hodgkin Lymphoma 0.3 0.2-0.4 0.3 0.2-0.4 * * * * * *
Kidney & Renal Pelvis 4.9 4.6-5.3 5.1 4.8-5.5 4.9 3.3-6.5 * * 2.7 1.6-3.7
Larynx 1.5 1.3-1.6 1.5 1.3-1.7 * * * * * *
Leukemia 8.5 8.0-8.9 8.8 8.3-9.2 6.4 4.5-8.2 4.2 2.6-5.8 5.6 4.0-7.2
Liver & Intrahepatic Bile Ducts 9.7 9.3-10.2 8.7 8.3-9.2 14.5 12.1-16.9 19.5 16.2-22.9 12.9 10.5-15.3
Melanoma of Skin 3.8 3.6-4.1 4.3 4.0-4.6 * * * * * *
Multiple Myeloma 3.9 3.6-4.2 3.8 3.5-4.1 7.4 5.4-9.4 * * 4.3 2.6-5.9
Non-Hodgkin Lymphoma 6.7 6.3-7.1 6.9 6.5-7.3 4.9 3.3-6.4 3.0 1.7-4.4 4.5 3.0-6.0
Oral Cavity & Pharynx 3.6 3.3-3.9 3.6 3.3-3.9 4.2 2.8-5.6 2.9 1.7-4.2 3.7 2.3-5.1
Pancreas 12.3 11.8-12.9 12.7 12.2-13.3 12.7 10.1-15.3 5.7 3.9-7.6 7.4 5.5-9.3
Prostate 18.2 17.6-18.9 17.9 17.2-18.6 36.3 31.5-41.2 7.2 4.8-9.6 15.5 12.3-18.8
Stomach 4.1 3.8-4.4 3.6 3.3-3.9 7.3 5.4-9.4 5.6 3.9-7.4 8.1 6.1-10.1
Testis 0.1 0.1-0.2 0.2 0.1-0.2 * * * * * *
Thyroid 0.6 0.5-0.8 0.7 0.5-0.8 * * * * * *
Urinary Bladder 7.9 7.4-8.3 8.4 7.9-8.9 4.8 3.1-6.6 * * * *
1 Rates are age-adjusted to the 2000 U.S. Standard Population.
2 per 100,000
3 Race/ethnicity categories are mutually exclusive. Deaths are only included in one race/ethnicity category.
*An age-adjusted mortality rate was not calculated when there were fewer than 20 deaths.
Source: Massachusetts Vital Statistics
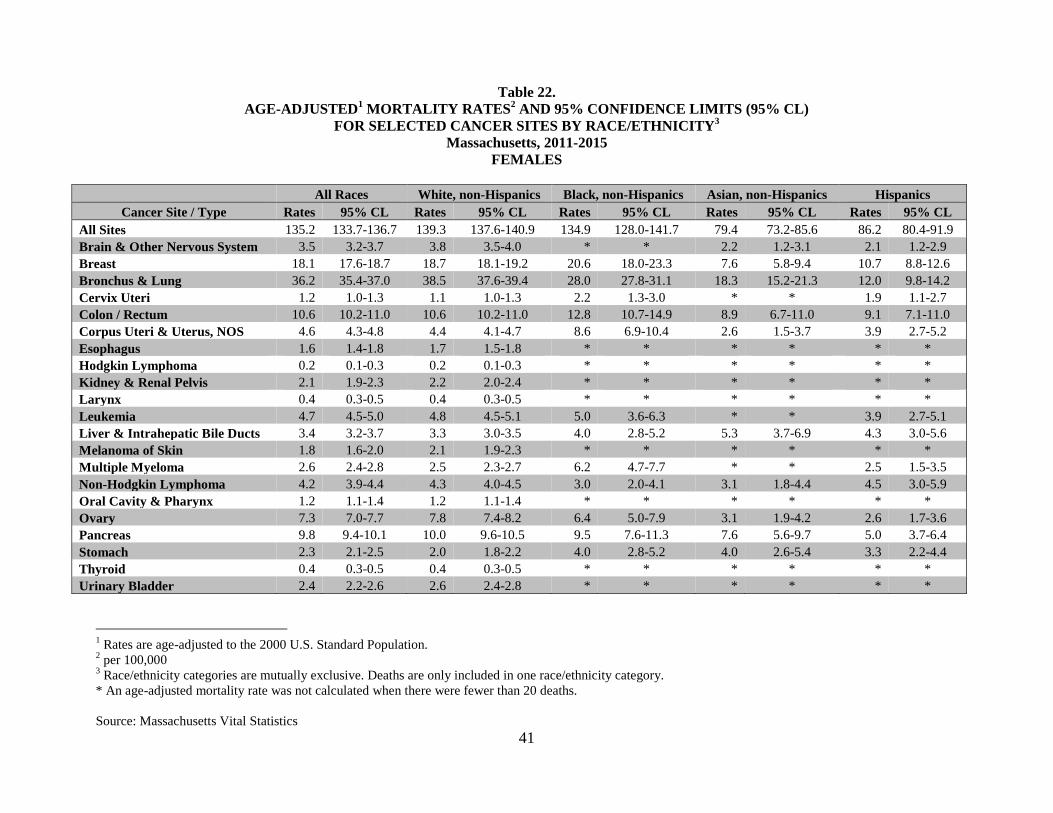
41
Table 22.
AGE-ADJUSTED1 MORTALITY RATES
2 AND 95% CONFIDENCE LIMITS (95% CL)
FOR SELECTED CANCER SITES BY RACE/ETHNICITY3
Massachusetts, 2011-2015
FEMALES
All Races White, non-Hispanics Black, non-Hispanics Asian, non-Hispanics Hispanics
Cancer Site / Type Rates 95% CL Rates 95% CL Rates 95% CL Rates 95% CL Rates 95% CL
All Sites 135.2 133.7-136.7 139.3 137.6-140.9 134.9 128.0-141.7 79.4 73.2-85.6 86.2 80.4-91.9
Brain & Other Nervous System 3.5 3.2-3.7 3.8 3.5-4.0 * * 2.2 1.2-3.1 2.1 1.2-2.9
Breast 18.1 17.6-18.7 18.7 18.1-19.2 20.6 18.0-23.3 7.6 5.8-9.4 10.7 8.8-12.6
Bronchus & Lung 36.2 35.4-37.0 38.5 37.6-39.4 28.0 27.8-31.1 18.3 15.2-21.3 12.0 9.8-14.2
Cervix Uteri 1.2 1.0-1.3 1.1 1.0-1.3 2.2 1.3-3.0 * * 1.9 1.1-2.7
Colon / Rectum 10.6 10.2-11.0 10.6 10.2-11.0 12.8 10.7-14.9 8.9 6.7-11.0 9.1 7.1-11.0
Corpus Uteri & Uterus, NOS 4.6 4.3-4.8 4.4 4.1-4.7 8.6 6.9-10.4 2.6 1.5-3.7 3.9 2.7-5.2
Esophagus 1.6 1.4-1.8 1.7 1.5-1.8 * * * * * *
Hodgkin Lymphoma 0.2 0.1-0.3 0.2 0.1-0.3 * * * * * *
Kidney & Renal Pelvis 2.1 1.9-2.3 2.2 2.0-2.4 * * * * * *
Larynx 0.4 0.3-0.5 0.4 0.3-0.5 * * * * * *
Leukemia 4.7 4.5-5.0 4.8 4.5-5.1 5.0 3.6-6.3 * * 3.9 2.7-5.1
Liver & Intrahepatic Bile Ducts 3.4 3.2-3.7 3.3 3.0-3.5 4.0 2.8-5.2 5.3 3.7-6.9 4.3 3.0-5.6
Melanoma of Skin 1.8 1.6-2.0 2.1 1.9-2.3 * * * * * *
Multiple Myeloma 2.6 2.4-2.8 2.5 2.3-2.7 6.2 4.7-7.7 * * 2.5 1.5-3.5
Non-Hodgkin Lymphoma 4.2 3.9-4.4 4.3 4.0-4.5 3.0 2.0-4.1 3.1 1.8-4.4 4.5 3.0-5.9
Oral Cavity & Pharynx 1.2 1.1-1.4 1.2 1.1-1.4 * * * * * *
Ovary 7.3 7.0-7.7 7.8 7.4-8.2 6.4 5.0-7.9 3.1 1.9-4.2 2.6 1.7-3.6
Pancreas 9.8 9.4-10.1 10.0 9.6-10.5 9.5 7.6-11.3 7.6 5.6-9.7 5.0 3.7-6.4
Stomach 2.3 2.1-2.5 2.0 1.8-2.2 4.0 2.8-5.2 4.0 2.6-5.4 3.3 2.2-4.4
Thyroid 0.4 0.3-0.5 0.4 0.3-0.5 * * * * * *
Urinary Bladder 2.4 2.2-2.6 2.6 2.4-2.8 * * * * * *
1 Rates are age-adjusted to the 2000 U.S. Standard Population.
2 per 100,000
3 Race/ethnicity categories are mutually exclusive. Deaths are only included in one race/ethnicity category.
* An age-adjusted mortality rate was not calculated when there were fewer than 20 deaths.
Source: Massachusetts Vital Statistics
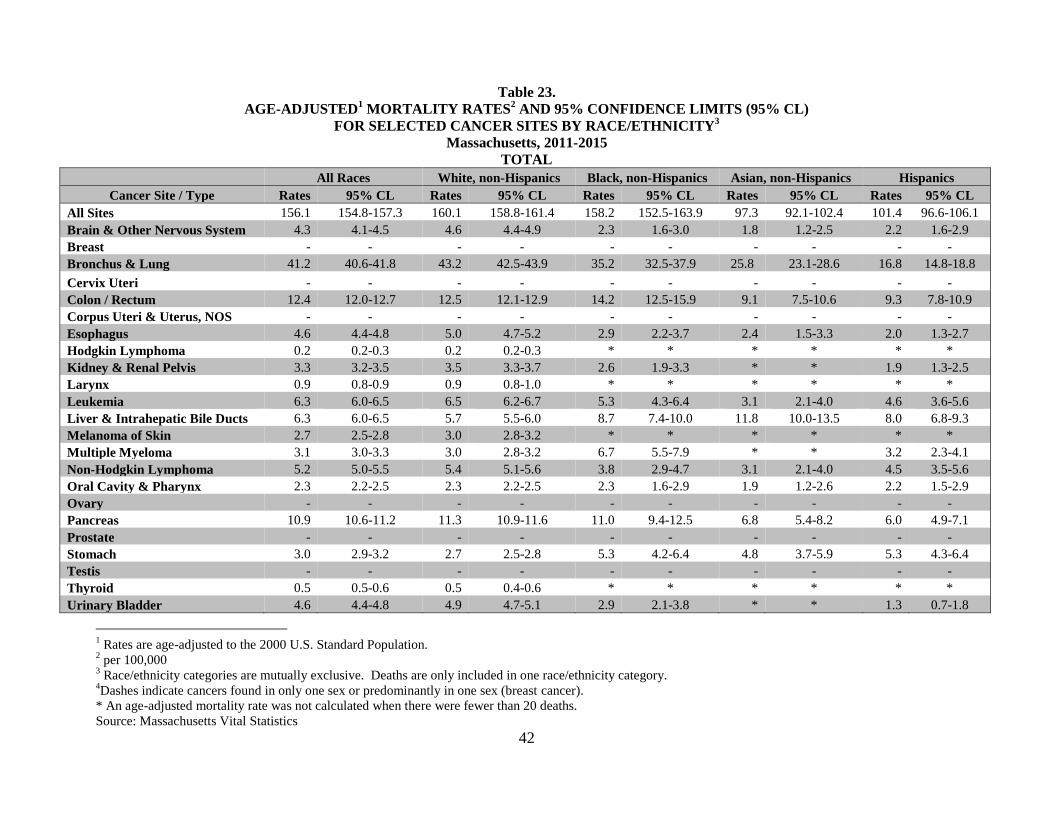
42
Table 23.
AGE-ADJUSTED1 MORTALITY RATES
2 AND 95% CONFIDENCE LIMITS (95% CL)
FOR SELECTED CANCER SITES BY RACE/ETHNICITY3
Massachusetts, 2011-2015
TOTAL
All Races White, non-Hispanics Black, non-Hispanics Asian, non-Hispanics Hispanics
Cancer Site / Type Rates 95% CL Rates 95% CL Rates 95% CL Rates 95% CL Rates 95% CL
All Sites 156.1 154.8-157.3 160.1 158.8-161.4 158.2 152.5-163.9 97.3 92.1-102.4 101.4 96.6-106.1
Brain & Other Nervous System 4.3 4.1-4.5 4.6 4.4-4.9 2.3 1.6-3.0 1.8 1.2-2.5 2.2 1.6-2.9
Breast - - - - - - - - - -
Bronchus & Lung 41.2 40.6-41.8 43.2 42.5-43.9 35.2 32.5-37.9 25.8 23.1-28.6 16.8 14.8-18.8
Cervix Uteri - - - - - - - - - -
Colon / Rectum 12.4 12.0-12.7 12.5 12.1-12.9 14.2 12.5-15.9 9.1 7.5-10.6 9.3 7.8-10.9
Corpus Uteri & Uterus, NOS - - - - - - - - - -
Esophagus 4.6 4.4-4.8 5.0 4.7-5.2 2.9 2.2-3.7 2.4 1.5-3.3 2.0 1.3-2.7
Hodgkin Lymphoma 0.2 0.2-0.3 0.2 0.2-0.3 * * * * * *
Kidney & Renal Pelvis 3.3 3.2-3.5 3.5 3.3-3.7 2.6 1.9-3.3 * * 1.9 1.3-2.5
Larynx 0.9 0.8-0.9 0.9 0.8-1.0 * * * * * *
Leukemia 6.3 6.0-6.5 6.5 6.2-6.7 5.3 4.3-6.4 3.1 2.1-4.0 4.6 3.6-5.6
Liver & Intrahepatic Bile Ducts 6.3 6.0-6.5 5.7 5.5-6.0 8.7 7.4-10.0 11.8 10.0-13.5 8.0 6.8-9.3
Melanoma of Skin 2.7 2.5-2.8 3.0 2.8-3.2 * * * * * *
Multiple Myeloma 3.1 3.0-3.3 3.0 2.8-3.2 6.7 5.5-7.9 * * 3.2 2.3-4.1
Non-Hodgkin Lymphoma 5.2 5.0-5.5 5.4 5.1-5.6 3.8 2.9-4.7 3.1 2.1-4.0 4.5 3.5-5.6
Oral Cavity & Pharynx 2.3 2.2-2.5 2.3 2.2-2.5 2.3 1.6-2.9 1.9 1.2-2.6 2.2 1.5-2.9
Ovary - - - - - - - - - -
Pancreas 10.9 10.6-11.2 11.3 10.9-11.6 11.0 9.4-12.5 6.8 5.4-8.2 6.0 4.9-7.1
Prostate - - - - - - - - - -
Stomach 3.0 2.9-3.2 2.7 2.5-2.8 5.3 4.2-6.4 4.8 3.7-5.9 5.3 4.3-6.4
Testis - - - - - - - - - -
Thyroid 0.5 0.5-0.6 0.5 0.4-0.6 * * * * * *
Urinary Bladder 4.6 4.4-4.8 4.9 4.7-5.1 2.9 2.1-3.8 * * 1.3 0.7-1.8
1 Rates are age-adjusted to the 2000 U.S. Standard Population.
2 per 100,000
3 Race/ethnicity categories are mutually exclusive. Deaths are only included in one race/ethnicity category.
4Dashes indicate cancers found in only one sex or predominantly in one sex (breast cancer).
* An age-adjusted mortality rate was not calculated when there were fewer than 20 deaths.
Source: Massachusetts Vital Statistics
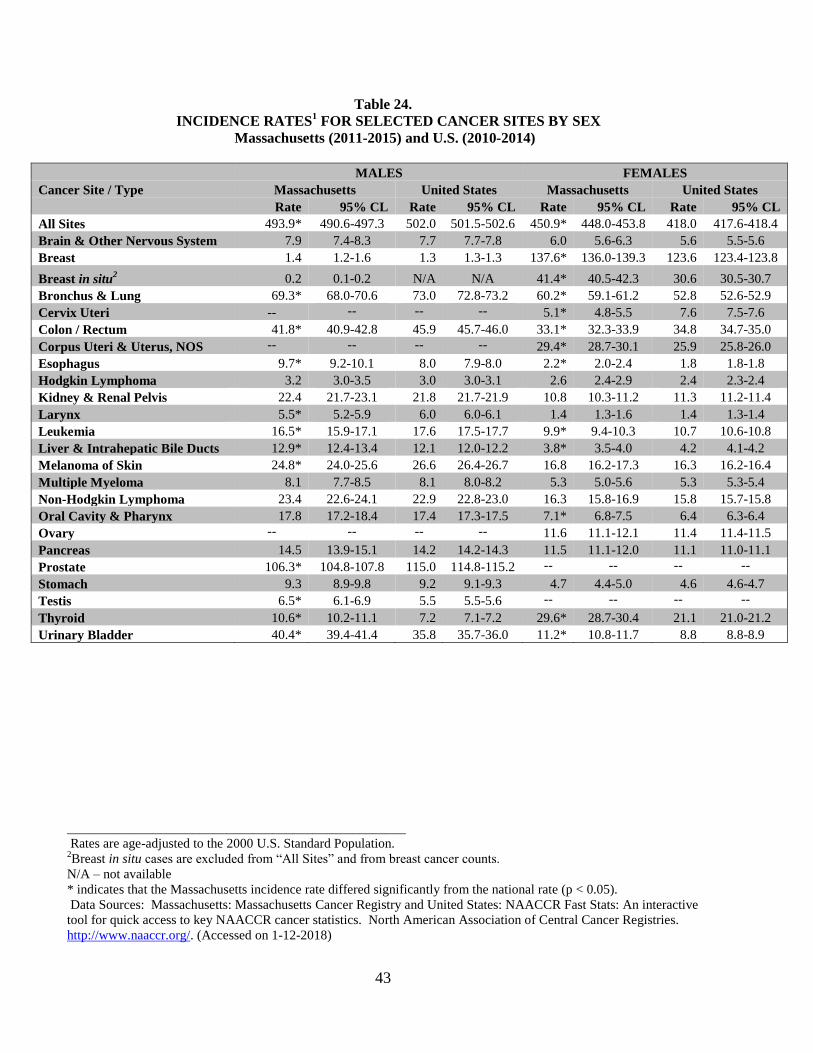
43
Table 24.
INCIDENCE RATES1 FOR SELECTED CANCER SITES BY SEX
Massachusetts (2011-2015) and U.S. (2010-2014)
MALES FEMALES
Cancer Site / Type Massachusetts United States Massachusetts United States
Rate 95% CL Rate 95% CL Rate 95% CL Rate 95% CL
All Sites 493.9* 490.6-497.3 502.0 501.5-502.6 450.9* 448.0-453.8 418.0 417.6-418.4
Brain & Other Nervous System 7.9 7.4-8.3 7.7 7.7-7.8 6.0 5.6-6.3 5.6 5.5-5.6
Breast 1.4 1.2-1.6 1.3 1.3-1.3 137.6* 136.0-139.3 123.6 123.4-123.8
Breast in situ2 0.2 0.1-0.2 N/A N/A 41.4* 40.5-42.3 30.6 30.5-30.7
Bronchus & Lung 69.3* 68.0-70.6 73.0 72.8-73.2 60.2* 59.1-61.2 52.8 52.6-52.9
Cervix Uteri -- -- -- -- 5.1* 4.8-5.5 7.6 7.5-7.6
Colon / Rectum 41.8* 40.9-42.8 45.9 45.7-46.0 33.1* 32.3-33.9 34.8 34.7-35.0
Corpus Uteri & Uterus, NOS -- -- -- -- 29.4* 28.7-30.1 25.9 25.8-26.0
Esophagus 9.7* 9.2-10.1 8.0 7.9-8.0 2.2* 2.0-2.4 1.8 1.8-1.8
Hodgkin Lymphoma 3.2 3.0-3.5 3.0 3.0-3.1 2.6 2.4-2.9 2.4 2.3-2.4
Kidney & Renal Pelvis 22.4 21.7-23.1 21.8 21.7-21.9 10.8 10.3-11.2 11.3 11.2-11.4
Larynx 5.5* 5.2-5.9 6.0 6.0-6.1 1.4 1.3-1.6 1.4 1.3-1.4
Leukemia 16.5* 15.9-17.1 17.6 17.5-17.7 9.9* 9.4-10.3 10.7 10.6-10.8
Liver & Intrahepatic Bile Ducts 12.9* 12.4-13.4 12.1 12.0-12.2 3.8* 3.5-4.0 4.2 4.1-4.2
Melanoma of Skin 24.8* 24.0-25.6 26.6 26.4-26.7 16.8 16.2-17.3 16.3 16.2-16.4
Multiple Myeloma 8.1 7.7-8.5 8.1 8.0-8.2 5.3 5.0-5.6 5.3 5.3-5.4
Non-Hodgkin Lymphoma 23.4 22.6-24.1 22.9 22.8-23.0 16.3 15.8-16.9 15.8 15.7-15.8
Oral Cavity & Pharynx 17.8 17.2-18.4 17.4 17.3-17.5 7.1* 6.8-7.5 6.4 6.3-6.4
Ovary -- -- -- -- 11.6 11.1-12.1 11.4 11.4-11.5
Pancreas 14.5 13.9-15.1 14.2 14.2-14.3 11.5 11.1-12.0 11.1 11.0-11.1
Prostate 106.3* 104.8-107.8 115.0 114.8-115.2 -- -- -- --
Stomach 9.3 8.9-9.8 9.2 9.1-9.3 4.7 4.4-5.0 4.6 4.6-4.7
Testis 6.5* 6.1-6.9 5.5 5.5-5.6 -- -- -- --
Thyroid 10.6* 10.2-11.1 7.2 7.1-7.2 29.6* 28.7-30.4 21.1 21.0-21.2
Urinary Bladder 40.4* 39.4-41.4 35.8 35.7-36.0 11.2* 10.8-11.7 8.8 8.8-8.9
___________________________________________________
Rates are age-adjusted to the 2000 U.S. Standard Population. 2Breast in situ cases are excluded from “All Sites” and from breast cancer counts.
N/A – not available
* indicates that the Massachusetts incidence rate differed significantly from the national rate (p < 0.05).
Data Sources: Massachusetts: Massachusetts Cancer Registry and United States: NAACCR Fast Stats: An interactive
tool for quick access to key NAACCR cancer statistics. North American Association of Central Cancer Registries.
http://www.naaccr.org/. (Accessed on 1-12-2018)

44
Table 25.
MORTALITY RATES1 FOR SELECTED CANCER SITES BY SEX
Massachusetts and U.S. (2011-2015)
MALES FEMALES
Cancer Site / Type Massachusetts United States Massachusetts United States
Rate 95% CL Rate 95% CL Rate 95% CL Rate 95% CL
All Sites 186.8* 184.8-188.9 196.3 196.0-196.6 135.2* 133.7-136.7 139.8 139.6-140.1
Brain & Other Nervous System 5.3 4.9-5.6 5.3 5.3-5.4 3.5 3.2-3.7 3.6 3.5-3.6
Breast 0.3 0.2-0.4 0.3 0.3-0.3 18.1* 17.6-18.7 20.9 20.8-21.0
Bronchus & Lung 48.4* 47.4-49.4 53.6 53.5-53.8 36.2 35.4-37.0 35.4 35.3-35.5
Cervix Uteri - - - - 1.2* 1.0-1.3 2.3 2.3-2.3
Colon / Rectum 14.7* 14.1-15.3 17.4 17.3-17.5 10.6* 10.2-11.0 12.4 12.4-12.5
Corpus Uteri & Uterus, NOS - - - - 4.6 4.3-4.8 4.6 4.6-4.7
Esophagus 8.5* 8.1-9.0 7.2 7.1-7.3 1.6 1.4-1.8 1.5 1.5-1.5
Hodgkin Lymphoma 0.3 0.2-0.4 0.4 0.4-0.4 0.2 0.1-0.2 0.3 0.2-0.3
Kidney & Renal Pelvis 4.9* 4.6-5.3 5.6 5.6-5.7 2.1* 1.9-2.3 2.4 2.4-22.5
Larynx 1.5* 1.3-1.6 1.8 1.8-1.8 0.4 0.3-0.5 0.4 0.3-0.4
Leukemia 8.5 8.0-8.9 8.9 8.8-8.9 4.7 4.5-5.0 4.9 4.9-5.0
Liver & Intrahepatic Bile Ducts 9.7 9.3-10.2 9.5 9.4-9.5 3.4* 3.2-3.7 3.8 3.8-3.9
Melanoma of Skin 3.8 3.6-4.1 3.9 3.8-3.9 1.8 1.6-2.0 1.6 1.6-1.7
Multiple Myeloma 3.9* 3.6-4.2 4.3 4.3-4.4 2.6 2.4-2.8 2.8 2.7-2.8
Non-Hodgkin Lymphoma 6.7* 6.3-7.1 7.4 7.3-7.5 4.2 3.9-4.4 4.5 4.4-4.5
Oral Cavity & Pharynx 3.6 3.3-3.9 3.9 3.8-3.9 1.2 1.1-1.4 1.3 1.3-1.3
Ovary - - - - 7.3 7.0-7.7 7.2 7.1-7.2
Pancreas 12.3 11.8-12.9 12.6 12.5-12.6 9.8 9.4-10.1 9.5 9.5-9.6
Prostate 18.2* 17.6-18.9 19.4 19.3-19.5 - - - -
Stomach 4.1 3.8-4.4 4.3 4.2-4.3 2.3 2.1-2.5 2.3 2.3-2.3
Testis 0.1 0.1-0.2 0.2 0.2-0.2 - - - -
Thyroid 0.6 0.5-0.8 0.5 0.5-0.5 0.4 0.3-0.5 0.5 0.5-0.5
Urinary Bladder 7.9 7.4-8.3 7.5 7.5-7.6 2.4 2.2-2.6 2.1 2.1-2.2
__________________________________________________ Rates are age-adjusted to the 2000 U.S. Standard Population. 2Breast in situ cases are excluded from “All Sites” and from breast cancer counts.
N/A – not applicable
* indicates that the Massachusetts mortality rate differed significantly from the national rate (p < 0.05).
Data Sources: Massachusetts: Massachusetts Vital Statistics and United States: National Center for Health Statistics.

45
APPENDICES

46
APPENDIX I
ICD CODES USED FOR THIS REPORT Cancer Site/Type .……….C o d e s………..
ICD-O-3* ICD-10**
Brain & Other
Nervous System
C70.0-C72.9
except 9050-9055, 9140,
9590-9992
C70-C72
Breast
(includes in situ)
C50.0 – C50.9
except 9050-9055, 9140,
9590-9992
C50
Bronchus & Lung C34.0 – C34.9
except 9050-9055, 9140,
9590-9992
C34
Cervix Uteri C53.0 – C53.9
except 9050-9055, 9140,
9590-9992
C53
Colon/ Rectum C18.0-C18.9,
C19.9, C20.9,
C26.0
except 9050-9055, 9140,
9590-9992
C18 – C20, C26.0
Corpus Uteri
& Uterus, NOS
C54.0 – C54.9,
C55.9
except 9050-9055, 9140,
9590-9992
C54 – C55
Esophagus C15.0-C15.9
except 9050-9055, 9140,
9590-9992
C15
Hodgkin Lymphoma C00.00 – C80.9
(includes 9650-9667)
C81
Kidney &
Renal Pelvis
C64.9, C65.9
except 9050-9055, 9140,
9590-9992
C64- C65
Larynx C32.0 – C32.9
except 9050-9055, 9140,
9590-9992
C32

47
Leukemia
C00.0 – C80.9
(includes 9733, 9742,
9800-9801, 9805-9809, 9820,
9826, 9831-9836, 9840, 9860-
9861, 9863, 9865-9867, 9869-
9876, 9891, 9895-9898, 9910-
9911, 9920, 9930-9931, 9940,
9945-9946, 9948, 9963-9964)
C42.0, C42.1, C42.4
(includes 9811-9818, 9823, 9827,
9837)
C90.1, C91 – C95
Liver and Intrahepatic
Bile Ducts
C22.0, C22.1
except 9050-9055, 9140,
9590-9992
C22
Melanoma of Skin C44.0 – C44.9
(includes 8720-8790)
C43
Multiple Myeloma C00.0-C80.9
(includes 9731, 9732,
9734)
C90.0, C90.2
Non – Hodgkin
Lymphoma
C02.4, C098, C099, C111,
C142, C379, C422, C770-
C779 (includes 9590-9597,
9670-9671, 9673, 9675, 9678-
9680, 9684, 9687-9691, 9695,
9698-9702, 9705, 9708-9709,
9712, 9714-9719, 9724-9729,
9735, 9737-9738, 9811-9818,
9823, 9827, 9837)
All sites except C02.4, C90.8-
C09.9, C11.1, C14.2, C37.9,
C42.2, C77.0-C77.9 (includes
9590-9597, 9670-9671, 9673,
9675, 9678-9680, 9684, 9687,
9688, 9689-9691, 9695, 9698-
9702, 9705, 9708-9709, 9712,
9714-9719, 9724-9729, 9735,
9737, 9738)
All sites except C02.4, c09.8-
C09.9, C11.1, C14.2, C37.9,
C42.0-C42.2, c42.4, C77.0-
C77.9 (includes 9811-9818,
9823, 9827, 9837)
C82 – C85, C96.3
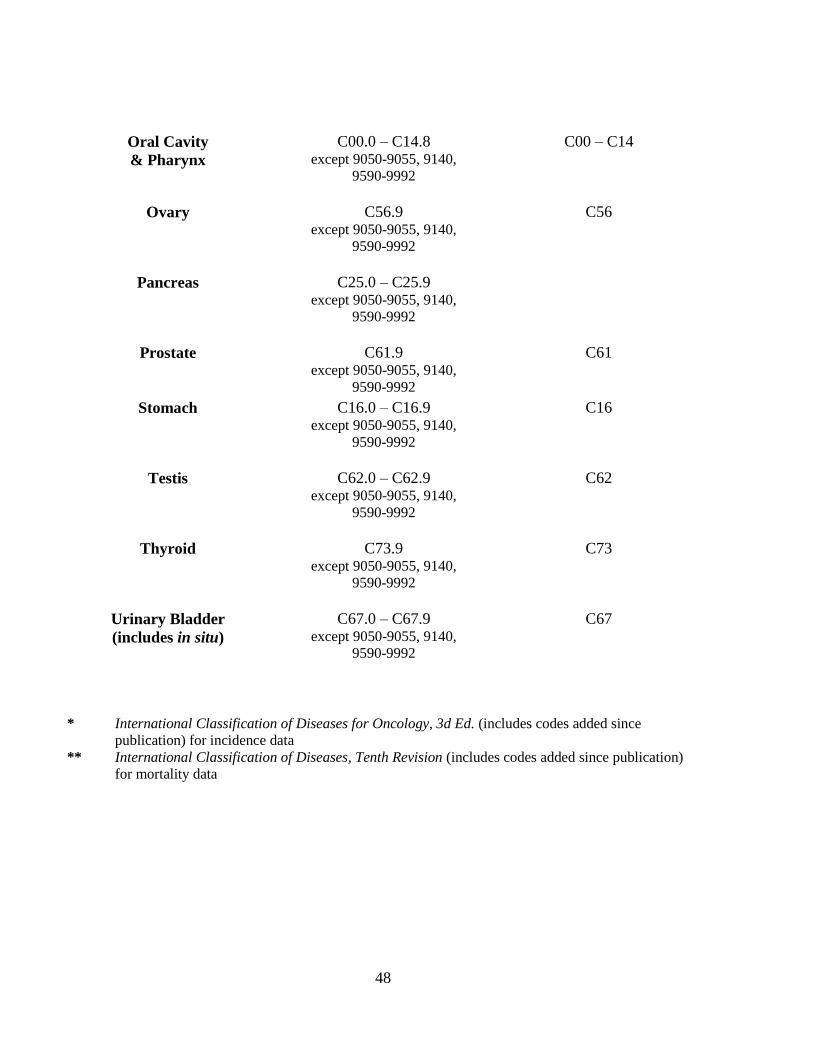
48
Oral Cavity
& Pharynx
C00.0 – C14.8 except 9050-9055, 9140,
9590-9992
C00 – C14
Ovary C56.9 except 9050-9055, 9140,
9590-9992
C56
Pancreas C25.0 – C25.9 except 9050-9055, 9140,
9590-9992
Prostate
C61.9 except 9050-9055, 9140,
9590-9992
C61
Stomach
C16.0 – C16.9 except 9050-9055, 9140,
9590-9992
C16
Testis C62.0 – C62.9 except 9050-9055, 9140,
9590-9992
C62
Thyroid C73.9 except 9050-9055, 9140,
9590-9992
C73
Urinary Bladder
(includes in situ)
C67.0 – C67.9 except 9050-9055, 9140,
9590-9992
C67
* International Classification of Diseases for Oncology, 3d Ed. (includes codes added since
publication) for incidence data
** International Classification of Diseases, Tenth Revision (includes codes added since publication)
for mortality data

49
APPENDIX II:
Population and Rate Changes
The population estimates for 2011-2015 used in this report were produced by the National Center for
Health Statistics (NCHS) in collaboration with the U.S. Census Bureau’s Population Estimation Program.
The NCHS takes the Census Bureau population estimates file and reallocates the multiple race categories
required by the 1997 Office of Management and Budget (OMB) specifications back into the four race
categories specified in the 1977 OMB specifications so that the estimates will be compatible with previous
years’ populations. (3) The estimates are divided into mutually exclusive racial/ethnic categories similar to
those of the MCR.
Please note that the statewide age-adjusted rates published in this report cannot be compared with those
published in reports prior to July 2007, because the overall population count and the age distribution of the
population, which were based on the Census 2000 count, differ.
The difference in the new population estimates is pronounced for Hispanics and black, non-Hispanics. The
Hispanic and black, non-Hispanic populations have increased 15% since 2000, while the overall state
population has increased by 1%. It is important to remember that both age-adjusted cancer incidence and
cancer death rates are not a measure of the actual risk of cancer or of death from it. Rather, age-adjusted
rates are summary measures used to compare cancer incidence and mortality trends over time or among
different populations whose age distributions differ. For specific examples of the effect of new population
estimates on age-adjusted rates, see Appendix II in the report Cancer Incidence and Mortality in
Massachusetts 2000-2004: Statewide Report, available at
http://www.mass.gov/eohhs/docs/dph/cancer/state/registry-statewide-00-04-report.pdf
.

50
Appendix III
POPULATION ESTIMATES BY AGE, RACE/ETHNICTIY, AND SEX
Massachusetts, 2011-2015
White, non-Hispanic Black, non-Hispanic Asian, non-Hispanic Hispanic
Age
Group
Males Females Total Males Females Total Males Females Total Males Females Total
00-04 599582 572123 1171705 89827 84540 174367 69502 67869 137371 174587 166763 341350
05-09 647533 618894 1266427 89285 84545 173830 68095 67552 135647 160176 154452 314628
10-14 712339 679236 1391575 88149 84700 172849 62596 63726 126322 151779 146428 298207
15-19 818320 800816 1619136 100453 98611 199064 70209 76924 147133 164804 157439 322243
20-24 832986 834697 1667683 109635 107192 216827 90551 97938 188489 175779 166330 342109
25-29 820012 825186 1645198 93392 94324 187716 99234 111954 211188 160076 152239 312315
30-34 749333 759781 1509114 82815 88511 171326 94803 106739 201542 150186 147639 297825
35-39 694231 713345 1407576 76803 83213 160016 86589 95411 182000 128862 133550 262412
40-44 808466 842405 1650871 76304 83508 159812 81411 87656 169067 112245 121365 233610
45-49 938105 975726 1913831 78866 84123 162989 67390 72734 140124 100361 110546 210907
50-54 1019746 1064497 2084243 75759 81341 157100 56875 61950 118825 82382 93083 175465
55-59 956796 1014650 1971446 62403 69649 132052 46583 52775 99358 61788 72103 133891
60-64 823817 896351 1720168 46705 54976 101681 37077 42678 79755 43954 53257 97211
65-69 647698 726488 1374186 31740 40768 72508 25370 29383 54753 29601 38432 68033
70-74 438022 523693 961715 20329 29264 49593 18884 21646 40530 18782 25836 44618
75-79 313303 410083 723386 13806 22188 35994 13580 15533 29113 11642 17619 29261
80-84 240271 364116 604387 8543 15842 24385 8095 10333 18428 6808 11451 18259
85+ 229216 489437 718653 7043 16512 23555 5936 9300 15236 5749 10680 16429
Population Data Source: United States Census Data (2011-2015)

51
Appendix IV
Racial/Ethnic Breakdown of the Massachusetts and United States Populations*
Massachusetts (2011-2015)
White, NH
74.3%
Other*
2.7%Hispanic
10.6%
Asian, NH
5.9%
Black, NH
6.5%
United States (2011-2015)
White, NH
62.3%Black, NH
12.3%
Asian, NH
5.1%
Hispanic
17.1%
Other*
3.2%
Data Source: United States Census Data, American Community Survery, 2011-2015
*Other includes people reporting 2 or more races.

52
.
REFERENCES

53
REFERENCES FOR GENERAL REPORT
1. Massachusetts Cancer Registry, Cancer Incidence and Mortality in Massachusetts, 2006-2010: Statewide
Report, Available at: www.mass.gov/dph/mcr
2. Ahmedin Jemal et al. (2017), Annual Report to the Nation on the Status of Cancer, 1975-2014, Featuring
Survival. J Natl Cancer Inst. https://academic.oup.com/jnci/article-lookup/doi/10.1093/jnci/djx030
3. National Center for Health Statistics, U.S. Department of Health and Human Services. Centers for Disease
Control and Prevention (CDC), National Center for Health Statistics (NCHS), Vintage 2015 Bridged Race
postcensal population estimates for July 1, 2010 to July 1, 2015 by year, county, single year of age (0-85+
years), bridged race, Hispanic origin, and sex Available at:
https://www.cdc.gov/nchs/nvss/bridged_race/data_documentation.htm#vintage2015