canadian sugar institute - agecon search · canadian sugar institute ... jan 488 5,300 720 5,300...
TRANSCRIPT
Canadian Sugar Institute
USDA Agricultural Outlook Forum
February 19, 2010
North American Free Trade Agreement & the Canadian Sugar
Market
Canadian Sugar Institute
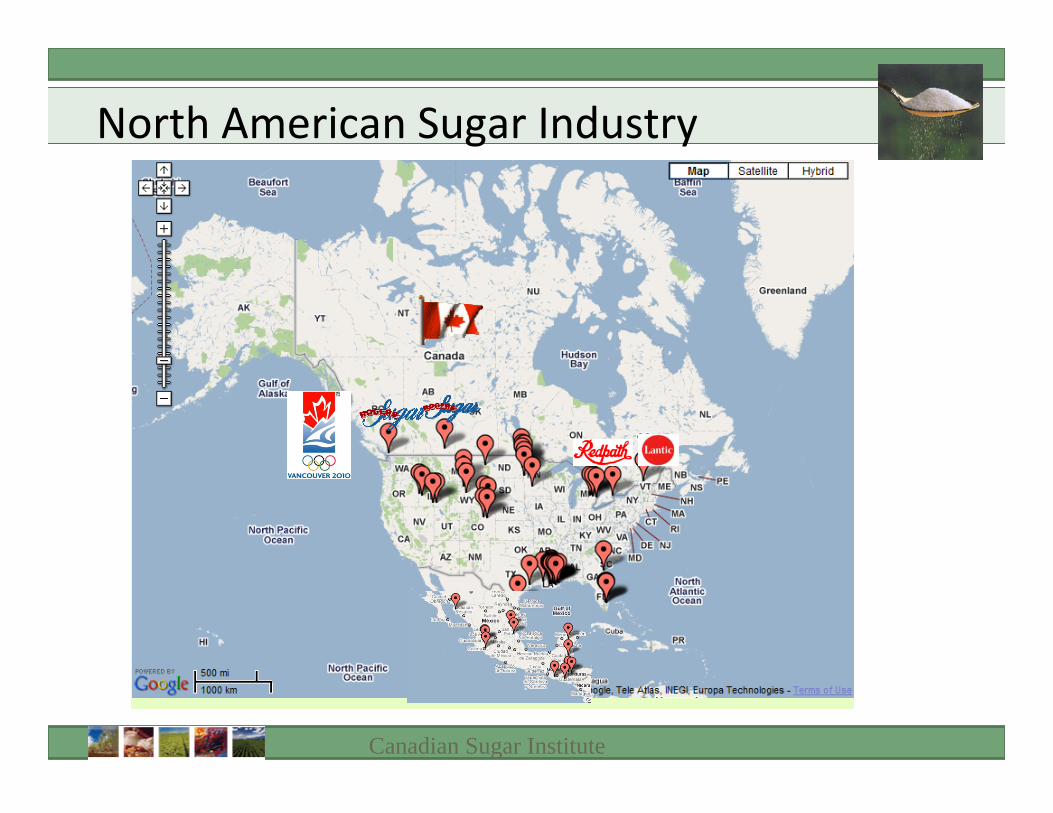
North American Sugar Industry

Canadian Sugar Institute
FOUR Refined Sugar Operations
Vancouver cane sugar refinery
Taber sugar beet factory
Toronto cane sugar refinery
Montreal cane sugar refinery
TWO Further Processing Operations
Redpath Custom Packing, Niagara Falls, ON
Lantic Blending, Scarborough, ON
Canadian Sugar OperationsPrior to 1980, there were ten sugar processing plants operating across Canada. By 1980, there were six, and by 2000, the number of plants was down to four.

Canadian Sugar Institute
Plant Closures since 1995
Winnipeg, Manitoba ‐ January 1997Rogers Sugar:Rogers Sugar:
• US implementation of WTO reduced exports to the U.S. from 40,000 metric tonnes to 10,000 tonnes
• Lack of alternative export opportunities
Saint John, New Brunswick ‐ July 2000Lantic Sugar:Lantic Sugar:
• Competitive pressures to reduce costs and consolidate operations in one plant (Montreal)
• Mature market and limited export opportunities
• Freight costs
Canadian Sugar Institute
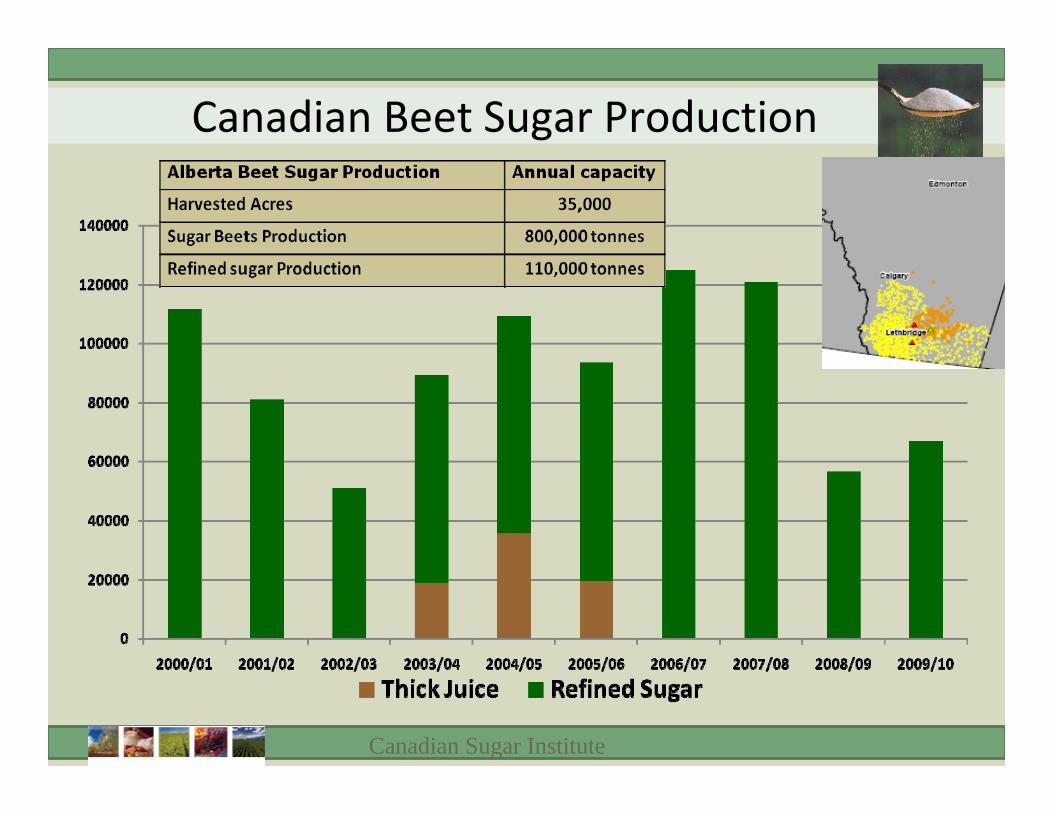
Canadian Beet Sugar Production

Canadian Sugar Institute
Reasons for Decline↓ Reduced sugar‐
containing product manufacturing related to:
$ Strengthening of Canadian dollar, and
$ High cost of other inputs, notably dairy ingredients
Canadian Sugar Shipments Decline Since 2004
Canadian Sugar Institute
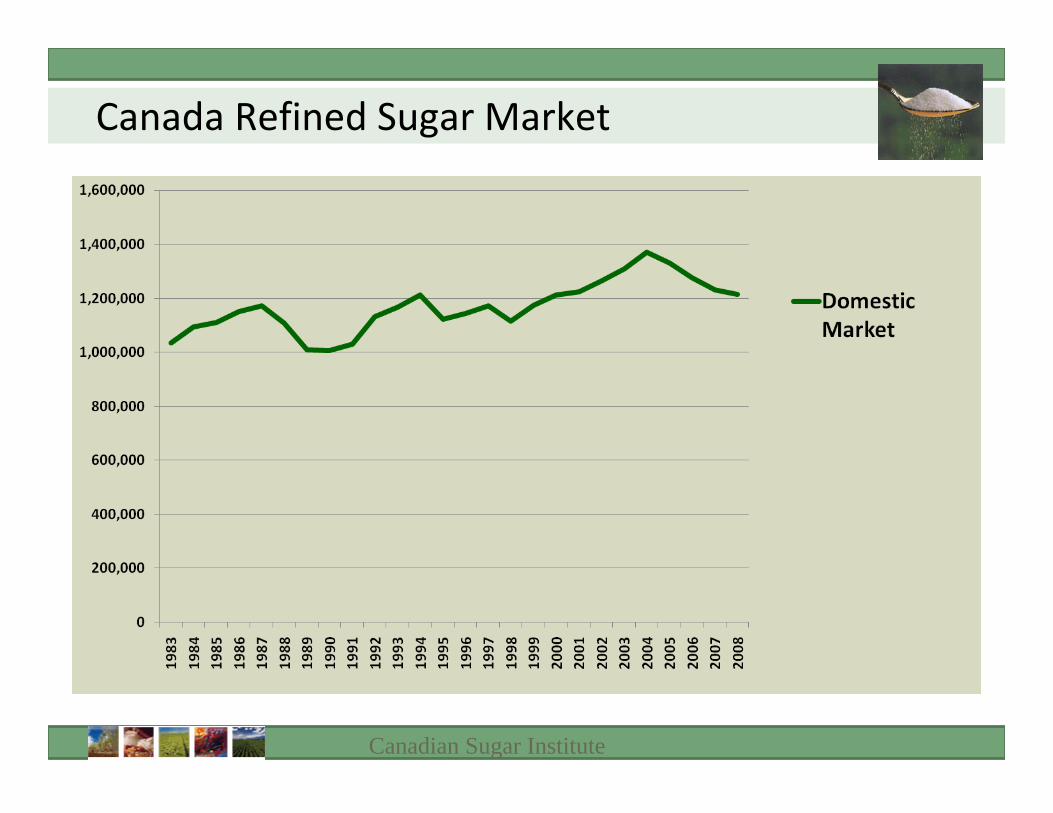
Canada Refined Sugar Market
Canadian Sugar Institute
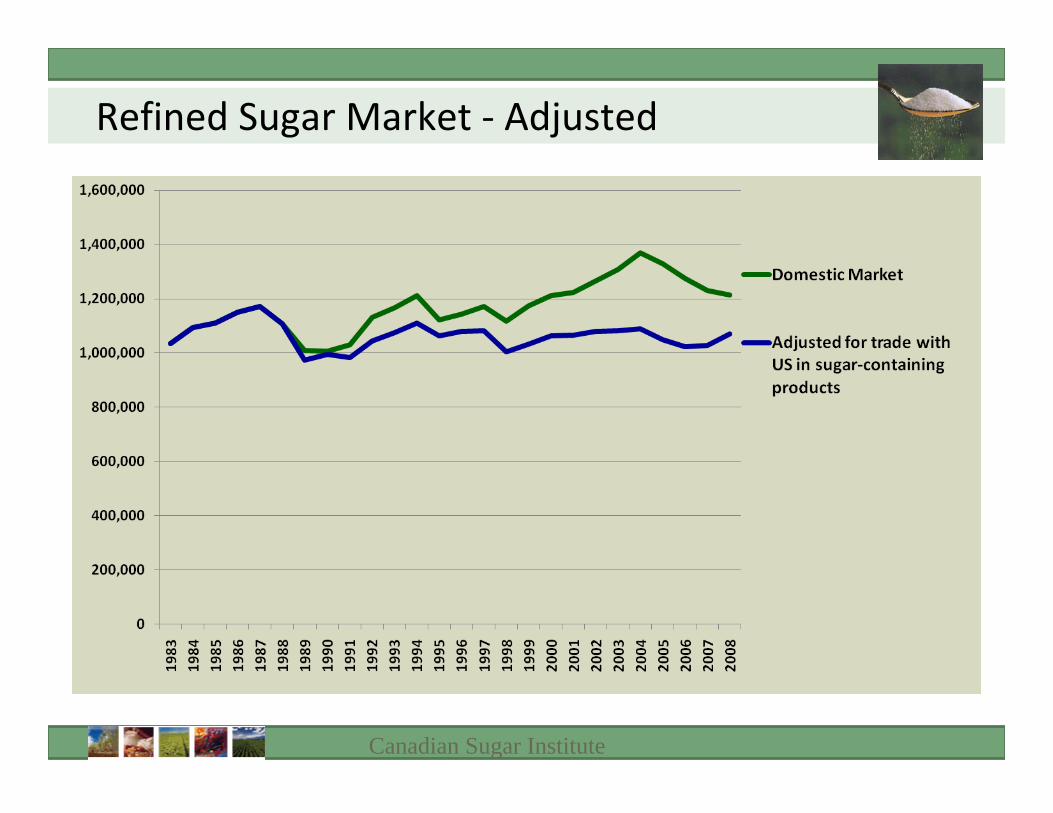
Refined Sugar Market ‐ Adjusted
Canadian Sugar Institute
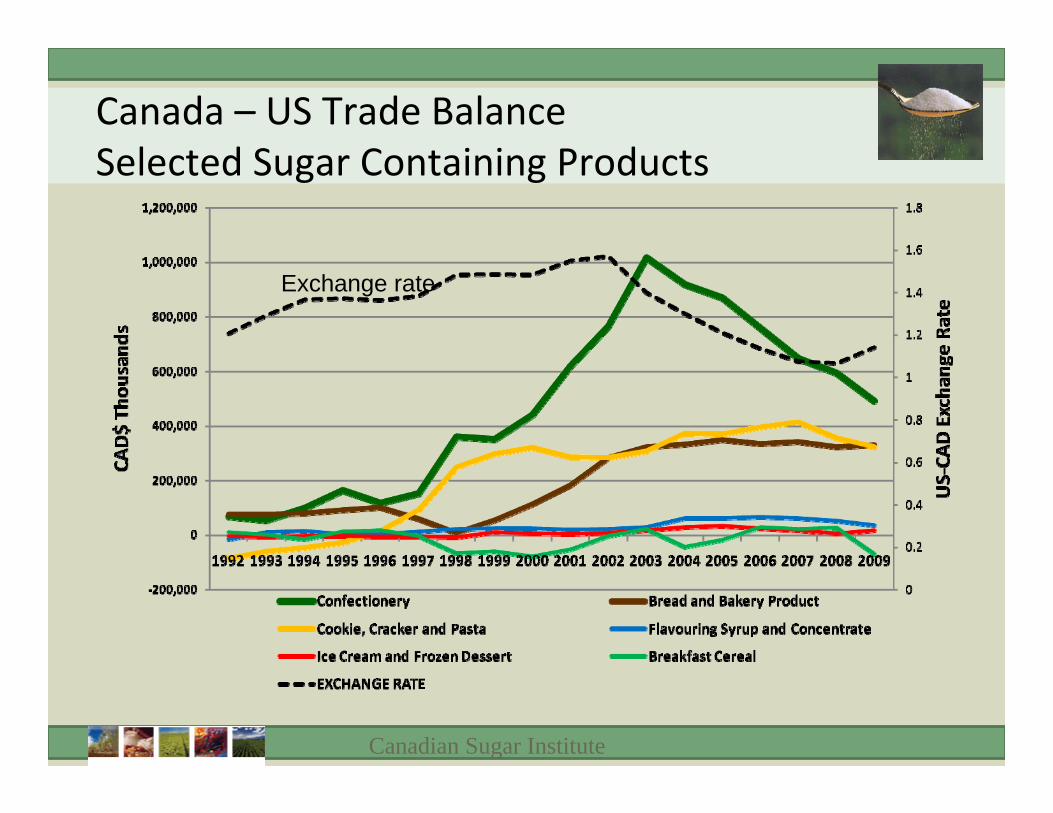
Canada – US Trade BalanceSelected Sugar Containing Products
Exchange rate

Canadian Sugar Institute
Canadian Sugar Policy in Global Context
287176
160156
150150
10576
5035
228
0 50 100 150 200 250 300 350
JapanEU
GuatemalaMexico
USAIndia
S AfricaChina
Costa RicaBrazil
AustraliaCanada
Tariff Equivalents (%)
Sugar Tariffs

Canadian Sugar Institute
Canadian Sugar Policy in Global Context
LMC International, June 2009
Canadian Sugar Institute
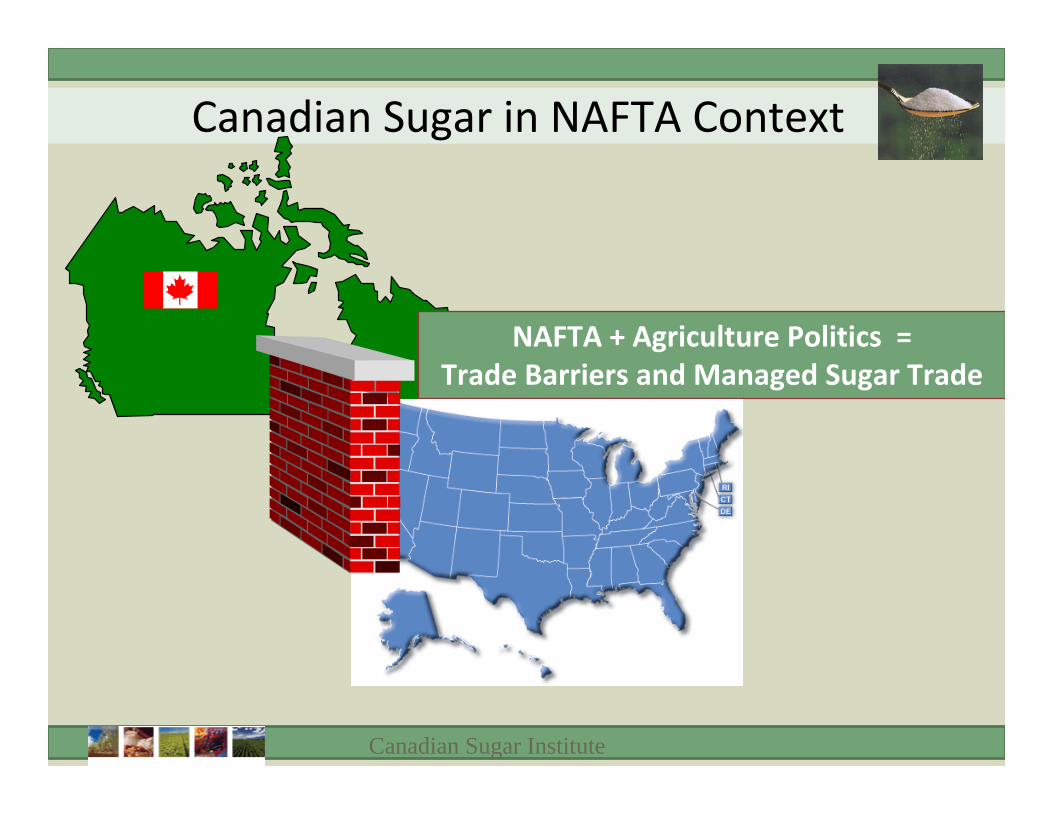
Canadian Sugar in NAFTA Context
NAFTA + Agriculture Politics =Trade Barriers and Managed Sugar Trade

Canadian Sugar Institute
Canada Exports Refined Sugar to USFoundation of current US sugar policyCountry quotas on sugar reduced Canadian refined sugar
exports from an annual average of 100,000 tonnes (1977‐
79) to an average of 20,000 tonnes in the 1980s.
1977‐7983% refined sugar imports;2% total imports
Canadian Sugar Institute
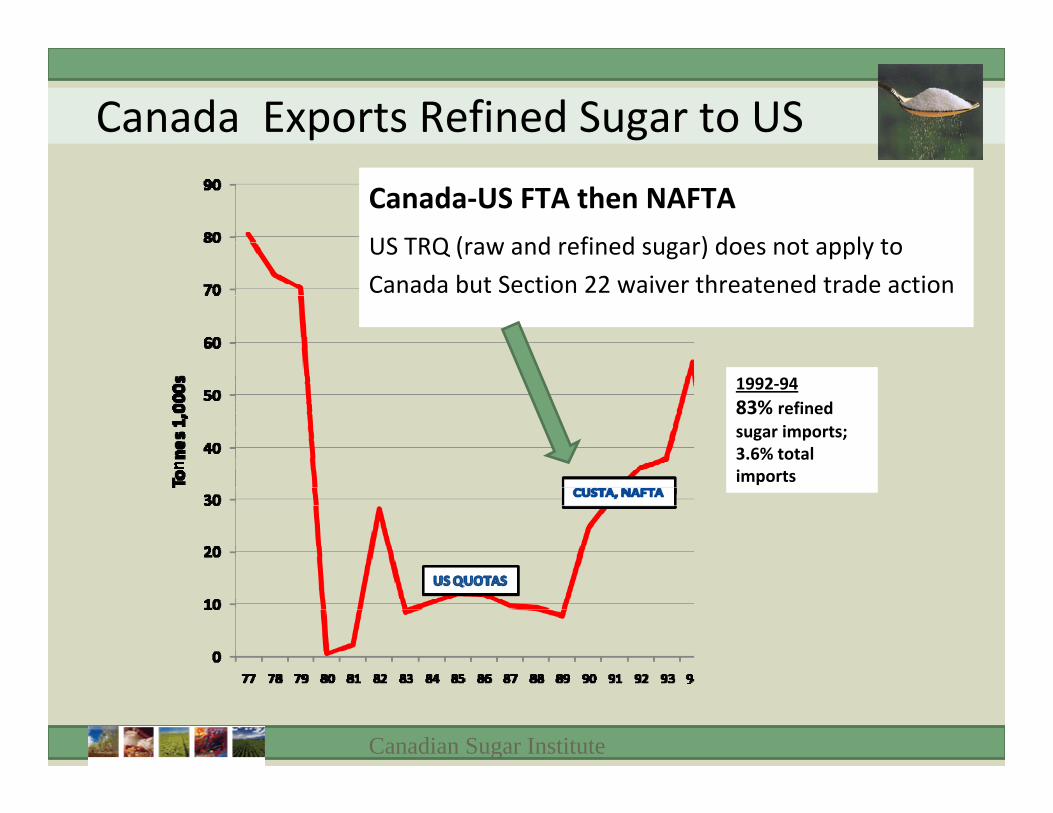
Canada Exports Refined Sugar to US
Canada‐US FTA then NAFTA
US TRQ (raw and refined sugar) does not apply to
Canada but Section 22 waiver threatened trade action
1992‐9483% refined sugar imports;3.6% total imports
Canadian Sugar Institute
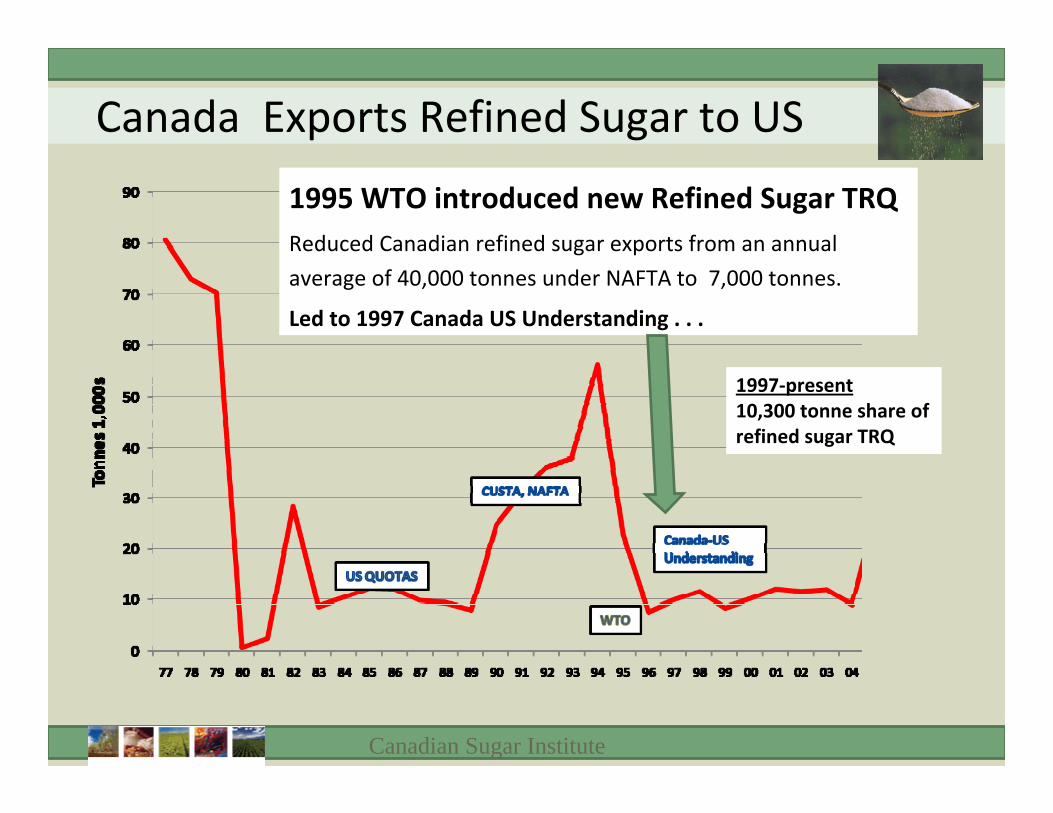
Canada Exports Refined Sugar to US
1995 WTO introduced new Refined Sugar TRQReduced Canadian refined sugar exports from an annual
average of 40,000 tonnes under NAFTA to 7,000 tonnes.
Led to 1997 Canada US Understanding . . .
1997‐present10,300 tonne share of refined sugar TRQ

Canadian Sugar Institute
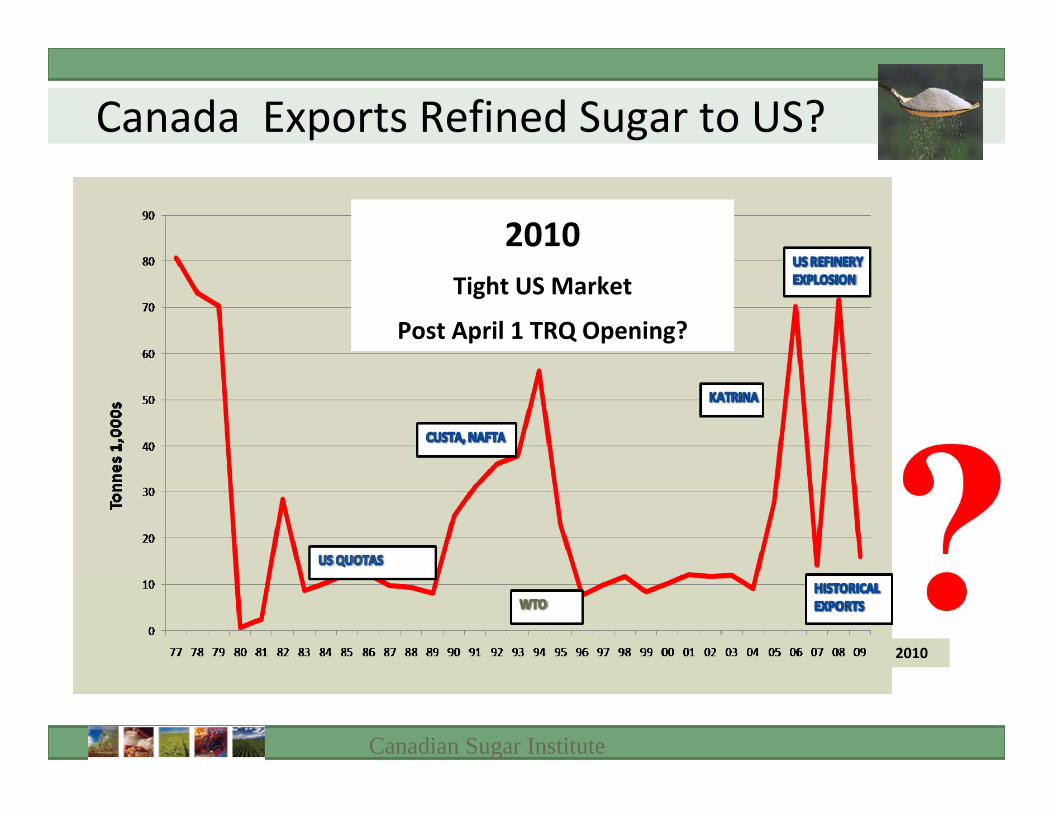
Canada Exports Refined Sugar to US2005/06 and 2007/08 US Market Disruptions
“Unprecedented disruptions” (USDA) to US refining capacity
created short term market openings.
Canadian Sugar Institute
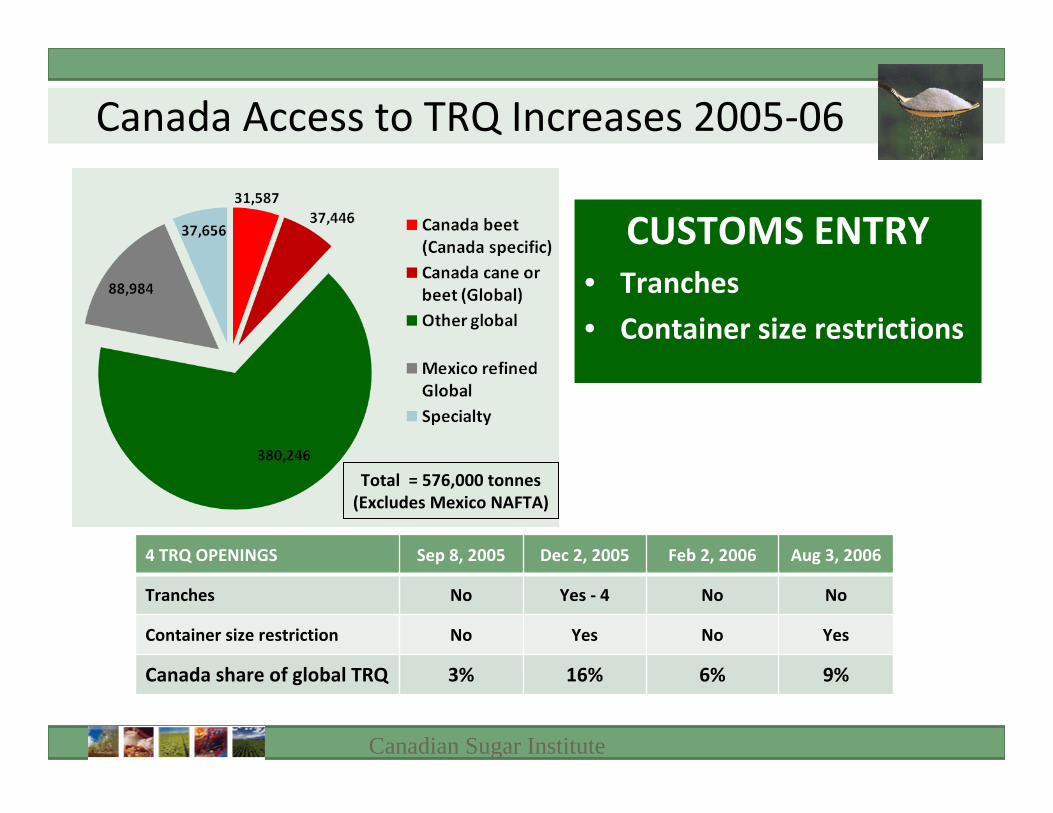
Canada Access to TRQ Increases 2005‐06
Total = 576,000 tonnes(Excludes Mexico NAFTA)
4 TRQ OPENINGS Sep 8, 2005 Dec 2, 2005 Feb 2, 2006 Aug 3, 2006
Tranches No Yes ‐ 4 No No
Container size restriction No Yes No Yes
Canada share of global TRQ 3% 16% 6% 9%
CUSTOMS ENTRY• Tranches
• Container size restrictions

Canadian Sugar Institute
Canada Access to TRQ Increases 2007‐08
Total = 336,000 tonnes(Excludes Mexico NAFTA)
3 TRQ OPENINGS Oct 1, 2007 Aug 14, 2008 Oct 30, 2008
Metric Tonnes 7,090 163,877 68,278
Tranches No No Yes ‐ 5
Container size restriction No Yes/No No
User‐quality white sugar not to be further refined No Yes/No No
Canada share of global TRQ 14% 9% 19%
Sept 18, 2008Customs rescinded conditions for higher quality white sugar and small container sizes.
CUSTOMS ENTRY• Tranches• Container size restrictions• User quality white sugar

Canadian Sugar Institute
Canada Exports Refined Sugar to US
2008‐09Tight US Market but
No Additional Market Opportunity

Canadian Sugar Institute
2008 US Farm Bill – Quota Administration
Legal authority in US Tariff Schedule:• Whenever the Secretary believes that domestic supplies of sugars may be
inadequate to meet domestic demand at reasonable prices, the Secretary may modify any quantitative limitations ... but may not reduce the total amounts below the amounts provided for in subdivision (i) hereof. (i.e., not reduce below minimum WTO commitment)
2008 Farm Bill Responsibilities:• To manage the allotment program to ensure:
– prices are maintained above forfeiture levels AND– to provide “adequate supplies of raw and refined sugar in the domestic market”
Tools:• Adjustments to allotments (upward or downward “in a fair and equitable
manner” but cannot decrease below 85% domestic consumption)• Reassignment of deficits to imports of “raw cane sugar”• Adjustments to Tariff Rate Quotas for “raw cane sugar and refined sugars”
• This is where it gets complicated ...
Canadian Sugar Institute
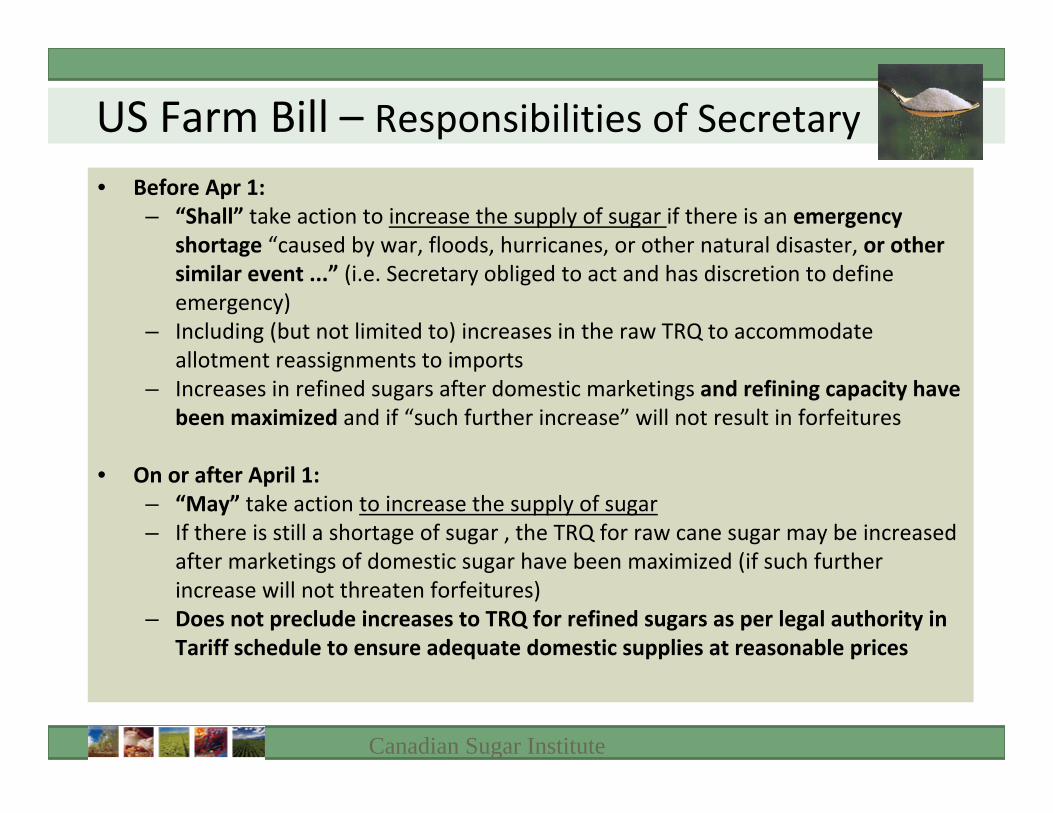
US Farm Bill – Responsibilities of Secretary
• Before Apr 1: – “Shall” take action to increase the supply of sugar if there is an emergency
shortage “caused by war, floods, hurricanes, or other natural disaster, or other similar event ...” (i.e. Secretary obliged to act and has discretion to define emergency)
– Including (but not limited to) increases in the raw TRQ to accommodate allotment reassignments to imports
– Increases in refined sugars after domestic marketings and refining capacity have been maximized and if “such further increase” will not result in forfeitures
• On or after April 1:– “May” take action to increase the supply of sugar– If there is still a shortage of sugar , the TRQ for raw cane sugar may be increased
after marketings of domestic sugar have been maximized (if such further increase will not threaten forfeitures)
– Does not preclude increases to TRQ for refined sugars as per legal authority in Tariff schedule to ensure adequate domestic supplies at reasonable prices
Canadian Sugar Institute
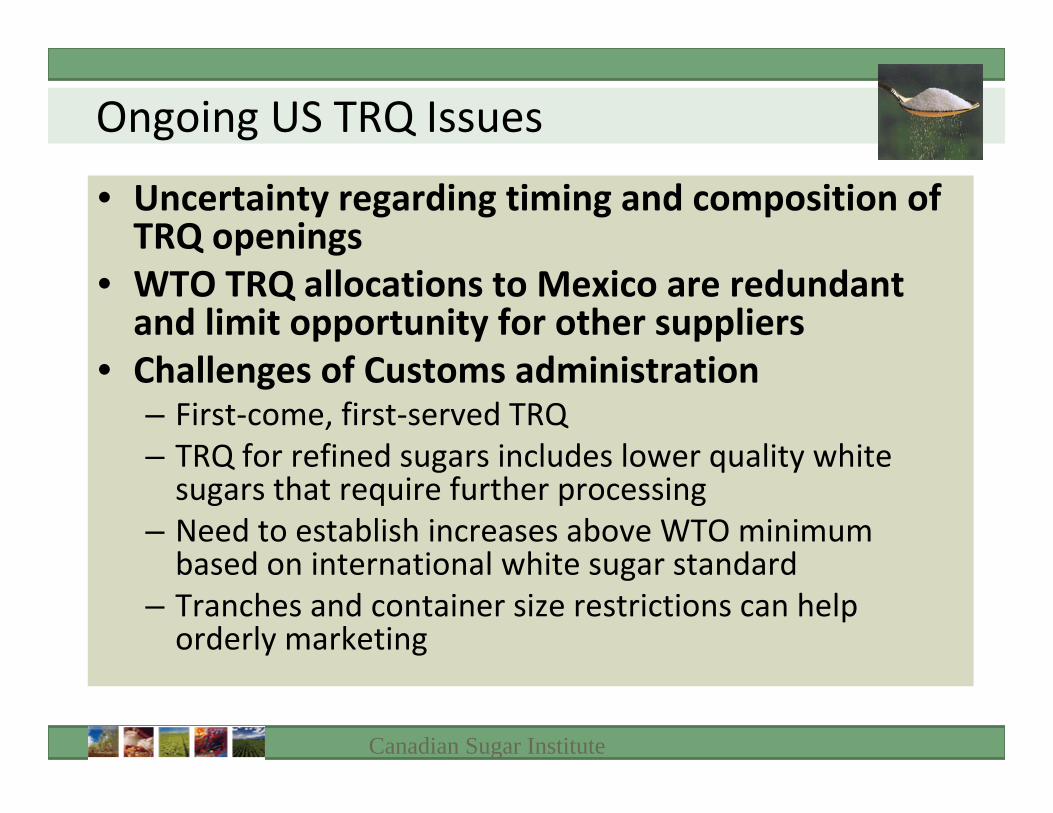
Ongoing US TRQ Issues
• Uncertainty regarding timing and composition of TRQ openings
• WTO TRQ allocations to Mexico are redundant and limit opportunity for other suppliers
• Challenges of Customs administration– First‐come, first‐served TRQ– TRQ for refined sugars includes lower quality white sugars that require further processing
– Need to establish increases above WTO minimum based on international white sugar standard
– Tranches and container size restrictions can help orderly marketing

Canadian Sugar Institute
Projected Ending Stocks to Use FY2010
USDA Monthly Stocks to Use RatioCrop Year (Oct 1 ‐ Sep 30)
Month 00/01 01/02 02/03 03/04 04/05 05/06 06/07 07/08 08/09 09/10
October 15.3 14.1 15.5 20.8 21.8 10.5 16.5 18.2 6.0 7.9
November 18.0 12.7 12.7 19.8 19.2 6.4 17.6 17.8 8.3 9.6
December 20.0 12.5 12.1 20.6 16.5 13.4 18.7 19.4 8.8 9.6
January 18.8 11.6 13.5 20.3 15.6 12.7 17.0 19.0 9.9 10.8Current February 19.4 12.7 14.6 19.7 15.3 16.0 16.0 19.3 9.8 10.0Crop March 19.2 13.9 13.7 19.8 14.5 14.4 16.0 18.8 9.0Year April 18.7 16.9 13.7 20.1 13.8 14.4 16.6 18.6 11.9
Estimates May 18.6 16.0 16.4 22.1 13.1 13.8 16.3 16.4 11.0
June 19.3 16.1 16.0 21.9 13.1 13.2 16.1 15.9 11.0
July 18.6 16.0 16.4 21.6 14.4 13.6 15.3 13.7 10.0
August 18.7 17.2 16.4 21.4 14.1 15.1 15.4 15.0 11.2
September 19.8 16.7 17.5 21.5 14.9 15.5 16.9 14.3 11.8
Final RevisedApril of Next Crop Year
21.0 13.9 16.7 18.6 12.6 16.2 17.3 15.2 13.5 est
Source: USDA WASDE Reports
Canadian Sugar Institute
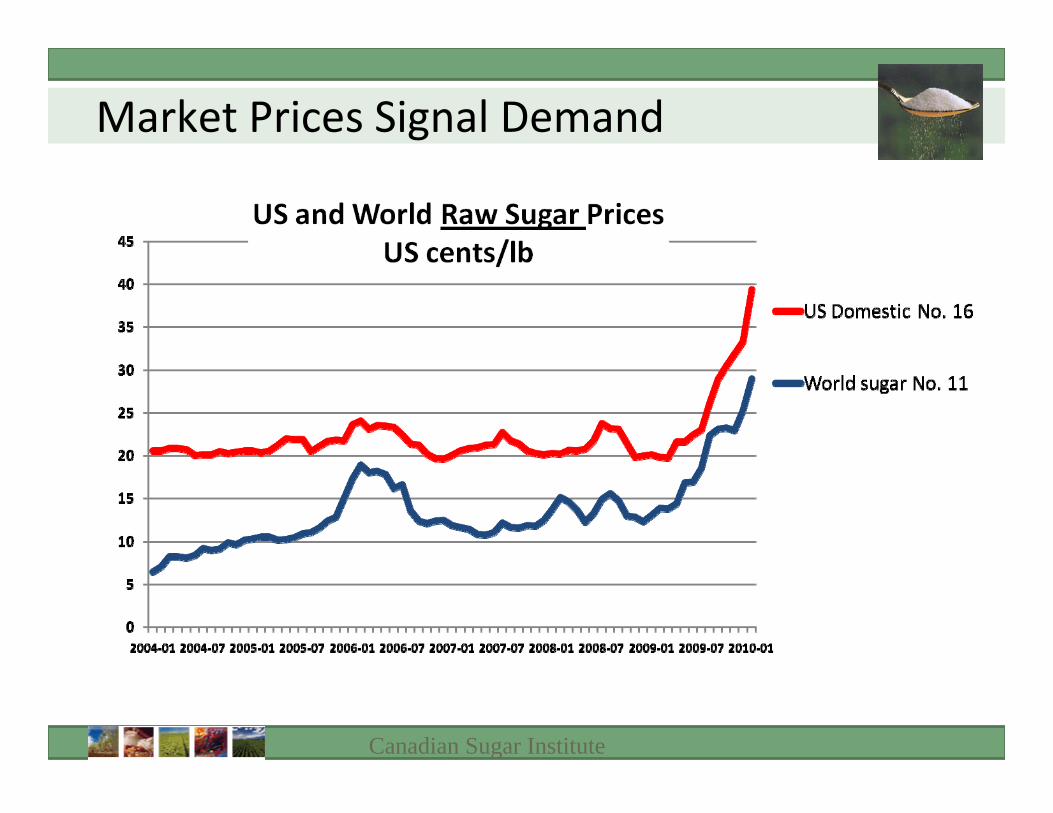
Market Prices Signal Demand
Canadian Sugar Institute
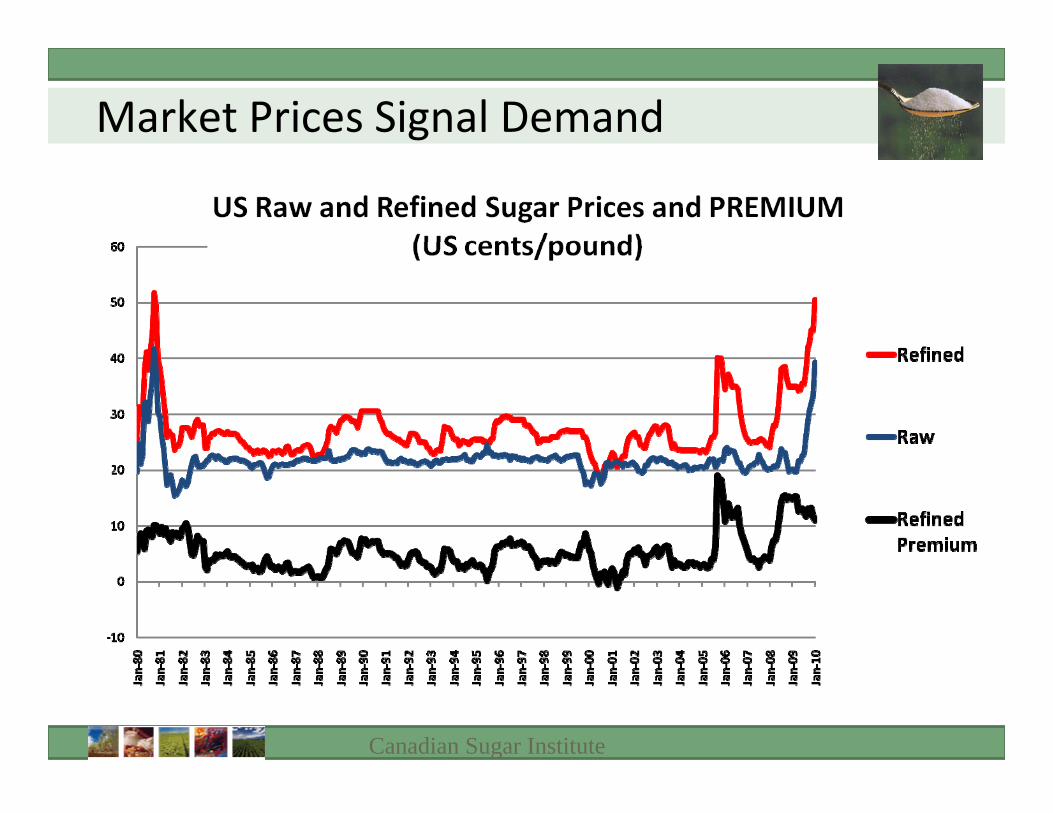
Market Prices Signal Demand

Canadian Sugar Institute
Mexico Cannot Fill US Import Demand
Mexico Sugar Supply and Use and High Fructose Corn Syrup Imports 1/
1,000 metric tons, raw value
Supply Use
Fiscal YearBeginning stocks
Production Imports
Domestic 2/ Exports Stocks
2008/09 est.
Jan 1,975 5,260 160 5,540 1,367 488
Feb 1,975 5,260 160 5,540 1,367 488
2009/10 proj.
Jan 488 5,300 720 5,300 690 518
Feb 488 5,100 720 5,300 490 5181/ U.S. HFCS exports to Mexico (metric tons, dry‐weight basis): Oct‐Nov 2008 = 53,366; Oct‐Nov 2009 = 136,491; Oct‐Sep 2008/09 = 297,231.
2/Includes domestic consumption and Mexico's products export program (IMMEX).
Canadian Sugar Institute
Canada Exports Refined Sugar to US?
2010Tight US Market
Post April 1 TRQ Opening?
2010