canadian societal views and trade-offs for rare disease ... · canadian societal views and...
TRANSCRIPT
Canadian Societal Views and Trade-Offs for Rare Disease Treatment
Shirin Rizzardo.
B.Sc.Pharm. M.Sc (c)
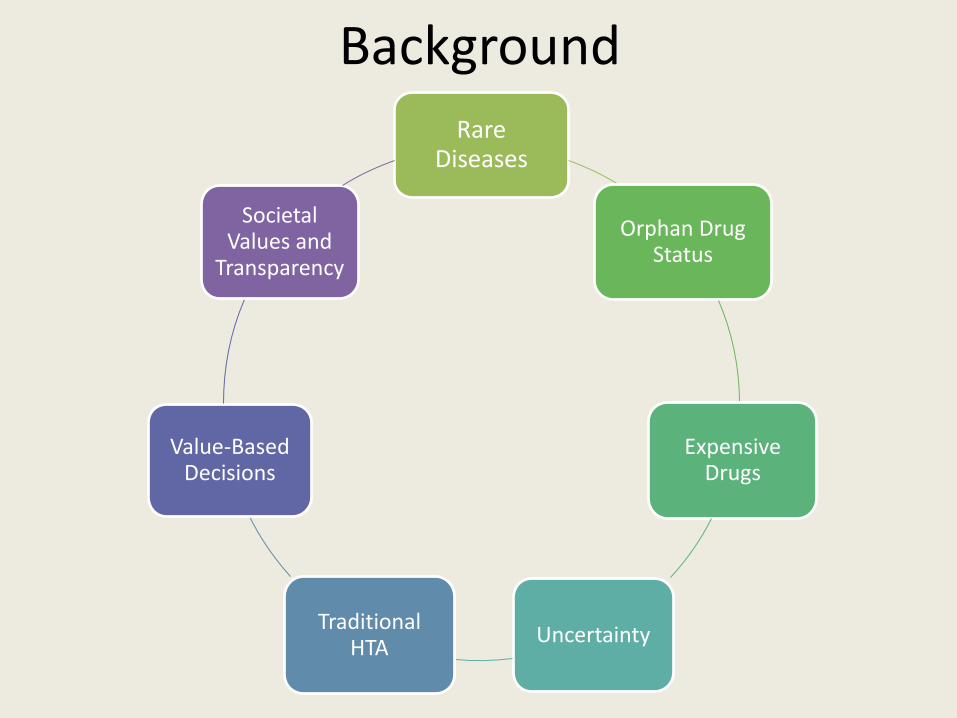
Background
Rare Diseases
Orphan Drug Status
Expensive Drugs
Uncertainty Traditional
HTA
Value-Based Decisions
Societal Values and
Transparency

Rationale and Objectives
• Do Canadians Value Rare Diseases
• Very limited data on societal views on rare disease treatment
• Determine what Canadians are willing to trade-off in order to fund rare disease treatments
• Determine whether society values rarity and accepts the opportunity costs associated with funding of high-cost medications
METHODS Survey
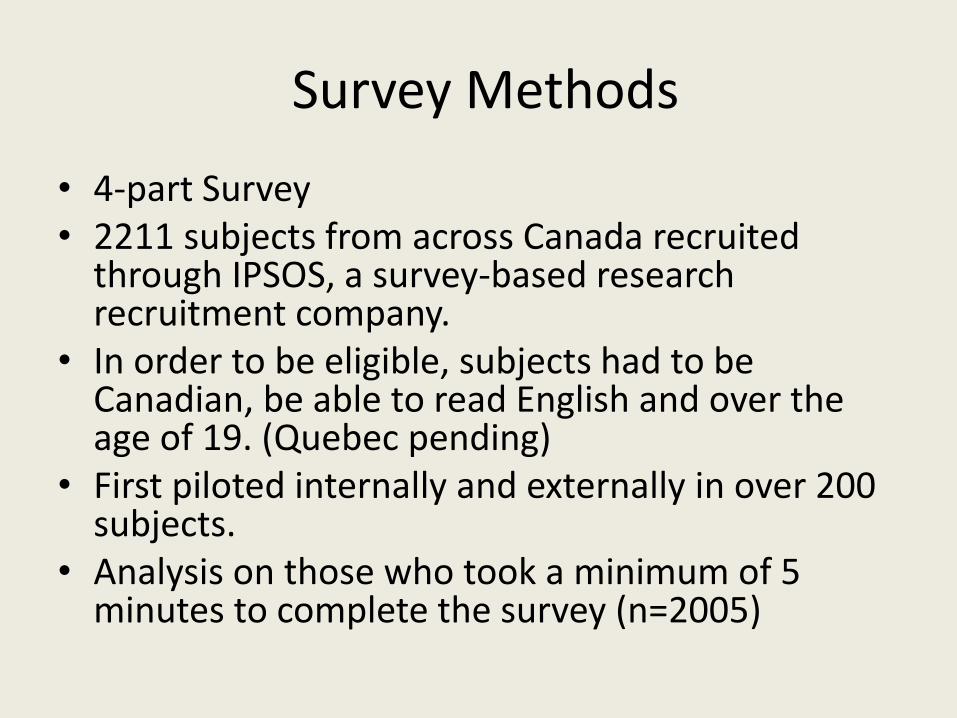
Survey Methods
• 4-part Survey • 2211 subjects from across Canada recruited
through IPSOS, a survey-based research recruitment company.
• In order to be eligible, subjects had to be Canadian, be able to read English and over the age of 19. (Quebec pending)
• First piloted internally and externally in over 200 subjects.
• Analysis on those who took a minimum of 5 minutes to complete the survey (n=2005)

Survey
• 13 values and factors used in decision-making
• Ranking and Analytic hierarchy Process Values
• 2 scenarios; elicit preference for common or rare
• Resource Allocation, Equity and Value Statements
Theoretical Trade Offs
• 13 realistic trade-off questions
• Embedded with values, common/rare/societal Trade Offs
• Payment card method variation
• Randomized starting point WTP

Parameter Level N (%) Mean (SD)
Age 41.7 (14.9)
Sex (% Female) 1067 (53.2)
Have Rare Disease 85 (4.24)
Family or Friend
with Rare Disease
516 (25.7)
Health Status Poor 109 (5.4)
Fair 369 (18.4)
Good 764 (38.1)
very good 557 (27.8)
Excellent 206 (10.3)
Education Elementary 12 (0.6)
High School 571 (28.5)
Some Post-
Secondary
425 (21.2)
Technical 327 (16.3)
Bachelor 468 (23.3)
Masters or
Doctorate
173 (8.6)
Subject Characteristics
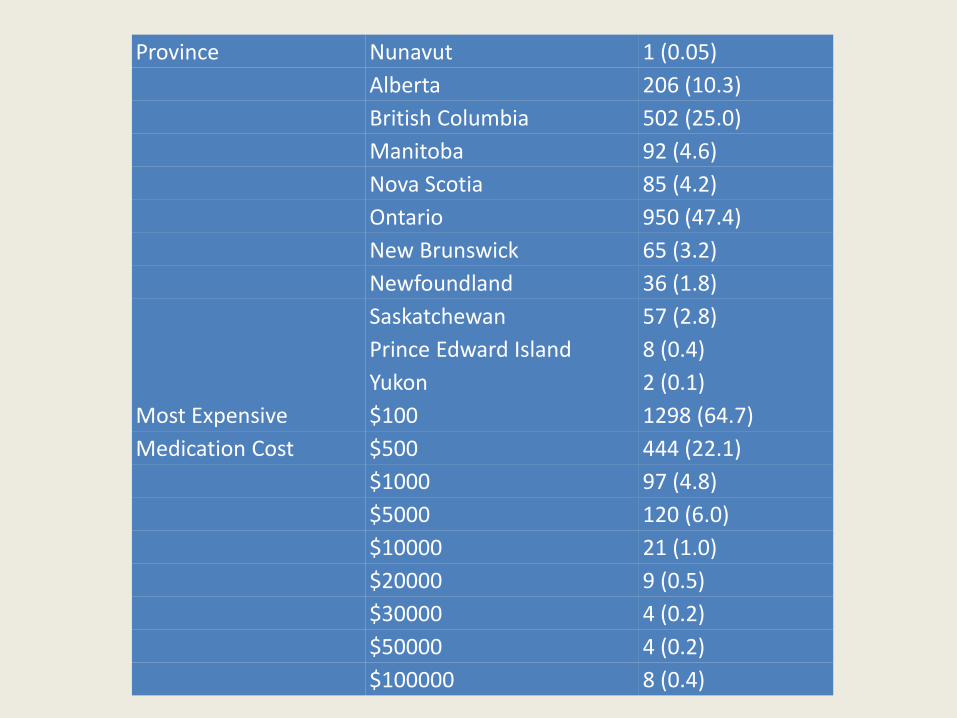
Province Nunavut 1 (0.05)
Alberta 206 (10.3)
British Columbia 502 (25.0)
Manitoba 92 (4.6)
Nova Scotia 85 (4.2)
Ontario 950 (47.4)
New Brunswick 65 (3.2)
Newfoundland 36 (1.8)
Saskatchewan 57 (2.8)
Prince Edward Island 8 (0.4)
Yukon 2 (0.1)
Most Expensive $100 1298 (64.7)
Medication Cost $500 444 (22.1)
$1000 97 (4.8)
$5000 120 (6.0)
$10000 21 (1.0)
$20000 9 (0.5)
$30000 4 (0.2)
$50000 4 (0.2)
$100000 8 (0.4)
RESULTS Values, Value Statements, Resource Allocation
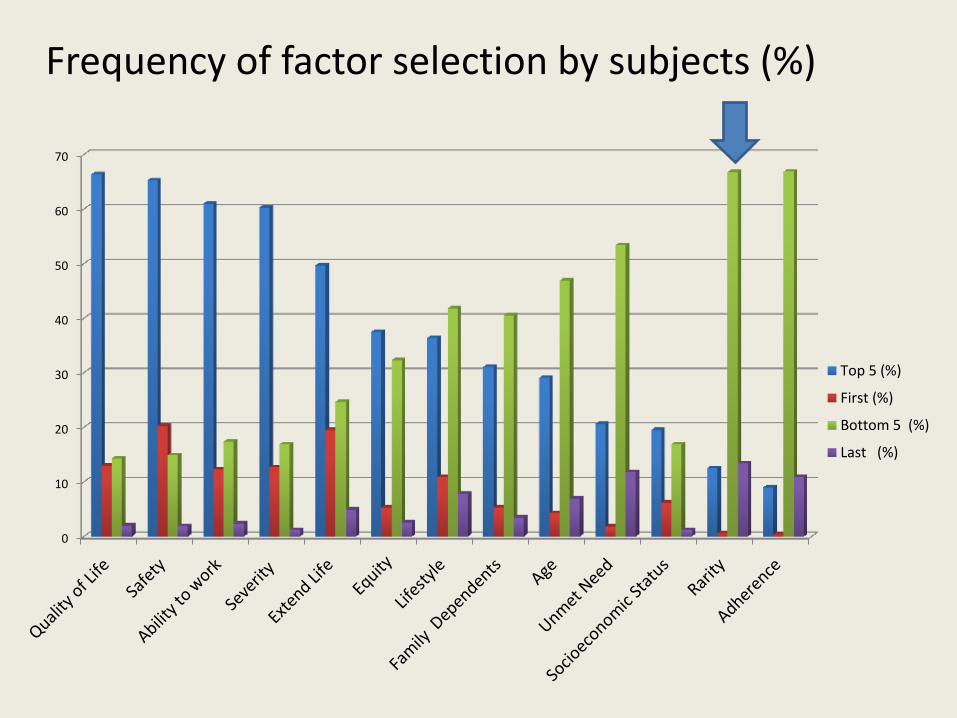
Frequency of factor selection by subjects (%)
0
10
20
30
40
50
60
70
Top 5 (%)
First (%)
Bottom 5 (%)
Last (%)
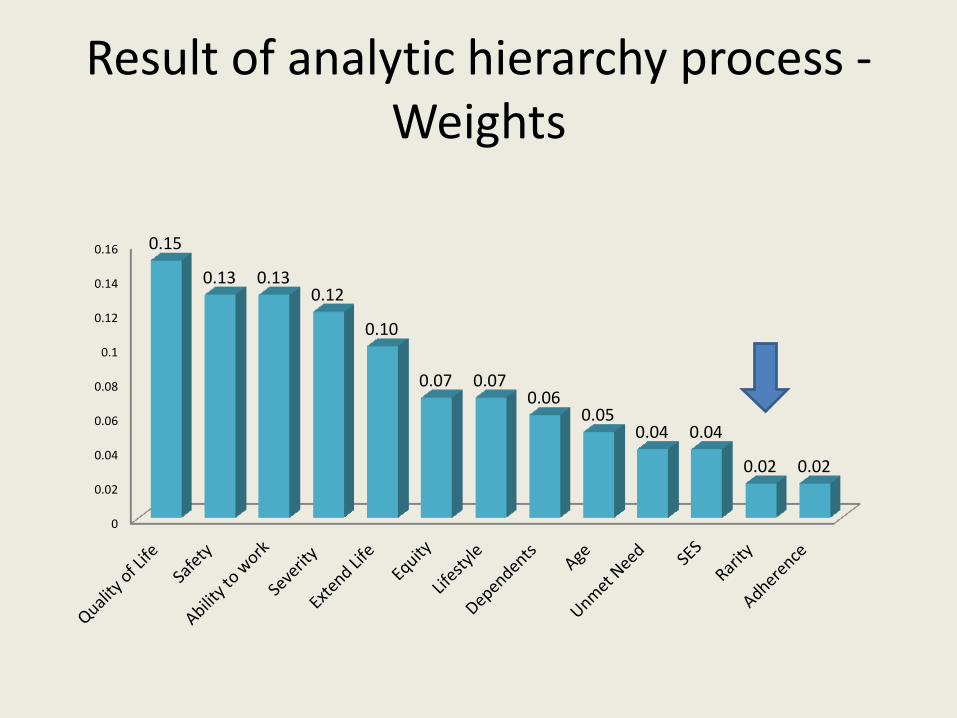
Result of analytic hierarchy process - Weights
0
0.02
0.04
0.06
0.08
0.1
0.12
0.14
0.16 0.15
0.13 0.13 0.12
0.10
0.07 0.07 0.06
0.05 0.04 0.04
0.02 0.02
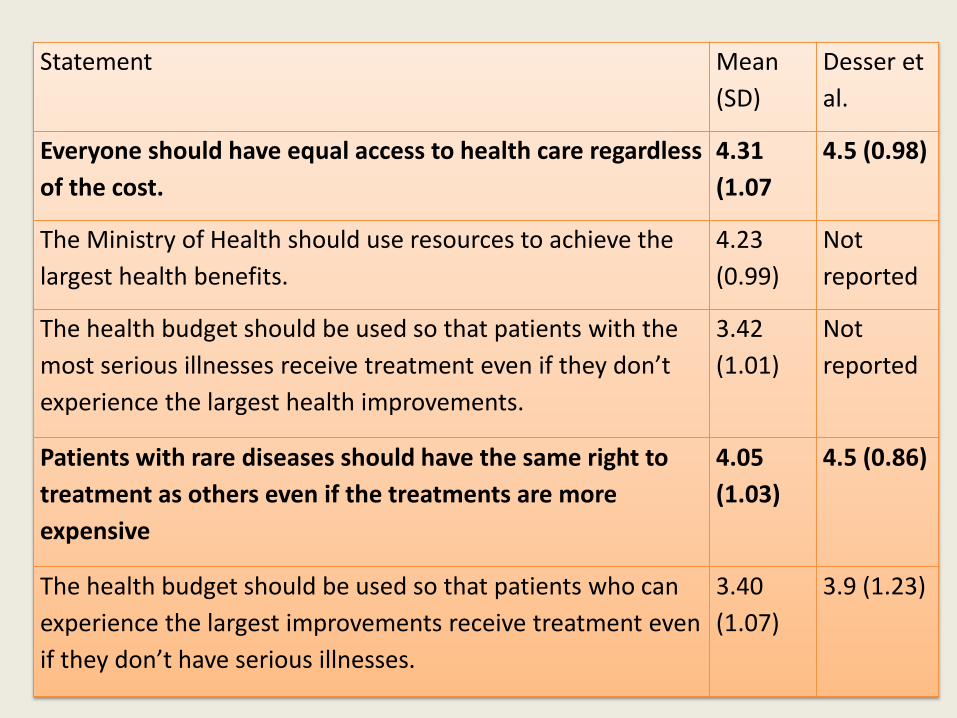
Statement Mean
(SD)
Desser et
al.
Everyone should have equal access to health care regardless
of the cost.
4.31
(1.07
4.5 (0.98)
The Ministry of Health should use resources to achieve the
largest health benefits.
4.23
(0.99)
Not
reported
The health budget should be used so that patients with the
most serious illnesses receive treatment even if they don’t
experience the largest health improvements.
3.42
(1.01)
Not
reported
Patients with rare diseases should have the same right to
treatment as others even if the treatments are more
expensive
4.05
(1.03)
4.5 (0.86)
The health budget should be used so that patients who can
experience the largest improvements receive treatment even
if they don’t have serious illnesses.
3.40
(1.07)
3.9 (1.23)
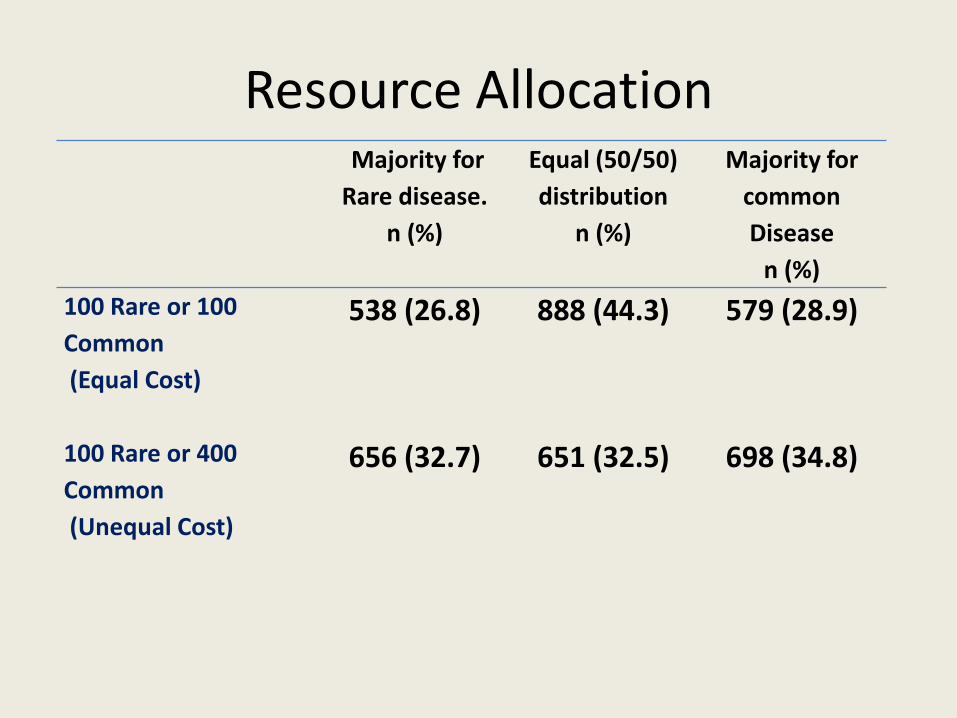
Resource Allocation Majority for
Rare disease.
n (%)
Equal (50/50)
distribution
n (%)
Majority for
common
Disease
n (%)
100 Rare or 100
Common
(Equal Cost)
538 (26.8) 888 (44.3) 579 (28.9)
100 Rare or 400
Common
(Unequal Cost)
656 (32.7) 651 (32.5) 698 (34.8)


Background Summary
• Canadians value equity and funding of rare diseases
• Did not empirically value a rarity as a factor for prioritizing a drug for reimbursement
• Do Canadians accept the opportunity cost of funding rare diseases?
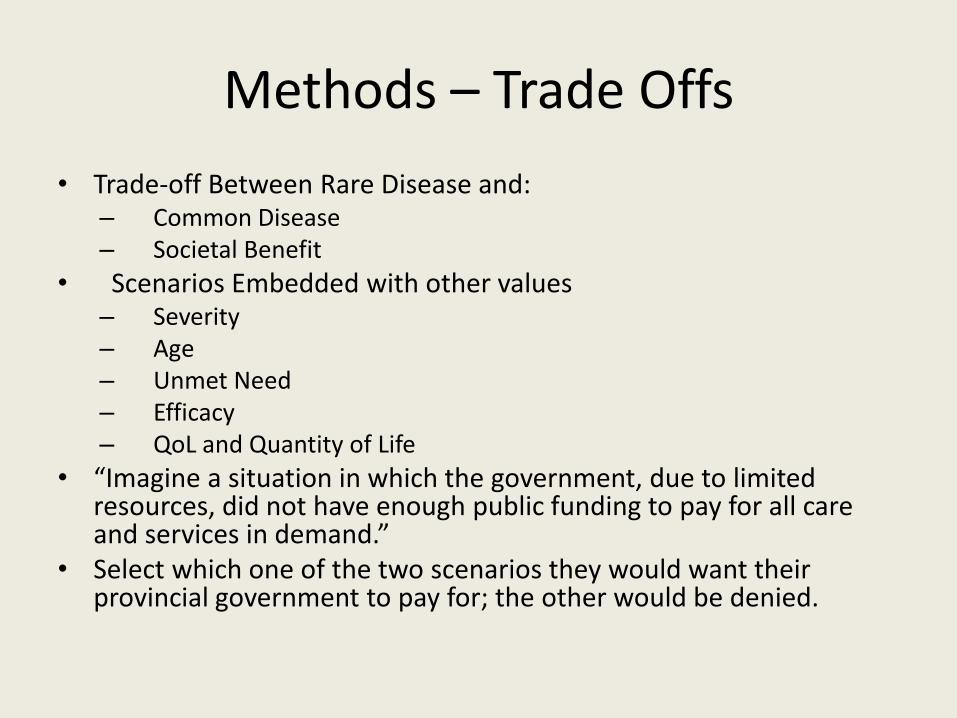
Methods – Trade Offs
• Trade-off Between Rare Disease and: – Common Disease – Societal Benefit
• Scenarios Embedded with other values – Severity – Age – Unmet Need – Efficacy – QoL and Quantity of Life
• “Imagine a situation in which the government, due to limited resources, did not have enough public funding to pay for all care and services in demand.”
• Select which one of the two scenarios they would want their provincial government to pay for; the other would be denied.
RESULTS
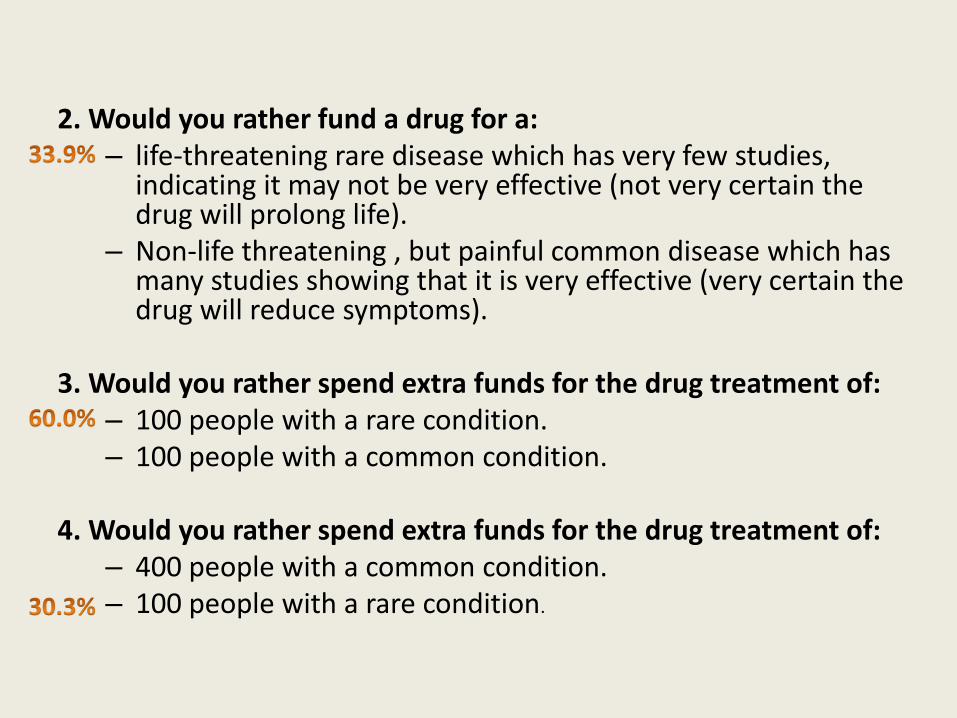
2. Would you rather fund a drug for a:
– life-threatening rare disease which has very few studies, indicating it may not be very effective (not very certain the drug will prolong life).
– Non-life threatening , but painful common disease which has many studies showing that it is very effective (very certain the drug will reduce symptoms).
3. Would you rather spend extra funds for the drug treatment of: – 100 people with a rare condition. – 100 people with a common condition.
4. Would you rather spend extra funds for the drug treatment of:
– 400 people with a common condition. – 100 people with a rare condition.
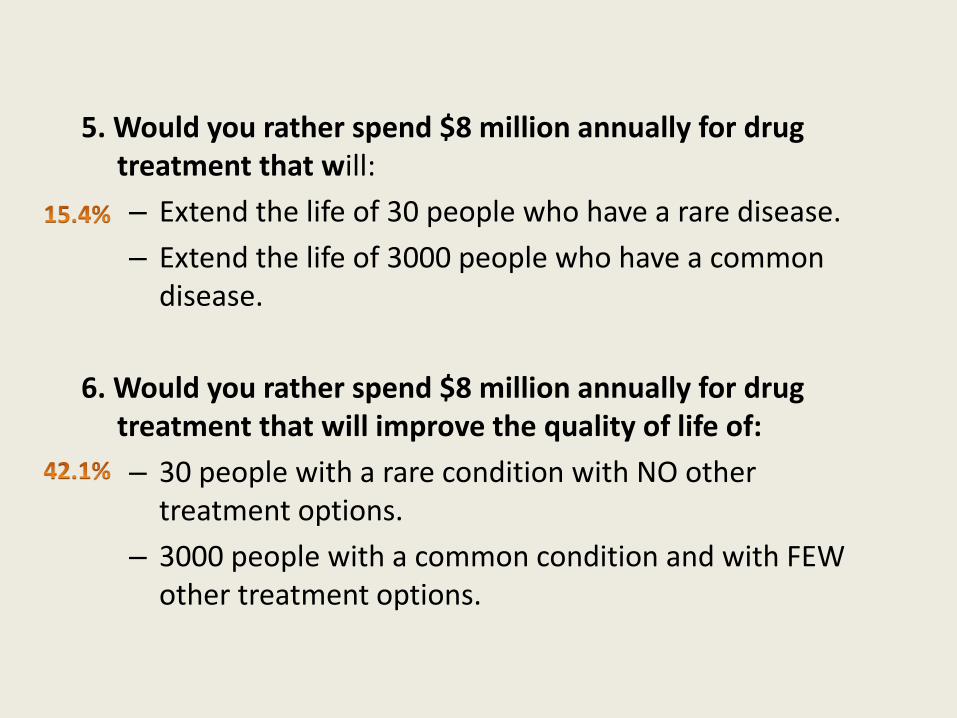
5. Would you rather spend $8 million annually for drug treatment that will:
– Extend the life of 30 people who have a rare disease.
– Extend the life of 3000 people who have a common disease.
6. Would you rather spend $8 million annually for drug treatment that will improve the quality of life of:
– 30 people with a rare condition with NO other treatment options.
– 3000 people with a common condition and with FEW other treatment options.

8. Would you rather fund a new drug treatment, at a cost of $95 million annually to treat: – 250,000 patients with a common fatal disease to extend
their life. – 620 patients with a rare fatal disease to extend their life.
9. Would you rather fund a new drug treatment at a cost of
$95 million annually to improve the quality of life, but not duration of life of: – 250,000 Canadians with a fatal disease of old age. – 620 Canadians with a fatal disease of childhood
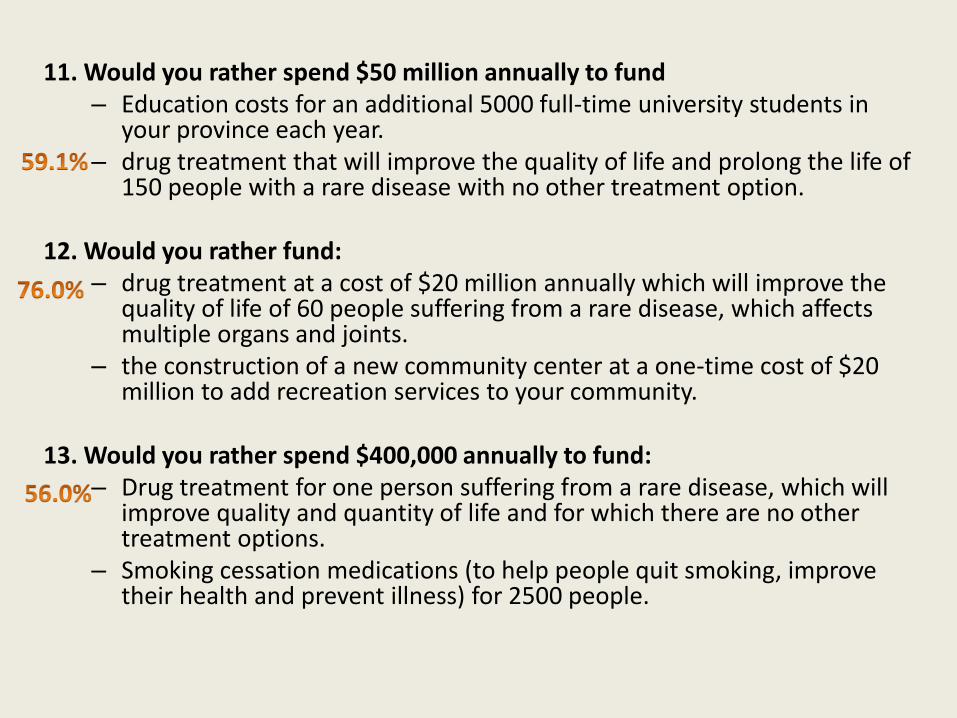
11. Would you rather spend $50 million annually to fund – Education costs for an additional 5000 full-time university students in
your province each year. – drug treatment that will improve the quality of life and prolong the life of
150 people with a rare disease with no other treatment option. 12. Would you rather fund:
– drug treatment at a cost of $20 million annually which will improve the quality of life of 60 people suffering from a rare disease, which affects multiple organs and joints.
– the construction of a new community center at a one-time cost of $20 million to add recreation services to your community.
13. Would you rather spend $400,000 annually to fund:
– Drug treatment for one person suffering from a rare disease, which will improve quality and quantity of life and for which there are no other treatment options.
– Smoking cessation medications (to help people quit smoking, improve their health and prevent illness) for 2500 people.
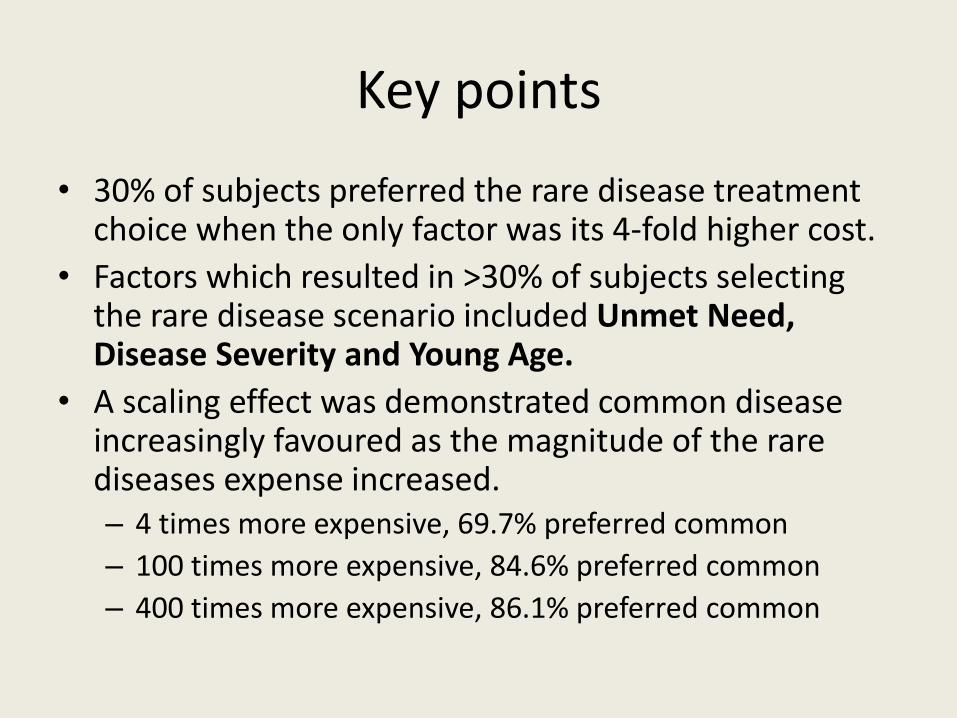
Key points
• 30% of subjects preferred the rare disease treatment choice when the only factor was its 4-fold higher cost.
• Factors which resulted in >30% of subjects selecting the rare disease scenario included Unmet Need, Disease Severity and Young Age.
• A scaling effect was demonstrated common disease increasingly favoured as the magnitude of the rare diseases expense increased. – 4 times more expensive, 69.7% preferred common
– 100 times more expensive, 84.6% preferred common
– 400 times more expensive, 86.1% preferred common

Scenario Age (under 32 to
over 49)
Age2 (ages 32-49 to
over 49)
Have or Know
Rare Disease
Education
1 1.29 (1.03, 1.62)
2 2.21(1.75, 2.81) 1.57(1.24, 2.00) 1.23 (1.01, 1.52)
3 1.29 (1.03, 1.61) 1.32 (1.08, 1.61 1.22 (1.01, 1.47)
4 1.27 (1.03, 1.56) 1.24 (1.01, 1.51)
5 1.64 (2.27, 1.20) 1.62 (1.25, 2.09) 1.47 (1.14, 1.89)
6 1.59 (1.28, 2.0) 1.38 (1.14, 1.68)
7 1.32 (1.06, 1.65) 1.26 (1.03, 1.54) 1.35 (1.12, 1.62)
8 1.69 (1.21, 2.37) 1.67 (1.28, 2.17) 1.48 (1.13, 1.93)
9 1.40 (1.12, 1.78)
10 1.85 (1.9, 2.33) 1.54 (1.22, 1.92) 1.26 (1.04, 1.54)
11 0.63 (0.51, 0.78)
12 0.65 (0.5, 0.85)
13 1.29 (1.07, 1.58)
Multi-logistic regression for likelihood of favouring the Rare Scenario (significant results only)
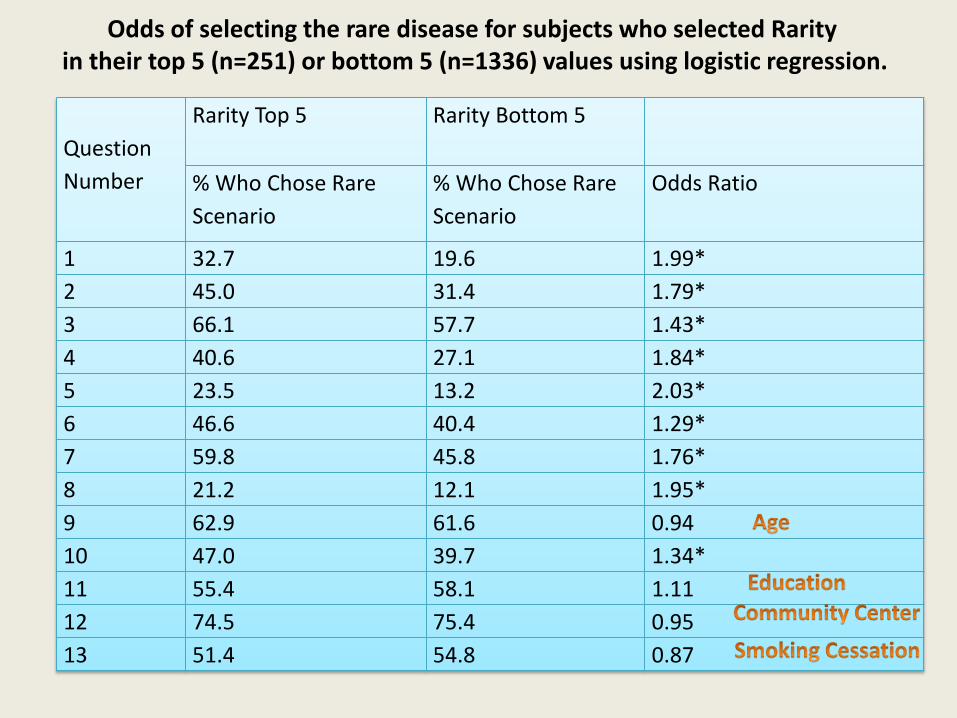
Question
Number
Rarity Top 5 Rarity Bottom 5
% Who Chose Rare
Scenario
% Who Chose Rare
Scenario
Odds Ratio
1 32.7 19.6 1.99*
2 45.0 31.4 1.79*
3 66.1 57.7 1.43*
4 40.6 27.1 1.84*
5 23.5 13.2 2.03*
6 46.6 40.4 1.29*
7 59.8 45.8 1.76*
8 21.2 12.1 1.95*
9 62.9 61.6 0.94
10 47.0 39.7 1.34*
11 55.4 58.1 1.11
12 74.5 75.4 0.95
13 51.4 54.8 0.87
Odds of selecting the rare disease for subjects who selected Rarity in their top 5 (n=251) or bottom 5 (n=1336) values using logistic regression.
Summary
• Preference to maximize the number of patients receiving treatment
• Not willing to accept opportunity cost
• Preferred over a non-healthcare gain
• Equity and fairness important to Canadians

Thank You
Acknowledgments: Dr. Larry Lynd (Supervisor)
Dr. Nick Bansback Dr. Craig Mitton Dr. Carlo Marra
Staff & Students at CORE Funders: CIHR, Pfizer, Merck