canadian hydropower and the clean power plan · hydropower is renewable, non-emitting, flexible,...
TRANSCRIPT

CANADIAN HYDROPOWER AND THE CLEAN POWER PLAN
by
Kyle Aarons Doug Vine Center for Climate and Energy Solutions
April 2015
CEN
TER FOR C
LIMATE A
ND
ENERG
Y SOLU
TION
SC
AN
AD
IAN
HY
DR
OPO
WER
AN
D TH
E CLEA
N PO
WER
PLAN
TECHNOLOGY
CANADIAN HYDROPOWER AND THE CLEAN POWER PLAN
by
Kyle Aarons Doug Vine Center for Climate and Energy Solutions
April 2015

Center for Climate and Energy Solutionsii
© 2015, Center for Climate and Energy Solutions. All Rights Reserved.

Canadian Hydropower and the Clean Power Plan iii
CONTENTS
ACKNOWLEDGEMENTS iv
EXECUTIVE SUMMARY v
INTRODUCTION 1
TECHNOLOGY OVERVIEW 3
IMPORTS OF CANADIAN HYDROPOWER 9
HYDROPOWER IN THE CLEAN POWER PLAN 13
THE CLEAN POWER PLAN’S APPROACH TO INTERNATIONAL HYDROPOWER IMPORTS 19
CONCLUSION 27
ENDNOTES 29

Center for Climate and Energy Solutionsiv
ACKNOWLEDGEMENTS This report was supported by funding from the Canadian Electricity Association, the Canadian Hydropower Association, and Manitoba Hydro, along with institutional funding from a variety of businesses, foundations, and individual donors. C2ES is solely responsible for the contents of this report.

Canadian Hydropower and the Clean Power Plan v
EXECUTIVE SUMMARYHydropower makes up a sizable share of the U.S. electricity supply. A significant portion of this is imported from Canada, which is linked to the U.S. electricity grid through dozens of connections along the border. Expansion of this resource is possible in both nations, though greater quantities are expected to be developed in Canada in the near future. As a zero-emission, dispatchable, baseload power source, hydropower has the potential to play an impor-tant role as states seek to reduce power sector emissions to comply with the Environmental Protection Agency’s (EPA) proposed Clean Power Plan. The proposed Clean Power Plan would require states to achieve certain power sector emission rates by 2030. It is unclear how imported hydropower might be leveraged by states to help them achieve their targets. This report assesses the benefits and challenges of hydropower generally, explores the potential for increased imports from Canada driven by the Clean Power Plan, looks at ways the proposed rule could be adjusted to take advantage of this resource, and analyzes the impact of additional imports on selected states.
HYDROPOWER FACTS AND STATISTICS
Hydropower is renewable, non-emitting, flexible, reliable, and cost-competitive with other sources of electricity. The flexibility and energy storage associated with hydropower projects allow generation to be adjusted quickly, meaning it can reliably complement intermittent renewable sources such as wind and solar. Historical challenges of hydropower include environmental damage and the displacement of communities due to flooding to create reservoirs, though power companies have been working to address these concerns and mitigate facilities’ impacts. While there are no direct greenhouse gas emissions from hydropower, there are some indirect emissions for the first couple of years after construction due to the decomposition of a fraction of the flooded biomass. On a lifecycle basis, hydropower emis-sions are on par with wind generation and lower than those of solar photovoltaic generation.
Hydropower currently contributes about 6.6 percent of total U.S. generation, which is about 20 percent of U.S. zero-emission electricity. While there is significant technical potential to increase U.S. hydropower production, the likelihood of new large-scale facilities is limited by environmental challenges, high up-front capital costs, and long construction times. Instead, increased capacity in the United States will likely come through a combination of upgrades at existing hydropower projects, the installation of power houses at dams that are not currently used for electricity production, and run-of-the-river projects.
Canada’s current hydropower capacity is about the same as that of the United States, but it makes up a much larger share of Canada’s electricity system due to its smaller size relative to the U.S. system. Hydropower contributes about 62.5 percent of Canadian electricity generation, which is about 80 percent of Canadian zero-emission electricity. About 10 percent of total Canadian generation, from hydropower and other sources, is exported to the United States, where it makes up about 1.5 percent of the U.S. electricity system.
Canada’s hydropower capacity has been growing in recent years, and that growth is projected to continue. Canada added more than 5,500 megawatts (MW) of capacity between 2003 and 2013, which is enough to power about 2.4 million homes. As of early 2015, more than 4,000 MW of new hydropower capacity is either under construction or nearing the construction phase. An additional 7,000 MW of new capacity is in provisional stages of development, meaning it is in early stages of development or has been announced, but may not necessarily be completed.
The electricity grids and markets across the United States-Canada border are tightly integrated. Although elec-tricity flows in both directions, Canada is a net exporter. Exports to the United States have generally been increasing since 1990, and are currently near 60 million megawatt-hours annually. Increasing exports is subject to physical, financial, policy, and political constraints that are largely centered on large transmission projects. Several transmis-sion projects in development could increase the flow of Canadian hydropower into the United States. They include

Center for Climate and Energy Solutionsvi
the Champlain Hudson Power Express, a 1,000 MW line from the Canadian border to New York City, expected to go into service in 2017, and the Great Northern Transmission Line, recently approved by the Federal Energy Regulatory Commission (FERC), which will provide 883 MW of capacity between Manitoba and Minnesota.
U.S. AND IMPORTED HYDROPOWER AND THE CLEAN POWER PLAN
EPA’s proposed Clean Power Plan, set to be finalized during the summer of 2015, would set a unique target emission rate for the power sector of each state. In general, the proposal authorizes states to fully leverage non-hydro renew-able generation in order to demonstrate compliance with their target emission rates. Hydropower, on the other hand, would only be fully credited if put in place after the proposal was issued in June 2014. While new hydropower would therefore be more valuable for compliance than existing hydropower, generation from existing plants would still help states reduce power sector emissions to the extent that it precludes demand for fossil generation.
The proposed Clean Power Plan does not take a firm stance on the treatment of imported hydropower, and instead solicits stakeholder feedback on this point. There appear to be three paths EPA could take:
1. Treat imported hydropower the same as interstate hydropower, including it as a qualifying resource when coming from new capacity, but not when coming from existing capacity;
2. Do not include internationally imported hydropower as a qualifying resource in any circumstance; or
3. Include internationally imported hydropower from both new capacity and existing capacity that had not previ-ously been fully utilized.
Of the dozens of sets of public comments reviewed on this topic, no stakeholder supports a categorical exclusion of international hydropower. Stakeholder comments include concerns relating to the double counting of emission reductions and the leakage of emissions caused by the shuffling of resources within Canada to increase the export of hydropower without any associated emission reductions. However, the existing electricity tracking systems could be used to prevent double counting, and the existing resource mix in exporting provinces, combined with provincial and Canadian greenhouse gas policies, makes leakage very unlikely. In addition to allowing full compliance credit for imports from new hydropower projects, EPA could encourage states to pursue new transmission projects and long-term contracts by crediting imports from existing hydropower capacity that is not currently being fully leveraged.
New Canadian hydropower imports could have a significant impact on the emission rates of importing states. For example, a hypothetical addition of 250 MW of imported hydropower electricity could help Massachusetts reduce its power sector emission rate by about 10 percent, moving it 32 percent of the way toward its proposed 2030 target. In Minnesota, imports from a new 250 MW project could help reduce power sector emissions by 5 percent, which would move the state 19 percent of the way toward its proposed 2030 target. To enable these and other states to take advantage of Canadian hydropower, EPA would need to clarify that new imports can fully qualify for compliance.

Canadian Hydropower and the Clean Power Plan 1
INTRODUCTIONHydropower has been an important source of electricity in the United States for more than a century. Typically, plants have very high upfront capital costs and large physical environmental footprints relative to other sources of electric power, but provide zero-emission, low-cost, reliable electricity once constructed. While there is significant technical potential for new proj-ects and expansions of existing hydropower plants, only around 2,300 MW of new domestic capacity is expected to be added between now and 2040 under a business-as-usual scenario.1
Growing domestic hydropower capacity is not commonly discussed as an approach to reducing power sector emissions, even as other zero- and low-carbon energy measures are considered to address the U.S. Environmental Protection Agency’s (EPA) proposed Clean Power Plan. The Clean Power Plan, announced by EPA in June 2014 and scheduled to be finalized in the summer of 2015, would set a target emission rate for the electric power sector of each state based on a number of factors, including the potential of each state to expand its renewable energy (RE) generation. Overall, the Clean Power Plan is projected to reduce power sector emissions 30 percent by 2030 relative to 2005 levels, primarily by increasing the use of natural gas, renewables, and energy
efficiency. Though the Clean Power Plan is a federal rule, its implementation will be managed by states, leaving many of the major policy decisions to state governments.
Canadian hydropower is projected to increase about 8,000 MW by 2035 under a business-as-usual scenario.2 Canada already exports a significant amount of hydro-power to the United States and has the ability to greatly increase this by harnessing a fraction of its potential. Some technical and policy hurdles stand in the way of increased hydropower imports to the United States, but demand for zero-carbon electricity driven by the Clean Power Plan could spur action to overcome these hurdles.
This brief assesses the potential for states to use hydropower imported from Canada as part of their strategy to implement EPA’s Clean Power Plan. The first section provides an overview of hydropower technology, discussing its benefits and challenges. Next, this brief explores existing Canadian electricity imports and the potential for expansion. The third section summarizes the relevant aspects of the Clean Power Plan and EPA’s proposed treatment of domestic and imported hydro-power. The final section analyzes the impact of potential changes to the proposed Clean Power Plan on how states can leverage Canadian hydropower to reduce their power sector emissions.

Center for Climate and Energy Solutions2

Canadian Hydropower and the Clean Power Plan 3
TECHNOLOGY OVERVIEWA technology used to generate electricity for more than 130 years, hydropower is a renewable source of energy that does not directly emit greenhouse gases or other air pollutants. Hydropower facilities can be scheduled to produce power as needed—depending on water avail-ability—providing system operators with a reliable and flexible source of electricity or energy storage.
Hydropower makes use of dams to capture the energy of flowing water in rivers and streams as it descends from higher elevations toward sea level to generate electricity. As water travels downstream, it is channeled through an intake structure (penstock) in the dam (Figure 1). The falling water turns the blades of a turbine, generating electricity in the power house, located at the base of the dam.
The amount of electricity generated by a hydro-power facility depends on three factors: 1) the turbine maximum generating capacity; 2) the discharged flow
(the volume of water passing through the turbines in a given amount of time), and 3) the site head (the height of the water source or vertical distance between the highest point of water source and the turbine). The higher the head, the more gravitational energy any given amount of water has as it passes through the turbine. Modern hydropower facilities can convert about 90 percent of the energy of falling water into electricity, which makes it a technically efficient energy source.3
There are several types of hydropower facilities. Conventional hydropower plants can be built in rivers with no water storage (known as “run-of-the-river” units) or in conjunction with high- or low-storage reservoirs, which can be used on an as-needed basis. Reservoir storage can be designed to last for days, weeks, months or even over a period of multiple years. Additionally, hydropower head or elevation can vary significantly.4
FIGURE 1: Hydroelectric Power Generation
Source: Environment Canada, “Hydroelectric Power Generation.” March 2014. Available at: http://water.usgs.gov/edu/wuhy.html

Center for Climate and Energy Solutions4
In the United States, only 3 percent of the dams have associated hydropower plants and generate electricity. The vast majority of existing dams are used for irriga-tion and flood control as well as for other domestic and industrial uses. Dams in Canada, particularly in the Upper Columbia River in British Columbia, provide important flood control for cities like Portland, Oregon, in the United States.5
BENEFITS AND CHALLENGES
Hydropower has many well-known benefits. It is a renew-able, non-emitting energy source that is both flexible and reliable with the added characteristic of being able to provide energy storage.6 However, it also presents environmental challenges, it is capital intensive, and facilities take a long time to construct.
Hydropower is considered a renewable source of energy, as it relies on water, which is continuously renewed through the natural water cycle.7 It is a clean source of energy since it combusts no fuel and produces
no direct greenhouse gas emissions, other pollutants, or waste like those associated with fossil fuels or nuclear power. However, hydropower does produce indirect greenhouse gas emissions, mainly during construction and flooding of the reservoirs due to decomposition of a fraction of the flooded biomass.8 Additionally, land use change (e.g. removal of native forests and/or grasslands) permanently alters natural carbon sinks. Compared to other renewables, on a lifecycle basis hydropower releases fewer greenhouse gases than electricity generation from biomass and solar and about the same as emissions from wind and geothermal plants (Figure 2).9
Hydropower is mainly criticized for its negative environmental impacts on local people (displacement), ecosystems, and habitats. Whether it is a run-of-the-river or a reservoir project, damming a river alters its natural flow regime and temperature, which in turn changes the aquatic habitat.10 Such change disturbs the river’s natural flora and fauna. Fish are sensitive to hydropower opera-tions, and fish species (especially migratory species) have been significantly affected by hydropower dams.
FIGURE 2: Lifecycle Greenhouse Gas Emissions by Electricity Generating Technology
Estimated range (minimum to maximum) of total lifecycle (from construction through useful operations to facility retirement and reclamation) greenhouse gas emissions by electricity generating technology.
Source: IPCC, Summary for Policymakers, Figure SPM.8, 2011

Canadian Hydropower and the Clean Power Plan 5
Generally, smaller facilities with smaller reservoirs have less energy output and fewer negative environmental impacts than large hydropower facilities with large reservoirs, but even they can engender public concern.11 In the case where a reservoir is created, land above the dam is flooded to varying degrees, which may lead to the displacement of local people, towns, infrastructure, productive agricultural land, and hunting grounds.
Electricity demand fluctuates daily, seasonally, and regionally depending on several factors, most signifi-cantly temperature and the hour of the day. One of the advantages of hydropower over other sources of elec-tricity (e.g., variable wind and solar power or baseload coal and nuclear plants) is its generation flexibility. Such flexibility enables hydropower to meet sudden fluctua-tions in demand or to help compensate for the loss of power from other sources. Due to its rapid response time and storage capacity, hydropower can be used for base-load and peak generation. When a facility is not being called on to generate electricity, water will continue to
collect in its reservoir. This can be used at a later time on as-needed basis, effectively providing a source of energy storage to the electricity system.
Compared to other sources of electricity, hydropower has high initial capital costs.12 Nevertheless, its vari-able costs, which are the costs required to operate and maintain a facility (including fuel costs) are very low. In fact, hydropower is competitive with other technologies on a levelized cost basis (Figure 3), a measure for making an apples-to-apples comparison of diverse technologies.13 In the figure, levelized costs represent the present value of the total cost of building and operating a generating plant over an assumed financial life and duty cycle.14 They reflect overnight capital cost, fuel cost, fixed and variable operation and maintenance costs, financing costs, and an assumed utilization rate for each plant type. The availability of various incentives including state or federal tax credits can also impact the calculation of levelized cost.15 The range of values shown below do not incorporate any such incentives, nor do they include
FIGURE 3: Estimated Levelized Cost of Electricity for New Generation Entering Service in 2019
U.S. average estimated levelized costs (2012 USD/MWh) for plants entering service in 2019.
Source: U.S. Energy Information Administration, “Levelized Cost and Levelized Avoided Cost of New Generation Resources in the Annual Energy Outlook 2014.” April 2014. Available at: http://www.eia.gov/forecasts/aeo/electricity_generation.cfm
2012
USD
/MW
h
0
50
100
150
200
250
Conv
entio
nal C
oal
Adva
nced
Coa
l
Adva
nced
Coa
l with
CCS
Conv
entio
nal C
ombi
ned
Cycl
e
Adva
nced
Com
bine
d Cy
cle
Adva
nced
CC
with
CCS
Conv
entio
nal C
ombu
stio
n Tu
rbin
e
Adva
nced
Com
bust
ion
Turb
ine
Adva
nced
Nuc
lear
Geo
ther
mal
Biom
ass
Win
dW
ind-
Offs
hore
Sola
r PV
Sola
r The
rmal
Hyd
ro
Levelized capital cost
Transmission investmentVariable O&M (including fuel)Fixed O&M
Center for Climate and Energy Solutions6
potential costs such as a price on carbon, but do include an array of other assumptions.16
Whether a hydroelectric or other technology power plant is constructed depends on a range of factors. Compared to other facilities, hydropower takes longer to construct. For example, large natural gas power plants can be constructed relatively quickly, in as little as 20 months, while typical small hydro projects can take four or more years.17 Obtaining the necessary regulatory approval is often more challenging for hydropower facili-ties, as environmental reviews tend to be more rigorous. Moreover, droughts or periods of low water availability, as well as competition for scarce water (e.g. from agri-culture interests) can also be a concern for hydropower developers in some regions. Finally, transmission lines required to deliver power from (often) remote hydro-power facilities to demand centers is another important consideration, as they can be difficult to site (e.g., face local, regulatory and environmental hurdles) and costly to install.
GENERATION AND CAPACITY
U.S. Hydropower
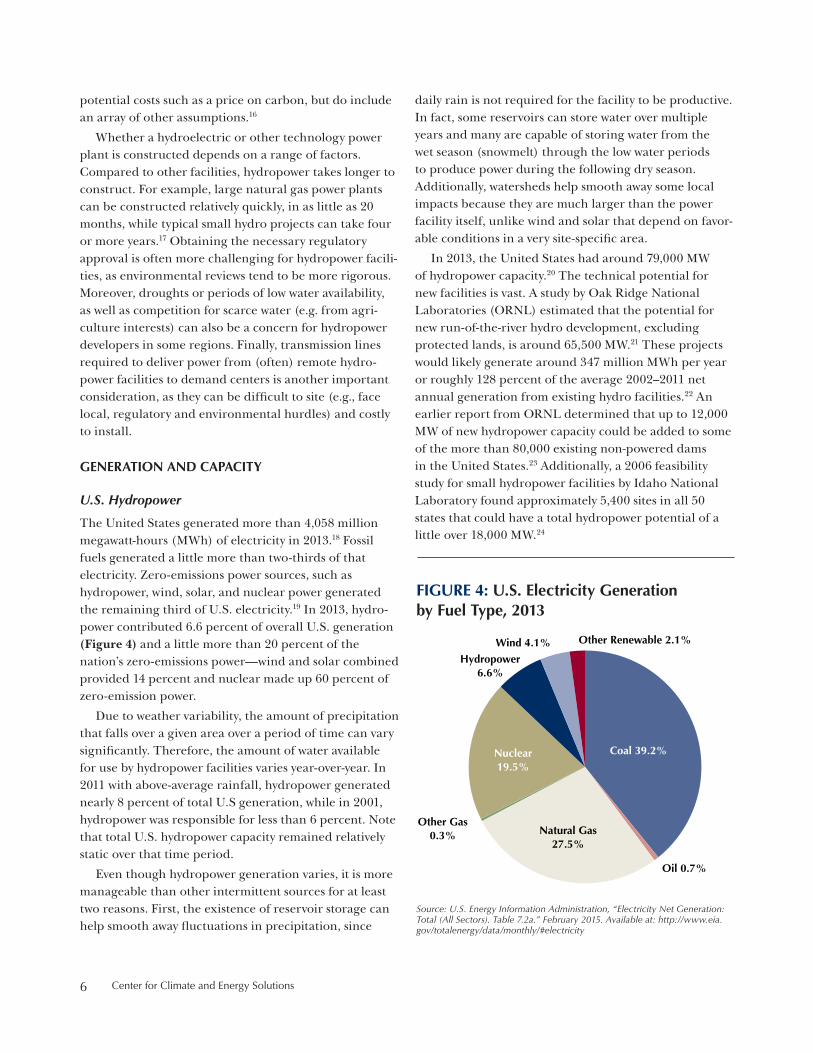
The United States generated more than 4,058 million megawatt-hours (MWh) of electricity in 2013.18 Fossil fuels generated a little more than two-thirds of that electricity. Zero-emissions power sources, such as hydropower, wind, solar, and nuclear power generated the remaining third of U.S. electricity.19 In 2013, hydro-power contributed 6.6 percent of overall U.S. generation (Figure 4) and a little more than 20 percent of the nation’s zero-emissions power—wind and solar combined provided 14 percent and nuclear made up 60 percent of zero-emission power.
Due to weather variability, the amount of precipitation that falls over a given area over a period of time can vary significantly. Therefore, the amount of water available for use by hydropower facilities varies year-over-year. In 2011 with above-average rainfall, hydropower generated nearly 8 percent of total U.S generation, while in 2001, hydropower was responsible for less than 6 percent. Note that total U.S. hydropower capacity remained relatively static over that time period.
Even though hydropower generation varies, it is more manageable than other intermittent sources for at least two reasons. First, the existence of reservoir storage can help smooth away fluctuations in precipitation, since
daily rain is not required for the facility to be productive. In fact, some reservoirs can store water over multiple years and many are capable of storing water from the wet season (snowmelt) through the low water periods to produce power during the following dry season. Additionally, watersheds help smooth away some local impacts because they are much larger than the power facility itself, unlike wind and solar that depend on favor-able conditions in a very site-specific area.
In 2013, the United States had around 79,000 MW of hydropower capacity.20 The technical potential for new facilities is vast. A study by Oak Ridge National Laboratories (ORNL) estimated that the potential for new run-of-the-river hydro development, excluding protected lands, is around 65,500 MW.21 These projects would likely generate around 347 million MWh per year or roughly 128 percent of the average 2002–2011 net annual generation from existing hydro facilities.22 An earlier report from ORNL determined that up to 12,000 MW of new hydropower capacity could be added to some of the more than 80,000 existing non-powered dams in the United States.23 Additionally, a 2006 feasibility study for small hydropower facilities by Idaho National Laboratory found approximately 5,400 sites in all 50 states that could have a total hydropower potential of a little over 18,000 MW.24
FIGURE 4: U.S. Electricity Generation by Fuel Type, 2013
Source: U.S. Energy Information Administration, “Electricity Net Generation: Total (All Sectors). Table 7.2a.” February 2015. Available at: http://www.eia. gov/totalenergy/data/monthly/#electricity
Coal 39.2%
Oil 0.7%
Natural Gas27.5%
Nuclear19.5%
Other Gas0.3%
Hydropower6.6%
Wind 4.1% Other Renewable 2.1%

Canadian Hydropower and the Clean Power Plan 7
In spite of the vast potential, the U.S. Energy Information Administration (EIA) expects that around 2,300 MW of hydro capacity will be added between now and 2040 under a business-as-usual scenario; in 2040 hydropower is expected to generate about 1 percent less of total U.S. electricity than it did in 2013.25 High upfront costs, regulations, and cheaper alternatives like natural gas combined cycle plants are among the reasons for the limited supply additions.
Canadian Hydropower
Canada generated more than 620 million MWh of electricity in 2013.26 More than three-quarters of elec-tricity generation came from extremely low emission sources, while fossil fuels made up around 20 percent (Figure 5). Over the past dozen years, hydropower has contributed between 58 and 63 percent of total Canadian electricity generation.27 Policies that Canada has put in place, discussed further below, are projected to make its electricity generation even cleaner.
Like other regions, Canada is not immune to weather variability. The potential for drought and excessive rainfall exists in Québec, Ontario, British Columbia, Manitoba, and Newfoundland and Labrador—the primary hydropower producing provinces.
To ensure security of electricity supply from hydro-power generation assets, electric utilities make use of the historical record of watershed precipitation (decades of inflow data) to establish a planning baseline. This base-line may be established by taking the lowest, average or median flow on record and provides assurance that the utility’s hydropower facilities will be able to adequately meet their electricity demand. Without fail, utilities want to ensure that they have sufficient hydropower capacity to meet expected demand even under extremely low inflow conditions. As a result of this conservative planning approach, there is often excess energy that is generated and sold under higher than baseline flow conditions. Note that some hydropower facilities also have multiple-year reservoir storage available, which greatly reduces the risk of having to reduce production during low water years.
Canada, which has a population around one-ninth the size of the United States, has an installed hydropower
capacity of nearly 76,000 MW—not much less than the U.S. installed capacity of 79,000 MW—out of a total electric capacity of around 127,800 MW.28 A 2006 study by the environmental consulting firm EEM found that the total technical potential for new hydro across all provinces and territories was around 163,000 MW.29 Since approximately 3,000 MW have been developed since the study was conducted the remaining technical potential is now 160,000 MW. A 2013 study, focusing only on small hydro across the country, estimated that the economic and practical potential for additional capacity ranged between 2,250 and 4,500 MW.30
Power companies are actively taking advantage of a portion of this potential capacity. In the 10 years since 2003, Canada has added more than 5,500 MW in new hydro capacity. As of early 2015, more than 4,000 MW of new hydro capacity was either under construction or had been commissioned; including projects that have been announced and are under early stages of development, possible foreseeable new capacity rises to more than 11,000 MW.31
FIGURE 5: Canadian Electricity Generation by Fuel Type, 2013
Source: Statistics Canada, “Table 127-0007 Electric power generation by class of electricity producer, and Table 128-0014 Electricity generated from fossil fuels” February 2015. Available at: http://www5.statcan.gc.ca/cansim/a33?RT=TABLE&themeID=4012&spMode=tables&lang=eng
Hydropower62.5%
Nuclear13.3%
Fossil Fuel20.0%
Wind1.9%
Solar, Tidal,Other2.3%

Center for Climate and Energy Solutions8

Canadian Hydropower and the Clean Power Plan 9
IMPORTS OF CANADIAN HYDROPOWER
TRADE STATISTICS
Electricity systems and markets are tightly integrated across the United States-Canada border.32 Provincial and U.S. power grids are physically interconnected; power markets, particularly the Midcontinent Independent System Operator (MISO), the New York Independent System Operator (NYISO), and ISO New England (ISO NE) facilitate cross-border trading; and reliability entities like the North American Electric Reliability Corporation (NERC) help ensure the power system func-tions uninterrupted across North America.33 Specifically, the U. S. and Canadian electricity grids are connected at about three dozen locations stretching from the Pacific Northwest to New England.34 Since electricity demand peaks in each country during a different season—Canada in the winter and the United States in the summer—the sharing of reserve services across the connected grids reduces the need for new capacity in both countries.35 In formal comments relating to the
Clean Power Plan, several state environmental agencies (e.g., Minnesota, Wisconsin and Michigan) cited the benefits of Canadian electricity imports, and hydropower specifically, which are discussed in this report.36
Since 1990, Canadian electricity exports to the United States have generally increased (Figure 6). In 2013, 62.5 million MWh was exported to the United States, which was 1.5 percent of total U.S. generation and around 10 percent of total Canadian generation. Canada also imports electricity from the United States at times to help it meet peak demand.37 However, over the past 20 years, Canada has been a net exporter of electricity to the United States.38 Around three-quarters of exports are traded short-term on power markets and the remaining quantities are sold through longer-term fixed contracts.39
In 2013, Québec was the largest electricity exporting province to the United States, followed by Ontario, Manitoba, and British Columbia (Figure 7).40
FIGURE 6: Canadian Electricity Exports to the United States, 1990–2013
Source: National Energy Board of Canada, “Commodity Statistics: Electricity: Electricity Exports and Imports: Table 2A.” February 2015. Available at: https://apps.neb-one.gc.ca/CommodityStatistics/Statistics.aspx?language=english
Mill
ion
meg
awat
t-ho
urs
1990
1991
1992
1993
1994
1995
1996
1997
1998
1999
2000
2001
2002
2003
2004
2005
2006
2007
2008
2009
2010
2011
2012
2013
0
10
20
30
40
50
60
70

Center for Climate and Energy Solutions10
CHALLENGES TO INCREASED TRADE
There are physical, financial, policy, and political constraints that must be overcome in order to increase Canadian hydroelectricity flows to the United States. Additional infrastructure, including new hydropower facilities and new transmission lines are required. Furthermore, bilateral contracts in some regions can assist in obtaining project financing for new hydropower, ensuring timely project development. Also, new projects, transmission infrastructure, and power contracts are subject to a variety of state, provincial and federal regulations, which can become political matters with many stakeholders to satisfy. Finally, policies like U.S. state renewable portfolio standards (RPS) and the Clean Power Plan, and their treatment of hydropower genera-tion in general and international hydropower imports from Canada in particular, will have a direct impact on the future level of imports to the United States.
The border provinces of Québec, Ontario, Manitoba, and British Columbia trade the majority of electricity with the United States (Figure 7). While electricity sources are more diversified in Ontario, hydropower is responsible for more than 95 percent of electricity generated in Québec, Manitoba, and British Columbia. In a typical year, Québec, Ontario, and Manitoba generate more electricity than they require, providing an opportunity to participate in export markets. However, to expand exports beyond the present level,
additional generation and transmission capacity will be required.
As noted above, more than 4,000 MW of new hydropower capacity was either under construction or had recently been commissioned in Canada as of early 2015. Some of this new generation will meet expected domestic demand growth, and some will replace retiring thermal plants. New projects face scrutiny from a range of sources. First Nations, native people in Canada, who have been directly impacted by hydropower project development without serious consultation in the past are today, more often than not, seeing their issues addressed as part of the development process. Environmentalists on both sides of the border have expressed opposition to new, large hydropower projects. However, power compa-nies have been working to address and mitigate many of their concerns. In recent years, advances have been made in the design of facilities, which minimize flooding and impacts on fish. Additionally, many new plants in Canada are being built far from populations, where there is very little in the way of agriculture or existing infrastructure.
In most instances, individual Canadian province electrical grids are better connected with bordering U.S. states than with adjacent provinces. Still, additional transmission capacity will be required to increase elec-tricity exports. Several new international transmission lines have been proposed, most along existing rights-of-way; some projects are further along than others. For example, the Champlain Hudson Power Express is a 1,000 MW high-voltage direct current (HVDC) transmission line from the Canadian border to New York City expected to go into service in 2017.41 Additionally, the Lake Erie Connector is a 1,000 MW HVDC line that is expected to link Ontario’s Independent Electricity System Operator (IESO) and PJM in 2019.42 Also in the northeast, the proposed Northern Pass Transmission Line from the Canadian border to a substation in Franklin, New Hampshire, will provide 1,200 MW of hydropower from Hydro-Québec to the New England power grid, but project developers are still working with stakeholders to resolve cost-responsibility, environ-mental, and social issues.43 In the upper Midwest, the Federal Energy Regulatory Commission (FERC) has recently approved construction of the Great Northern Transmission Line.44 The line from the Canadian border to a substation near Grand Rapids, Minnesota, will provide 883 MW of capacity, 383 MW of which will be used to deliver hydroelectric power from Manitoba Hydro to Minnesota Power’s customers.45 This project
FIGURE 7: Canadian Electricity Exports by Province, 2013
Source: National Energy Board of Canada, “Commodity Statistics: Electricity: Electricity Exports and Imports: Table 2A.” February 2015. Available at: https://apps.neb-one.gc.ca/CommodityStatistics/Statistics.aspx?language=english
New Brunswick3.2%
Manitoba16%
Quebec 43%
BritishColumbia 11%Ontario
27%
Alberta,Saskatchewan
0.3%
Canadian Hydropower and the Clean Power Plan 11
should be especially beneficial from the perspective of zero-carbon electricity, as it will allow Minnesota to back up intermittent wind power with hydropower and send any excess wind power to Manitoba.46
Electricity generators that have a power purchase agreement (PPA) in place are likely to find it easier to obtain financing for new power projects. A PPA is a long-term contract for electric power between a power generator and a purchaser, often an electric utility.47 Generators value PPAs because the agreements guar-antee a predictable revenue stream for delivered power over many years, while utilities like these contracts because they secure electricity price certainty in what can be a volatile market. Notably in 2011, two Canadian hydropower generators secured long-term PPAs with U.S. utilities. Minnesota Power and Manitoba Hydro inked a 15-year deal for 250 MW, beginning in 2020.48 Also
in 2011, the Vermont Public Service Board approved a 26-year, 225 MW PPA between Hydro-Québec and 20 Vermont electric utilities.49
Building new generation and new transmission, along with crafting PPAs, are subject to regulation from state, provincial, and federal agencies. Within these regulatory processes, projects and contracts face challenges from various stakeholders. Additionally, hydropower projects face competition from other forms of electric generation. For example, a public utility commission might be more inclined to approve a new natural gas-fired power plant because it would save ratepayers money relative to other forms of generation (Figure 3). In some instances, a state RPS might favor other sources of generation, namely wind or solar power. Additionally, states may prefer to develop their own in-state generation because of the jobs that in-state electric power projects bring.50

Center for Climate and Energy Solutions12

Canadian Hydropower and the Clean Power Plan 13
HYDROPOWER IN THE CLEAN POWER PLANEPA’s Clean Power Plan has the potential to drive significant changes in the electricity system of the United States, including reducing the consumption of coal and increasing the usage of RE, inclusive of hydropower. First, this section summarizes the Clean Power Plan. Next, it analyzes the proposed plan’s effect on domestic and imported hydropower. Finally, it explores possible changes to this element of the proposal.
The proposed Clean Power Plan distinguishes between new and existing hydropower. In order to match the approach of the proposed rule, “new” hydropower in this report refers to hydroelectric plants built after June 2014 and incremental generation at an existing hydroelectric plant caused by an upgrade at that plant.51 “Existing” generation refers to all other generation. In general, new hydropower generation is given full credit in the proposed Clean Power Plan while existing hydro-power generation is ostensibly excluded.
CLEAN POWER PLAN OVERVIEW
On June 2, 2014, EPA released its proposed Carbon Pollution Standards for Existing Power Plants (known as the Clean Power Plan), per its authority under Section 111(d) of the Clean Air Act.52 Once finalized, the Clean Power Plan would establish different target emission rates (pounds of CO2 per MWh of electricity) for each state due to regional variations in generation mix and electricity consumption, but overall is projected to achieve a 30 percent cut from 2005 emissions by 2030.
EPA is currently in the process of finalizing the rule, which is scheduled to be complete in the summer of 2015. This process includes the review of nearly four million public comments submitted in response to the proposed Clean Power Plan. Once the rule is finalized, states are expected to have between one and three years to submit plans to EPA to show how each will achieve its target emission rate by 2030. EPA will then have to review and approve these plans, which EPA intends to begin driving emission reductions no later than 2020. This timeline could be delayed by the courts as they consider a variety of likely challenges, a few of which have already been filed.
EPA proposed target emission rates for each state based on the capacity of each to achieve reductions using the following four “building blocks” identified by EPA.53 Collectively, these four building blocks constitute the Best System of Emission Reduction (BSER), which must be used as the basis for setting emission performance standards under Section 111(d).
1. Make coal-fired power plants more efficient.
2. Use low-emitting natural gas combined cycle plants more where excess capacity is available, offsetting demand for coal.
3. Use more zero- and low-emitting power sources such as renewables and nuclear and maintain existing nuclear generation fleet.
4. Reduce electricity demand by using electricity more efficiently.
EXPLANATION AND CRITICISM OF RENEWABLE ENERGY IN THE THIRD BUILDING BLOCK
A more detailed explanation of the third building block is important to understand the role of hydropower in the Clean Power Plan. This building block includes both renewable energy (RE) and nuclear energy, but only the renewable element will be addressed here. EPA determined a projection of RE generation, in terms of a percentage of the overall electricity portfolio, that is achievable by 2030 for each state. To do this, EPA looked at “the current goals of leading states in the same region, and allows each state to grow RE generation over time towards that target, based upon that state’s current level of RE.”54 This is done through the following methodology:
1. The nation is divided into eight regions (Alaska and Hawaii are each a region);
2. A regional RE target is developed for each by averaging the 2020 RPS of states within the region that have such a standard;
3. An annual growth factor is calculated that would allow the region to reach the regional target by 2029 assuming that RE generation would increase from 2012 levels beginning in 2017;

Center for Climate and Energy Solutions14
4. The annual growth factor for each region is applied to each state within that region to calculate RE generation in each state from 2017 to 2029. RE generation is capped at the regional RE target.
The use of state RE targets in this process has been criticized by a number of stakeholders due to the policy variations in these targets across state lines.55 One common criticism involves hydropower since some state RPS poli-cies, such as that of New York, allow electricity from large hydropower projects to qualify, while others, such as that of California, do not.56 Thus, to some extent, electricity from existing hydropower plants is involved in setting the target emission rate for some regions but not others. In general, however, existing hydropower is ostensibly excluded from the Clean Power Plan’s target setting methodology. EPA asserts that since existing hydropower projects provide such a large portion of the RE in several states its inclusion “in current and projected levels of performance would distort the proposed approach by presuming future development potential of large hydroelectric capacity in other states,” though the agency solicited comment on whether to take a different approach and find a way to include hydropower in its RE projections.57
In addition to its proposed regional benchmarking approach, EPA also details an alternative approach to its RE projections in a Technical Support Document.58 Under this alternative approach, RE generation projec-tions for each state would be based on the technical and market potential of the state to support additional RE generation. The technical potential would be based in part on analysis from the National Renewable Energy Laboratory (NREL) showing the capacity of each state to support each type of RE technology, including hydro-power. Market potential would be determined using output from EPA’s Integrated Planning Model (IPM). For the alternative approach’s projections of hydropower, EPA used an NREL analysis of the potential for new low-power and small hydroelectric plants.59 This analysis includes feasibility criteria such as “site accessibility, load or transmission proximity, and environmental concerns that may hinder development efforts.”60
As it did with its proposed RE projection meth-odology, EPA specifically sought comment on how hydropower should be treated under the alternative approach.61 To facilitate this, EPA calculated RE projec-tions for each state both with and without projections for hydropower.62 The methodology used projects hydro-power generation to rise nationally from 273,441 GWh
in 2012 to 358,665 GWh in 2030, an increase of over 30 percent.63 Including projections for hydropower leads to more stringent targets overall, which would increase demand for new renewables as well as other carbon cutting measures.
From the perspective of international imports of RE, whether EPA chooses the proposed or alternate approach to building block three is technically irrelevant—the key factor is the target emission rate assigned to each state, regardless of how EPA arrives at this target. That is, there should be higher demand for RE imports if states generally have stricter emission standards. From this perspective, the alternative approach leads to slightly more stringent targets overall, though state by state results feature considerable variation.64 Although we will likely not know which approach to RE EPA will take in the final version of the Clean Power Plan until it is released, EPA’s alternate approach seems to have stronger support in the public comments.65
COMPLYING WITH THE TARGET EMISSION RATE
The proposed Clean Power Plan explains two critical elements for the emission standards it establishes: 1) The criteria for generation and efficiency that factor into the targets; and 2) The criteria for generation and efficiency that qualify for compliance. Fundamentally, it is critical for practicality that anything included in the first group is also included in the second.66 If EPA includes a measure in its target setting methodology, it means it applies that measure to the equation below.
Target Emission Rate
Power Sector CO2 Emissions (lbs)=
Generation (MWh): Fossil, nonhydro RE, new hydro, some nuclear, efficiency
When demonstrating compliance, each state would use this same equation. In this case, the relationship between the total generation in the equation above (the denominator) and the emission impacts of those sources of generation (the numerator) can be more complicated. In most cases, any measure that reduces power sector emissions would help a state move toward its target emis-sion rate, regardless of whether that measure “qualifies for compliance.” However, only qualifying generation (or efficiency) would be explicitly included in the emissions rate equation as a state seeks to demonstrate compliance. This distinction is important for hydropower because new hydropower is proposed to be a qualifying resource,

Canadian Hydropower and the Clean Power Plan 15
but existing hydropower is not. This distinction is explained further below.
After EPA finalizes state emission targets, each state would be authorized to meet its target however it sees fit. States could choose to either comply by meeting their target emission rate, or by converting the rate to a total amount of emissions and instead meet this mass-based target.67 Under either the rate-based or mass-based approach, states could use a variety of policy tools to reduce emissions, including power plant performance standards, energy efficiency resource standards, building and appliance codes, renewable portfolio standards, and carbon pricing, among other options.
A mass-based target approach could be much less complicated than a rate-based approach. Under a rate-based approach, a state would need to track emissions from affected power plants as well as total qualifying generation. This latter task would involve a number of difficult determinations in the hydropower context, such as the share of additional generation produced by a specific hydropower project caused by an uprating (increased capacity) rather than additional rainfall. In contrast, a mass-based approach would only hinge on the level of emissions from a state’s power plants. States would still need monitoring protocols in place to ensure its energy efficiency programs are having the intended effect, but these protocols would presumably not need to be as robust.
EPA’S PROPOSED TREATMENT OF HYDROPOWER IN THE CLEAN POWER PLAN
Although hydropower typically constitutes 6 to 8 percent of U.S. electricity mix and around 20 percent of zero-carbon electricity generation, it is only addressed minimally in the proposed Clean Power Plan. New hydropower is treated identically to other new RE generation. However, as noted above, there is relatively limited likelihood for new hydropower generation in the United States. Existing hydropower, on the other hand, is not treated like other existing RE generation, and is excluded from each state’s emission rate calculations.68 This is clear when revisiting the equation states will use to show their emission rates:
Emission Rate
Power Sector CO2 Emissions (lbs)=
Generation (MWh): Fossil, nonhydro RE, new hydro, some nuclear, efficiency
While hydropower is not credited in the proposed Clean Power Plan the same way as other renewables, it still implicitly factors into a state’s emission rate. Fundamentally, each state must take steps to reduce its power sector emission rate: CO2 emissions/qualifying generation. This means states have two broad methods to achieve compliance: reduce emissions and increase the production of qualifying generation, most likely in combination. Most renewable forms of generation, such as solar photovoltaic, wind, new hydroelectricity projects, and geothermal, fall into the category of “qualifying generation” for the purpose of the Clean Power Plan.69 As a state increases generation from these sources, it will likely reduce CO2 emissions by displacing fossil-fired electricity or reducing the need for new fossil-fired generation, and increase the amount of qualifying generation (or at least offset the subtraction of fossil generation from the emissions rate equation).
However, existing hydropower is not counted as qualifying generation in the proposed Clean Power Plan. Changes in production of hydroelectricity from existing dams will certainly affect a state’s CO2 emissions since fossil generation will likely increase or decrease to balance variation in hydropower generation. For this reason, maintaining the existing fleet of hydropower plants will be important in ensuring states can meet their goals. New hydropower, on the other hand, is a type of qualifying generation and would therefore be explicitly included in the state’s emission rate calculation. For compliance purposes, this makes new hydropower more valuable to a state than existing hydropower.
If a state chooses to comply through a mass-based target rather than a rate-based standard, the distinction between new and existing hydropower disappears. Under this approach, all zero-carbon generation, including both new and existing hydropower, should have the same practical effect—displacing the need for fossil-fired generation. Put another way, there will no longer be separate categories of qualified generation and unqualified generation.
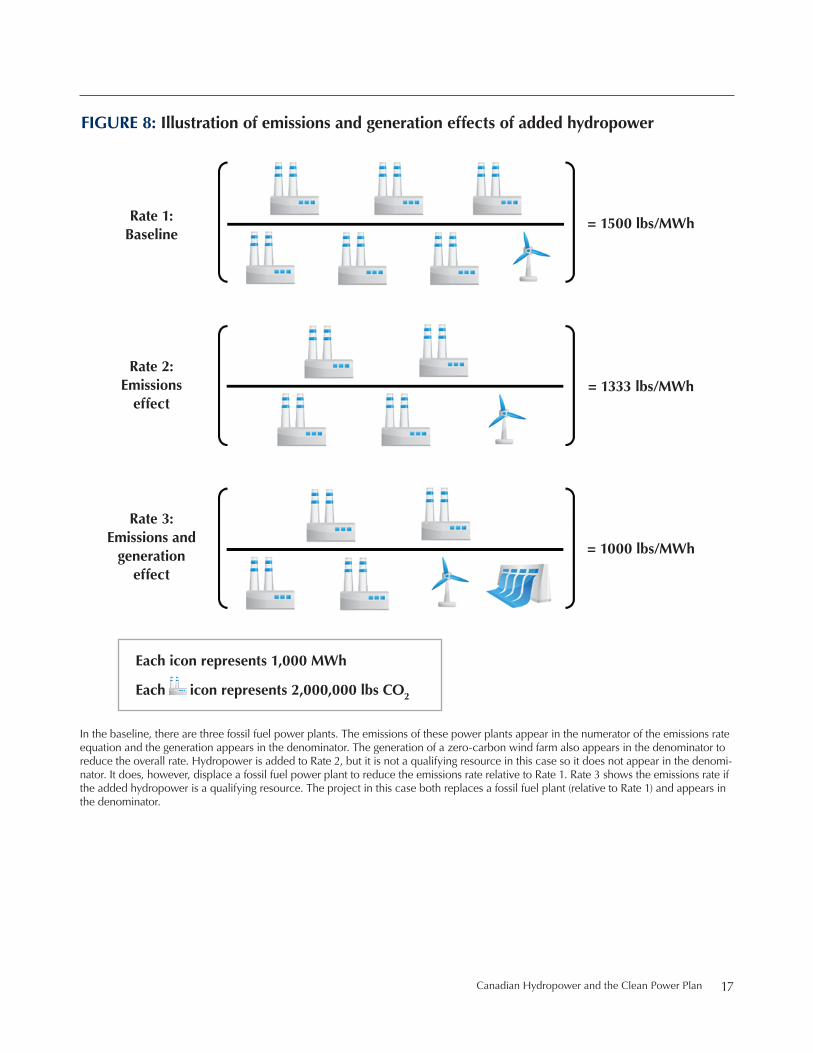
This highlights an important distinction between the two effects hydropower would have on a state’s emission rate. One is the “emissions effect,” or the reduction in emissions from fossil generation displaced by hydropower. Where present, the displaced fuel is presumably coal to maximize the emission reduction. This effect is generally present regardless of whether the particular hydropower project is qualifying generation. The “generation effect” is the reduction in emission rate caused by adding the generation from a qualifying

Center for Climate and Energy Solutions16
hydropower project to the state’s emission rate. The policy options discussed below will generally only factor into whether a state can take explicit credit for hydro-power generation in its emission rate.
This distinction is illustrated in a highly simplified example in Figure 8. In the baseline, the jurisdiction features three fossil power plants and one wind farm, each of which generate the same amount of electricity. Between Rate 1 and Rate 2, hydropower is added to entirely displace one of the fossil power plants, meaning the emissions from this power plant (2,000,000 lbs CO2) are no longer in the numerator of the emission rate equation and its generation is no longer in the denominator, bringing the emission rate down. In Rate 2 the hydropower does not count as qualifying generation, so its generation is not included in the denominator. In Rate 3 hydropower is qualifying generation, so it is included in the denominator, further bringing down the jurisdiction’s emission rate relative to Rate 2.
INTERPRETATION OF “INCREMENTAL”
EPA has proposed that both new and incremental hydropower generation can directly count toward a state’s compliance, but it is not clear in the text of the proposal what is included in “incremental.”70 A narrow interpretation would be that states can only directly count electricity from an existing hydropower plant if it is the result of a plant upgrade. According to statements of EPA officials, this is EPA’s current interpretation. This would fit with EPA’s general treatment of existing hydropower generation and its explicit interest in driving additional policy and technology measures through the Clean Power Plan. The alternative, broader interpreta-tion would be that any hydropower generation additional to that in 2014, either domestic or imported, could be included in a state’s emission rate denominator.
A broad interpretation would allow states to balance variations from the 2012 baseline, as these variations are likely to occur in both directions. That is, in some years states could generate less electricity from hydropower compared to 2012, which will likely have to be replaced with fossil electricity, raising the state’s emission rate. In other years, however, hydropower generation from existing plants could be greater than it was in 2012.71 In these years, states would be able to both reduce fossil genera-tion, thereby reducing the emissions in the numerator of their emission rate calculation, and add the incremental hydropower to the denominator, further reducing the rate.
EPA’s ultimate position on this point could have an impact on the role of Canadian hydropower in the Clean Power Plan. A narrow interpretation would support an EPA position of only allowing states to take credit for the generation effect of Canadian hydropower if it is from a new project or the result of an upgrade to an existing project. The broad interpretation could allow states more flexibility in the criteria used to determine if Canadian hydropower can count toward compliance.
POSSIBLE INCLUSION OF EXISTING HYDROPOWER IN THE CLEAN POWER PLAN
Although existing hydropower does not factor into state target emission rates in the proposed Clean Power Plan, EPA appears open to changing its approach. Within the proposal, EPA notes:
With regard to hydropower, we seek comment regarding whether to include 2012 hydropower generation from each state in that state’s “best practices” [RE] quantified under this approach, and whether and how EPA should consider year-to-year variability in hydropower generation is included in the [RE] targets quantified as part of BSER.72
If EPA were to include existing hydropower in the Clean Power Plan without changing its general approach to RE, it is unclear if this change would have much of a practical effect. This change would increase the number of zero-carbon MWh both in a state’s target emission rate and the state’s real emission rates it submits to EPA during the compliance period by roughly the same amount (generation from existing hydropower plants in 2012 and 2020-2030). This is highlighted in the comments of RGGI, noting that EPA should either include existing hydro-power in both the target setting methodology and the compliance demonstration equation, or in neither. The RGGI comments do not indicate a preference between these two choices, despite the region’s use of hydropower for 11 percent of its electricity demand:73
The RGGI states recommend that EPA either: (1) include hydroelectric resources in the goal computa-tion procedure, and permit all existing and future hydroelectric resources to qualify for compliance purposes; or, (2) remove hydroelectric power from the goal computation methodology and permit only new or incremental hydroelectric renewable resources to qualify as compliance measures.74
Canadian Hydropower and the Clean Power Plan 17
FIGURE 8: Illustration of emissions and generation effects of added hydropower
= 1500 lbs/MWh
Rate 2: Emissions
effect
Rate 3: Emissions and
generation effect
= 1000 lbs/MWh
= 1333 lbs/MWh
Rate 1: Baseline
Each icon represents 1,000 MWh
Each icon represents 2,000,000 lbs CO2
In the baseline, there are three fossil fuel power plants. The emissions of these power plants appear in the numerator of the emissions rate equation and the generation appears in the denominator. The generation of a zero-carbon wind farm also appears in the denominator to reduce the overall rate. Hydropower is added to Rate 2, but it is not a qualifying resource in this case so it does not appear in the denomi-nator. It does, however, displace a fossil fuel power plant to reduce the emissions rate relative to Rate 1. Rate 3 shows the emissions rate if the added hydropower is a qualifying resource. The project in this case both replaces a fossil fuel plant (relative to Rate 1) and appears in the denominator.

Center for Climate and Energy Solutions18
Canadian Hydropower and the Clean Power Plan 19
THE CLEAN POWER PLAN’S APPROACH TO INTERNATIONAL HYDROPOWER IMPORTS
The Clean Power Plan’s treatment of hydropower in the generic domestic context will have an impact on the role of Canadian hydropower, but the final rule will likely include a provision that addresses Canadian hydropower specifically. In a supplement to the proposed Clean Power Plan addressing power plants in Indian country and U.S. territories, EPA notes that it is looking for feedback on the role of RE imports from Canada:
Some stakeholders are also interested in the treatment of RE across international boundaries, particularly in instances where entities in another country are providing, or could provide, low- or non-emitting electricity generation to serve an area in the United States. In particular, stakeholders have asked whether RE resources from Canada can be used to contribute to meeting a jurisdiction’s goal. The EPA is soliciting comment on all aspects of the treatment of RE…generation across international boundaries in a [Clean Air Act] section 111(d) plan, considering the components for approvable plans…including any mechanisms that could be used to ensure that the low or non-emitting generation was in fact offsetting fossil-fuel-fired generation in the jurisdiction that would use it to meet its goal.75
This section discusses the feedback EPA has received on this issue and explores the implications of a variety of options it has in the Clean Power Plan’s treatment of imported hydropower, first in terms of target setting and next in terms of compliance. This section also addresses what would be needed in state plans to take advantage of this resource.
FEEDBACK ON INTERNATIONAL HYDROPOWER IN THE CLEAN POWER PLAN: TARGET SETTING
If EPA accepts international RE imports as valid for compliance with state target emission rates, it also could choose to include this electricity resource in the target setting methodology for states with the potential to increase imports. That is, in addition to an assessment
of each state to expand its RE generation factoring into the third BSER building block, EPA could choose to account for each state’s potential to import RE from international sources as well. As discussed above, several states already import a significant amount of RE from Canada, and we expect this to expand over the compli-ance period of the Clean Power Plan. However, there may be an issue of state authority, or lack thereof, in including these resources in target setting equations. Although there is an ongoing conflict of opinion among stakeholders over whether EPA should implicate agencies outside of those typically associated with Clean Air Act regulations, including grid operators and public utili-ties commissions, these are all at least partially under the authority of state governments. On the other hand, electricity policy decisions made in Canada are outside the authority of states.
At least one commenter, Clean Air Task Force (CATF), supports the inclusion of imported RE in the target setting equation of states that leverage this resource. “If international renewable energy is expected to replace generation at designated facilities, that renewable energy potential must be identified and included in the jurisdic-tion’s target setting and CPP plan.”76 If EPA were to also take interstate potential into account when setting RE projections (for example, assuming states bordering the Great Plains could take advantage of its wind potential since it is greater than what states within the region could consume), which CATF supports, this approach would treat interstate and international imports consis-tently. However, utilities have less certainty when dealing with international imports than interstate. The Dormant Commerce Clause of the Constitution is generally interpreted to prevent states from adopting laws prohib-iting the transfer of electricity across state lines, meaning most decisions on the development and dispatch of RE generation are made by the market. This assurance does not exist across international borders, meaning a provincial government (many Canadian electric utilities are government corporations) could restrict development

Center for Climate and Energy Solutions20
of renewable resources, meaning they may not be reliably available for the U.S. market.
A fairness argument may also be made for requiring international RE to be included in a state’s target emission rate. Since only states with a direct physical connection to international generation (typically, but not exclusively, border states) would be able to easily leverage these resources to reduce their emissions, it may be relatively easier for these states to meet their targets. However, Renewable Energy Certificate (REC) tracking systems make it possible to take credit for RE that is not actually consumed in a particular state. A REC is a record that one MWh of electricity was gener-ated from a renewable source, and can be traded across power companies and utilities through a number of state and regional tracking systems.77 As with current RPS programs, power companies could choose to comply with Clean Power Plan requirements by purchasing RECs, meaning they would not need a physical connection to international RE. Since the trading of RECs could allow any state to take advantage of the emissions benefits of imported hydropower, fairness would not require this resource to be included in the target setting method-ology for importing states.
If EPA does not look into the RE potential in neigh-boring states when determining an RE projection for each state, consistency would dictate that it not include international resources either. If, however, a regional element is included, EPA could conceivably assess the potential for each state to increase both interstate and international imports.78 However, EPA should recognize the added complexity and uncertainty states face when looking across international borders for their long-term electricity needs.
FEEDBACK ON INTERNATIONAL HYDROPOWER IN THE CLEAN POWER PLAN: COMPLIANCE
Of the dozens of comments reviewed on this topic, which was addressed both in comments to EPA’s June proposal and its supplemental proposal, states and other stakeholders by and large recommend that RE imported from Canada, including hydropower, be treated similarly to such electricity produced domestically. Stakeholders with this position include the American Public Power Association, Edison Electric Institute, the Natural Resources Defense Council, the New York Independent System Operator, the Utility Air Regulator Group, and the environmental agencies of Maine, Michigan, Minnesota, and Wisconsin.79
For example, the Michigan Department of Environmental Quality comments note that:
Michigan has the capability to import hydroelectric generation from Canada and believes the final rule should reflect and acknowledge international trading of electricity, as well as allow for the purchase of RE credits from other nations such as Canada….allowing international trading of low or non-emitting elec-tricity generation to count toward meeting our state’s emission reduction goal would encourage Michigan to continue to build upon progress already made in offsetting fossil fuel-fired generation with cleaner RE alternatives.80
Environmental groups are also supportive of this approach. Sierra Club and Earthjustice note in their comments:
We believe that new renewable energy resources in foreign countries, such as Canada, which are intercon-nected to the U.S. bulk power system, should be able to count towards the compliance of a U.S. jurisdiction with affected EGUs. Allowing these resources to participate is consistent with the fact that the power grids serving our country cross both our northern and southern borders, that electricity is regularly transferred in both directions across these borders, and that three REC registries encompass Canadian provinces or Mexican states.81
Although commenters are largely in favor of allowing Canadian hydropower to factor into Clean Power Plan compliance, a handful of concerns were raised. These include protection against double counting, assurance that Canadian RE would be offsetting domestic fossil generation, and the prevention of leakage. Ultimately, none of these concerns should pose a barrier for states to take advantage of Canadian hydropower as they imple-ment the Clean Power Plan.
Double Counting
Double counting would occur if both the importing state and exporting province (or state) were to take credit for the same unit of generation. NRDC notes in its comments that in order to qualify toward compliance, “the international resources are not double-counted as a non-emitting or low-emitting resource for a regulatory obligation of both the source country and Clean Power Plan compliance.”82 Since many Canadian provinces and U.S. states use RECs to track the attributes of RE, this

Canadian Hydropower and the Clean Power Plan 21
concern could be satisfied by requiring regulated entities to acquire RECs from Canadian hydropower in order to be able to take advantage of its generation effect. Since REC trading systems already have processes in place to avoid double counting, this should be sufficient. This is supported by the comments of Xcel Energy, which purchases renewable electricity from Manitoba Hydro, the RECs from which are already tracked (meaning double counting is prevented) by the Midwest Renewable Energy Tracking System (M-RETS).83
Although the relative simplicity of a mass-based approach is noted throughout this brief, REC trading would likely not be avoidable. If a state following a mass-based approach were importing hydropower to reduce its fossil emissions, it would have to acquire the RECs for this generation. Otherwise these RECs would still be available for purchase by a utility in a rate-based state, causing the renewable attributes of the generation to be double counted.
Offsetting Domestic Fossil Generation
The second concern discussed by environmental groups, which is also noted by EPA in the supplemental proposal, is that imported RE must offset domestic fossil genera-tion to qualify. Even in the absence of the Clean Power Plan’s requirements, grid operators are incentivized to use hydropower, which has low variable costs, to displace coal or gas generation, which have higher variable costs than zero-carbon sources such as renewables. This is supported by a Brattle Group study on what sources are displaced by Manitoba Hydro exports.84 The study found no displacement of carbon-free generation would occur over the next 20 years. Once the requirements of the Clean Power Plan are in place, states will have strong incentives to reduce emissions by using hydropower to displace coal or gas generation. In most cases, displacing other renewables or nuclear generation with imported hydropower would not help a state reduce its power sector emissions rate, and is therefore discouraged by the Clean Power Plan.85 Many states also have RPS policies (most of which do not count Canadian hydropower as a qualifying resource) that will continue to drive domestic RE development even in the presence of new hydropower imports.
Leakage
Leakage, which in some contexts is known as resource shuffling, describes the case where calculated emissions
are reduced from an accounting perspective without an equal reduction in actual emissions. For example, if a certain state begins importing RE instead of coal energy from an exporting state, it could conclude that it has reduced its electricity emissions. However, if the exporting state does not adjust its actual generation, no actual emissions have been avoided by the importing state’s action.
Sierra Club and Earthjustice cite the risk of cross-border leakage as a reason why interstate and international RE generation should be treated differ-ently.86 These comments note that, in order to ensure imported RE is offsetting fossil-fuel-fired generation in the importing jurisdiction, “EPA could…requir[e] the entity seeking to take credit to provide evidence that the electricity generated was intended for U.S. consumption, such as through the existence of a power purchase agree-ment or firm transmission service rights.”87
However, there are reasons to doubt leakage would be a concern for Canadian hydropower. Leakage would require Canada to direct more hydropower to the United States while generating more coal-fired power for its domestic consumption, which is unlikely. Like the United States, Canada has committed to greenhouse gas emission target of 17 percent below 2005 levels by 2020.88 Canada has limited coal capacity compared to the United States (Figure 6) and new coal plants are subject to a strict limit of 925 lbs CO2 / MWh, essentially requiring Carbon Capture and Sequestration (CCS) technology, through the Reduction of Carbon Dioxide Emissions from Coal-fired Generation of Electricity Regulations.89 Driven by this and other factors, Canada has been a leader in the commercialization of CCS—the first commercial-scale CCS power project began opera-tion in 2014 in the province of Saskatchewan.90 While Canada’s actions on existing plants have been deemed weaker than the Clean Power Plan in the near-term, coal without CCS will effectively be phased out of the nation in the medium-term.91 Existing plants must shutter at the end of their “useful life” (45-50 years), which would leave very few plants operational after 2020.92 All plants not meeting this standard would have to be shuttered by 2030.93 Although this particular regulation leaves it theoretically possible for Canada to direct more of its hydropower to the United States while increasing the combustion of coal for its own demand, the Canadian coal plant regulations effectively cap the amount of leakage this would cause, which would decline over time as Canadian coal plants are retired.

Center for Climate and Energy Solutions22
In addition to its federal rules on coal plants, all Canadian provinces have either a renewable standard, directive, or target to encourage more RE generation.94 Canadian electricity providers are therefore encouraged to deliver RE to their own customers, weakening any relative incentive the Clean Power Plan would have for RE generators in Canada to send electricity across the border. Canadian provinces and U.S. states track most RE through Renewable Energy Credits (RECs) through networks that can include both states and provinces.95
Perhaps even more relevant for a leakage assessment, the provinces with significant exports to the United States either have no coal generation, policies targeted directly at reducing greenhouse gas emissions, or both. Quebec (43 percent of Canadian exports, see Figure 7) does not have any coal generation and has a cap-and-trade system that covers the electricity sector. Ontario (27 percent of exports) has eliminated coal as a source for electricity and is developing a carbon price.96 Manitoba (16 percent of exports) has only one small coal plant that can be used only in emergencies and droughts, and will be retired when a hydropower plant currently under development comes online.97 Manitoba also has a tax on coal.98 Finally, British Columbia (11 percent of exports) has a carbon tax in place of $30 (Canadian) per metric ton of carbon dioxide equivalent.99
The combination of these federal and provincial policies discouraging the combustion of coal, prohibiting the construction of new coal plants without CCS, and encouraging RE generation makes it unlikely that Canadian power companies would begin redirecting RE generation into the United States and coal electricity for domestic demand.
Note that a typical resource shuffling scenario, which involves changes in accounting rather than actual gener-ation, would be extremely unlikely in this context. In a typical resource shuffling scenario, a U.S. utility would end a long-term contract for imported coal electricity and replace it with a contract for imported hydropower. The U.S. utility would seek credit for reducing its emis-sions, even though a change in the exporting province’s generation mix may not have occurred. Under the proposed Clean Power Plan, however, the importing state was not responsible for the emissions from the imported coal electricity in the first place, nor would the imported hydropower be qualifying generation because it would not be the result of a new project. Moreover, the majority of Canadian electricity trade is conducted on the spot
market and is generally the result of surplus output from hydropower resources. The minimal turnover of long term contracts could have only a nominal impact on a state’s calculated power sector emissions rate.
In its comments on the Clean Power Plan, NRDC highlights the additional risk of leakage between rate-based and mass-based states.100 This is an important issue that EPA must address, but it is not exacerbated in an international context.
POSSIBLE TREATMENTS OF CANADIAN HYDROPOWER
Overall, EPA’s proposal and prominent comments point to three possible treatments of international hydropower in the Clean Power Plan:
1. Treat international hydropower similarly to domestic hydropower.
2. Exclude international hydropower from the Clean Power Plan.
3. Provide special consideration to international hydropower by counting existing plants as quali-fying generation in some circumstances.
These three possibilities are addressed in turn below, followed by a discussion of state plans. The key distinc-tion among options is what, if any, imported hydropower is a qualifying resource.
Option 1: Treat international hydropower trade like interstate hydropower trade
As proposed, the Clean Power Plan does not directly address how states should address internationally imported RE in their plans. One approach EPA could take is to treat RE flowing across international borders equivalently to RE flowing across state borders. EPA’s proposed approach to interstate imports of RE is as follows:
The EPA is proposing that, for renewable energy measures, consistent with existing state RPS policies, a state could take into account all of the CO2 emission reductions from renewable energy measures imple-mented by the state, whether they occur in the state or in other states. This proposed approach for RE acknowl-edges the existence of renewable energy certificates (REC) that allow for interstate trading of RE attributes and the fact that a given state’s RPS requirements often allow for the use of qualifying RE located in another state to be used to comply with that state’s RPS.101
Canadian Hydropower and the Clean Power Plan 23
Under this approach, a state could take credit for the generation effect of qualifying generation whether it originated in-state, in another state, or in another nation, provided the importing state acquired both the electricity itself and its renewable attributes. There would be a distinction between new and existing hydropower under this approach, but no distinction related to geography. Allowing credit for imported zero-carbon energy would allow states to take advantage of the least-cost option for such energy, regardless of whether it is located in-state. This would help keep compliance costs low without sacrificing emission reductions.
Option 2: Exclude Canadian hydropower from the Clean Power Plan
Another option for EPA would be to bar states from taking credit for hydropower imported from Canada as qualifying generation in their power sector emission rate. Within the Clean Power Plan, EPA notes “We also request comment on the option of allowing a state to take into account only those CO2 reductions occurring in its state.”102 It seems EPA may therefore be considering keeping emission rate calculations simple by only allowing a state to factor in the generation and emissions that occur within its borders. This would presumably bar states from taking credit for the generation effect of zero-carbon generation both imported from other states and other countries. The emissions effect that imported RE would have on total in-state emissions would still be present.
This approach would be difficult for EPA to justify. In the interstate context, the electricity system does not follow state borders and energy regularly flows across borders for a variety of reasons. As one example, some states are better suited to large-scale wind projects and it can make much more economic sense for a power company to import wind electricity from one of these states rather than build a wind farm in a suboptimal location. Preventing states from counting RE imported from other states would restrict states from fully taking advantage of RE opportunities and could decrease overall investment in RE. The Great Plains states have a high capacity for wind energy, but generally low demand. Some Western and Midwestern states, such as California and Missouri, have higher demand but are less suited for wind generation. Discouraging the trade of RE across these states would raise compliance costs in importing states, reduce economic development in exporting states,
complicate grid operation since states would want to avoid exporting RE generation, and reduce the total amount of investment in RE generation without leading to additional emission reductions.
This is true along the U.S.-Canada border as well. As discussed above, electricity regularly flows across this border and it would be irrational to assume that a state’s electricity system exists only within its borders. This integration of electricity systems across the U.S.-Canada border would make it somewhat arbitrary for EPA to treat interstate imports differently from international imports. As with a bar on using interstate imports for compliance, preventing states from leveraging Canadian imports to reduce emissions would limit the options available to border states and complicate grid operation. In our review of public comments on this topic, no stakeholder advocated for this position.
Option 3: Give consideration for new import contracts from existing Canadian hydropower projects
The proposed Clean Power Plan notes that the genera-tion effect from existing hydropower generation cannot count toward compliance. EPA argues that since most hydropower projects were built decades ago for reasons unrelated to climate change, they should not be fully credited for compliance with the Clean Power Plan. As discussed above, since this generation is also not part of the target setting methodology for states, its exclusion from compliance demonstration has little practical impact. However, it may be possible for EPA to make an exception for new imports (new contracts) from existing hydropower projects in Canada.
There are at least two possible scenarios in which new U.S. demand could lead to marginal generation from existing Canadian hydropower projects. These two scenarios are similar—an existing hydropower project is not currently operating to its full potential due to either insufficient demand or insufficient transmission. With the Clean Power Plan in place, states will be encouraged to work with Canadian power producers to optimize the use of existing hydropower plants. Although this would not meet EPA’s current definition of new hydropower generation, and therefore would not be qualifying gener-ation according to the proposal, this would effectively be additional zero-carbon generation, driven by the Clean Power Plan, used in place of U.S. fossil generation.
Under these scenarios, the concerns discussed above for qualifying generation (double counting, offsetting
Center for Climate and Energy Solutions24
domestic fossil generation, leakage) would not be present or could be easily addressed. The double-counting question could be solved through the use of RECs, as with new projects. States could make the same showing that the marginal generation from existing projects is being used to displace domestic fossil fuel consumption. As discussed above, leakage is unlikely in the Canadian hydropower context for both new projects and additional generation from existing projects.
At least one set of comments, from Sierra Club and Earthjustice, opposes this option: “Specifically, genera-tion from any renewable energy resource existing as of the date of the proposed rule cannot count towards compliance.”103 Excluding existing generation from qualifying generation ensures states will have to take steps to make real reductions in their emissions rate, and excluding existing imported hydropower promotes this goal as well. However, there are some cases where action is necessary, perhaps in the form of a new transmission project, to import additional electricity from an existing hydropower project. To ensure states are able to take full advantage of Canadian hydropower to reduce emissions, EPA should explore ways to include additional genera-tion from existing projects as qualifying generation.
CANADIAN HYDROPOWER IN STATE PLANS
Since the Clean Power Plan will be implemented at the state level (unless EPA issues a Federal Implementation Plan for a state that does not submit an adequate plan), hydropower will have to be addressed in state plans in addition to the federal rule to take full advantage of this resource. A more fundamental question states must address before working through its resource options is to determine whether it will pursue a rate-based or mass-based compliance target. In a rate-based system, states will have to determine whether, and how, hydropower should be included as a qualifying resource, should EPA allow this. States should have some flexibility in how they treat hydropower if it is included by EPA as a qualifying resource. For example, if EPA notes in the final Clean Power Plan that new hydropower can count toward compliance if installed after June 2014, a state could choose to be more restrictive and only count the genera-tion effect of hydropower installed during the compli-ance period. This section first addresses state options under a rate-based system, followed by the implications of a mass-based system on Canadian hydropower.
Canadian hydropower in a rate-based system
If EPA chooses to exclude Canadian hydropower from Clean Power Plan compliance, states may still choose to include this resource as part of their compliance plans insofar as imported hydropower can displace fossil generation and therefore reduce the state’s emissions and/or emissions rate. This effect will exist regardless of whether hydropower is deemed to be a qualifying resource, but states will need to account for any changes in hydropower through the compliance period in order to ensure their power system overall will meet its target emission rate.
If EPA includes Canadian hydropower in its Clean Power Plan, either from incremental generation exclusively or from both incremental generation and new contracts, states with the capacity to draw from this resource will be encouraged to take advantage of it in their implementation plans. States will have to determine any limitations on what hydropower can fully count toward compliance, including the threshold date for what qualifies as new, how to track the zero-carbon attribute of the electricity such that it is not double counted (very likely through a REC tracking system), whether there will be any distinctions among intrastate, interstate, and international generation, and what policy measures, if any, the state will take to encourage new hydropower generation. In making these determinations, states will need to consider the impacts of new hydro-power both on Clean Power Plan compliance and their electricity system overall. In addition to the zero-carbon electricity it supplies, new hydropower generation could help balance intermittent renewables a state adds to displace fossil generation.
To explore the impact of additional hydropower imports in rate-based systems, we analyzed the effect an additional 1,205,325 MWh of hydropower (a hypothetical 250 MW plant operating at a 55 percent utilization factor) would have on the emission rates of seven states that already import Canadian hydropower. Due to the emissions effect, states will benefit from additional hydropower even if EPA does not consider it to be quali-fying generation. If the project were to be qualifying generation, the generation effect would further reduce the state’s overall emission rate.
As shown in Table 1, states with relatively low emis-sion rates where hydropower is likely to displace coal, including Massachusetts and New York, benefit relatively more from the emissions effect than the generation

Canadian Hydropower and the Clean Power Plan 25
effect. This is due to the removal of a significant portion of the states’ limited coal emissions from the numerator of the power sector emissions rate. States with higher emission rates and states where gas is more likely to be displaced by hydropower benefit relatively more from the generation effect since either a relatively smaller share of coal emissions are being removed from the numerator (Michigan, Pennsylvania, and Wisconsin) or a smaller absolute number is being removed from the numerator due to the relatively low emissions rate of gas (California). Of course, the same amount of hydropower will have a larger effect in states with smaller generation portfolios overall (Massachusetts has about one-third as much qualifying generation as Michigan).
Table 1 shows that 250 MW of new imports could help certain states take a significant step toward compli-ance with their proposed Clean Power Plan targets. In Massachusetts, assuming no other changes in the state’s power sector, this level of new imports could reduce its overall emission rate by about 10 percent, or about 32 percent of the difference between its 2012 rate and its proposed 2030 target. This level of new imports could similarly help Minnesota move about 19 percent of the way toward its proposed 2030 goal, and Wisconsin’s
emissions rate could move 12 percent of the way toward its target with a new 250 MW project.104 If these hypo-thetical 250 MW projects were not qualifying generation (meaning there would be no generation effect on the state’s calculated emission rate), Massachusetts would only move 20 percent of the way toward its target, Minnesota 9 percent, and Wisconsin 4 percent.105
For imported RE, including qualifying hydropower, to be fully counted in overall emission rates, the critical factor is for a state to show that it is “offsetting fossil-fueled generation.”106 This requirement is unique to international RE imports.107 EPA does not suggest how states might meet this requirement, but in their comments The Sierra Club and Earthjustice suggest that states could require “the entity seeking to take credit to provide evidence that that electricity generated was intended for U.S. consumption, such as through the existence of a power purchase agreement or firm transmission rights.”108 On the other hand, NYISO suggests in its comments that states should simply have to “demonstrate the displacement of fossil-fired generating units by international resources to the extent that they must demonstrate displacement of in-state resources.”109 Although it is currently unclear what steps
TABLE 1: The Impact of 250 MW of New Hydropower on the Emission Rate of Selected States if Not Qualifying (Emissions Effect) or Qualifying (Emissions and Generation Effects)
STATE FUEL 2012 RATE* EM. EFFECT DROPEM. AND GEN. EFFECT
DROP (MARGINAL)
2030 TARGET
CA Gas 555 553 0.4% 549 0.7% 537
MA Coal 824 775 6.0% 745 3.8% 576
MI Coal 1,632 1,624 0.5% 1,601 1.4% 1,161
MN Coal 1,191 1,162 2.5% 1,132 2.6% 873
NY Coal 859 838 2.4% 826 1.5% 549
PA Coal 1,487 1,482 0.3% 1,471 0.8% 1,052
WI Coal 1,663 1,646 1.0% 1,607 2.4% 1,203
*2012 Rate factors in energy efficiency reported by EPA. Since this was not factored into the 2012 emissions rates listed by EPA, these rates may differ from those in EPA Technical Support Documents.
This table shows the 2012 emission rate and 2030 target emission rate, according to EPA, of states that import Canadian hydropower. The “Em. Effect” column shows the impact of 1,205,325 additional MWh of hydropower that does not count as qualifying generation on the state’s emission rate, assuming the listed “Fuel” is displaced. Coal was assumed to be the displaced fuel unless the state consumed less than 1,205,325 MWh of coal generation in 2012. “Em. and Gen. Effect” shows what the state’s emission rate would be if the new hydro-power were qualifying generation, such that the state could count both the emissions and generation effects. This is an illustrative example only and is not highlighting any specific proposed project.Source: U.S. Environmental Protection Agency, Goal Computation Technical Support Document. June 2014. Available at: http://www2.epa.gov/carbon-pollution-standards/clean-power-plan-proposed-rule-technical-documents; and C2ES calculations.

Center for Climate and Energy Solutions26
a state would have to go through to show that imported hydropower should be a qualifying resource in a rate-based program, no requirements should be present in a mass-based program.
Canadian hydropower in a mass-based system
Under a mass-based system, the primary element of the Clean Power Plan’s treatment of imported hydropower that will have an impact on state implementation should be its impact on the target emission rate. That is, if EPA factors imported hydropower into state emission targets, it will result in stricter target emission rates, which would translate to a lower mass-based target. Additionally, if the final version of the Clean Power Plan allows for the banking of early action credits, states could choose to assign mass-based credits to hydropower projects completed between 2014 (or another threshold year
picked by the state, within bounds set by EPA) and 2020 when compliance obligations start.
In terms of demonstrating compliance, the Clean Power Plan’s treatment of imported hydropower, or hydropower in general, should be irrelevant to states pursuing a mass-based target. As long as power plant emissions are reduced, whether it be through domestic non-hydro RE, energy efficiency, or imported hydro-power, the only issue of consequence is that power plant emissions decline. For example, in RGGI’s mass-based system the only requirement for compliance is that fossil fueled power plants hold enough allowances to match their emissions. Thus anything that reduces the demand for fossil electricity helps power plants reduce emissions and bring down the overall emissions of states partici-pating in RGGI.

Canadian Hydropower and the Clean Power Plan 27
CONCLUSIONCanada already supplies a significant share of hydro-power to the United States, is currently working to add more than 11,000 MW of additional capacity, and has the potential to add much more in the future. As a non-emitting resource, a portion of this new capacity could help states meet their Clean Power Plan goals. To maximize the ability of states to take advantage of
Canadian hydropower as they implement the Clean Power Plan, EPA would need to confirm in the final rule that new Canadian capacity is a qualifying resource.
EPA faces a variety of decisions regarding the treat-ment of hydropower imports in the final version of the Clean Power Plan. These decisions are summarized in Table 2. The strong connection between the Canadian
TABLE 2: Summary of EPA’s Options and Implications Regarding Imported Hydropower in the Clean Power Plan
ISSUE OPTIONS IMPLICATIONS
Treatment of international hydropower: Target setting
Imported hydropower is included in EPA’s target setting methodology
Renewable energy projections would be increased for states that have the potential to import additional hydro-power, making their target emission rates more stringent.
Imported hydropower is excluded from EPA’s target setting methodology
Assuming no other policy changes, state targets would remain as proposed.
Treatment of international hydropower: Compliance*
International hydropower is treated equivalently to interstate hydropower
States will be able to fully count new and incremental Canadian hydropower to reduce their emission rates.
International hydropower is never considered qualifying generation
States will not be able to include the generation effect of Canadian hydropower in their emission rates, though the emissions effect would still be included. International hydropower would still be implicitly credited in states with mass-based systems.
Special consideration is given for new imports from existing plants where some additional action is required
In addition to new and incremental hydropower, states would be able to fully count new imports from existing plants that are enabled by new transmission projects or other special circumstances.
Definition of incremental* All incremental generation above 2014 levels counts as qualifying generation
Emission rates could fall as a result of additional generation at existing plants caused by rainfall changes. This could also open the door to credit generation from existing Canadian projects in certain cases.
Only incremental generation resulting from plant upgrades counts as qualifying generation
Changes in generation levels, in either direction, from 2014 would have less of an impact on emission rates. States would have more certain benefits from upgrades to plants. Credit from Canadian hydropower would be limited to new plants and upgrades.
* For a state that takes a mass-based approach to compliance, any additional hydropower that serves to displace fossil generation would help the state achieve compliance, regardless of whether the hydropower is qualifying generation.

Center for Climate and Energy Solutions28
and U.S. electricity systems discussed throughout this paper will remain regardless of EPA’s decisions in the Clean Power Plan. However, the Clean Power Plan offers the opportunity for states to take advantage of untapped hydropower resources in Canada as a source of zero-carbon, low-cost, reliable electricity.
The impact of Clean Power Plan is predicated on what EPA includes in the final rule, but several important state- and regional-level decision points will likely
remain. States will still have to determine what policies to put in their plans to comply with their final emission rate targets that are within the bounds set by EPA. Once state plans are finalized, regional grid operators and power companies will have to determine how to implement them. If enabled by EPA’s final rule, there should be ample opportunities for states to craft innovative policies and measures to take advantage of Canadian hydropower in a manner that achieves real emission reductions.
Canadian Hydropower and the Clean Power Plan 29
ENDNOTES
1 U.S. Energy Information Administration. 2014. “Annual Energy Outlook 2014: Renewable Energy Generating Capacity and Generation.” Available at http://www.eia.gov/forecasts/aeo.
2 National Energy Board, “Canada’s Energy Future 2013—Energy Supply and Demand Projections to 2035—An Energy Market Assessment. Chapter 8: Electricity Outlook.” November 2013. Available at: https://www.neb-one.gc.ca/nrg/ntgrtd/ftr/2013/index-eng.html#s8.
3 U.S. Department of the Interior Bureau of Reclamation, “Hydroelectric Power” July 2005. Available at: http://www.usbr.gov/power/edu/pamphlet.pdf.
4 Pumped storage is another type of hydropower plant. Pumped storage facilities use inexpensive electricity (typically overnight during periods of low demand) to pump water from a lower-lying storage reservoir to a storage reservoir located at a higher elevation than the power house (Figure 1) for later use during periods of peak electricity demand. Since this technology uses more electricity than it generates, it is not considered to be renewable. Note that it is economical to do this since the revenues that a generator receives during times of peak electricity generation far exceed the costs that they pay to pump the water during times of low electricity demand.
5 John Harrison, “Columbia River Treaty (1964).” The Oregon Encyclopedia, accessed February 2015, http://www.oregonencyclopedia.org/articles/columbia_river_treaty_1964_/#.VOtvay4YEsA.
6 A 2013 study by Black & Veatch highlights the economic and emissions benefits of hydropower, and imported hydropower specifically, on New England states. Hydro Imports Analysis (November 1, 2013) Available at: http://www.nescoe.com/uploads/Hydro_Imports_Analysis_Report_01_Nov__2013_Final.pdf. A MISO study explains that the flexibility benefits of hydropower resources could enable the grid operator to take fuller advantage of its wind resources. Jordan Bakke et al., MISO, Manitoba Hydro Wind Synergy Study. Available at: https://www.misoenergy.org/_layouts/MISO/ECM/Download.aspx?ID=160821.
7 U.S. Geological Survey, “The Water Cycle.” March 2014. Available at: http://water.usgs.gov/edu/watercycle.html.
8 Synapse Energy Economics, “Hydropower Greenhouse Gas Emissions.” February 2012; Alain Tremblay et al., “The Issue of Greenhouse Gases from Hydroelectric Reservoirs: From Boreal to Tropical Regions,” Table 1, p. 3 Available at: http://www.un.org/esa/sustdev/sdissues/energy/op/hydro_tremblaypaper.pdf.
9 Intergovernmental Panel on Climate Change. 2011. “IPCC Special Report on Renewable Energy Sources and Climate Change Mitigation.” Prepared by Working Group III of the Intergovernmental Panel on Climate Change. Available at: http://srren.ipcc-wg3.de/report; Pual J. Meier. 2002. “Life-Cycle Assessment of Electricity Generation Systems and Applications for Climate Change Policy Analysis, Ph.D. Dissertation, University of Wisconsin, Madison.” Available at: http://fti.neep.wisc.edu/pdf/fdm1181.pdf.
10 Note that pure run-of-river projects have negligible effects on flow and temperature.
11 Lea Kosnik. 2008. “The Potential of Water Power in the Fight against Global Warming in the U.S.,” Energy Policy (36): 3252-3265. Available at: http://www.umsl.edu/~kosnikl/Saved%20Emissions.pdf; Jim Carlton, “Deep in the Wilderness, Power Companies Wade In,” Wall Street Journal, August 2009. Available at: http://www.wsj.com/news/articles/SB125080811184347787?mg=reno64-wsj.

Center for Climate and Energy Solutions30
12 Kelsi Bracmort, Congressional Research Service. “Hydropower: Federal and Nonfederal Investment.” January 2013. Available at: http://fas.org/sgp/crs/misc/R42579.pdf.
13 Hydro is assumed to have seasonal storage so that it can be dispatched within a season, but overall operation is limited by resources available by site and season. The capacity factor for the marginal site modeled can vary significantly by region. The capacity factor range for hydroelectric is 30 percent to 65 percent.
14 U.S. Energy Information Administration, “Annual Energy Outlook 2014,” January 2014. Available at: http://www.eia.gov/forecasts/aeo/electricity_generation.cfm.
15 Ibid.
16 U.S. Energy Information Administration, “Assumptions to the AEO 2014.” May 2014. Available at: http://www.eia.gov/forecasts/aeo/assumptions/.
17 Dominion Virginia Power. “Dominion Virginia Power 15-Year Plan Targets Reliable, Cost-Effective Solutions for Growing Energy Needs.” Dominion News. September 1, 2011. Available at http://dom.mediaroom.com/index.php?s=26677&item=71833; Hydroworld, “Project Development: From Concept to Construction: Steps to Developing a Hydro Project.” April 2010. Available at: http://www.hydroworld.com/articles/hr/print/volume-29/issue-3/articles/project-development.html.
18 U.S. Energy Information Administration. “Total Energy: Table 7.2a.” Available at: http://www.eia.gov/totalenergy/data/monthly/#electricity.
19 Nuclear and hydropower are zero-emission sources in the sense that they emit no greenhouse gases from their primary generation activities. These sources can have very low levels of emissions from operation of emergency generators, HVAC, etc.
20 U.S. Energy Information Administration. “International Energy Statistics: Electricity: Capacity: Hydroelectric.” Available at: http://www.eia.gov/cfapps/ipdbproject/iedindex3.cfm?tid=2&pid=33&aid=7&cid=regions&syid=2008&eyid=2012&unit=MK; Shih-Chieh Kao, Oak Ridge National Laboratory, “New Stream-Reach Development: A Comprehensive Assessment of Hydropower Energy Potential in the United States.” April 2014.
21 Shih-Chieh Kao, April 2014.
22 Ibid.
23 Boualem Hadjerioua, Oak Ridge National Laboratory, “An Assessment of Energy Potential at Non-Powered Dams in the United States.” April 2012.
24 Douglas G. Hall, Idaho National Laboratory, “Feasibility Assessment of the Water Energy Resources of the United States for New Low Power and Small Hydro Classes of Hydroelectric Plants.” January 2006. Available at: http://www1.eere.energy.gov/water/pdfs/doewater-11263.
25 U.S. Energy Information Administration. 2014. “Annual Energy Outlook 2014: Renewable Energy Generating Capacity and Generation.” Available at: http://www.eia.gov/forecasts/aeo.
26 Statistics Canada, “Electric Power Generation: Table 127-0007.” Available at: http://www5.statcan.gc.ca/cansim/pick-choisir?lang=eng&p2=33&id=1270007.
27 Ibid.
28 Statistics Canada, “Installed generating capacity, by class of electricity producer, annual (kilowatts),” accessed February 24, 2015, http://www5.statcan.gc.ca/cansim/a33?RT=TABLE&themeID=4012&spMode=tables&lang=eng.

Canadian Hydropower and the Clean Power Plan 31
29 EEM Sustainable Management. 2007. “Study of Hydropower Potential in Canada.” Available at: https://canada-hydro.ca/reportsreference/external-reports. The technical potential is the maximum amount of electric capacity that could be added based on water flows, elevation, geography and so on. Considering environmental and economic factors, among other things, the total electric capacity that would be feasible is smaller than the technical potential. A study of this type has yet to be conducted.
30 United Nations Industrial Development Organization and International Center on Small Hydro Power. 2013. “World Small Hydro Development Report 2013: Canada.” Available at: http://www.smallhydroworld.org/.
31 SNL Energy, “Potential Canadian Hydro Projects.” February 12, 2015.
32 U.S. Energy Information Administration, “Today in Energy: Canada Week: The United States and Canada share the world’s most significant energy trade.” November 2012. Available at: http://www.eia.gov/todayinenergy/detail.cfm?id=8910.
33 Ibid.
34 Energy & Commerce Committee U.S. House of Representatives Chairman Fred Upton, “North American Energy Infrastructure Act Will Bolster U.S-Canada Electricity Relationship.” May 2014. Available at:: http://energycom-merce.house.gov/press-release/north-american-energy-infrastructure-act-will-bolster-us%E2%80%93canada-electricity.
35 Andrew Martinez et al., Integrated Canada-U.S. Power Sector Modeling with the Regional Energy Deployment System (ReEDS), (National Renewable Energy Laboratory, Golden, CO: February 2013), 34. Available at: http://www.nrel.gov/docs/fy13osti/56724.pdf.
36 Bipartisan Policy Center, “Clean Power Plan Comments Map,” last accessed March 27, 2015, http://bipartisan-policy.org/energy-map/.
37 Stephane Bordeleau, CBC News, “Where Canada’s Surplus Energy Goes.” March 31, 2011. Available at: http://www.cbc.ca/news/canada/where-canada-s-surplus-energy-goes-1.1109321.
38 Canadian Electricity Association. “Electricity 101.” August 2014. Available at: http://www.electricity.ca/media/Electricity101/Electricity101.pdf.
39 National Energy Board (Canada), “Electricity Exports and Imports Statistics,” accessed January 2015, https://apps.neb-one.gc.ca/CommodityStatistics/Statistics.aspx?language=english
40 Ibid.
41 Transmission Developers Inc., “Champlain Hudson Power Express: Project Development Portal: About the Project.” Accessed January 2015: http://www.chpexpress.com/about.php.
42 Trabish, Herman K., Utility Dive, “How ITC Holdings plans to connect PJM demand with Ontario’s rich renewables.” December 2014. Available at: http://www.utilitydive.com/news/how-itc-holdings-plans-to-connect-pjm-demand-with-ontarios-rich-renewables/341524/.
43 The Northern Pass, “Project Overview,” accessed February 2, 2015, http://northernpass.us/project-overview.htm; Allie Morris, Concord Monitor, “Northern Pass officials willing to bury more transmission lines, but how much more?” November 18, 2014. Available at: http://www.concordmonitor.com/news/work/business/14412887-95/northern-pass-officials-willing-to-bury-more-transmission-lines-but-how-much-more; John Herrick, VT Digger, “Hydro-Quebec looking south to new markets.” March 24, 2015. Available at: http://www.concordmonitor.com/news/work/business/14412887-95/northern-pass-officials-willing-to-bury-more-transmission-lines-but-how-much-more.
44 Herman K. Trabish, Utility Dive, “FERC approves Great Northern transmission line to link Manitoba hydro and Minnesota wind.” January 14, 2015. Available at: http://www.utilitydive.com/news/ferc-approves-great-northern-transmission-line-to-link-manitoba-hydro-and-m/352797/.

Center for Climate and Energy Solutions32
45 Minnesota Power, “Great Northern Transmission Line: Federal approval of a construction agreement for the Great Northern moves international transmission project forward.” December 2014. Available at: http://www.greatnorth-erntransmissionline.com/news/federal-approval-construction-agreement-great-northern-moves-international-transmission-project-forward/
46 Evan Ramstad, Star Tribune, “Minnesota Power files for new power line from Canada to Iron Range. April 16, 2014, http://www.startribune.com/business/255513641.html; for more information see Minnesota Power, “Great North Transmission Line,” http://www.greatnortherntransmissionline.com/files/8314/2349/4330/MP-GNTL_Handout_v13_20150109.pdf
47 World Bank Group, “Public-Private Partnership in Infrastructure Resource Center,” accessed February 5, 2015, http://ppp.worldbank.org/public-private-partnership/sector/energy/energy-power-agreements/power-purchase-agreements.
48 Minnesota Power, “Hydro,” accessed February 6, 2015, http://www.mnpower.com/Environment/Hydro.
49 Nancy Remsen, Burlington Free Press, “Board approves power deal with Hydro-Québec.” April 18, 2011. Available at: http://archive.burlingtonfreepress.com/article/20110418/NEWS03/110418018/Board-approves-power-deal-Hydro-Quebec.
50 Natural Resources Defense Council, “Carbon Pollutions Standards Fact Sheet: Iowa.” May 2014, http://www.nrdc.org/air/pollution-standards/files/cps-state-benefits-IA.pdf.
51 79 Fed. Reg. 34867 (June 18, 2014).
52 Kyle Aarons, Q&A: EPA Regulation of Greenhouse Gas Emissions from Existing Power Plants (Washington, DC: Center for Climate and Energy Solutions, 2015), http://www.c2es.org/docUploads/qa-epa-clean-power-plan.pdf.
53 Center for Climate and Energy Solutions, “Carbon Pollution Standards Map,” accessed March 17, 2015, http://www.c2es.org/federal/executive/epa/carbon-pollution-standards-map.
54 U.S. Environmental Protection Agency, Technical Support Document for Carbon Pollution Emission Guidelines for Existing Stationary Sources: GHG Abatement Measures (Washington, DC: U.S. Envrionemtnal Protection Agency, 2014), 4-1–4-2, http://www2.epa.gov/sites/production/files/2014-06/documents/20140602tsd-ghg-abatement-measures.pdf.
55 Edison Electric Institute, Comments of the Edison Electric Institute on Carbon Pollution Emission Guidelines for Existing Stationary Sources: Electric Utility Generation Units (December 1, 2014), 93–119, http://www.regulations.gov/#!documentDetail;D=EPA-HQ-OAR-2013-0602-23224.
56 Center for Climate and Energy Solutions, “Renewable and Alternative Energy Portfolio Standards Map,” accessed March 12, 2015, http://www.c2es.org/us-states-regions/policy-maps/renewable-energy-standards.
57 U.S. Environmental Protection Agency, Technical Support Document for Carbon Pollution Emission Guidelines for Existing Stationary Sources: GHG Abatement Measures, 4-5.
58 U.S. Environmental Protection Agency, Alternative RE Approach Technical Support Document (Washington, DC: U.S. Envrionemtnal Protection Agency, 2014), http://www2.epa.gov/sites/production/files/2014-06/documents/20140602tsd-alternative-re-approach.pdf.
59 Douglas G. Hall et al., Feasibility Assessment of the Water Energy Resources of the United States for New Low Power and Small Hydro Classes of Hydroelectric Plants (Idaho National Laboratory, Janurary 2006), http://www1.eere.energy.gov/water/pdfs/doewater-11263.pdf.
60 U.S. Environmental Protection Agency, Alternative RE Approach Technical Support Document, 5.
61 79 Fed. Reg. 34870 (June 18, 2014).
62 U.S. Environmental Protection Agency, Alternative RE Approach Technical Support Document, 8–13.

Canadian Hydropower and the Clean Power Plan 33
63 U.S. Environmental Protection Agency, Data File: Renewable Energy (RE) Alternative Approach (XLS), accessed March 12, 2015, http://www2.epa.gov/carbon-pollution-standards/clean-power-plan-proposed-rule-technical-documents.
64 EPA’s proposed approach projects a total of 521,513 gigawatt-hours of RE in the contiguous United States (Alaska and Hawaii are not included in IPM) by 2030. The alternative approach leads to a total projection of 524,066 gigawatt-hours, an increase of about 0.5 percent. State-by-state results can be found in EPA’s Alternative RE Approach Technical Support Document and the associated XLS Data File, available at: http://www2.epa.gov/carbon-pollution-standards/clean-power-plan-proposed-rule-technical-documents.
65 Bipartisan Policy Center, “Clean Power Plan Comments Map,” accessed March 27, 2015, http://bipartisanpolicy.org/energy-map/.
66 The reverse is not true. States are authorized to reduce power sector emissions through measures not included in EPA’s target setting methodology.
67 79 Fed. Reg. 34891 (June 18, 2014).
68 79 Fed. Reg. 34869 (June 18, 2014).
69 U.S. Environmental Protection Agency, Goal Computation Technical Support Document (Washington, DC: U.S. Envrionmental Protection Agency, June 2014), 3, 27, http://www2.epa.gov/sites/production/files/2014-06/documents/20140602tsd-goal-computation.pdf.
70 79 Fed. Reg. 34867 (June 18, 2014).
71 This could be unlikely in the West where 2011 and 2012 were particularly strong years for hydropower genera-tion. See, for example, 2012 hydropower generation figures relative to 2013 and 2014 in California, Idaho, Montana, Oregon, and Washington. U.S. Energy Information Administration, “Electricity Data Browser: Report 1.13: Net generation from hydroelectric (conventional) by state by sector,” accessed March 30, 2015, http://1.usa.gov/19pDqcW.
72 79 Fed. Reg. 34869 (June 18, 2014).
73 Regional Greenhouse Gas Initiative, “RGGI States’ Comments on Proposed Carbon Pollution Emission Guidelines for Existing Stationary Sources: Electric Utility Generation Units,” (November 5,2014), 22, http://www.rggi.org/docs/PressReleases/PR110714_CPP_Joint_Comments.pdf.
74 Ibid., 24.
75 79 Fed. Reg. 65496 (November 4, 2014).
76 James Duffy and Ann Weeks, Clean Air Task Force, Comments of Clean Air Task Force on the Carbon Pollution Emission Guidelines for Existing Stationary Sources: EGUs in Indian Country and U.S. Territories; Multi-Jurisdictional Partnerships (December 19, 2014), 11, http://www.regulations.gov/#!documentDetail;D=EPA-HQ-OAR-2013-0602-27987. NRDC notes that EPA should explore this option, but does not explicitly advocate for EPA to take this approach. David Doniger, Benjamin Longstreth, and Noah Long, Natural Resources Defense Council, Comments of Natural Resources Defense Council on the Carbon Pollution Emission Guidelines for Existing Stationary Sources: EGUs in Indian Country and U.S. Territories; Multi-Jurisdictional Partnerships (December 19, 2014), 4, http://www.regulations.gov/#!documentDetail;D=EPA-HQ-OAR-2013-0602-27979.
77 Center for Climate and Energy Solutions, “Renewable Energy Credit Tracking Systems,” accessed March 13, 2015, http://www.c2es.org/us-states-regions/policy-maps/renewable-energy-credit-tracking.
78 Since EPA’s proposed target setting incorporates state RPS policies, some of which are at least partially based on interstate and/or international electricity imports, a regional element to RE development would be implicitly included to some extent.

Center for Climate and Energy Solutions34
79 James J. Nipper et al., American Public Power Association, Comments of the American Public Power Association (APPA) on EPA’s Section 111(d) Proposed Rule for Carbon Dioxide from Existing EGUs (December 1, 2014), 210, http://www.regulations.gov/#!documentDetail;D=EPA-HQ-OAR-2013-0602-22871; Edison Electric Institute, Comments of the Edison Electric Institute on Carbon Pollution Emission Guidelines for Existing Stationary Sources: Electric Utility Generation Units (December 1, 2014), 193–199, http://www.regulations.gov/#!documentDetail;D=EPA-HQ-OAR-2013-0602-23224; David Doniger, Benjamin Longstreth, and Noah Long, Natural Resources Defense Council, Comments of Natural Resources Defense Council on the Carbon Pollution Emission Guidelines for Existing Stationary Sources: EGUs in Indian Country and U.S. Territories; Multi-Jurisdictional Partnerships, 4; Nathan Markey, New York Independent System Operator, Inc. (NYISO), Comments of the New York Independent System Operator, Inc. on the Carbon Pollution Emission Guidelines for Existing Stationary Sources: Electric Utility Generating Units in Indian Country and U.S. Territories; Multi-Jurisdictional Partnerships; Proposed Rule (December 19, 2014), http://www.regulations.gov/#!documentDetail;D=EPA-HQ-OAR-2013-0602-27984; Allison D. Wood et al., Hunton & Williams LLP on behalf of Utility Air Regulatory Group (UARG), Comments of the Utility Air Regulatory Group on the United States Environmental Protection Agency’s Carbon Pollution Emission Guidelines for Existing Stationary Sources: Electric Utility Generating Units; Proposed Rule (December 1, 2014), 195-196, http://www.regula-tions.gov/#!documentDetail;D=EPA-HQ-OAR-2013-0602-22768; Bipartisan Policy Center, “Clean Power Plan Comments Map.”
80 Dan Wyant, Michigan Department of Environmental Quality, Comments of Michigan Department of Environmental Quality on the Carbon Pollution Guidelines for Existing Stationary Sources:EGUs in Indian Country and U.S. Territories; Multi-Jurisdictional Partnership (December 19, 2014), 1, http://www.regulations.gov/#!documentDetail;D=EPA-HQ-OAR-2013-0602-29686.
81 Joanne Spalding et al., Sierra Club Environmental Law Program, Comments of Sierra Club and Earthjustice on the Carbon Pollution Emission Guidelines for Existing Stationary Sources: EGUs in Indian Country and U.S. Territories; Multi-Jurisdictional Partnerships (December 19, 2014), 43, http://www.regulations.gov/#!documentDetail;D=EPA-HQ-OAR-2013-0602-27986; In their comments in the original proposal, Sierra Club and Earthjustice note that they do not support all types of new hydropower, though they acknowledge that some limitations would not fall within the scope of the Clean Power Plan. “We do not support all new hydropower development, especially large projects that disrupt hydrological systems, destroy habitat and jeopardize protected species. However, we do not believe that it is within the scope of this rule for EPA to impose limits on which hydropower resources should be available for compliance, other than excluding existing hydropower as it has proposed.” Joanne Spalding et al., Sierra Club Environmental Law Program, Comments of Sierra Club and Earthjustice on the Carbon Pollution Emission Guidelines for Existing Stationary Sources: Electric Utility Generating Units (December 1, 2014, 112, http://www.regulations.gov/#!documentDetail;D=EPA-HQ-OAR-2013-0602-24029.
82 David Doniger, Benjamin Longstreth, and Noah Long, Natural Resources Defense Council, Comments of Natural Resources Defense Council on the Carbon Pollution Emission Guidelines for Existing Stationary Sources: EGUs in Indian Country and U.S. Territories; Multi-Jurisdictional Partnerships, 4.
83 Frank P. Prager, Xcel Energy Inc., Comments of Xcel Energy Inc. On the Carbon Pollution Emission Guidelines for Existing Stationary Sources: EGUs in Indian Country and U.S. Territories; Multi-Jurisdictional Partnerships (December 19, 2014), 4, http://www.regulations.gov/#!documentDetail;D=EPA-HQ-OAR-2013-0602-27335; Midwest Renewable Energy Tracking System, “REC Imports & Exports,” accessed March 13, 2015, http://www.mrets.org/registries/.
84 Dean Murphy, Onur Aydin, and Kent Diep, Electricity Market Overview for Manitoba Hydro’s Export Market in MISO (The Brattle Group: July 2013), slides 43-44. Available at:http://www.hydro.mb.ca/projects/development_plan/bc_docu-ments/appendix_05_3_electricity_market_overview_for_manitoba_hydros_export_market_in_miso.pdf.
85 One exception is that, according to the proposed rule, qualifying hydropower would help a state reduce its calculated emission rate if it displaces existing nuclear generation since only six percent of existing nuclear generation is factored into emission rates. In any case, a state would maximize reductions to its emission rate by displacing coal genera-tion with hydropower.

Canadian Hydropower and the Clean Power Plan 35
86 Joanne Spalding et al., Sierra Club Environmental Law Program, Comments of Sierra Club and Earthjustice on the Carbon Pollution Emission Guidelines for Existing Stationary Sources: EGUs in Indian Country and U.S. Territories; Multi-Jurisdictional Partnerships, 44.
87 Ibid.
88 Government of Canada, “Canada’s Action on Climate Action,” accessed March 23, 2015, http://www.climat-echange.gc.ca/default.asp?lang=En&n=AA3F6868-1.
89 Canada Consolidation: Reduction of Carbon Dioxide Emissions from Coal-fired Generation of Electriction Regulations (February 16, 2015), Section 3, Page 8. Available at: http://laws.justice.gc.ca/PDF/SOR-2012-167.pdf. (Converted from 420 metric tons / GWh to 925 lbs / MWh).
90 This plant is capturing more than 90 percent of CO2 emissions. Doug Vine, “Saskpower unveils first commercial-scale, coal-fired power plant to capture carbon,” C2ES Blog Post (September 29, 2014), http://www.c2es.org/blog/vined/saskpower-unveils-first-commercial-scale-coal-fired-power-plant-capture-carbon.
91 James Dion et al., A Climate Gift of a Lump of Coal? The emission impacts of Canadian and U.S. greenhouse gas regula-tions in the electricity sector (International Institute for Sustainable Development, September 2014), 6–10, http://www.iisd.org/sites/default/files/publications/climate-gift-or-lump-of-coal.pdf.
92 Ibid; Margo McDiarmid, CBC News “New coal plant regulations have ‘negligible effect,’ resport says,” September 18, 2014, http://www.cbc.ca/news/politics/new-coal-plant-regulations-have-negligible-effect-report-says-1.2770385.
93 Canada Consolidation: Reduction of Carbon Dioxide Emissions from Coal-fired Generation of Electriction Regulations (February 16, 2015), Section 29, Page 59. Available at: http://laws.justice.gc.ca/PDF/SOR-2012-167.pdf.
94 Pembina Institute, “Canada’s Renewable Energy Future,” accessed March 16, 2015, http://www.pembina.org/ re/canada.
95 Midwest Renewable Energy Tracking System, “REC Imports & Exports.”
96 Jennifer Beaudry and Lynn Wong, “Creating Cleaner Air in Ontario,” Ontario Press Release (April 15, 2014), http://news.ontario.ca/mei/en/2014/04/creating-cleaner-air-in-ontario-1.html; Adrian Morrow, The Globe and Mail “Carbon pricing coming to Ontario, strategy to be unveiled this year,” January 13, 2015, http://www.theglobeandmail.com/news/politics/carbon-pricing-coming-to-ontario-strategy-to-be-unveiled-this-year/article22422031.
97 Manitoba, Focused on What Matters Most: Manitoba’s Clean Energy Strategy (2012), 16, http://www.gov.mb.ca/ia/energy/pdfs/energy_strategy_2012.pdf.
98 Manitoba, Taxation Division, “Emissions Tax on Coal and Petroleum Coke,” accessed March 23, 2015, http://www.gov.mb.ca/finance/taxation/taxes/coal.html.
99 British Columbia Ministry of Finance, Budget and Fiscal Plan 2014/15–2016/17 (February 18, 2014), 64, http://bcbudget.gov.bc.ca/2014/bfp/2014_budget_and_fiscal_plan.pdf#page=74.
100 Benjamin Longstreth, Natural Resources Defense Council, Comments of the Natural Resources Defense Council on the Carbon Pollution Emission Guidelines for Existing Staionary Sources: Electric Utility Generating Units (December 1, 2014), 9-24–9-27, http://www.regulations.gov/#!documentDetail;D=EPA-HQ-OAR-2013-0602-26818.
101 79 Fed. Reg. 34922 (June 18, 2014).
102 79 Fed. Reg. 34922 (June 18, 2014).
103 Joanne Spalding, et al., Sierra Club Environmental Law Program, Comments of Sierra Club and Earthjustice on the Carbon Pollution Emission Guidelines for Existing Stationary Sources: EGUs in Indian Country and U.S. Territories; Multi-Jurisdictional Partnerships, 43–44.

Center for Climate and Energy Solutions36
104 These figures were calculated by dividing the difference between a state’s 2012 emission rate and the rate in the “Em. and Gen. Effect” column by the difference between a state’s 2012 emission rate and its proposed 2030 target rate. These figures are intended for illustrative purposes only and do not account for changes in demand between 2012 and 2030 or the specific generation type being displaced by a hypothetical new hydropower project, among other factors that would change the effect of new hydropower imports.
105 These figures were calculated by dividing the difference between a state’s 2012 emission rate and the rate in the “Em. Effect” column by the difference between a state’s 2012 emission rate and its proposed 2030 target rate. These figures are intended for illustrative purposes only and do not account for changes in demand between 2012 and 2030 or the specific generation type being displaced by a hypothetical new hydropower project, among other factors that would change the effect of new hydropower imports.
106 79 Fed. Reg. 65496 (November 4, 2014).
107 Joanne Spalding et al., Sierra Club Environmental Law Program, Comments of Sierra Club and Earthjustice on the Carbon Pollution Emission Guidelines for Existing Stationary Sources: EGUs in Indian Country and U.S. Territories; Multi-Jurisdictional Partnerships, 44.
108 Ibid.
109 Nathan Markey, New York Indpendent System Operator, Inc. (NYISO), 3.

The Center for Climate and Energy Solutions (C2ES) is an independent non-profit, non-partisan organization promoting strong policy and action to address the twin challenges of energy and climate change. Launched in 2011, C2ES is the succes-sor to the Pew Center on Global Climate Change.
CEN
TER FOR C
LIMATE A
ND
ENERG
Y SOLU
TION
SC
AN
AD
IAN
HY
DR
OPO
WER
AN
D TH
E CLEA
N PO
WER
PLAN
2101 Wilson Blvd., Suite 550 Arlington, VA 22201 P: 703-516-4146 F: 703-516-9551
WWW.C2ES.ORG