canadian gaming market report - gamblingcompliance data canadian gaming... · canadian gaming...
TRANSCRIPT

• TheGamblingDataCoreEstimate:According to the Canadian Gaming Association, a gambling industry trade group, the country’s unregulated Internet gambling market currently generates around C$1bn in revenues, annually. In comparison, a report from market research firm Ipsos on online gaming deposit levels published in April 2010 estimated C$868m of deposits and a participation rate of 8 percent of Canadian adults.
• TheUnregulatedInternetGamblingMarket: The Ipsos survey provided some picture on which products Canadians are gambling. Among respondents who gambled online at least once a year, 38 percent played poker, making it the most popular product. Next is sports at 30 percent, then comes skill games at 28 percent, casino slots, bingo and raffle tickets at 26 percent each, and casino table games at 23 percent. Horse race betting follows up at 20 percent of players.
• ExpansionofRegulatedInternetGamblingContinuesApace: In recent years, provincial lottery corporations in British Columbia, Ontario and Quebec have begun to broaden aggressively their online footprints. The British Columbia Lottery Corporation, though, has led the way and in July 2010 launched the first government-run Internet casino in North America.
• GrowthinLand-BasedGamingStalls: In FY2010, five consecutive years of growth in land-based gaming ground to a halt. According to the Canadian Gambling Digest, total revenues from government-run gaming in FY2010 were down 2.3 percent versus FY2009. Likewise, total revenues from horseracing in FY2010 were down 9.6 percent relative to FY2009. Total revenues from charity-run gaming in FY2010, however, were up 3.2 percent compared to FY2009.
Suite 704, 91 Waterloo Road,London, SE1 8RTTel: +44 207 921 [email protected]
Scott Longley+44(0)207 921 [email protected]
Matthew Gipon+44(0)207 921 [email protected]
CanadianGamingMarketReportMay2011
Font: Palatino RomanBlue: From gamblingdata.com, current live websiteRed: from gamblingcompliance.com, current live website
Logo revisions/options
This set shows the logos with the connecting ‘g’
Font: Palatino RomanBlue: From gamblingdata.com, current live websiteRed: from gamblingcompliance.com, current live website
Logo revisions/options
This set shows the logos with the connecting ‘g’
1

Canadian Gaming Market Report | May 2011Font: Palatino RomanBlue: From gamblingdata.com, current live websiteRed: from gamblingcompliance.com, current live website
Logo revisions/options
This set shows the logos with the connecting ‘g’
2
Contents Font: Palatino RomanBlue: From gamblingdata.com, current live websiteRed: from gamblingcompliance.com, current live website
Logo revisions/options
This set shows the logos with the connecting ‘g’
WhereWeAre
Land-Based Market
Internet Gambling Market
Land-BasedMarketInDetail
Overview
Lotteries
Casinos
Non-Casino Electronic Gaming Machines
Horseracing
Non-Charitable Bingo
Charitable Gaming
First Nations Casino Gaming
LookingAtTheOnlinePicture
Unregulated Market
Regulated Intraprovincial Markets
Regulated Interprovincial Markets
FutureOfTheInternetGamblingMarket
MarketParticipants:TheLikelyLine-Up
Unregulated
Regulated
Appendix
AboutGamblingData
3-
3-
4-
6-
6-
8-
9-
10-
11-
12-
13-
14-
15-
15-
17-
18-
19-
21-
21-
23-
24-
31-

Canadian Gaming Market Report | May 2011Font: Palatino RomanBlue: From gamblingdata.com, current live websiteRed: from gamblingcompliance.com, current live website
Logo revisions/options
This set shows the logos with the connecting ‘g’
3
WhereWeAre
Land-BasedMarket
In the fiscal year ended March 31, 2010, total revenues from government-run gaming — that is, from casino, electronic gaming machine, lottery and bingo proprietors across Canada’s 10 provinces — were approximately C$13.64bn, down from C$13.96bn during the same period in 2009, ac-cording to the Canadian Gambling Digest.
Casinos accounted for the largest share of total revenues from govern-ment-run gaming — 42 percent — in FY2010, unchanged from FY2009. Electronic gaming machines in venues other than casinos accounted for the second-largest share of total revenues from government-run gaming — 33 percent — in FY2010, again unchanged from FY2009. Ticket lotteries ac-counted for the third-largest share of total revenues from government-run gaming — 24 percent — in FY 2010, unchanged from FY2009. And lastly, bingo accounted for the remaining share of total revenues from govern-ment-run gaming — 1 percent — in FY2010, unchanged from FY2009.
Meanwhile, according to the data available to the Canadian Gambling Digest, total revenues from charity-run gaming in FY2010 were roughly C$1.05bn (excluding Prince Edward Island), compared to C$985m in FY2009 (excluding Prince Edward Island and Quebec) and total revenues from horseracing in FY2010 were an estimated C$362.4m, down from C$400.9m in FY2009.
In sum, total revenues from government-run gaming accounted for the largest share of overall gaming revenues — 91 percent — in FY2010, com-pared to 90.7 percent in FY2009. Total revenues from charity-run gaming accounted for the second-largest share of overall gaming revenues — 7 percent — in FY2009, up from 6.6 percent in FY2010. And lastly, total rev-enues from horseracing accounted for the remaining share of overall gam-ing revenues — 2 percent — in FY2010, down from 2.6 percent in FY2009
By province, Ontario boasts the largest population and the highest-grossing land-based gaming industry. Overall gaming revenues there were approxi-mately C$5.39bn in FY2010, down from C$5.5bn in FY2009. By contrast, Prince Edward Island has the smallest population and the lowest-grossing land-based gaming industry. Overall gaming revenues there were approxi-mately C$44.4m in FY2010, compared to C$45.3m in FY2009.
Font: Palatino RomanBlue: From gamblingdata.com, current live websiteRed: from gamblingcompliance.com, current live website
Logo revisions/options
This set shows the logos with the connecting ‘g’
Fig. 1
Fig. 2

Canadian Gaming Market Report | May 2011Font: Palatino RomanBlue: From gamblingdata.com, current live websiteRed: from gamblingcompliance.com, current live website
Logo revisions/options
This set shows the logos with the connecting ‘g’
4
InternetGamblingMarket
Unregulated
The Canadian Gaming Association estimates that the unregulated Internet gambling market currently generates around C$1bn in revenues annually, while a survey by market research firm Ipsos came up with an estimate in April 2010 of deposit levels of around C$868m.
However, given the scarcity of publicly available data on that market — indeed, only PartyGaming discloses its exposure to Canada — it is difficult to say with certainty whether it is growing, shrinking or stagnant. Further-more, it is difficult to say with certainty which Internet gambling product verticals are the highest and lowest grossing.
The Ipsos figures provide some kind of guide however. According to their data, which found a participation rate for online gaming among the adult population of 8 percent, it found that poker was the most popular product with people who played on the Internet at least once in the past year at 28 percent. Next up was sports betting at 30 percent, with skill games at 28 percent, and then casino slots, raffle tickets and bingo on 26 percent. Casino table games came in at 23 percent and horseracing was the least popular at 20 percent. See fig. 27.
In the absence of further publicly available data, GamblingData believes that the unregulated Internet gambling market is not shrinking. Legal experts interviewed for this report agree that at the federal level, there is little political will to crack down on offshore operators like PokerStars, Full Tilt and PartyGaming, although this might change particularly with regard to the first two depending on the reaction in Canada to the recent high-profile indictments issued by the US Department of Justice (DoJ). With a lax enforcement environment, therefore, offshore operators are facing little pressure to curb their marketing activity or otherwise reduce their exposure to Canada.
For the moment, it remains unclear what percentage of players that hold accounts with offshore sites will transfer their account holdings to sites operated by the provincial lottery corporations. GamblingData believes that as government-run Internet gambling expands, offshore operators will face increased competition for the Canadian Internet gambling dollar. If 95 cents of that dollar currently belongs to offshore operators, it is not unrea-sonable to assume that provincial lottery corporations will, in the near- to medium-term, likely begin to knock that number down. Much will depend on whether provincial lottery corporations can reach the level of operation-al excellence set by their offshore competitors.
Regulated
Regulated Internet gambling in Canada is in its early stages. At present, all five provincial lottery corporations — in the Atlantic provinces, British Columbia, Ontario, Quebec and the Western provinces — are operating, in the process of introducing, or mulling whether to introduce, Internet-based games of chance like poker, blackjack and roulette.
The British Columbia Lottery Corporation (BCLC), though, has led the way with its Internet gambling site, PlayNow.com. In July 2010, the corporation went live with casino games and poker, making British Columbia the first Canadian province to operate such games legally. Loto-Quebec followed suit and in December 2010 went live with casino games and poker on
Fig. 3

Canadian Gaming Market Report | May 2011Font: Palatino RomanBlue: From gamblingdata.com, current live websiteRed: from gamblingcompliance.com, current live website
Logo revisions/options
This set shows the logos with the connecting ‘g’
5
its own Internet gambling site, EspaceJeux.com. The Ontario Lottery and Gaming Corporation, meanwhile, intends to launch an Internet gambling site — or sites — in 2012.
GamblingData believes that data issued by the British Columbia Lottery Corporation provide useful — albeit limited — insight into how the regu-lated Internet gambling market is trending. In the five-year period ended March 31, 2010, the corporation grew Internet gambling revenues from C$5m to C$33.6m — a compound annual growth rate of 45.2 percent. Notably, that growth occurred prior to the corporation’s decision to intro-duce casino games and poker. With those games now on offer, the corpo-ration is projecting that Internet gambling revenue will rise from 1 percent of total revenue in FY2010 to approximately 4 percent of total revenue in FY2014.
Looking ahead, GamblingData believes that a clearer picture of Canada’s regulated Internet gambling market will begin to emerge after the fiscal year ending March 31, 2012. By that time, the public will have access to at least 12 months of operating results from the British Columbia Lottery Corporation and Loto-Quebec.
TrackingProvincialInternetGamblingExpansion
07.2010 Ontario announces plans to launch improved platform in 2012
08.2010 Quebec launches improved platform
12.2010 Atlantic provinces announce research on improved platform is ongoing
01.2011 Western provinces announce research on improved platform is ongoing
02.2011 British Columbia and Quebec pool Internet poker liquidity
04.2011 Western provinces announce research on improved platform is ongoing
Canadian Gaming Market Report | May 2011Font: Palatino RomanBlue: From gamblingdata.com, current live websiteRed: from gamblingcompliance.com, current live website
Logo revisions/options
This set shows the logos with the connecting ‘g’
6
Font: Palatino RomanBlue: From gamblingdata.com, current live websiteRed: from gamblingcompliance.com, current live website
Logo revisions/options
This set shows the logos with the connecting ‘g’
Land-BasedMarketInDetail
Overview
In 1985, the federal government transferred regulatory authority over gam-bling activity to the provincial governments. Principally, that decision was taken to head off competition between parliament and the provinces for gambling-related tax revenue.
In the 1990s, gambling expanded rapidly across the country as provincial governments became interested in growing tax receipts without raising personal and corporate levy rates. Governments aggressively invested in creating casinos and deploying electronic gaming machines, and, as a result, the Canadian gambling industry now generates more revenue than all other entertainment industries combined, according to a 2008 study commissioned by the Canadian Gaming Association.
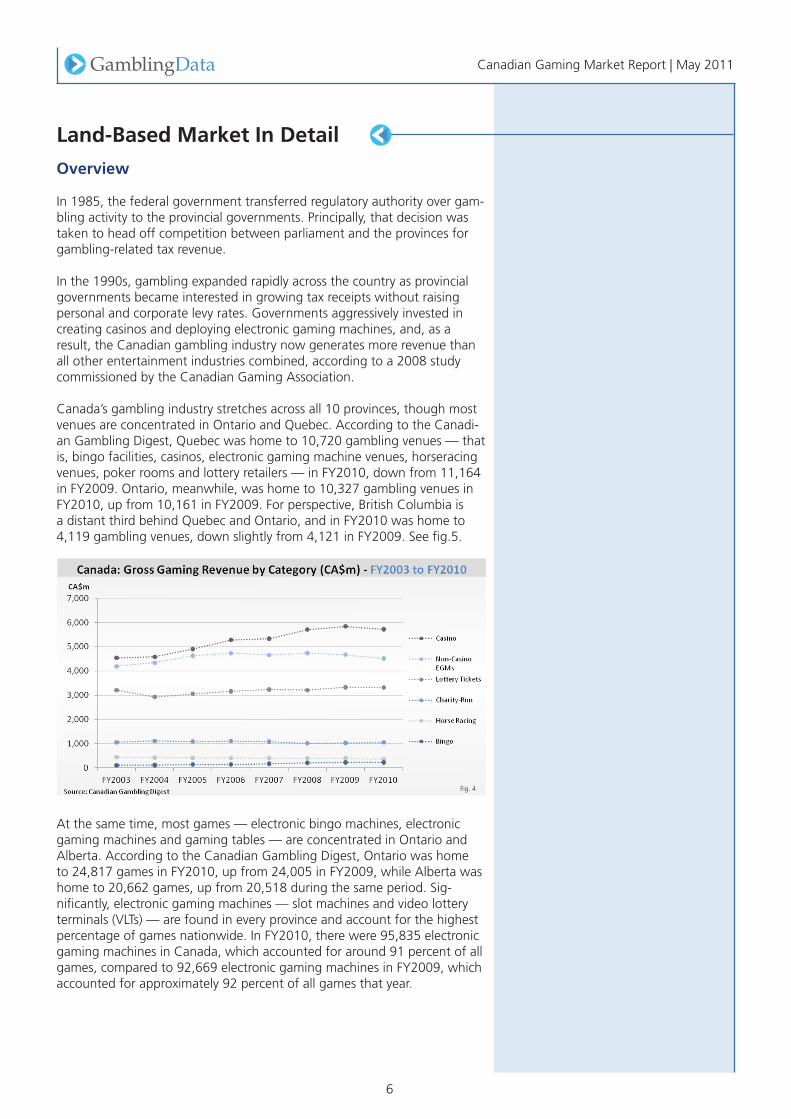
Canada’s gambling industry stretches across all 10 provinces, though most venues are concentrated in Ontario and Quebec. According to the Canadi-an Gambling Digest, Quebec was home to 10,720 gambling venues — that is, bingo facilities, casinos, electronic gaming machine venues, horseracing venues, poker rooms and lottery retailers — in FY2010, down from 11,164 in FY2009. Ontario, meanwhile, was home to 10,327 gambling venues in FY2010, up from 10,161 in FY2009. For perspective, British Columbia is a distant third behind Quebec and Ontario, and in FY2010 was home to 4,119 gambling venues, down slightly from 4,121 in FY2009. See fig.5.
At the same time, most games — electronic bingo machines, electronic gaming machines and gaming tables — are concentrated in Ontario and Alberta. According to the Canadian Gambling Digest, Ontario was home to 24,817 games in FY2010, up from 24,005 in FY2009, while Alberta was home to 20,662 games, up from 20,518 during the same period. Sig-nificantly, electronic gaming machines — slot machines and video lottery terminals (VLTs) — are found in every province and account for the highest percentage of games nationwide. In FY2010, there were 95,835 electronic gaming machines in Canada, which accounted for around 91 percent of all games, compared to 92,669 electronic gaming machines in FY2009, which accounted for approximately 92 percent of all games that year.
Fig. 4

Canadian Gaming Market Report | May 2011Font: Palatino RomanBlue: From gamblingdata.com, current live websiteRed: from gamblingcompliance.com, current live website
Logo revisions/options
This set shows the logos with the connecting ‘g’
7
VenuesbyProvince(FY2010vs.FY2009)
Province Venues(FY2010) Venues(FY2009) Venues/millionresidents
Quebec 10,720 11,164 1,360Ontario 10,327 10,161 785British Columbia 4,119 4,121 912Alberta 3,604 3,533 973
Nova Scotia 1,534 1,562 1,629
Newfoundland 1,541 1,512 3,021
Saskatchewan 1,470 1,461 1,412
New Brunswick 1,225 1,409 1,631
Manitoba 1,410 1,383 1,146
Prince Edward Island 266 266 1,877
Total 36,176 36,572 1,064
Source: Company data, Statistics Canada
GamesbyProvince(FY2010vs.FY2009)
Province Games(FY2010) Games(FY2009) Games/millionresidents
Ontario 24,817 24,005 1,886Alberta 20,662 20,518 5,581Quebec 18,135 17,312 2,301British Columbia 16,759 15,075 3,711
Manitoba 9,063 8,976 7,367
Saskatchewan 6,945 6,950 6,673
Nova Scotia 3,800 3,226 4,037
New Brunswick 1,981 2,312 2,638
Prince Edward Island 524 515 3,698
Total 104,745 101,041 3,082
Source: Company data, Statistics Canada
See fig. 28 in Appendix for breakdown of population.
Fig. 5
Fig. 6
Canadian Gaming Market Report | May 2011Font: Palatino RomanBlue: From gamblingdata.com, current live websiteRed: from gamblingcompliance.com, current live website
Logo revisions/options
This set shows the logos with the connecting ‘g’
8
Lotteries
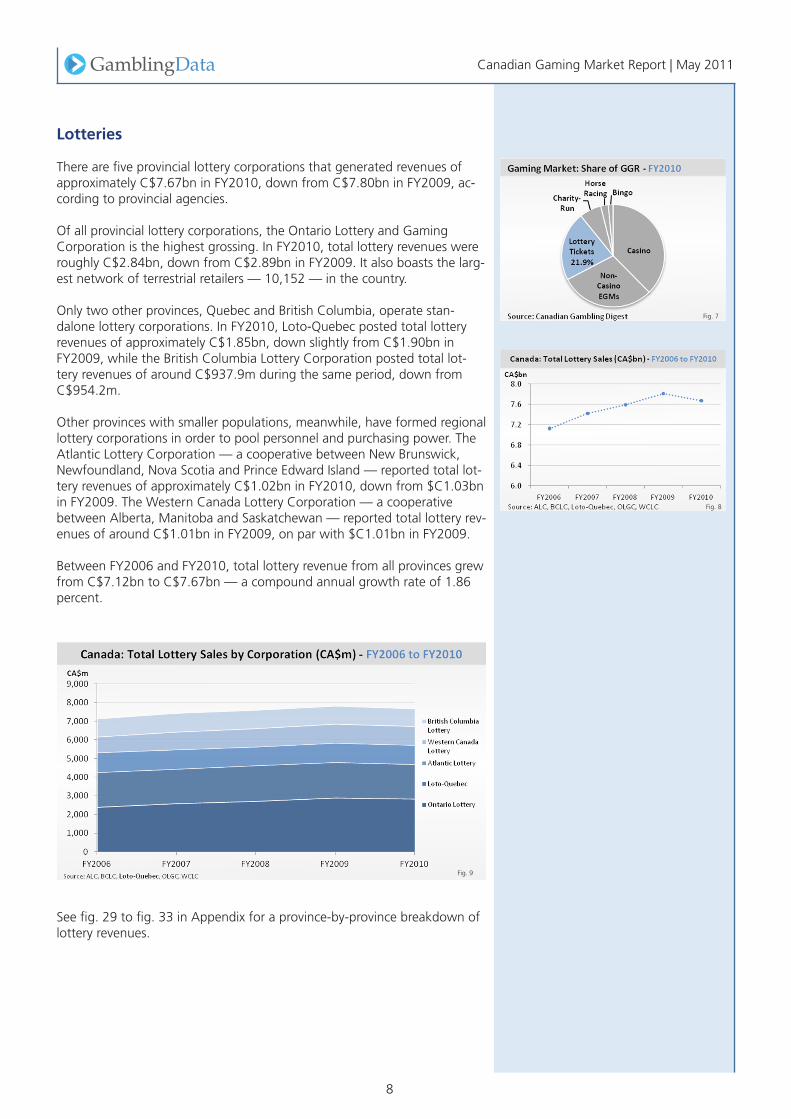
There are five provincial lottery corporations that generated revenues of approximately C$7.67bn in FY2010, down from C$7.80bn in FY2009, ac-cording to provincial agencies.
Of all provincial lottery corporations, the Ontario Lottery and Gaming Corporation is the highest grossing. In FY2010, total lottery revenues were roughly C$2.84bn, down from C$2.89bn in FY2009. It also boasts the larg-est network of terrestrial retailers — 10,152 — in the country.
Only two other provinces, Quebec and British Columbia, operate stan-dalone lottery corporations. In FY2010, Loto-Quebec posted total lottery revenues of approximately C$1.85bn, down slightly from C$1.90bn in FY2009, while the British Columbia Lottery Corporation posted total lot-tery revenues of around C$937.9m during the same period, down from C$954.2m.
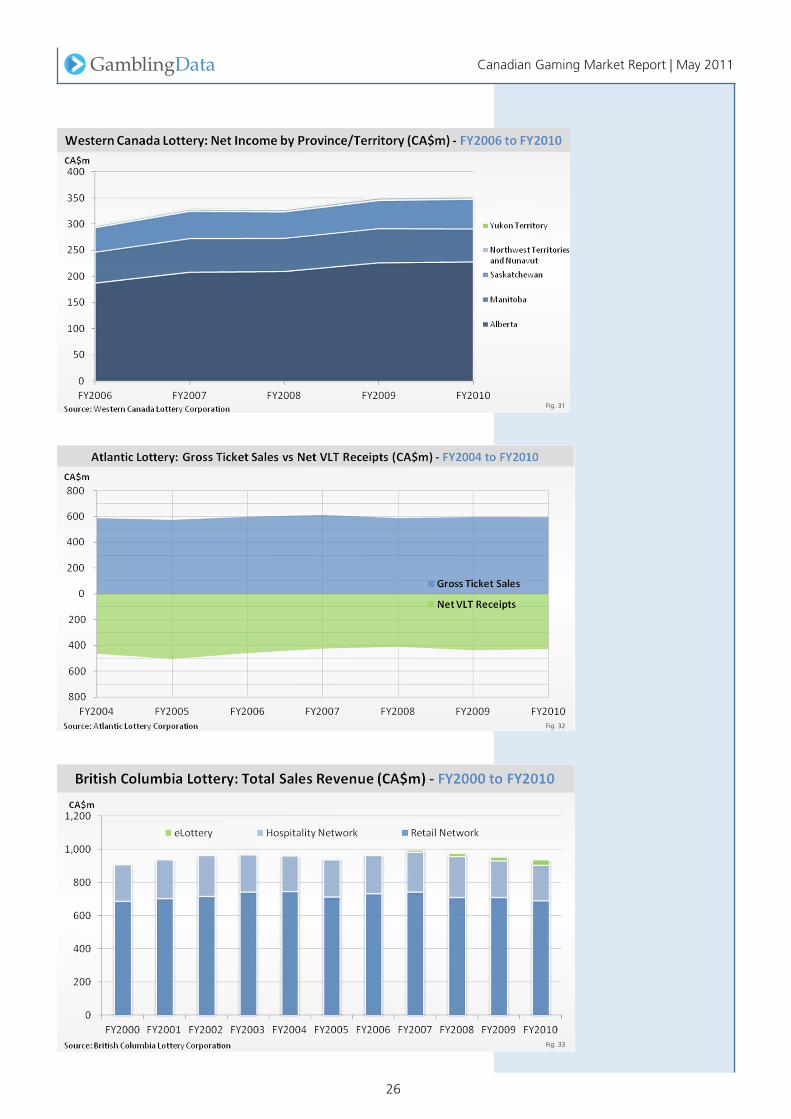
Other provinces with smaller populations, meanwhile, have formed regional lottery corporations in order to pool personnel and purchasing power. The Atlantic Lottery Corporation — a cooperative between New Brunswick, Newfoundland, Nova Scotia and Prince Edward Island — reported total lot-tery revenues of approximately C$1.02bn in FY2010, down from $C1.03bn in FY2009. The Western Canada Lottery Corporation — a cooperative between Alberta, Manitoba and Saskatchewan — reported total lottery rev-enues of around C$1.01bn in FY2009, on par with $C1.01bn in FY2009.
Between FY2006 and FY2010, total lottery revenue from all provinces grew from C$7.12bn to C$7.67bn — a compound annual growth rate of 1.86 percent.
See fig. 29 to fig. 33 in Appendix for a province-by-province breakdown of lottery revenues.
Fig. 7
Fig. 8
Fig. 9

Canadian Gaming Market Report | May 2011Font: Palatino RomanBlue: From gamblingdata.com, current live websiteRed: from gamblingcompliance.com, current live website
Logo revisions/options
This set shows the logos with the connecting ‘g’
9
Casinos
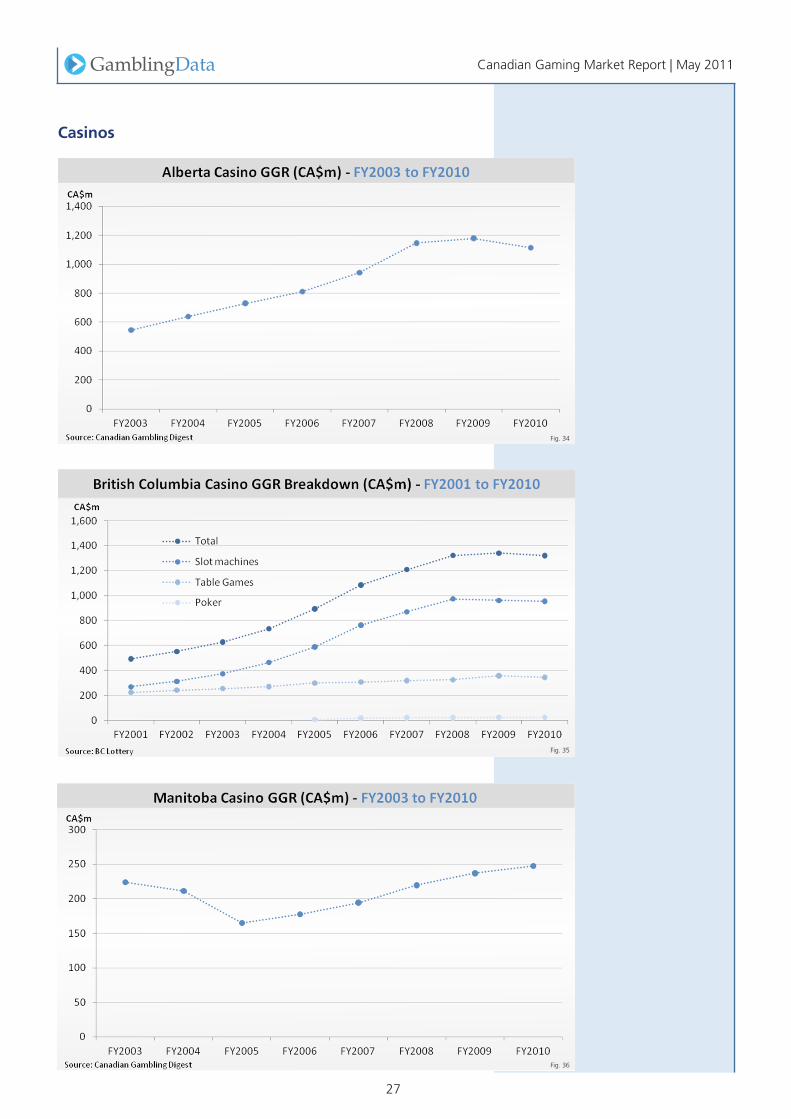
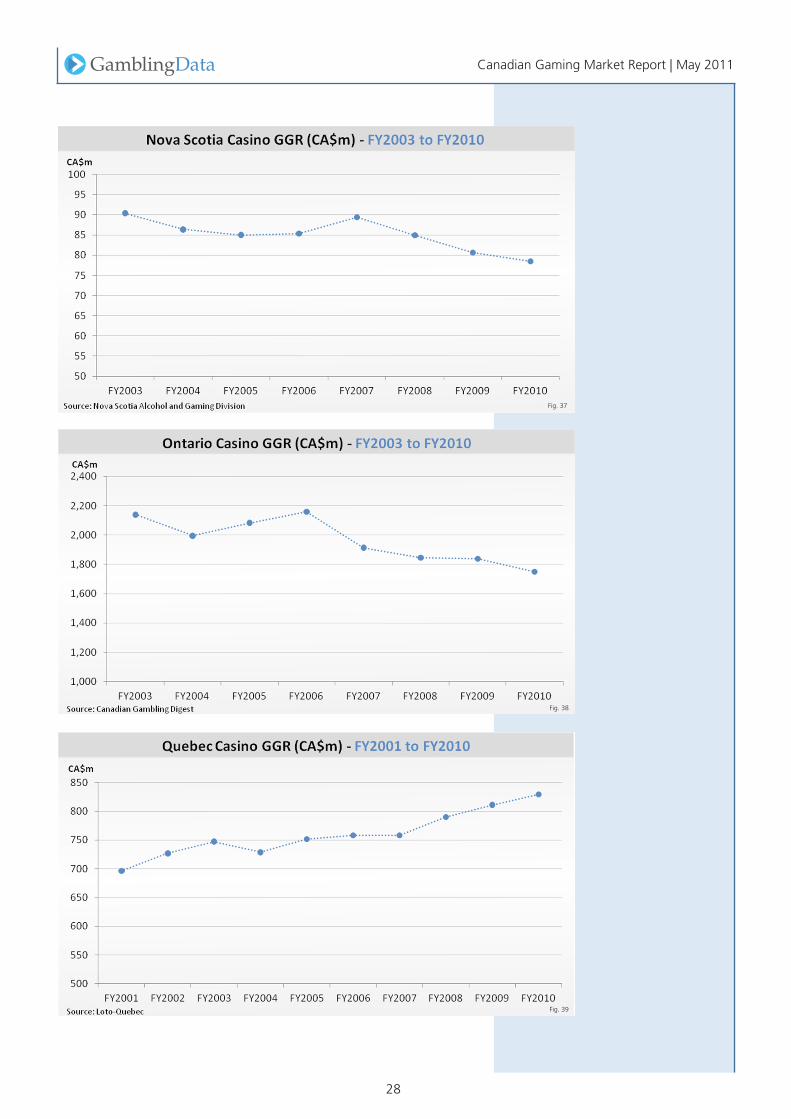
There are 71 casinos spread across eight provinces that generated total revenues of approximately C$5.72bn in FY2010, down from 68 casinos and C$5.83bn in FY2009, according to provincial agencies. The 2.0 percent decline in country-wide casino revenue observed in FY2010 called a halt to six consecutive years of growth in the metric. Of the seven provinces that operate government-run casinos, Alberta, Brit-ish Columbia and Saskatchewan have been the primary drivers of growth in the market since FY2003. Although Alberta has more casinos than any other province, Ontario generates more casino revenues than any other province. For perspective, Ontario’s 10 casinos accounted for around C$1.74bn, or 30.6 percent, of total casino revenues in FY2010, compared to British Columbia’s 17 casinos (C$1.32bn, 23.2 percent) and Alberta’s 24 casinos (C$1.11bn, 19.5 per-cent) during the same period. The broad trend of declining revenues in Ontario’s casino market since FY2003 was interrupted following the 2004 opening of Fallsview Casino Resort at Niagara Falls, which helped to boost casino revenues in the prov-ince by 4.4 percent in FY2005 and 3.7 percent in FY2006. This however proved to be a temporary halt to declining revenues in the province, as casino revenues dipped 11.4 percent in FY2007 before falling again in each of the last three fiscal years.
See fig. 34 to fig. 42 in Appendix for a province-by-province breakdown of casino revenues.
Fig. 10
Fig. 11
Fig. 12
Canadian Gaming Market Report | May 2011Font: Palatino RomanBlue: From gamblingdata.com, current live websiteRed: from gamblingcompliance.com, current live website
Logo revisions/options
This set shows the logos with the connecting ‘g’
10
Non-CasinoElectronicGamingMachines
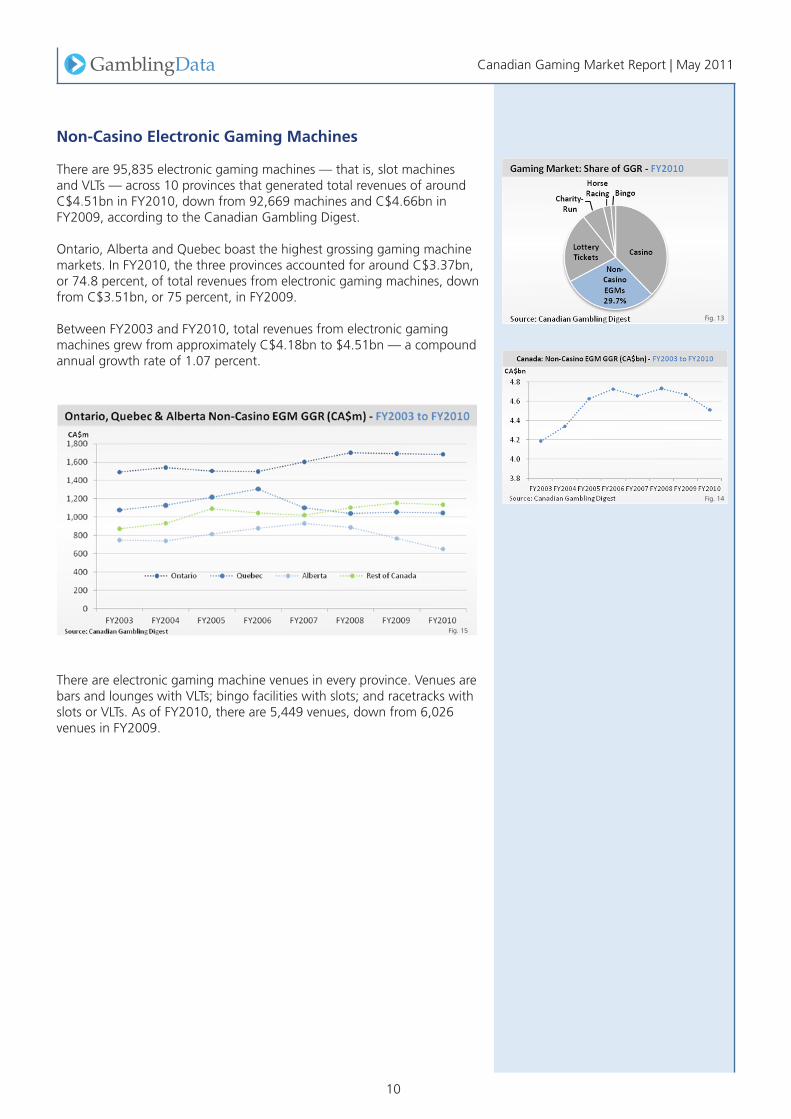
There are 95,835 electronic gaming machines — that is, slot machines and VLTs — across 10 provinces that generated total revenues of around C$4.51bn in FY2010, down from 92,669 machines and C$4.66bn in FY2009, according to the Canadian Gambling Digest.
Ontario, Alberta and Quebec boast the highest grossing gaming machine markets. In FY2010, the three provinces accounted for around C$3.37bn, or 74.8 percent, of total revenues from electronic gaming machines, down from C$3.51bn, or 75 percent, in FY2009.
Between FY2003 and FY2010, total revenues from electronic gaming machines grew from approximately C$4.18bn to $4.51bn — a compound annual growth rate of 1.07 percent.
There are electronic gaming machine venues in every province. Venues are bars and lounges with VLTs; bingo facilities with slots; and racetracks with slots or VLTs. As of FY2010, there are 5,449 venues, down from 6,026 venues in FY2009.
Fig. 13
Fig. 14
Fig. 15
Canadian Gaming Market Report | May 2011Font: Palatino RomanBlue: From gamblingdata.com, current live websiteRed: from gamblingcompliance.com, current live website
Logo revisions/options
This set shows the logos with the connecting ‘g’
11
Horseracing
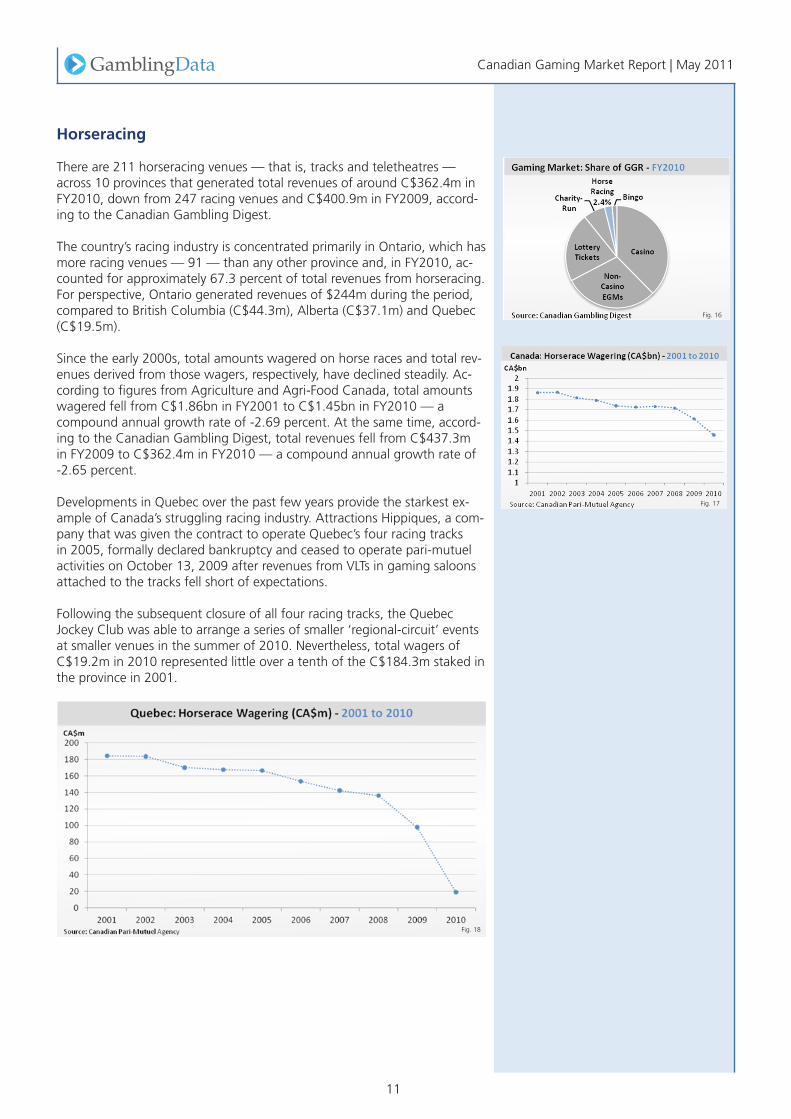
There are 211 horseracing venues — that is, tracks and teletheatres — across 10 provinces that generated total revenues of around C$362.4m in FY2010, down from 247 racing venues and C$400.9m in FY2009, accord-ing to the Canadian Gambling Digest. The country’s racing industry is concentrated primarily in Ontario, which has more racing venues — 91 — than any other province and, in FY2010, ac-counted for approximately 67.3 percent of total revenues from horseracing. For perspective, Ontario generated revenues of $244m during the period, compared to British Columbia (C$44.3m), Alberta (C$37.1m) and Quebec (C$19.5m). Since the early 2000s, total amounts wagered on horse races and total rev-enues derived from those wagers, respectively, have declined steadily. Ac-cording to figures from Agriculture and Agri-Food Canada, total amounts wagered fell from C$1.86bn in FY2001 to C$1.45bn in FY2010 — a compound annual growth rate of -2.69 percent. At the same time, accord-ing to the Canadian Gambling Digest, total revenues fell from C$437.3m in FY2009 to C$362.4m in FY2010 — a compound annual growth rate of -2.65 percent. Developments in Quebec over the past few years provide the starkest ex-ample of Canada’s struggling racing industry. Attractions Hippiques, a com-pany that was given the contract to operate Quebec’s four racing tracks in 2005, formally declared bankruptcy and ceased to operate pari-mutuel activities on October 13, 2009 after revenues from VLTs in gaming saloons attached to the tracks fell short of expectations. Following the subsequent closure of all four racing tracks, the Quebec Jockey Club was able to arrange a series of smaller ‘regional-circuit’ events at smaller venues in the summer of 2010. Nevertheless, total wagers of C$19.2m in 2010 represented little over a tenth of the C$184.3m staked in the province in 2001.
Fig. 16
Fig. 17
Fig. 18

Canadian Gaming Market Report | May 2011Font: Palatino RomanBlue: From gamblingdata.com, current live websiteRed: from gamblingcompliance.com, current live website
Logo revisions/options
This set shows the logos with the connecting ‘g’
12
Non-CharitableBingo
There are 195 non-charitable bingo facilities across six provinces that gener-ated total revenues of approximately $C229.2m in FY2010, compared to 209 facilities and C$226.1m in FY2009, according to provincial agencies.
Although Ontario has more non-charitable bingo facilities than any other province, British Columbia generates more non-charitable bingo revenues than any other province. For perspective, British Columbia’s 28 facilities accounted for around C$185.5m, or 80.9 percent, of total bingo revenues in FY2010, compared to Quebec’s 45 facilities (C$15.5m, 6.7 percent) and Ontario’s 74 facilities (C$13.9m, 6.1 percent) during the same period.
Between FY2003 and FY2010, total non-charitable bingo revenues grew from approximately C$112.1m to C$229.2m — a compound annual growth rate of 10.7 percent.
Fig. 19
Fig. 20

Canadian Gaming Market Report | May 2011Font: Palatino RomanBlue: From gamblingdata.com, current live websiteRed: from gamblingcompliance.com, current live website
Logo revisions/options
This set shows the logos with the connecting ‘g’
13
CharitableGaming
Total revenues from charitable gaming — that is, from bingo, raffles, casino games, pull tickets and poker — across nine provinces were at least $C1.05bn in FY2010 (excluding Prince Edward Island), up from C$985.4m in FY2009 (excluding Prince Edward Island and Quebec), according to pro-vincial agencies.
Ontario and Alberta dominate the charitable gaming market, and in FY2010, the two provinces accounted for approximately C$768.6m, or 72.9 percent, of total revenues from charitable gaming.
Between FY2004 and FY2010, total charitable bingo revenues rose from around C$1.01bn to C$1.05m — a compound annual growth rate of 0.56 percent.
Fig. 21
Fig. 22
Fig. 23

Canadian Gaming Market Report | May 2011Font: Palatino RomanBlue: From gamblingdata.com, current live websiteRed: from gamblingcompliance.com, current live website
Logo revisions/options
This set shows the logos with the connecting ‘g’
14
FirstNationsCasinoGaming
There are 16 First Nations casinos across five provinces that generated esti-mated total revenues of at least C$1bn in FY2010. The highest-grossing First Nations casino market is Ontario. According to the provincial lottery corporation there, total casino revenues from abo-riginal venues were at least C$551.2m. In Saskatchewan, meantime, total casino revenues were C$254.2m, while in Alberta total revenues were C$181.7m. At the time of writing figures for First Nations casino revenues in Manitoba were not publicly available.
*Excluding Manitoba Fig. 24
Canadian Gaming Market Report | May 2011Font: Palatino RomanBlue: From gamblingdata.com, current live websiteRed: from gamblingcompliance.com, current live website
Logo revisions/options
This set shows the logos with the connecting ‘g’
15
LookingAtTheOnlinePicture
UnregulatedMarket
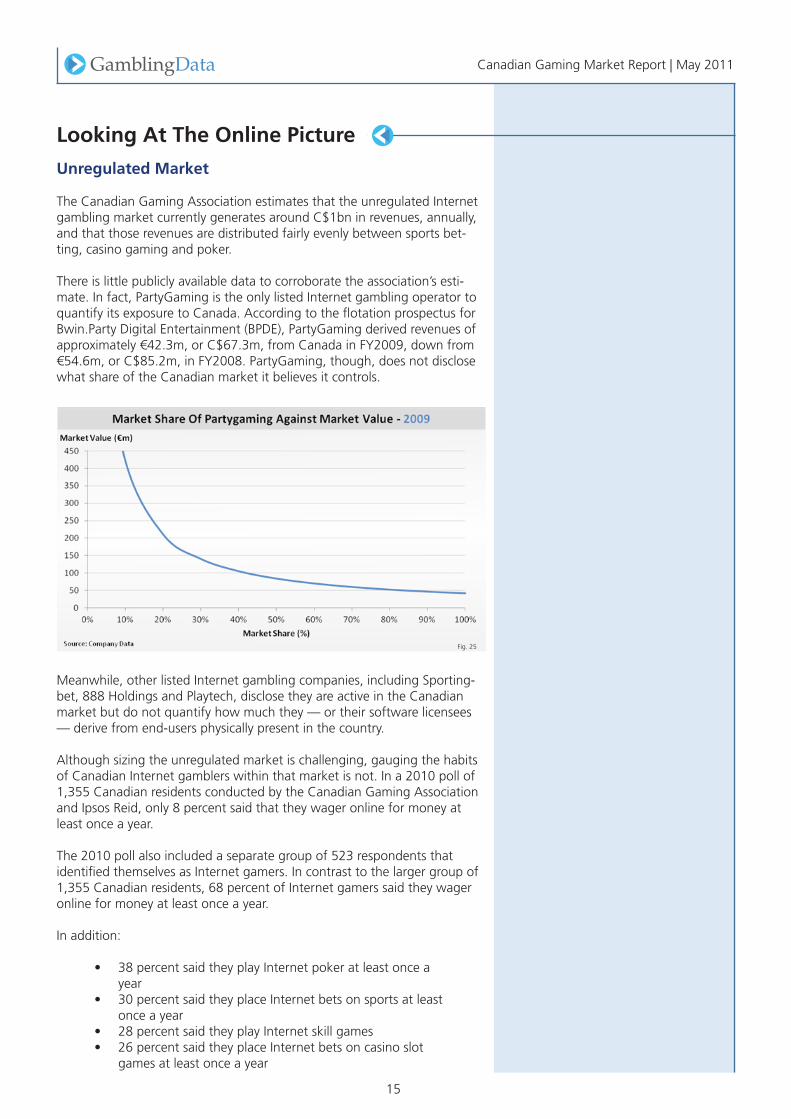
The Canadian Gaming Association estimates that the unregulated Internet gambling market currently generates around C$1bn in revenues, annually, and that those revenues are distributed fairly evenly between sports bet-ting, casino gaming and poker.
There is little publicly available data to corroborate the association’s esti-mate. In fact, PartyGaming is the only listed Internet gambling operator to quantify its exposure to Canada. According to the flotation prospectus for Bwin.Party Digital Entertainment (BPDE), PartyGaming derived revenues of approximately €42.3m, or C$67.3m, from Canada in FY2009, down from €54.6m, or C$85.2m, in FY2008. PartyGaming, though, does not disclose what share of the Canadian market it believes it controls.
Meanwhile, other listed Internet gambling companies, including Sporting-bet, 888 Holdings and Playtech, disclose they are active in the Canadian market but do not quantify how much they — or their software licensees — derive from end-users physically present in the country.
Although sizing the unregulated market is challenging, gauging the habits of Canadian Internet gamblers within that market is not. In a 2010 poll of 1,355 Canadian residents conducted by the Canadian Gaming Association and Ipsos Reid, only 8 percent said that they wager online for money at least once a year.
The 2010 poll also included a separate group of 523 respondents that identified themselves as Internet gamers. In contrast to the larger group of 1,355 Canadian residents, 68 percent of Internet gamers said they wager online for money at least once a year.
In addition:
• 38 percent said they play Internet poker at least once a year
• 30 percent said they place Internet bets on sports at least once a year
• 28 percent said they play Internet skill games• 26 percent said they place Internet bets on casino slot
games at least once a year
Font: Palatino RomanBlue: From gamblingdata.com, current live websiteRed: from gamblingcompliance.com, current live website
Logo revisions/options
This set shows the logos with the connecting ‘g’
Fig. 25

Canadian Gaming Market Report | May 2011Font: Palatino RomanBlue: From gamblingdata.com, current live websiteRed: from gamblingcompliance.com, current live website
Logo revisions/options
This set shows the logos with the connecting ‘g’
16
• 26 percent said they play Internet bingo at least once a year
• 26 percent said they purchase Internet raffle tickets at least once a year
• 20 percent said they place Internet bets on horse races at least once a year
Of the Internet gamers that reported playing Internet sports games, 22 percent said they bet on Internet sports pools, 21 percent said they bet on fantasy sports, and 21 percent said they bet on the outcome of a single match.
With regard to the amount of money Internet gamers had on deposit in their gaming accounts during a 12-month period ended March 22, 2010, 16 percent said between C$1 and $25 while just 6 percent said C$1800 or more. The poll found that Internet gamers, on average, had deposited C$319 into their accounts across the year, and that most deposits — 55 percent — were funded with credit card debt. See fig. 43 in Appendix.
Fig. 26
Fig. 27

Canadian Gaming Market Report | May 2011Font: Palatino RomanBlue: From gamblingdata.com, current live websiteRed: from gamblingcompliance.com, current live website
Logo revisions/options
This set shows the logos with the connecting ‘g’
17
RegulatedIntraprovincialMarkets
The regulated Internet gambling market in Canada is just beginning to take shape. Provincial lottery corporations have sold tickets and raffle chances via their websites since the mid 2000s, but last year, two of those corpo-rations began operating harder forms of Internet gambling within their borders. The remaining three lottery corporations, meanwhile, are contem-plating whether to broaden their online footprints in similar fashion.
BritishColumbia
In July 2010, the British Columbia Lottery Corporation went live with casino table games, slots and poker on its site, PlayNow.com. Rhonda Garvey, the corporation’s director of ebusiness, said in November 2010 that the revamped website had resulted in 25,000 new customer registrations. She also projected that Internet gambling revenues would rise from 1 percent of total revenues in FY2010 to approximately 4 percent of total revenues in FY2014. The corporation’s site — which was shut down for three weeks in August 2010 due to technical difficulties — runs on software provided by GTech G2 and OpenBet.
Loto-Quebec
In December 2010, Loto-Quebec went live with casino table games and poker on its site, EspaceJeux.com. When the site launched, provincial lot-tery officials projected that, by Christmas, between 10,000 and 20,000 customers would have registered. A revenue forecast, though, has not been provided. The Loto-Quebec site runs on software provided by Gtech G2 and OpenBet.
Ontario
In August 2010, the Ontario Lottery and Gaming Corporation began a consultation process on its plans to offer Internet gambling in 2012. At pre-sent, the corporation is mulling whether to operate its own site — as lot-tery corporations in British Columbia and Quebec have done — or engage one or more private operators to operate Internet gambling on its behalf. Provincial lottery officials have said that Internet gambling is expected to bring in revenues of between $100m and $500m, annually.
AtlanticProvinces
Although the Atlantic Lottery Corporation has expressed interest in expand-ing its Internet gambling offering, only one of its four provincial members — New Brunswick — is open to pursuing such expansion. In January 2011, provincial lottery officials said that the corporation had been consulting with British Columbia and Quebec on Internet gambling expansion. The officials added, though, that the corporation did not have “the necessary approvals to move ahead.”
WesternProvinces
The Western Canada Lottery Corporation has not received direction from its three provincial members — Alberta, Manitoba and Saskatchewan — to proceed with broadening its Internet gambling footprint, Andrea Marantz, the corporation’s communications director, said in April 2011. Marantz said, however, that research into Internet gambling is ongoing.

Canadian Gaming Market Report | May 2011Font: Palatino RomanBlue: From gamblingdata.com, current live websiteRed: from gamblingcompliance.com, current live website
Logo revisions/options
This set shows the logos with the connecting ‘g’
18
RegulatedInterprovincialMarket
In February 2011, the BCLC and Loto-Quebec began pooling Internet poker players on a shared platform called the Canadian Poker Network. Prelimi-nary operating statistics for that network, however, have not been released. Meanwhile, although other provincial lottery corporations — including the Atlantic Lottery Corporation — have informally expressed interest in joining the new network, none have announced plans to do so.
Canadian Gaming Market Report | May 2011Font: Palatino RomanBlue: From gamblingdata.com, current live websiteRed: from gamblingcompliance.com, current live website
Logo revisions/options
This set shows the logos with the connecting ‘g’
19
FutureOfTheInternetGamblingMarket
Based on interviews with legal experts, industry insiders and lottery of-ficials, GamblingData believes that provincial lottery corporations will continue to expand their Internet offerings apace.
Near term, lottery corporations will look to broaden the reach of the Cana-dian Poker Network. Players from British Columbia and Quebec are already participating on the network, and players from Ontario and New Brunswick will likely be the next to join — perhaps as early as CY2012. At present, though, there is no sound way to gauge how the network is performing. Lottery officials from British Columbia and Quebec declined to provide preliminary operating statistics when contacted by GamblingData in April 2011.
Eli Paper, a former director with Integrated Media Solutions, a Toronto-based firm that handles Internet gambling advertising, told GamblingData that lottery corporations in British Columbia and Quebec have not begun to promote aggressively the Canadian Poker Network — or their respective intraprovincial online offerings — via traditional media outlets yet.
“Perhaps there’s a lack of knowledge, or perhaps they’re just not ready yet, but the provincial lottery corporations haven’t really been promoting their poker assets via traditional media,” Paper said. “Everything I’ve seen that they’ve done has been very granular and mostly on the social media side, and they’re basically using people that they’ve hired to do affiliate work. But regarding all their other assets — you know, the traditional lottery and traditional scratchers and all that other good stuff — they still advertise them quite heavily.”
Paper and other experts on the ground in Canada, including Stuart Hoe-gner, a gaming attorney in Toronto, said that even if the provincial lottery corporations beef up their marketing spend, gaining ground on major dot.net advertisers like PokerStars and Full Tilt will be challenging — especially given that the federal government has shown very little interest in cracking down on dot.net advertising. Again, here it is yet to be seen what impact the recent indictments in the US will have on this area.
“At the federal level, there is no appetite for stepping up enforcement against dot-net advertising — none at all,” Paper said. “It’s not even on the radar screen.”
Paul Burns, chairman of the Canadian Gaming Association, a trade group, also told GamblingData that provincial lotteries will likely struggle to com-pete with offshore poker operators considering that those operators have access to players in Canada and other jurisdictions around the world.
“For the lotteries, the liquidity challenge is definitely there,” he said. “But it may solve itself as more provinces — particularly Ontario — decide to join the Canadian Poker Network. The lotteries are in a position to compete, but they are starting well behind established companies that have had a presence in Canada for three, five, seven — even ten — years. Out of the gate, I don’t see the lotteries competing with offshore sites on a product-for-product basis, but they are finding ways to differentiate themselves.”
Near term, GamblingData does not believe that the provincial lottery cor-porations will threaten the offshore Internet gambling industry’s de facto monopoly in Canada. But the introduction of a federal regulatory regime — one that includes restrictions on offshore gaming and dot-net advertis-
Font: Palatino RomanBlue: From gamblingdata.com, current live websiteRed: from gamblingcompliance.com, current live website
Logo revisions/options
This set shows the logos with the connecting ‘g’
“I don’t see the lotteries competing with offshore sites on a product-for-product basis, but they are finding ways to differentiate themselves.”- Paul Burns, chairman of the CGA
Canadian Gaming Market Report | May 2011Font: Palatino RomanBlue: From gamblingdata.com, current live websiteRed: from gamblingcompliance.com, current live website
Logo revisions/options
This set shows the logos with the connecting ‘g’
20
ing — could disrupt the playing field. Hoegner, the gaming attorney, told GamblingData, though, that the installation of such a regime is highly unlikely.
“First, the federal government ceded regulatory authority over gaming to the provinces over 25 years ago and it doesn’t want to get back into the game,” he said.
“Second, all the provinces would have to be on board, and getting all the provinces to agree on just about anything is impossible. I mean, the Constitution of this country was ratified with one significant abstention, which was Quebec. Even on basic human rights, the provinces can’t agree sometimes! So it’s an open question on whether they’re going to be able to agree on just about anything else.”

Canadian Gaming Market Report | May 2011Font: Palatino RomanBlue: From gamblingdata.com, current live websiteRed: from gamblingcompliance.com, current live website
Logo revisions/options
This set shows the logos with the connecting ‘g’
21
MarketParticipants:TheLikelyLine-Up
Unregulated
Just what effect, if any, the news of the indictments in the US will have on the unregulated market in Canada is very hard to assess. As can be seen, the three companies involved – PokerStars, Full Tilt and Absolute Poker – between them control a large slice of online gaming in Canada. It is far too early to assess if there will be an impact on the market, though the story from the poker tracking sites are that there has been an impact in terms of liquidity from the exit of their US players. Given that the Canadian poker players feed off the US liquidity, this is sure to be an issue.
PokerStars
Eli Paper, the former advertising director with Integrated Media Solutions, identified PokerStars as “the biggest player” in Internet gambling adver-tising in Canada. The company is aligned with the Toronto Maple Leafs, the country’s most-watched professional hockey franchise. Paper also said the company is “very strongly” aligned with TSN, a sports network which broadcasts the World Series of Poker and is partially owned by ESPN. TSN’s website, TSN.ca, even carries a downloadable poker application that, as Paper said, “is really just Stars’”.
FullTilt
Paper identified Full Tilt as the number two Internet gambling advertiser be-hind PokerStars. He said the company had advertised heavily around mixed martial arts events put on by the Ultimate Fighting Championship and its newly acquired subsidiary, Strike Force. He also said it had promoted its brand around televised broadcasts of Poker After Dark.
PartyPoker(controlledbyBwin.PartyDigitalEntertainment)
Paper identified PartyPoker as the number three advertiser behind Poker-Stars and Full Tilt. He said, though, that the company’s media buying had slowed markedly in recent years. It is worth noting that PartyGaming’s Canadian revenues fell from €60m in 2007 to €42.3m in 2009 — a com-pound annual growth rate of minus 16.04 percent.
Bet365
Paper identified Bet365 as a “significant” Internet gambling advertiser. The company bought Bowmans, a popular Internet sports book in Canada, in 2006. Paper also said the company has sponsorship deals in place with two Canadian Football League teams in Ontario: The Toronto Argonauts and the Hamilton Tigercats.
UltimateBet(AMemberOfTheCereusPokerNetworkWithAbso-lutePoker)
Paper identified Ultimate Bet a “significant” Internet gambling advertiser but said that the company did not have “the fair bit of spending power that Stars or Tilt has.” He said UltimateBet had advertised around mixed martial arts, professional wrestling and professional hockey, and that the company is currently promoting its brand in conjunction with Poker2Nite, a show broadcast weekly by the Versus Network.
Font: Palatino RomanBlue: From gamblingdata.com, current live websiteRed: from gamblingcompliance.com, current live website
Logo revisions/options
This set shows the logos with the connecting ‘g’
PokerStars is “the biggest player” in Internet gambling advertising in Canada.- Eli Paper, former advertising director of IMS

Canadian Gaming Market Report | May 2011Font: Palatino RomanBlue: From gamblingdata.com, current live websiteRed: from gamblingcompliance.com, current live website
Logo revisions/options
This set shows the logos with the connecting ‘g’
22
Bodog
Paper said Bodog is “very, very well known” among gamblers Canadian gamblers, but that the company has not invested heavily in advertising via traditional media outlets. “In terms of traditional media, we just don’t see a lot from Bodog,” he said.
Sportsbook.com
Paper said Sportsbook.com has advertised heavily around National Football League broadcasts that air in Canada.
OtherOperators
Based on a cursory survey of Canadian affiliates, the following operators and software suppliers are targeting Canadian gamblers:
• 888Holdings• Betfair• BetCRIS• BetED• BetUS• Canbet• PalaceGroup• Pinnacle• Sportingbet• TruePoker• VictorChandler

Canadian Gaming Market Report | May 2011Font: Palatino RomanBlue: From gamblingdata.com, current live websiteRed: from gamblingcompliance.com, current live website
Logo revisions/options
This set shows the logos with the connecting ‘g’
23
Regulated
ProvincialLotteryCorporations
The BCLC and Loto-Quebec have begun operating harder forms of Internet gambling-like casino games, poker and slots, and the Ontario Lottery and Gaming Corporation intends to begin doing so sometime in CY2012.
Caesars
Caesars operates Caesars Windsor, a land-based casino in Ontario. If the Ontario Lottery and Gaming Corporation elects to contract Internet gam-bling operations out to a private operator or operators, GamblingData expects Caesars — together with its online software provider, 888 Holdings — would bid for one of the contracts.

Canadian Gaming Market Report | May 2011Font: Palatino RomanBlue: From gamblingdata.com, current live websiteRed: from gamblingcompliance.com, current live website
Logo revisions/options
This set shows the logos with the connecting ‘g’
24
Font: Palatino RomanBlue: From gamblingdata.com, current live websiteRed: from gamblingcompliance.com, current live website
Logo revisions/options
This set shows the logos with the connecting ‘g’
Appendix-MarketNumbers
Population
PopulationByProvince
Province PopulationEstimate(April1,2010)
Ontario 13,161,183Quebec 7,882,895
British Columbia 4,515,482Alberta 3,702,408
Manitoba 1,230,275
Saskatchewan 1,040,735
Nova Scotia 941,403
New Brunswick 750,939
Newfoundland and Labrador 510,080
Prince Edward Island 141,694
Northwest Territories 43,739
Yukon 34,218
Nunavart 32,887
Total 33,987,938
Source: Statistics Canada Fig. 28

Canadian Gaming Market Report | May 2011Font: Palatino RomanBlue: From gamblingdata.com, current live websiteRed: from gamblingcompliance.com, current live website
Logo revisions/options
This set shows the logos with the connecting ‘g’
25
Lotteries
Fig. 29
Fig. 30
Canadian Gaming Market Report | May 2011Font: Palatino RomanBlue: From gamblingdata.com, current live websiteRed: from gamblingcompliance.com, current live website
Logo revisions/options
This set shows the logos with the connecting ‘g’
26
Fig. 31
Fig. 32
Fig. 33
Canadian Gaming Market Report | May 2011Font: Palatino RomanBlue: From gamblingdata.com, current live websiteRed: from gamblingcompliance.com, current live website
Logo revisions/options
This set shows the logos with the connecting ‘g’
27
Casinos
Fig. 34
Fig. 35
Fig. 36
Canadian Gaming Market Report | May 2011Font: Palatino RomanBlue: From gamblingdata.com, current live websiteRed: from gamblingcompliance.com, current live website
Logo revisions/options
This set shows the logos with the connecting ‘g’
28
Fig. 37
Fig. 38
Fig. 39

Canadian Gaming Market Report | May 2011Font: Palatino RomanBlue: From gamblingdata.com, current live websiteRed: from gamblingcompliance.com, current live website
Logo revisions/options
This set shows the logos with the connecting ‘g’
29
Fig. 40
Fig. 41
Fig. 42

Canadian Gaming Market Report | May 2011Font: Palatino RomanBlue: From gamblingdata.com, current live websiteRed: from gamblingcompliance.com, current live website
Logo revisions/options
This set shows the logos with the connecting ‘g’
30
Online
Fig. 43
Canadian Gaming Market Report | May 2011Font: Palatino RomanBlue: From gamblingdata.com, current live websiteRed: from gamblingcompliance.com, current live website
Logo revisions/options
This set shows the logos with the connecting ‘g’
31
AboutGamblingData The global gaming industry is changing fast. With many jurisdictions in transition between pre-and post-regulation, never has it been so important to have access to reliable data information about the market.
GamblingData provides clients with essential country, sector and com-pany analytics to help achieve the best possible understanding of the underlying facts, figures and trends in support of their business, com-petitor, product and market research activities.
GamblingData provides the facts, intelligence and analysis gaming businesses need to make the most of the opportunities in a volatile business environment.
We have a team of four dedicated business analysts researching, compil-ing and analyzing relevant gambling data points from over 150 jurisdic-tions.
We are able to provide tailored data research services specific to your company requirements and/or access to an online database with histori-cal data going back over 30 years.
Our database is updated in real time so you can be sure you are accessing the latest available research and has some market leading functionality allowing very focused intelligence gathering.
Font: Palatino RomanBlue: From gamblingdata.com, current live websiteRed: from gamblingcompliance.com, current live website
Logo revisions/options
This set shows the logos with the connecting ‘g’

Canadian Gaming Market Report | May 2011Font: Palatino RomanBlue: From gamblingdata.com, current live websiteRed: from gamblingcompliance.com, current live website
Logo revisions/options
This set shows the logos with the connecting ‘g’
32
Suite 704, 91 Waterloo Road,London, SE1 8RTTel: +44 207 921 [email protected]
Scott Longley+44(0)207 921 [email protected]
Matthew Gipon+44(0)207 921 [email protected]
Font: Palatino RomanBlue: From gamblingdata.com, current live websiteRed: from gamblingcompliance.com, current live website
Logo revisions/options
This set shows the logos with the connecting ‘g’
DisclaimerIn preparing this report GamblingCompliance Ltd. has made every effort to ensure the accuracy of the contents of this report. However, no representa-tion or warranty (express or implied) is given as to the accuracy or com-pleteness of the information contained in this report.
Any reader, or their associated corporate entity, that relies on any informa-tion contained in this report does so entirely at their own risk. Gambling-Compliance Ltd. and its employees do not accept or assume any liability, responsibility or duty of care for any consequences of you or anyone else acting, or refraining to act, in reliance on the information contained in this report or any decision based on it.
© Copyright 2011 GamblingCompliance Ltd. All rights reserved.
The intended use of this report is for purchasers only. No part of this report may be (i) copied, photocopied or duplicated in any form by any means or (ii) redistributed or republished without the prior written consent of Gam-blingCompliance Ltd.
Font: Palatino RomanBlue: From gamblingdata.com, current live websiteRed: from gamblingcompliance.com, current live website
Logo revisions/options
This set shows the logos with the connecting ‘g’