canadian development report 2009 - the north-south institute
TRANSCRIPT

The North-South InstituteFinancingDevelopment
in times of global crisis
2009Canadian Development Report


FinancingDevelopment
in Times of Global Crisis
Canadian Development Report 2009

The North-South Institute The North-South Institute is a charitable, not-for-profit corporation established in 1976 to provide professional, policy-relevant research on North-South issues and relations between industrialized and developing countries. The results of this research are made available to policy-makers, interested groups, and the general public to help generate greater under-standing and informed discussion of development questions. The Institute is independent, nonpartisan and cooperates with a wide range of Canadian, overseas, and international organizations working in related activities. The North-South Institute thanks the Canadian International Development Agency for providing a core grant. For more information about the Institute consult our website at www.nsi-ins.ca.
The editorial content of the Canadian Development Report represents the views and findings of the authors alone and not necessarily those of The North-South Institute’s directors, sponsors, or supporters, or those consulted in its preparation.
Canadian Development Report
1996/97- Issued also in French under title: Rapport canadien sur le développement. Includes bibliographical references.
ISSN 1206-2308 ISBN 978-1-897358-05-4 (2009 edition)
1. Developing countries-Social conditions-Periodicals. 2. Economic assistance, Canadian-Developing countries-Periodicals. 3. International economic relations-Periodicals. 4. Civil rights-Developing countries-Periodicals. 5. Developing countries-Foreign economic relations-Periodicals.
I. North-South Institute (Ottawa, Ont.)
Managing Editor: Lois L. Ross Layout and Cover Design: Green Communication Design inc. Editorial Team: Lois L. Ross, Souleima El Achkar, Maureen Johnson, Peter Thornton Translation: Société Eskénazi Inc. Cover and Title Page Photos: Woman working in local office of the “People’s Bank”. Uzbekistan (World Bank). © The North-South Institute/L’Institut Nord-Sud, 2009 Price: C$35.00
Available from: Renouf Publishing Co. Ltd. 5369 Canotek Road, Unit 1 Ottawa, Ontario K1J 9J3 Tel.: (613) 745-2665 Fax: (613) 745-7660 Email: [email protected] Website: www.renoufbooks.com
F.P.O. place FSC logo
here

The North-South Institute gratefully acknowledges the generous financial
support of the following donors in the publication of the
Canadian Development Report 2009


Benefactors(Donations of more than $20,000)

Supporters(Donations between $4,000 and $9,999)
Aga Khan Foundation Canada Fondation Aga Khan Canada

Contributors(Donations between $1,000 and $3,999)

viii

Preface
Roy Culpeper ............................................................................................ xi
Chapter One
The Changing Landscape of Development Finance
Amar Bhattacharya .................................................................................... 1
Chapter Two
Innovative Financing
John W. Foster and Rodney Schmidt ......................................................... 23
Chapter Three
New Forms of Cooperation: For What and For Whom?
The Case of the Bank of the South
Fabrina Furtado ........................................................................................ 45
Chapter Four
Reorienting Development Finance Through Enhanced
Domestic Resource Mobilization in Developing Countries
Roy Culpeper and Aniket Bhushan .......................................................... 69
Statistical Annex ....................................................................................... 99
Canadian Development Report 2009
Financing Development in Times of Global CrisisTable of Contents

x

xi
Preface
The subject for this year’s Canadian Development Report was conceived early in 2008. The upcoming International Conference on Financing for Development in Doha at the end of November provided a clear context. The conference was to review achievements since March 2002, the date of the first International Conference on Financing for Development held in Monterrey, Mexico, as well as current prospects.
The five years after the Monterrey conference constituted a period of growth and increasing global prosperity. Indeed, economic growth throughout the developing world significantly outpaced that of the industrial countries, as Amar Bhattacharya points out in his chapter of this report. In this favourable economic environment, mobilizing the resources necessary to reduce poverty and meet the other Millennium Development Goals seemed to be progres-sively more achievable, except in Sub-Saharan Africa, despite its unprecedented growth rate. Moreover the serious challenges posed for the developing countries by climate change meant that the development resources needed for the poorest countries and people would have to be significantly greater. But on balance the outlook became increasingly positive during this heady period.
By August 2007, however, the financial crisis emerged in the United States with the meltdown in the sub-prime mortgage market. In the next six months it spread to other parts of the financial system in the U.S. and in Europe, and by the latter half of 2008 it had engulfed the emerging markets as well.
Accordingly, as the report’s chapters were being drafted during the summer months of 2008, the world was being transformed by the growing international financial crisis. Not since the 1930s had a crisis of such magnitude erupted, and as it deepened during the year, parallels with the Great Depression were increasingly being drawn. The context for this report had been radically transformed.
As the crisis had become global in scope, the Group of Eight industrial countries realized that urgent measures were needed both domestically and internationally. Rescue packages of several hundreds of billions of dollars were quickly assembled in the U.S., Europe and China. To ensure maximum cooperation it became imperative to include the emerging markets in international deliberations and actions. For the first time, leaders from the Group of Twenty industrial and emerging market countries met on November 15, 2008 in Washington to discuss their collective response to the crisis. They announced a series of initiatives in mon-etary, fiscal, and financial policies, and agreed to meet in 2009 to monitor progress and take further action as necessary.
Meanwhile, the conference on financing for development proceeded as planned in Doha at the end of November. But by then it had been overshadowed by the crisis and by the extraordinary meeting of the G-20 Leaders, and the unprecedented measures they were taking. In particular, the major industrial countries had by the last quarter of 2008 collectively

xii
allocated about $4 trillion dollars to rescue their failing economies, with more likely to follow. Such magnitudes made the efforts to enhance flows of international development aid, which had peaked at around US$120 billion in 2006, pale in comparison.
Another issue provoked by the industrial countries’ response to the crisis related to the nature of global governance. While the G-20 undoubtedly encompassed the countries at the epicentre of the crisis, producing the bulk of the world’s output, and home to the majority of the world’s population, it excluded the other 172 nations that are member-states of the United Nations. The G-20 was therefore regarded by many of these other countries as lacking legitimacy. Moreover, the Doha conference, which was convened by the United Nations, provided a natural opportunity to include the entire world community in a global response to the crisis. But the G-20 chose not to include the UN or the Doha conference in its initiatives.
It is against this backdrop that the Canadian Development Report 2009 presents a case that international financing for development cannot, and must not, be regarded as an issue that is ancillary to resolving the global financial crisis. As the crisis deepens and spreads to the “real” economy, undermining trade and investment, the role played by the developing countries (not only the emerging markets) in global economic recovery will be critical. Indeed, the developing countries have emerged as the dynamos of world economic growth, particularly during the last decade. The deeper the contagion in the developing world, the longer and more painful will be the recovery in the industrial countries.
The chapters that constitute CDR 2009 present different facets of these issues. In Chapter 1, Amar Bhattacharya chronicles the impressive advances made in financing for development since 2002 until the storm-clouds of the financial crisis gathered. In the second chapter John Foster and Rodney Schmidt argue that the time for an international currency transaction tax has come. If such a tax were levied and allocated to international development financing, it could increase official development assistance flows by at least 30 per cent. Moreover, the tax would be set at such a low level that it would not disrupt, in fact it would barely be noticed by, currency markets.
The third and fourth chapters in a sense presaged the current international financial crisis. In particular, they raise the issue of how developing countries might insulate themselves from the vagaries of international financing flows—both those that leave indebtedness and crisis in their wake, and the lob-sided relationships often entailed by foreign aid. These chapters examine the potentials of greater recourse to the resources available regionally or domestically. However, in Chapter 3 Fabrina Furtado finds that the nature of development being financed by regional initiatives in Latin America such as the Bank of the South does not respond to popular demands for greater economic equality and inclusion in decision-making. It does not therefore differ substantially from that supported by the World Bank, international aid, or foreign direct investment.

xiii
Finally in the concluding chapter Aniket Bhushan and Roy Culpeper examine the case for enhancing domestic resource mobilization in Sub-Saharan Africa. They argue that this would both facilitate an exit from chronic aid dependence, and confer greater ownership of and coherence in the development strategies of low-income countries.
In conclusion, the Canadian Development Report 2009 supports an argument that the current global crisis presents crucial opportunities to all countries, individually and collectively. Ultimately these relate to devising strategies of economic growth and development that are more equitable and sustainable. Such strategies will require rethinking the ideas that have become conventional wisdom since 1980, including the merits of financial globalization. They will also involve relearning the lessons of an older generation, taught by the Great Depression1. If these opportunities are not seized, it is certain that the world will continue to careen from one serious crisis to the next, as it has done frequently over the past thirty years.
Roy Culpeper President & CEO The North-South Institute
January 2009
1 Paul Krugman, The Return of Depression Economics and the Crisis of 2008. New York and London: W.W. Norton, 2009.


INNovATIvE FINANCING 1
oNEChapter
The Changing Landscape of Development Finance
Amar Bhattacharya

CANADIAN DEvELoPMENT REPoRT 2009 — FINANCING DEvELoPMENT IN TIMES oF GLoBAL CRISIS2

ThE ChANGING LANDSCAPE oF DEvELoPMENT FINANCE 3
The Changing Landscape of Development FinanceAmar Bhattacharya
In the six-and-a-half years since the landmark conference on Financing for Development and the adoption of the Monterrey Consensus, developing countries have made major strides in accelerating growth and progress towards the internationally agreed development goals. Indeed the past decade has been an important turning point: not only have developing countries surpassed the developed world in growth performance, but they have now become the dominant engine of global growth.
Propitious developments in financing conditions have helped bring about these outcomes. Most important has been the broad-based improvement in domestic savings of developing countries, the result of better policies and a buoyant world economy. These two factors have also spurred a resurgence in private capital inflows and a sharp increase in remittances. On the other side of the Monterrey compact, notably the commitments made by the developed world, significant progress has been made in reducing the debt burden of the poorest coun-tries. Since Monterrey, there has also been an increase in Official Development Assistance (ODA) marking a reversal from the declines of the previous two decades. While world trade expanded rapidly until recently on account of a buoyant world economy, the Doha Development Round on trade has remained stalled, and consequently no progress has been made in reducing agricultural barriers that are especially detrimental to the prospects of large segments of the poor in developing countries. Finally, little progress has been made in the reform of the international financial architecture so as to mitigate the volatility of capital flows to developing countries and to help insulate them from the potentially adverse consequences.
Notwithstanding the generally favorable financing environment since Monterrey, major challenges lie ahead. The countries most at risk of not achieving the Millennium Development Goals (MDGs) face the most difficult financing constraints in accelerating progress towards these goals. Many of these countries are in Sub-Saharan Africa (SSA). The financial crisis that has now encompassed the world poses major risks to the financing outlook and development prospects for both emerging markets and low-income countries. And there is an important new challenge that has come to the fore since Monterrey, and that is how to meet the very large and additional financing requirements for climate mitigation and climate adaptation if climate change is not to derail development. This chapter reviews the changes that have taken place in the different elements of the financing for development agenda since Monterrey, and it concludes with an assessment of the challenges that lie ahead, given the unfinished agenda and new developments since Monterrey.

CANADIAN DEvELoPMENT REPoRT 2009 — FINANCING DEvELoPMENT IN TIMES oF GLoBAL CRISIS4
From Divergence to ConvergenceThe growing gap between the developed and the developing world has been one of the striking characteristics of the 20th century. As one researcher puts it, “from 1870 to 1990 the ratio of per capita incomes between the richest and the poorest countries increased by roughly a factor of five…as a result of the very different paths in the long-run performance of the two sets of countries” (Pritchett, 2003). Among the developed countries — identified as European countries and their offshoots, and Japan — long-run growth has been rapid since 1870 and characterized by growing convergence within the group. In contrast, growth of developing countries has been much slower on average and with virtually no cases of long-term convergence. The only exceptions were the four newly industrializing economies of East Asia — South Korea, Taiwan Province, Hong Kong SAR and Singapore — all of which were greatly influenced by, and linked to, the rise of Japan.
This pattern of diverging growth performance between the developed and the developing world appears to have been reversed in the 1990s (Figure 1). Led by East Asia and by China in particular, the growth of the developing world accelerated during the 1990s so that for the first time it was higher than the developed world on a sustained basis. This trend towards convergence appears to have solidified since 2000. Growth of developing countries has accelerated further in this decade so that it is now more than twice that of developed countries. Their contribution to global growth has also commensurately increased, rising from 40 per cent in 2000 to more than 70 per cent in the last two years.
10
8
6
4
2
0
-2
Real GDP, percentage change Forecast
Developing economies
Sub-SaharanAfrica
High-income
1981
1982
1983
1984
1985
1986
1987
1988
1989
1990
1991
1992
1993
1994
1995
1996
1997
1998
1999
2000
2001
2002
2003
2004
2005
2006
2007
2008
2009
Source: World Bank
Figure 1: Growth Trends, 1981-2009 (Per cent)

ThE ChANGING LANDSCAPE oF DEvELoPMENT FINANCE 5
The improved growth performance of developing countries in this decade reflects the continued strong growth of Asia led by China and India. But it is also due to broad-based gains in growth across all developing regions. Most strikingly, there has been a significant acceleration in growth of SSA. After two lost decades, growth has accelerated in the continent since the mid-1990s. These gains have been solidified in this decade, with Gross Domestic Product (GDP) growth averaging 6 per cent since 2005. This growth acceleration appears to be a turning point, reflecting not just favorable terms of trade, but improved policies and economic fundamentals and fewer conflicts (Go and Page, 2008).
In addition to stronger growth, developing countries have demonstrated greater resilience to economic downturns this decade. They were less affected by the global slowdown in 2001-2002 than the advanced countries. In the run up to the present crisis, there was much discussion about possible “de-coupling” of developing countries from growth trends in developed countries. In the first year after the onset of the financial crisis in August 2007 that appeared to be the case. However, since August 2008 emerging markets have been hit hard by the financial turbulence. Indeed, as discussed below, in many respects the financial spillovers have been greater on emerging markets and the real effects are now beginning to be felt through a sharp decline in demand for exports and a deceleration in domestic demand. In particular, investment demand — which has been the driver of growth in developing countries, and is much higher as a percentage of GDP than in developed countries — is likely to fall sharply in the face of more uncertain prospects and difficulties in access to financing.
Although the crisis did not originate in developing countries, and although developing countries had built up generally strong fundamentals and financial cushions since 2000, they are potentially vulnerable to a sharp contraction in demand and output. The International Monetary Fund (IMF) and the World Bank are projecting that growth of emerging and developing countries will drop from near 8 per cent in 2007 to around 4.5 per cent in 2009. Growth is projected to recover to 6 per cent in 2010 (compared to 2 per cent for the developed world), but the outlook remains subject to significant downside risks.
Domestic Resource MobilizationEnhancing efforts to mobilize domestic financial resources for development was the main pillar of action on the part of developing countries to meet their side of the bargain on the Monterrey compact. This encompassed a broad range of internal actions including sound macroeconomic policies, a conducive investment climate, good governance and anti-corrup-tion efforts, efficient and equitable tax administration, financial sector development and labour market policies. Actions on these fronts were seen as key to establishing the conditions for the more effective utilization of aid.

CANADIAN DEvELoPMENT REPoRT 2009 — FINANCING DEvELoPMENT IN TIMES oF GLoBAL CRISIS6
Measured in terms of outcomes, developing countries appear to have more than lived up to their side of the bargain. As shown in Figure 2, there has been a large, sustained and broad-based improvement in the savings performance of developing countries. Gross national savings of emerging and developing economies rose from around 24 per cent of GDP during 1994-2001 to 27 per cent of GDP in 2002-2004 and to more than 33 per cent of GDP during 2006-2008. Developing Asia and the Middle East have been the main drivers behind this trend, linked to rapid growth in the former and rising oil surpluses in the latter. All other regions, with the exception of Central and Eastern Europe, have also seen sustained improvements in their savings performance, including SSA. As a result, all developing regions were able to achieve a sustained increase in investment rates during this decade and, with the exception of Central and Eastern Europe, did so while reducing the recourse to foreign savings.
What accounts for the dramatic improvement in the savings performance of developing countries since Monterrey? Clearly many factors were at work, but two appear to stand out. First is the improved macroeconomic environment in developing countries as a result of cumulative efforts. By the end of the 1990s, most developing countries had been able to bring inflation rates down to more moderate levels and this has provided a boost to domestic savings, especially in countries that had long histories of hyperinflation. Since the mid-1990s, there has also been a steady improvement in the fiscal position of developing countries. According to IMF data, the average central government balance of emerging and developing economies has improved from a deficit of 3.5 per cent of GDP in 1999 to a surplus of 0.9 per cent of GDP in 2008. All developing regions witnessed this improvement in the fiscal position. The Middle East recorded the largest surpluses based on rising oil receipts, but all other regions have also sharply reduced their deficits. In SSA, a deficit of more than 4 per cent
1994
-200
1
2002
-200
4
2006
-200
8
1994
-200
1
2002
-200
4
2006
-200
8
1994
-200
1
2002
-200
4
2006
-200
8
1994
-200
1
2002
-200
4
2006
-200
8
1994
-200
1
2002
-200
4
2006
-200
8
1994
-200
1
2002
-200
4
2006
-200
8
1994
-200
1
2002
-200
4
2006
-200
8
50
45
40
35
30
25
20
15
10
5
0
Emerging and Developing Economies
Sub-Saharan Africa
Central and Eastern Europe
Commonwealth of Independent
States and Mongolia
Developing Asia
Middle East WesternHemisphere
Investment Gross National Savings
Source: International Monetary Fund, World Economic Outlook Database
Figure 2: Investment and Savings Trends in Developing Countries, 1994-2008 (Per cent)

ThE ChANGING LANDSCAPE oF DEvELoPMENT FINANCE 7
of GDP in 1999 has been turned into a surplus of almost 2 per cent of GDP in 2008. These improvements in fiscal savings reflect curbs on expenditures as well as progress on revenue mobilization, including enhanced tax revenues.
The second major factor underpinning the increase in domestic resources has been the growth of exports. Exports of goods and services from developing countries almost tripled in a span of seven years, from $1.8 trillion in 2000 to around $5.4 trillion in 2007. This extraor-dinary pace of increase was based on improved competitiveness resulting from internal reforms and the currency depreciations in the aftermath of the Asian financial crisis, and a more buoyant world economy driven by the large US deficits. Although trade has therefore played an important role in boosting growth and domestic resources, there are two prospective concerns. The lack of progress on the Doha Round of trade talks means that trade barriers on agricultural exports remain a significant impediment for developing countries, with adverse consequences for the poor. Second, the prospects for world trade look much more uncer-tain; growth of world trade has decelerated sharply in 2008 and is expected to be negative in 2009, for the first time since 1982. In addition to trade, remittances have provided an important boost to national income this decade. Remittances increased from $80 billion in 2000 to about $270 billion in 2007. They have, however, begun to slow in the second half of 2008, and are likely to decline somewhat in 2009 as a result of the effects of the financial crisis.
Since Monterrey, developing countries have also made progress on the market foundations to strengthen domestic resource mobilization. Domestic financial systems, which in many cases had been buffeted by the financial crises of the 1990s, have benefited from a period of gradual strengthening that is reflected in improving portfolios and better capital positions. The structure of the banking systems have been greatly influenced by responses of individual governments to the resolution of bank crises and by history. In some cases (such as Mexico), foreign banks have come to play a dominant role, while in others (such as India, Brazil and Korea) public banks continue to play a significant role, especially in long-term financing. Bank credit to the private sector has increased steadily in all developing regions, most slowly in the case of SSA. However, financing conditions for corporate and investment finance remain generally unfavorable, with high financing costs and segmentation in access to credit (UNCTAD, 2008).
A striking feature of this decade has been the explosion of capital markets in developing countries. Market capitalization of listed companies in developing countries rose from two trillion dollars in 2000 to 15 trillion dollars at end-2007. While a substantial proportion of market valuation has been lost since the onset of the financial crisis, this dramatic increase reflects the importance of domestic capital markets as a source of financing in developing countries. The reach of capital markets, however, remains limited to top-tier firms and in some regions, such as Latin America, new issuance has been negligible. Bond markets have also witnessed rapid expansion during this decade, but mainly for the financing of govern-ments — in some cases linked to the recapitalization of banking systems. This has nevertheless allowed developing countries to replace foreign financing of the public debt with domestic financing: the share of foreign financing fell from 20 per cent at the start of the decade to less than 6 per cent in 2007.
The World Bank’s annual Doing Business survey indicates that there has been a broad-based improvement in the investment climate in developing countries this decade, reflected in the ease of entry and the costs of doing business. This is certainly consistent with the sustained

CANADIAN DEvELoPMENT REPoRT 2009 — FINANCING DEvELoPMENT IN TIMES oF GLoBAL CRISIS8
growth of private investment across the developing world, including in SSA. The agenda of deregulation may, however, be oversold. As a recent evaluation by the Bank’s Independent Evaluation Group points out, improvement in regulatory costs and burden is only one dimension of the overall reform of the investment climate, and less regulation is not necessarily occurring in all areas or circumstances.
Another agenda of reform that came to the forefront in the lead up to and since Monterrey is good governance and the combating of corruption. This is also oversold and often wrongly specified. There is no doubt that governance and institutions matter for the effective utiliza-tion of resources and success of poverty reduction efforts. But as an important study points out, failures of governance are endemic to the stage of development rather than the other way around, and there is no single model for governance reform (Khan, 2006). The chal-lenge for developing countries is to design reform strategies that are likely to be feasible and effective under their particular circumstances; and the challenge for donors is how to best support these reforms and not undermine them with externally imposed approaches.
Resurgence in Private Capital FlowsNet private capital inflows to developing countries, which had stagnated in the years after the East Asian crisis, increased more than fivefold between 2002 and 2007, reaching more than $1 trillion in 2007 (Figure 3). This amounted to almost 7 per cent of GDP of developing countries, compared to 4.7 per cent at the peak of the previous boom just before the Asian crisis in 1997.
Source: Global Development Finance, World Bank
Figure 3: Composition of Net Private Flows to Developing Countries, 1990-2007 (Billions US$)
Private debtPortfolio equityFDITotal as percent of GDP
1200
1000
800
600
400
200
0
-200
Billi
ons
$
1990 1992 1994 1996 1998 2000 2002 2004 2006
8
7
6
5
4
3
2
1
0
Per cent

ThE ChANGING LANDSCAPE oF DEvELoPMENT FINANCE 9
Foreign direct investment, which had remained resilient during the lean years between 1998 and 2002, increased from $161 billion in 2002 to $481 billion in 2007. This increase was broadly based across regions, but the largest increase was recorded by Europe and Central Asia with Foreign Direct Investment (FDI) inflows increasing from $26 billion in 2002 to $162 billion in 2007. China remained the single largest recipient with inflows of $84 billion. But its share in total FDI has continued to decline from more than 30 per cent in the early 1980s to 18 per cent in 2007. On the other hand, Russia, Brazil, Turkey and India have seen much larger proportionate increases. Together with Mexico, these countries accounted for $153 billion of FDI inflows in 2007.
Although more modest in magnitudes, net FDI inflows to SSA have also increased steadily — from $10.5 billion in 2002 to $25.3 billion in 2007. South Africa is the largest recipient but other resource-rich countries, such as Nigeria, Angola, Sudan and Equatorial Guinea, have also attracted increased levels of FDI. A significant proportion of FDI to these countries is now coming from the South, especially from China. Outside the oil and mineral sector, FDI inflows to SSA still remain very modest.
While FDI inflows to developing countries have surged, so have outflows, reflecting the emergence of transnational corporations in developing countries. FDI outflows from developing countries amounted to $184 billion in 2007, led by Russia ($42 billion), China ($30 billion) and India ($15 billion). About 45 per cent of such outward FDI flows were accounted for by cross-border mergers and acquisitions, fueled by a booming world economy and favorable liquidity conditions.
Net inflows of private debt and portfolio equity, which had virtually ceased during 1998-2002, rose sharply in recent years — surpassing FDI inflows in importance and contributing to the bulk of the increase in private capital inflows. The largest increases have been in the form of private debt flows which rose from just $4 billion in 2002 to $413 billion in 2007. Increased lending by commercial banks accounts for much of the increase.
All developing regions have seen a rise in private debt and portfolio equity flows since 2002, but by far the largest increases have been experienced by the countries of Europe and Central Asia, in particular the European Union accession countries. That region alone has accounted for more than 40 per cent of the increase in private debt and equity inflows. In contrast, borrowing from international financial markets by Latin America and East Asia, the two regions affected by the crises of the 1990s, have been much more modest. It was only in 2007 that there was a surge in borrowing, but this was short lived because of the onset of the financial crisis.
Impact of the Financial CrisisFor the first year after its onset, emerging markets were relatively insulated from the financial turbulence that gripped more mature markets beginning in the late summer of 2007. Stock markets were somewhat affected, but spreads on emerging market debt did not increase significantly and their currencies did not come under undue pressure. Emerging markets were considered to be more resilient on the basis of their strong fundamentals and lack of exposure to the toxic products that undermined the balance sheets of financial institutions in advanced countries.

CANADIAN DEvELoPMENT REPoRT 2009 — FINANCING DEvELoPMENT IN TIMES oF GLoBAL CRISIS10
That sense of insulation changed abruptly after August of this year as emerging markets came under increasing pressures. Spreads on emerging market debt spiked sharply, rising by more than 500 basis points in the past three months (Figure 4). Equity markets have also suffered declines of 30-50 per cent since August. Emerging market currencies depreciated on average by 20 per cent between August and the third week of October. Some emerging markets have been affected more than others, but these changes have been broad based and much larger than those suffered by industrial countries, despite the fact that the crisis did not originate in emerging markets.
These growing difficulties cannot be attributed to changes in economic fundamentals. Most emerging markets entered 2008 with strong fundamentals, in terms of their fiscal and external positions, banking and financial sector indicators, and adequate cushions including external reserves. Although there was some buildup of inflationary pressures in 2008 with the surge in oil, food and other commodity prices, and some resulting widening in external deficits, most emerging markets continued to maintain relatively strong fiscal positions. The main reason behind recent pressures has been investor fear and herding and the withdrawal of credit by internationally active banks.
There has been some easing of pressures since late October, but markets remain very volatile. And with it, there is a possibility for sharp capital flow reversals and systemic liquidity dis-tress. Perhaps even more troubling, access to financing remains highly constrained with spreads that are still prohibitive for most emerging markets. As seen in Figure 4, previous episodes of loss of access and high spreads were relatively long lasting, in excess of two years. It is possible, therefore, that the global credit crunch may have a more enduring impact on emerging markets. Although emerging markets are less dependent on external financing than they were at the start of the decade, a long-lasting credit squeeze could have a significant impact in dampening investment and growth in developing countries.
Source: JPMorgan
Figure 4: Trends in Emerging Market Bond Spreads, 1994-2008 (Bond Spreads, basis points)
2500
2250
2000
1750
1500
1250
1000
750
500
250
01994M1 1995M12 1997M11 1999M10 2001M9 2003M8 2005M7 2007M6 2008M10
Emerging market bond spread (EMBIG)
Bond
spre
ads (
basis
poi
nts)

ThE ChANGING LANDSCAPE oF DEvELoPMENT FINANCE 11
Although low-income countries have not been as directly hard hit by the financial crisis, given the limited extent of their market borrowing, they are likely to be affected by a simultaneous decline in demand for exports, falling commodity prices, contraction in remittance flows and reduced private financing. Less creditworthy countries, including many low-income countries, may also find it difficult to access export credit financing which could create a vicious cycle by curbing exports.
The only developing country that is not likely to face any financing constraints on account of the crisis is China, on the basis of its substantial current account surplus, immense stock of reserves, and strong fiscal position. It can therefore continue to be a source of support to other developing countries.
Aid Financing and Aid ArchitectureThe delivery of increased aid commitments in return for progress on domestic policy frameworks was perhaps the most important element of the compact underpinning the Monterrey Consensus. These commitments were reaffirmed and quantified in 2005 against the bench-mark of the aid target of 0.7 per cent of gross national income of donor countries as set out in the eighth goal of the MDGs. At Gleneagles in July 2005, G8 Leaders committed to increase aid to developing countries by around $50 billion a year by 2010, of which at least $25 billion would be for Africa. Based on the specific commitments by individual donors made in the lead up to the United Nations Summit in September 2005, the Organisation for Economic Co-operation and Development’s Development Assistance Committee (OECD DAC) esti-mated that ODA levels would have to rise to $132 billion in 2010 compared to an actual level of $79 billion in 2004 (OECD DAC, 2007).
140 000
120 000
100 000
80 000
60 000
40 000
20 000
0
1975
1976
1977
1978
1979
1980
1981
1982
1983
1984
1985
1986
1987
1988
1989
1990
1991
1992
1993
1994
1995
1996
1997
1998
1999
2000
2001
2002
2003
2004
2005
2006
2007
Mill
ion
US$
Bilateral Multilateral
Source: OECD Development Assistance Committee (DAC)
Figure 5: Official Development Assistance, 1975-2007 (Million US $)

CANADIAN DEvELoPMENT REPoRT 2009 — FINANCING DEvELoPMENT IN TIMES oF GLoBAL CRISIS12
How well has the donor community lived up to these commitments? As shown in Figure 5, ODA disbursements have grown steadily since 1997 to a peak of $107 billion in 2005. They have declined since then to $103.7 billion in 2007. In real terms, ODA fell by 4.5 per cent in 2006 and 8.4 per cent in 2007. Achieving the targets set for 2010 and beyond to 2015 will require a renewed commitment on the part of donors, given the dominant role that debt relief has played in driving recent trends.
Debt relief accounts for almost 70 per cent of the increase in aid between 2002 and 2006 (Figure 6). Most of this debt relief has been targeted to a few countries, including Iraq and Nigeria. As the Paris Club debt relief began to fall off, overall ODA started to decline. In addition to debt relief, a significant proportion of bilateral aid is taken up by humanitarian assistance and by administrative and other overheads. The remainder, which is referred to as “country programmable aid” (CPA), is what is available for allocation to recipient countries. Two important inferences can be drawn from recent trends in the components of aid. First, that CPA constitutes only a fraction — around 50 per cent in recent years — of overall aid; and, second, that it has grown more slowly than overall aid. It is also worth noting that of the CPA, around 20-25 per cent is in the form of technical assistance, which is typically pro-vided directly by the bilateral donor. Hence, on average, less than 40 cents to the dollar of bilateral aid is available to countries for in-country expenditures on projects and programs.
Figure 6: Net ODA Flows by Type, 2002-2006 (Billion US $)
Other*
Debt forgiveness grants
90
80
70
60
50
40
30
20
10
0
Constant 2002 USD billions
2002 2006 2002(Excluding Iraq)
2006(Excluding Iraq)
Humanitarian aid
Programmable aid
* Comprises costs for administration, in-donor country refugees and imputed student costs.
Source: OECD Development Assistance Committee (DAC)

ThE ChANGING LANDSCAPE oF DEvELoPMENT FINANCE 13
Box 1: Doha and beyond — Highlights1
The Follow-up International Conference on Financing for Development to Review the Implementation of the Monterrey Consensus (Doha, Qatar. 29 November-2 December 2008) was a closely fought engagement. After an all night session, active diplomacy and strong CSO advo-cacy, the Doha Declaration on Financing for Development was approved2. Following on a re-affirmation of Monterrey results, highlights (noted by the paragraph num-bers within the brackets) of the 90-paragraph document include:
Mobilizing domestic resources for developmentPerhaps the most important new element was the agreement in paragraph 16 acknowledging: “…the need to further promote international cooperation in tax matters, and request the Economic and Social Council to examine the strength-ening of institutional arrangements, including the United Nations Committee of Experts on International Cooperation in Tax Matters.” Also significant was the closely fought attention to capital flight and stolen assets. (20-21)
The empowerment of women and the provision of decent work as essential to development are recognized, (11-13, 19) as is recognition of the trade-offs for developing countries implied by greater international integration versus national policy space and autonomy.(14)
Mobilizing international resources for development: Foreign direct investment and other private flowsReaffirmation of emphases on conducive national frameworks and macro-economic policies, as well as recognition of the need to reduce transmittal costs on remittances.
International trade as an engine for developmentStrong encouragement to proceed with the Doha WTO round. (31-32)
Increasing international financial and technical cooperation for developmentMany observers concluded that the considerations of the conference on ODA fell behind the recent agreements in Accra. However, in recognition of the importance of new actors and flows the conference agreed to go beyond the scope of the OECD. Paragraph 48 states: “There is a growing need for more systematic and universal ways to follow quantity, quality and effectiveness of aid flows, giving due regard to existing schemes and mecha-nisms. We invite the Secretary-General, with relevant United Nations system agencies, in close cooperation with the World Bank, the regional and sub-regional development banks, OECD/DAC and other relevant stakeholders, to address this issue and to provide a report for consideration by the Development Cooperation Forum.”
While there was no specific support for the Currency Transaction Tax, the Conference recognized the importance of innovative sources, and requested the Secretary-General to undertake a comprehensive report about them. (51)
External debtRecognition of joint debtor/creditor responsibility for debt, and reference to continuing consideration of debt restruc-turing mechanisms while welcome, fell short of expectations. (63ff)
Addressing systemic issues: Enhancing the coherence and consistency of the international monetary, financial and trading systems in support of developmentThe central result of the conference is found in paragraph 79: “The United
Box 1 (Continues) i

CANADIAN DEvELoPMENT REPoRT 2009 — FINANCING DEvELoPMENT IN TIMES oF GLoBAL CRISIS14
Nations will hold a conference at the highest level on the world financial and economic crisis and its impact on develop-ment. The conference will be organized by the President of the General Assembly and the modalities will be defined by March 2009 at the latest.”
The section recognized the need for intensified collaboration between multilat-eral organizations, “based on a clear understanding and respect for their
respective mandates and governance structures”. (78) It continues the Monterrey recognition of the need for enhanced “voice and participation” of developing countries in the Bretton Woods Institutions, noting that they must be “comprehensively reformed”. (77) The importance of regulatory enhancement, to deal with new financial instruments and other challenges is cited for action at national as well as international levels.
Other new challenges and emerging issuesThis section acknowledges the challenges of climate change action, the financial crisis, impacts on access to food and energy, as well as existing multilateral initiatives. It recognizes the particular situations and needs of countries in or recovering from conflict and middle-in-come countries. (80-86)
Staying engagedWhile no decision was made regarding the shape of follow-up on Financing for Development, it was referred to the ECOSOC to consider the shape of an ongoing multi-stakeholder process. (89) As well, “… We will consider the need to hold a follow-up financing for develop-ment conference by 2013”. (90) Emphasis added.
ConclusionThe major issue of the Conference became the timing, organizing aegis, and compre-hensiveness of the agenda of a world conference on financial and economic issues. Although the resistance from the G-1 and allies continues, the UN General Assembly President has the mandate to organize modalities by the end of March, i.e. prior to the next round of G-20 reporting/deliberations, and with a new administration in power in Washington.
On some specific thematics, Civil Society Organization observers, while critical of missed opportunities and partial steps in many areas, found the cup “half full”. In particular the Tax Justice Network was pleased with the open window on upgrading the UN Tax Committee, and the caucus of women’s organizations consid-ered Doha3 a major step forward in recognizing women as economic actors.
1 Prepared by John W. Foster, Principal Researcher, Civil Society, for The North-South Institute
2 For further details see the: Doha Declaration on Financing for Development: outcome document of the Follow-up International Conference on Financing for Development to Review the Implementation of the Monterrey Consensus. A/CONF.212/L.1/Rev.1* www.un.org.esa/ffd/
3 For a brief overall CSO assessment see: DNG: How Does Civil Society Evaluate the Outcome of the Conference Doha, Qatar 2 December, 2008 www.un-ngls.org/site/doha/ 2008_article.php3?id_article=650
And: UN FFD Press release, 2 December 2008: NON-GOVERNMENTAL ORGANIZATIONS WELCOME CONFERENCE OUTCOME, NOTE ‘MISSED OPPORTUNITY IN SOME RESPECTS’ www.un.org/esa/ffd/doha
Also Halifax Initiative: Monthly Issue Update - December 22, 2008 Monthy Issue Update - December 22, 2008. www.halifaxinitiative.org/index.php/issue_update/1127#facts
i Box 1

ThE ChANGING LANDSCAPE oF DEvELoPMENT FINANCE 15
What will it take to meet the aid target of $132 billion by 2010? A recent OECD DAC Survey of donors indicates that on the basis of current plans, CPA is projected to increase by $17 billion in 2010 over the 2004 level, the base year underpinning the Gleneagles commitment (OECD DAC, 2008). In addition, the commitments made to the replenishment of the International Development Association (part of the World Bank) and the African Development Bank will add another $4 billion to ODA levels in 2010. Assuming that debt relief and humanitarian assistance return to 2004 levels, the DAC estimates that an additional $30 billion in 2004 dollars and $34 billion in 2007 dollars have still to be programmed into donor budgets if the aid commitments for 2010 are to be met. For Sub-Saharan Africa, this gap amounts to $14 billion. Closing these gaps in required aid to meet the 2005 commitments will require a strong political will, given the fiscal pressures in many donor countries. But it is critical that these aid commitments be fulfilled to sustain progress on the Millennium Development Goals against the backdrop of a more difficult world economic environment.
While DAC donors continue to be the major source of ODA, the aid architecture is changing rapidly because of the emergence of new players and the proliferation of aid channels. Two sets of players are taking an increasingly important role in development cooperation. First are non-DAC countries, notably middle-income and some non-DAC high-income countries, several of which were, and in some cases continue to be, aid recipients. Official providers of development finance outside the DAC include OECD and EU members that are not members of DAC; the long-established Arab funds; and a growing number of other countries that are significantly expanding their long-standing programs (China, India), resuming them after a break (Russia), or initiating aid programs on a significant scale (Brazil, Malaysia, Thailand, South Africa). Around 34 such countries have established or are building aid programs. A significant proportion of this development assistance is directed at neighboring countries, but an important new phenomenon is the rapid increase in development assistance from these non-DAC development partners to SSA, with China playing a particularly important role.
Development assistance provided by non-DAC partners is markedly different in many respects from financing provided by DAC donors. Whereas most traditional donors have moved primarily to grant financing, non-DAC development partners provide the bulk of their assistance in the form of loans with varying degrees of concessionality. In contrast to traditional donors who have increasingly targeted their assistance to budget support, human development and social infrastructure, the bulk of financing from non-DAC partners is in support of physical infrastructure. The modalities of engagement are also markedly different with little recourse to conditionality and with modalities of delivery that are often different from those used by traditional donors. Non-DAC development partners have significantly expanded the financing envelope available for accelerating much needed investment in SSA. In particular they have had a profound impact on the financing of infrastructure, now accounting for almost 40 per cent of total financing and 60 per cent of financing from official sources.
A second set of players whose role has also grown enormously in recent years are private sources of grants and highly concessional flows. Private sources of development assistance include a vast array of players ranging from large foundations and philanthropic organizations to tens of thousands of non-governmental organizations (NGOs) and hundreds of thousands of religious groups and community-based organizations. The largest of these, such as the

CANADIAN DEvELoPMENT REPoRT 2009 — FINANCING DEvELoPMENT IN TIMES oF GLoBAL CRISIS16
Gates Foundation or World Vision, are larger than medium-sized DAC donors, but most are very small and operate through very different channels than the official sector. Altogether private aid is now estimated to be in the order of $60 billion (Kharas, 2007).
In addition to the emergence of these new players, there has been a proliferation in the channels of aid. In addition to more than 59 bilateral donors, there are now some 230 international agencies, funds and programs, many of them specialized in a particular sector or theme. The proliferation of new channels has, in some cases, added to the aid envelope and widened the choices available to recipient countries, but they have also added to the complexity and fragmentation of the aid architecture. The average number of donors and international organizations per country grew tenfold from three in 1960 to 30 in 2006 (World Bank, 2008a). There has also been a multiplication of projects; the number of proj-ects financed by DAC donors increased from 6,000 in the late 1990s to more than 12,000 in 2006. This trend towards growing fragmentation has increased transaction costs for recip-ient countries. In the much publicized case of Tanzania, the foreign aid portfolio includes more than 700 projects managed by 56 parallel implementation units. There were 541 donor missions during 2005, only 17 per cent of which involved more than one donor (World Bank, 2008a). An additional concern is the growing role of “vertical funds,” especially in the health sector. These funds have allowed countries to scale up programs quickly, for example on HIV/AIDS, but they can sometimes distort government priorities and pose risks for sustainability.
Another important concern from the perspective of the recipient countries is the volatility and lack of predictability of aid. ODA is five times more volatile than GDP and three times more volatile than exports, magnifying economic cycles in recipient countries. In an insightful new study, Kharas (2008) finds that volatility costs between $0.07 and $0.08 per dollar of aid, or around $16 billion a year at current levels. From the perspective of recipient countries, this amounts to an astounding 1.9 per cent of GDP. An additional problem is the lack of predictability. Very few donors are able to make multi-year commitments and a recent DAC survey finds that in a typical country only 45 per cent of aid arrives on time.
To tackle these and other challenges that impede aid effectiveness, the major bilateral donors, multilateral agencies and 56 partner countries adopted the Paris Declaration on Aid Effectiveness. The Paris Declaration is based on the core principles of ownership, alignment, harmonization, managing for results, and mutual accountability. The Declaration set 12 global targets that could be monitored in these five areas based on a range of specific indicators. A follow-up forum was held in Accra in September 2008 to review progress on the Paris agenda and adopt a revamped action plan. The assessments carried out in the lead up to the Accra Forum present a mixed picture.
Progress on Reducing Debt Burdens The Monterrey Consensus had called for “speedy, effective and full implementation” of the enhanced Heavily Indebted Poor Countries (HIPC) Initiative. It had also acknowledged that unsustainable debt burdens affected other developing countries and called for further national and international measures, including debt cancellation. It also called for a set of clear principles for the management and resolution of financial crises that would provide for fair burden-sharing.

ThE ChANGING LANDSCAPE oF DEvELoPMENT FINANCE 17
Debt relief for the poorest countries is the area of promised action in the Monterrey Consensus that has shown the greatest progress. Altogether 41 countries have been declared eligible for the HIPC initiative on the basis of income and indebtedness as of end-2004. Thirty-one of these countries have reached decision points, which is when they become eligible for debt relief; and 22 countries have reached completion points, when the debt relief becomes irrevocable.
As shown in Figure 7, HIPC debt relief reduced the debt burden of the 31 post-decision point countries from $104 billion to just over $40 billion. In addition, major bilateral credi-tors took the decision to write-off all bilateral debt, further reducing the debt burden by $4.8 billion. Another major step was taken in 2005 with the adoption of the Multilateral Debt Relief Initiative (MDRI) that extended 100 per cent debt relief to credits extended by the international financial institutions, encompassing the IMF, the International Development Association arm of the World Bank, the African Development Bank and the Inter-American Development Bank. As a result of the initiative, the debt burden of the 31 eligible countries has been further reduced from $35.6 billion to $8.9 billion. These cumulative steps have therefore reduced the debt burden on the HIPC countries by more than 90 per cent. An important additional step has been the conversion of all new assistance by OECD DAC members to HIPC and other least developed countries to grant terms, as well as grant or increased concessionality of financing from the international financial institutions.
Figure 7: Debt Stock Reduction for the 31 Decision-point Countries in end-2006 (NPV terms) (Billions US $)
Interim Countries
22 Completion-Point Countries
120
100
80
60
40
20
0After MDRI Before traditional
debt relief After traditional
debt reliefAfter HIPC initiative
debt relief
After additional bilateral
debt relief
Source: HIPC initiative documents; IDA and IMF staff estimates.
Note: Based on decision-point debt stocks. (Updated compared to Progress Report to include Malawi, Sao Tome and Principe, and Sierra Leone as completion-point countries and Haiti as interim country.

CANADIAN DEvELoPMENT REPoRT 2009 — FINANCING DEvELoPMENT IN TIMES oF GLoBAL CRISIS18
The reduction in the debt burden and improved growth and export performance has sharply brought down debt indicators for HIPC countries. As shown in Figure 8, the average debt service ratio for HIPC countries has declined from more than 16 per cent in 2000 to less than 5 per cent in 2007 following the implementation of the MDRI. Similarly, the debt-to-exports ratio has fallen by 152 percentage points over the past five years; a fall of 24 percentage points was due to the reduction in the debt burden and 128 percentage points due to the increase in exports. The declines in debt service indicators have been greatest in the case of countries where debt servicing burden was high to start with, such as Burkina Faso, Bolivia, Ghana, Malawi, and Rwanda. For example, the debt service ratio in the case of Ghana declined from 23.8 per cent in 2000 to 14.3 per cent in 2006 and 3.9 per cent in 2007.
Debt service burdens of other developing countries have also fallen sharply during the same period, despite the fact that most of them did not receive any significant debt relief. Iraq and Nigeria were two major exceptions. The average debt service ratio for low-income developing countries has followed a very similar track to that of HIPC countries (Figure 8). Their debt stocks increased during this period but more moderately than in the previous two decades, and they benefited from strong export performance. The debt service burden for middle-income countries also declined, from 21 per cent in 2000 to 10 per cent in 2007. Once again this reflects a moderating pace of growth of debt stocks with strongly rising exports. Despite these generally favorable outcomes on external debt since Monterrey, several issues remain.
Source: Global Development Finance (GDF) and IMF Report
Figure 8: Trends in Debt Service Burden (ratio of debt service to exports of goods and services in per cent)
24
22
20
18
16
14
12
10
8
6
4
2
0
After MDRI
2000 2001 2002 2003 2004 2005 2006 2007
HIPC Countries
Low Income
Middle Income

ThE ChANGING LANDSCAPE oF DEvELoPMENT FINANCE 19
The first issue is the additionality of debt relief. The Monterrey Consensus had clearly stipulated that debt relief to the poorest countries “should be fully financed through additional resources” and that “resources provided for debt relief do not detract from ODA resources.” The most systematic analysis of additionality, both from the donor and recipient perspectives, has been carried out by Panizza (2007). He finds that debt relief indeed has freed resources in debtor countries and that debt relief has been generally additional from the receiver’s side. Looked at from the donor side, however, he finds that an extra dollar of debt relief leads to a reduction in net aid of approximately $0.3, suggesting that debt relief has not been fully additional. It is also clear from the aggregate aid trends that debt relief has not been additional. The aid commitments made in Monterrey, and subsequently made more concrete at Gleneagles and the 2005 UN Summit, were based on judgments of additional resources that would be needed to meet the Millennium Development Goals, taking into account debt relief that had been promised. To the extent that debt relief has accounted for as much as two-thirds of the increase in ODA between 2002 and 2006-2007, this indicates that aid commitments have not met the indicated targets once debt relief is netted out. The value of the debt relief is also grossly overstated since it is accounted for at book value. A proper assessment of the additionality of debt relief is therefore important in evaluating the delivery of future aid commitments and any prospective debt relief initiatives.
The second issue is the debt sustainability framework developed jointly by the IMF and the World Bank. The framework is aimed at assessing the vulnerabilities of countries to debt distress, based on the projected evolution of debt ratios compared with debt burden thresholds linked to the quality of policies. Its main purpose is not to assess the eligibility for debt relief (which has been based on income and static debt indicators), but rather to provide guidance on levels of prudent borrowing and the appropriate concessionality of bilateral and multilateral assistance. The debt sustainability framework has been criticized on a number of analytical grounds. These include the arbitrariness and subjectivity of the World Bank’s Country Policy and Institutional Assessments (CPIA) on which it is based, the exclusion of domestic debt and hence the interactions between fiscal and debt sustainability, and the fact that it neglects poten-tial needs, notably resources needed to meet the MDGs (Panizza, 2007). A practical concern that has emerged is the application of the framework to assess lending and potential free-riding by non-traditional development partners, especially in SSA. These development partners, such as China, India and the Arab funds, provide their assistance in the form of concessional loans rather than grants but, in contrast to the traditional donors, the bulk of this financing is directed towards infrastructure projects. As financing from these sources constitutes an important and growing source of development finance for SSA and other low-income countries, it is important that debt sustainability analyses (DSAs) based on the framework properly assess and reflect the impact of such financing. In particular, while there is much focus in DSAs on the increment to debt, there appears to be insufficient analysis and recognition of the spillover effects on growth and revenues which can be potentially large. Otherwise the application of the framework will lead to overly conservative assessments on the potential benefits of financing from new development partners. Indeed there is strong evidence that such financing has boosted the debt sustainability of the major beneficiaries of such financing (Reisen, 2007, and Bhattacharya, 2008).

CANADIAN DEvELoPMENT REPoRT 2009 — FINANCING DEvELoPMENT IN TIMES oF GLoBAL CRISIS20
The third issue is the potential for debt difficulties in countries not covered by the HIPC initiative. While debt ratios of low- and middle-income countries not covered by the initiative have generally improved, two concerns remain. First, the all-or-nothing approach, whereby some low-income countries are considered eligible for 100 per cent debt relief based on end-2004 debt indicators while others receive nothing, is fundamentally inequitable. Those non-HIPC low-income countries that have significant debt burdens and face financing constraints to meet the MDGs should be provided with commensurate debt relief. An extension of a modified HIPC-style Initiative to these countries is therefore warranted. While low-income countries have seen a broad-based decline in their debt burden indicators, some middle-income countries still have very high debt burdens and with these the potential for debt distress. Many of these countries are also vulnerable to rollover risk, and the associated rise in risk premia that can adversely affect debt dynamics. In the extreme case of Argentina, a forced workout reduced the country’s debt burden, but there are many countries where the risk of debt distress remains high. For several middle-income countries, high debt servicing burdens also undermine efforts to accelerate progress on development goals, including the MDGs. Finding appropriate mechanisms to reduce the debt burdens of middle-income countries where they constitute a major development constraint, or pose the greatest risks to debt sustainability, should be an important element of the future action plan.
The fourth issue is the need to create new instruments and institutional mechanisms that help developing countries avoid the risks of debt distress in a globalized financial environ-ment. In particular, developing countries face three interrelated challenges that make them more vulnerable to debt distress. First, they can typically borrow only in a foreign currency which makes them vulnerable to a debt crisis induced by currency depreciation. Second, they do not have adequate instruments to hedge against potential shocks that could affect their growth and export revenues. And third, in the face of incipient difficulties, they are more likely to face a liquidity crisis that can trigger eventual solvency problems. The creation of new instruments that would allow developing countries to hedge against currency risk all need to be aggressively pursued. These include borrowing denominated in domestic curren-cies and diversification of reserves, hedging against domestic or commodity risks such as through GDP or commodity-linked bonds, and better liquidity financing mechanisms from the IMF or regional arrangements.
Finally, even with better instruments and improved debt management, debt crises are still bound to occur and will require an effective debt resolution mechanism that brings about a speedy resolution and ensures fair burden sharing among creditors and debtors. In the past, workout processes have been costly and protracted and, too often, the taxpayers of developing countries have wound up bearing a disproportionate share of the cost. Efforts to create a Sovereign Debt Restructuring Mechanism (SDRM) anchored in the IMF were abandoned in the face of opposition from key creditor and debtor countries. Instead, an initiative was successfully launched to incorporate collective action clauses in new emerging market bond issues with the aim of facilitating an eventual workout. The private sector and debtor countries also adopted a code of conduct to guide actions and interactions in the face of debt difficulties. It is doubtful though whether these steps will be adequate to ensure fair burden sharing and deal with the coordination problems that arise in an emerging market debt crisis. Exploration of possible options should therefore remain on the table in light of the additional insights from the recent crisis and the difficult terrain that lies ahead for the world economy.

ThE ChANGING LANDSCAPE oF DEvELoPMENT FINANCE 21
Amar Bhattacharya is currently Director of the Group of 24. Prior to taking up his current position, Mr. Bhattacharya had a long-standing career in the World Bank. His last position was as Senior Advisor and Head of the International Policy and Partnership Group in the Poverty Reduction and Economic Management Network of the World Bank. In this capacity, he was the focal point for the Bank’s engagement with key international groupings and institutions such as the G7/G8, G20, IMF, OECD and the Commonwealth Secretariat, including on the reform of the aid as well as international financial architecture.

CANADIAN DEvELoPMENT REPoRT 2009 — FINANCING DEvELoPMENT IN TIMES oF GLoBAL CRISIS22

INNovATIvE FINANCING 23
TWoChapter
Innovative Financing
John W. Foster and Rodney Schmidt

CANADIAN DEvELoPMENT REPoRT 2009 — FINANCING DEvELoPMENT IN TIMES oF GLoBAL CRISIS24

INNovATIvE FINANCING 25
Innovative FinancingJohn W. Foster and Rodney Schmidt
ContextThe international community is at the mid-point of its progress toward achieving, or failing to achieve, the Millennium Development Goals (MDGs). Recognizing what British Prime Minister Gordon Brown has termed a “development emergency,” heads of government were called to gather at the United Nations in September 2008 to upgrade their commitments to the MDGs and related development objectives (BBC News 2007). But neither the 2008 G8 nor subsequent pledges by donor countries really meet the escalating demands of what Brown called a “development emergency”— the demands of climate change and the current crisis of the “three Fs”: food, fuel, and finance.
The World Bank, in its 2008 Global Monitoring Report, assesses progress on the goals and other objectives. At the High-Level Meeting of the UN Economic and Social Council (ECOSOC) in April 2008, the World Bank stated:
After declining by 4.5 percent in real terms in 2006, net ODA from the 22 OECD DAC1 countries fell a further 8.4 percent to an estimated $103.7 billion in 2007. However, 2005 ODA was exceptionally high because it included large debt relief operations (over $19 billion to Nigeria and Iraq alone). Prospects for meeting the G8 target of increasing aid to poor countries by $50 billion from 2004 to 2010 will depend on sharply accelerating the growth of core development aid.
The implication was clear: “Aid from traditional donors declined in 2006–2007, and donors will need to increase ODA sharply to meet stated commitments.”2
The same high level meeting heard challenging reports on the costs of funding mitigation and adaptation to climate change, particularly for developing countries. There were also widely-held and strongly-worded concerns regarding the effect of the crisis in food prices and availability and the escalation of energy costs. In short, it was underscored that the world is poised on a pivot, where the possibility of meeting even the minimal MDGs could be reversed as more and more people are pulled back into poverty, hunger, and disease, and subject to climate crises.
Financing for Development: An Opportunity not to be MissedIn this context, the work of preparing the 2008 Financing for Development review conference in Doha, Qatar (November 29–December 2, 2008), has extreme relevance, as have prelimi-nary events like the Development Cooperation Forum of the ECOSOC (June 30–July 2) and the High-Level Event on the Millennium Development Goals and the “development emergency” which followed in September, 2008.

CANADIAN DEvELoPMENT REPoRT 2009 — FINANCING DEvELoPMENT IN TIMES oF GLoBAL CRISIS26
The Financing for Development (FfD) process is a “big tent,” both in terms of actors and comprehensiveness of agenda. It brings the Bretton Woods Institutions, the WTO, UNCTAD, and a variety of other agencies together with the full UN membership. It has taken steps to open up to participation and “partnership” from both the private business and Civil Society Organizations (CSO) sectors. It would be strengthened by more effective collaboration with the UN Human Rights Centre and Council and thorough integration of human rights frameworks in its deliberations and results.
Perhaps the most important dimension is found in the Secretary-General’s statement that “Strong and effective governance in all global institutions must be built on the basis of the accountability of their management and governing boards. Global economic decision making should, as much as possible, be consolidated in international institutions of a uni-versal nature — those that are part of the United Nations system — rather than in limited ad hoc groups.”3
Civil society has engaged with the process at a number of levels, participating in the preparatory debates organized around the six major themes of the Monterrey Declaration, taking full opportunity of the hearings for civil society and the business community, and contributing to the roundtables of the high level meeting of the ECOSOC.4
A strategic international consultation on FfD, sponsored by the Friedrich Ebert Foundation, noted, “broader international space is required for international financial policy discussion among all relevant stakeholders, including from all interested governments of the North and the South, the private sector and civil society.”5
The opportunity provided by the Doha Conference, its preparatory process, and the preliminary events mentioned above is timely, broad in reach, and includes virtually all the key actors. It was incumbent on those involved to ensure that commitments and action on issues of innovative, additional, predictable, and sustainable financing for development were to be kept central.
Financially, the sense that traditional ODA budgets, no matter how effectively delivered, will be inadequate to current exigencies did not arrive with the World Bank’s Global Monitoring 2008 report, but have motivated some governments and agencies for some time.
One of the most important developments of the current decade has been the interaction and dialogue with the United Nations of an initiative to sponsor new, innovative sources of finance for development. The initiative has grown with consciousness of the failure of donor budgets to provide adequate funding for development goals. It has been fed by research on the massive South-North flows of financial resources, documented in studies like Closing the Floodgates: Collecting Tax to Pay for Development, prepared by the Tax Justice Network, for the Norwegian Ministry of Foreign Affairs.
Innovative Financing: The Sources of InitiativeInterest in taxation of financial instruments and foreign exchange grew in the context of the financial crises of the mid- and late-1990s. For some, the key motivation was the damping down of currency speculation by the “boys in red suspenders” based in firms in New York. For others, and for many in the development movement, the objective was to free additional funds for investment in development priorities. At that time, the prime proposal was that

INNovATIvE FINANCING 27
developed by American economist James Tobin in the 1970s. Tobin had the control of speculation in mind, but civil society organizations like ATTAC6 spread particularly in Europe with the objective of advancing a tax that could be used to fund key global social justice objectives. The financial crises in Mexico and Asia were key in motivating the development of the Financing for Development initiative in the United Nations, and among those in the global community looking to fund social objectives worldwide.
When governments and civil society organizations met in Geneva in the summer of 2000 to review progress on the results of the 1995 World Summit on Social Development (WSSD), debate over support for an internationally delivered Tobin Tax on currency transactions was considerable. The Geneva 2000 Conference could not reach agreement on such an initiative because of the stalwart opposition of the United States. However, Canada and Norway confirmed in their closing comments that they understood that the UN could continue the study. A resolution of the UN General Assembly, which followed in September 2000, called for “a rigorous analysis of the advantages, disadvantages, and other implications of proposals for developing new and innovative sources of funding, both public and private for dedication to social development and poverty eradication programmes” (Atkinson 2004, emphasis added).
The UN Department of Economic and Social Affairs commissioned a study that resulted in a number of policy papers and a policy brief by Anthony B. Atkinson of Nuffield College, Oxford — New Sources of Development Finance: Funding the Millennium Development Goals (Atkinson 2004). The policy brief presented a menu of possible new sources, including the Tobin tax, global environmental taxes, Special Drawing Rights7 (SDRs) for development, increased remittance by emigrants, global lottery receipts, and the International Finance Facility (IFF).
Meanwhile the French Government, in November 2003, commissioned a working group of independent experts, headed by Jean-Pierre Landau, to examine new international sources for development finance. The group concluded that current modalities of funding development — principally through the national budget allocations of OECD donors — would not permit the achievement of the MDGs by 2015. It came up with a similar menu of options for additional — “more and better” — assistance.8
In January 2004, the leaders of four countries — Brazil, Chile, France, and Spain — issued a declaration in Geneva, creating a four-country working party — the Technical Group on Innovative Financing Mechanisms — that reported back the following September. The lead item on its menu of options was “Taxation of Financial Transactions”. It also examined taxation of the arms trade, the International Financial Facility proposed by the UK, a new round of Special Drawing Rights for development, addressing tax evasion and tax havens, increasing remittance benefits, voluntary contributions through credit cards, and the use of ethical funds for investment. As the group concluded, its proposals were neither totally inclusive nor prescriptive, nor were they conceived as provisional measures. “Rather, they are designed as means of providing for a predictable and continuous flow of resources over time, so that recipient nations could succeed in the pursuit of long-term development in a more efficient manner.”9

CANADIAN DEvELoPMENT REPoRT 2009 — FINANCING DEvELoPMENT IN TIMES oF GLoBAL CRISIS28
In a further key conclusion, the Technical Group stated, “It is crucial that resources raised through innovative mechanisms are truly additional, and do not crowd out current ODA flows.” The mechanisms it put forward should be “guided by the following general principles: efficiency, accountability and transparency.”10
On September 20, 2004, the leaders of Brazil, Chile, France, Spain, and a number of other countries held a summit meeting at the United Nations in New York, and put forward the recommendations of the Technical Group, urging action on innovative financing, endorsed by 111 countries.
As the international community moved toward the fifth anniversary of the Millennium Declaration, and examined progress toward the MDGs, the core countries working on innovative financing advanced the idea through a series of declarations in Brasilia, Berlin, and at the United Nations, involving other countries like Algeria and Germany, as they progressed. They advanced the idea of initiating workable pilot projects and noted that while universal accord was useful for projects such as global taxation, it was possible to implement certain levies on a country-by-country basis, contributing to a common fund. One of the pilot proposals was a project to “provide long-term financing for the fight against AIDS through a small levy on air travel.”11
At the Elysee Palace in Paris, President Chirac convened a two-day conference on February 28, 2006, to deal with “innovative financing for development and against pandemics”. The event, attended by more than 100 country delegations, as well as many CSOs and UN officials, including the Secretary-General, included workshops on many of the elements in the Atkinson and Landau Technical Group reports. It gave birth to a leading group of inter-ested countries that were “ready to implementing such financing in a short time” and the French initiative of an “international solidarity contribution on airline tickets”, which would be implemented on July 1, 2006, with proceeds to support an international drug purchase facility to assist the fight against pandemics.12
Leading to Pilot ProjectsThe Paris Conference was important not only because of the initiatives announced but also because of its relatively inclusive approach to civil society participation. President Chirac, in opening the event, made several important declarations:
Concluding that, given current ODA budget limitations, there were vastly insufficient funds to meet the MDGs, he argued not only for additionality, but also for predictable and sustainable new flows of assistance.
Recognizing that the benefits of globalization have accrued in an unequal and unjust fashion, he advanced the importance of “solidarity”, stating, “With these contribu-tions, we are going to extend our solidarity base using a fraction of the new wealth created by the globalization process, a large part of which escapes States’ taxation. We are going to use the most advanced techniques of our modern economy in the interests of the poorest.”

INNovATIvE FINANCING 29
He commended the work of the Laudau technical group as a global breakthrough: “The proposals were considered completely unrealistic a very short time ago. They were even taboo in certain international organizations. Now they are discussed in all the major international forums.”
The Leading Group on Solidarity Levies for Development is a group of interested governments, presently numbering more than 50 countries. It has an informal organization supported by the French Foreign Ministry, with a rotating presidency changing every six months. After the initial French leadership, Brazil, Norway, Korea, and Senegal/Guinea have undertaken leader-ship. The semi-annual meetings include country delegations, officials from multilateral organizations, academics, and CSOs. The group has an agenda that includes review of prog-ress on many of the areas named in the original working group reports, but has included new proposals, such as the Digital Solidarity Fund and approaches to carbon taxes.
Box 1: A Pilot that Flies: The Airlines Levy and UNITAIDThe French government, building on the Landau report, initiated a demonstration project to achieve new, additional, sustain-able, and predictable revenues. The pilot project — a small levy on airline tickets — was announced by President Chirac in September 2005 to be implemented in 2006.
The levy was directly linked to a specific objective within the Millennium Development Goals — the provision of affordable and sustainable pharmaceuticals for AIDS, malaria, and tuberculosis. The means was the creation of an international pharmaceutical purchasing agency — UNITAID — that could bargain effectively for lower prices with large corporate suppliers.
France moved to implementation of the levy on July 1, 2006, with the creation of UNITAID, based at the World Health Organization, following. The levy was established as 1 euro for economy domestic and intra-European flights, and 10 euros for business and first class flights, and four times those amounts for international/interconti-nental flights. UNITAID describes its work as follows:
UNITAID achieves impact by applying its market dynamics toolkit comprising
of pool procurement, volume price negotiation and supporting the pre-qualification of drugs.
Hitherto, UNITAID has focused its interventions in the following niche areas:
Paediatric and Second Line ARVs, Acceleration of Prevention of Mother to Child Transmission (PMTCT) and scale-up of linkages to paediatric HIV/AIDS care and treatment;
Scaling-up of ACT drugs for malaria treatments;
Treatments for tuberculosis (First Line TB: Transitional Grants & Strategic Rotating Stockpile; UNITAID Support to Paediatric TB and; MDR-TB Scale-up Initiative).13
France has been joined by the cofounders — Brazil, Chile, Norway, and the United Kingdom — and a number of other countries in the agency, and UNITAID has worked to increase impact by collaborating with the Clinton Foundation and other bodies. In 2006–2007, the budget was US$383.2 million, 85 per cent of which went to low-income countries.
Canada is not, as yet, a collaborator in the airlines levy or in UNITAID.

CANADIAN DEvELoPMENT REPoRT 2009 — FINANCING DEvELoPMENT IN TIMES oF GLoBAL CRISIS30
Among the most interesting of the group’s initiatives has been the formation of the International Task Force on Illicit Financial Flows and Capital Flight, led by the Norwegian government, a result of sustained civil society pressure and signal leadership from an inter-ested government. The group explores how to deal with an estimated annual “leakage” of US$539–$829 billion of annual capital flight from developing countries that dwarfs the annual aid flow of $104 billion. It is not unusual for a developing country to lose as much as 5–10 per cent of GDP annually to capital flight (Baker 2007, Epstein 2005). Despite a consid-erable concentration on the issue of official corruption, the cross-border component of bribery and theft by government officials is the smallest portion, only about 3 per cent of the global total. The criminal component constitutes about 30–35 per cent of the total. And the commercially tax-evading component, driven primarily by falsified pricing in imports and exports, is by far the largest, at some 60–65 per cent of the global total” (Baker 2007). The task force was mandated to report on reforms to address this and related issues at the October 2008 meeting of the leading group, with the intention that recommendations would be adopted at the Doha Financing for Development Conference later in the year.
Civil society has not only encouraged initiatives like the task force and the airlines levy, but would like to see them extended and deepened, with more countries participating in the levy and supporting reforms to reduce and recover illicit flows.
The Norwegian government commissioned a major study on the currency transaction tax (CTT) for the early 2007 leading group meeting it hosted.14 It also invited civil society resource people like The North-South Institute’s Rodney Schmidt to a preparatory study session. Despite considerable work by Norwegian and international advocacy organizations, the proposal to form a task force on the issue lacked leadership from a sympathetic government and was not implemented. Further efforts to secure commitment from one or more govern-ments to implement a CTT, and/or to lead in the formation of a working group that would forward implementation have occupied civil society at succeeding meetings of the leading group in Seoul and Dakar.15 An NGO working group on the CTT for FfD, has been formed among key NGO networks, and has begun meeting with a small group of representatives of “CTT-friendly” governments.16 The initial objective of the group was to ensure that a positive reference to the CTT would be included in the draft of the Doha FfD Conference report. The group will encourage at least one government to take the lead on further work on the implementation of a pilot CTT. The key link made by this initiative is that the funding should be for development, should be additional to ODA, and should be managed by the UN and its agencies. It would truly be a “Currency Transactions Development Levy”.
The technical work developed by Rodney Schmidt (outlined in this chapter) among others has defrayed many of the skeptical questions about the practicality and facility of imple-menting a CTT. In October 2007, it was presented to the Financing for Development civil society hearings at the UN in New York. In April 2008, the Secretary-General, Ban Ki-Moon, picked up the proposition stating, in preparation for the annual high level meeting of the ECOSOC with the Bretton Woods Institutions, the WTO, and UNCTAD:

INNovATIvE FINANCING 31
Box 2 (Continues) i
There is renewed international interest in a possible currency transaction “development levy” of 0.005 per cent, a minuscule tax that is not expected to materially affect market operations while having the potential to generate billions of dollars that can be allocated for development. OECD countries are already raising substantial amounts of revenue on various types of financial transactions taxes with no apparent negative impact on financial markets. The international financial system already has clearing and settlement mechanisms that can manage the collection of this levy at low cost for any one country unilaterally. The difference is that, by their nature, Currency Transaction Taxes involve more than one country, being levied on exchanging the currency of one country for another. Thus, these are taxes that are best implemented in a cooperative manner among countries.17
The current challenge is to ensure that support for the proposed CTT is included in the final report of the Doha Conference, and that means of implementation as a pilot by interested countries is taken forward.
Leading Into the FutureThe leading group is a “coalition of the willing,” informal in organization, open, flexible, and with all the strengths and some of the weaknesses of such bodies. The Dakar Fourth Plenary (April 2008) was to some extent a test of commitment. It resolved to go forward and to bring the game back to the original host by meeting in Paris early in 2009. The Guinean presidency, host of the Fifth Plenary (mid-October, 2008), has not only underlined that the Plenary must ensure impact on the Doha Financing for Development Conference but has proposed that the leading group be formalized, that terms of presidencies be lengthened to one year from the current six months, and that a permanent secretariat be established and funded.18
Box 2: The Innovative Financing Agenda: Opportunities AboundThe agenda for the Leading Group on Solidarity Levies originated in the December 2004 Landau report and the February 2006 Paris Conference. Landau addressed several key weaknesses of the existing, national-budget based, official development assistance system:
Insufficient resources because each donor has built-in incentives to finance its own priorities first, and then to free ride on other countries’ contributions to finance common objectives;
High negotiation and transaction costs, both for donors (in time and resources spent in reaching compromises) and recipients (who find it increasingly
difficult to grapple with the system’s complexity and uncertainties);
Aid is inadequate and inappropriate in form; only one third of disbursements currently go to fighting poverty; grants are insufficient; less than 50 per cent of aid actually translates into cash transfers to developing countries;
Aid is both volatile (four times more volatile on average than recipients’ GDP) and unpredictable. Far from helping countries to cushion economic shocks, it is often an additional source of instability (Landau 2004).
Landau, and the expert working group with him, examined the possibilities of interna-tional taxation, particularly a collaborative international levy, collected nationally but

CANADIAN DEvELoPMENT REPoRT 2009 — FINANCING DEvELoPMENT IN TIMES oF GLoBAL CRISIS32
The civil society consultation at Dakar dealt, in part, with one of the weaknesses of the group, the lack of criteria for evaluating proposals and pilots. In arriving at their own priori-ties, they applied the original criteria suggested by President Chirac: Do proposals really offer additionality to current ODA? Are they predictable and sustainable? Are they really directed to the eradication of poverty and achievement of agreed-upon development goals? Do they represent significant new quantities of assistance? The consultation placed these issues within the overall need to reverse the significant drain of resources from developing to developed countries, deal with illicit flows and capital flight, and direct strategies and resources to domestic resource recovery, retention, and mobilization.19
directed to agreed-upon international goals and uses.
The Landau report examined a number of options including taxes on currency transactions, on other financial instru-ments, environmental taxes including carbon taxes, taxes on air transport, shipping, on arms sales, a surtax on corporate profits, etc. The report also examined other innovative proposals including the International Finance Facility (IFF), a new issue of Special Drawing Rights, and a global lottery. The report encouraged action on international taxation, taking into account the following criteria:
Maximum impact and visibility. The action financed must be visible and effective, and rapidly so, if we want to impart credibility to broader tax projects in the medium term. Resources should be concentrated on a small number of objectives, which should be defined by indisputable, easily measured quantitative indicators.
Maximum legitimacy. This principle would favour focusing on a “grande cause” that everyone would naturally recognize as legitimate, ethically indisputable, and backed by very strong economic rationale.
Unquestionable equity. For maximum legitimacy, the international tax chosen should clearly signal solidarity between North and South, between developed and developing countries, or even directly between rich and poor. Very close attention should be paid to possible unwanted redistributive side effects of the tax.
Absolute transparency. There is a need for a mode of governance of these funds that is indisputable in the eyes of both beneficiary governments and their populations, and of observers in the international community.
Economic efficiency. Given the political opposition and prejudice, whichever tax is chosen must be economically flawless to avoid the criticism that it impedes economic growth. With that in mind, the exercise should favour either broad-based taxes, permitting a low rate and thus creating few distor-tions, or taxes designed to correct existing distortions (Landau 2004).
The leading group, formed at the Paris Conference, continues to work on the items that Landau identified, welcoming further new ideas, and depending on the initiative of individual governments or groups of governments to spark pilot projects.
i Box 2

INNovATIvE FINANCING 33
The Currency Transaction Tax: Rate and Revenue EstimatesThe Currency Transaction Tax (CTT) is one of the new mechanisms being considered by governments, international institutions, and others to raise large amounts of independent, global, and stable monies.20 The new revenues are to be used to finance international devel-opment and other projects addressing global issues, such as public health. Each of the new financial mechanisms poses the same two questions: Is it feasible (meaning, is it cost-effec-tive? Are there negative side-effects?) and, how much money would it raise? The CTT has been shown to be feasible, and we briefly review the case below. Here, however, we devote most of our attention to identifying an appropriate CTT rate: high enough to raise lots of money but low enough to avoid changing fundamental market behaviour. We also estimate revenues when the CTT is applied either unilaterally to a single major currency (the $, €, ¥, or £), or coordinated across several of these currencies.
Issues and AssumptionsThe CTT is a proportional, or percentage, tax on individual foreign exchange transactions, assessed on dealers in the foreign exchange market and collected by financial clearing or settlement systems. Foreign exchange dealers are financial institutions that display bid (buy) and ask (sell) exchange rates, that trade currencies on demand at those or better rates, and that have direct access to large-scale gross or netting settlement systems. Dealers trade with other dealers or with non-dealer customers.
The CTT is the conceptual successor to the Tobin Tax (TT). In terms of the mechanics of tax collection (by financial settlement systems), and the tax base (the inter-bank foreign exchange market), the two are identical. The concepts differ by purpose and proposed tax rate. The TT was intended to slow the flow of capital across borders and thereby enhance monetary policy, and to prevent or manage exchange rate crises. The TT rate would be high to change foreign exchange market behaviour. By contrast, the CTT is intended to raise money without disrupting the market. The CTT rate would be low.
The major challenge to estimating revenues from a CTT is to predict how much the volume of foreign exchange transactions would contract if a tax were introduced. The previous studies guessed this. We are able to remove the guesswork, as follows.
Post-CTT Transaction VolumeSince the CTT is not in place yet, we cannot directly measure the ensuing decline in transaction volume. However, the CTT is equivalent in effect to the bid-ask spread, the difference between bid and ask exchange rates offered by dealers. Both are part of the direct cost of making a foreign exchange transaction. The CTT would affect the foreign exchange market by increasing the width of the spread. So, to anticipate how the CTT would affect the volume of transactions, we can measure how volume usually responds to changes in the spread.
We did this in the $/¥ dealer spot market for the period 1986 to 2006 (see Schmidt 2007, for details). We found that a rise in the spread of 1 per cent leads to a fall in transaction volume of 0.43 per cent. In the language of economists, the elasticity21 of foreign exchange volume with respect to the spread is -0.43.

CANADIAN DEvELoPMENT REPoRT 2009 — FINANCING DEvELoPMENT IN TIMES oF GLoBAL CRISIS34
We investigated the possibility that an increase in the spread due to the tax in one currency-pair market leads to a diversion of transactions to other markets. There was no indication in the $/¥ market that a fall in € or £ spreads relative to ¥ spreads is associated with a fall in ¥ volumes.22
Tax EvasionScholars and officials increasingly recognize that avoiding the CTT is difficult and unprofitable when it is collected by large-scale financial and foreign exchange settlement systems, such as the Continuous Linked Settlement (CLS) Bank or the ubiquitous SWIFT23 (see, for example, Landau 2004). This has been shown to be true no matter which foreign exchange instru-ment is used or where or how it is traded (Hillman, Kapoor, and Spratt (2006); Schmidt (1999, 2000, 2001); Spratt (2006)).
Some people worry that many foreign exchange transactions are netted away before being settled and would not be taxed (for example, Nissanke 2004), or that unofficial and untaxed new settlement systems would appear (for example, Landau 2004). A close reading of the above-cited sources is reassuring. All financial and foreign exchange settlement systems, whether gross or netting, formal or informal, multilateral or bilateral, track and match individual (“gross”) transactions through their operations. All of them, whether on- or off-shore, require an account with the central bank that issues the currency in which the gross transaction is denomi-nated. Finally, all use the same messaging cum netting system created and operated centrally by SWIFT. Ultimately, all these settlement systems are overseen and regulated by the central banks. To set up alternative settlement operations would be to go back to the informal proprietary systems and technologies of thirty years ago, something much more costly in money and risk than the CTT.
Assumptions for Estimating RevenueTo estimate CTT revenue, we assume:
Dealer spreads reflect the CTT rate fully;
The CTT is applied to the traditional foreign exchange markets, namely, the spot, outright forward contract, and swap derivative markets;
There is no tax evasion; and
The elasticity of foreign exchange volume with respect to the spread is -0.43 for all currency pairs and foreign exchange instruments.
The first two assumptions are conservative. First, it is likely that dealers will pass on some of the tax to their non-dealer customers by widening the retail and non-financial spread. Then the dealer spread may not widen by as much as we assume. Second, if the tax is collected on individual transactions as they are settled, which is the only feasible option, then it would naturally apply also to the huge non-traditional foreign exchange markets, such as those for over-the-counter derivatives and instruments traded on exchanges.24

INNovATIvE FINANCING 35
The last assumption is a simplification: probably the spread elasticity of volume differs by market. This is not important. We checked the sensitivity of our revenue estimates to the volume elasticity by increasing it (in absolute value) to -1 in all markets, and found that the estimates fell by only 10 per cent.
We will propose a CTT rate of 0.5 basis points (= 0.005 per cent). Our first assumption means that dealer spreads would then widen by one basis point. To see this, recall that the spread contains prices for buying and selling a currency. The exchange rate that appears on foreign exchange paper or agreements to trade is the mid-point between the buying and selling rates. Thus, someone approaching a dealer to buy a currency pays half the spread to the dealer. Similarly, someone who sells a currency pays half the spread. If anyone makes a “round-trip” investment, such as buying a currency this month and selling it next month, the cost of the two transactions is the whole spread. With a CTT in force, traders pay the full tax on each transaction, buying or selling a currency. That is, the cost of each transaction is now half the pre-tax spread plus the CTT. Since traders both buy and sell currencies, the post-tax spread, including buy and sell prices, widens by twice the CTT rate.25
Our estimates to follow are based on foreign exchange markets as they were in April 2007. That was the month of the latest Bank for International Settlements (BIS) survey of foreign exchange activity (BIS 2007).
The CTT RateThe desired CTT rate raises lots of money without disrupting the foreign exchange market. There is no way to identify the rate precisely. Practically, however, the post-tax spread should be well within the range of recent spread values and transaction volume should not fall too far.
The average and variability of the spread differs considerably across currency markets (Table 1). It is feasible to set a different CTT rate for each currency pair or foreign exchange instrument. However, a uniform rate in all markets would avoid unwanted effects on cross-market trading activity.
Recent Spread ValuesSpreads have been narrowing over the last 20 years, especially recently. They are now at their smallest ever, probably because trading, communication, and settlement technologies have improved and transaction volumes are high.
However, spreads rise substantially and persistently too. In the £/$ market in 1992 the average spread rose by 0.54 basis points, persisting at the higher level for nearly six years. In the DM_€/$ market in January 1999 the spread rose by a full basis point with the intro-duction of the euro. That increase lasted four years. In the ¥/$ market from 1989 to 1995 the spread rose steadily by 1.76 basis points altogether.
The usual measure of the variability of the spread is the “standard error”, the average deviation of the spread from its own average value, in basis points. A characteristic of the standard error is that adding it to and subtracting it from the average spread defines a range that contains about 68 per cent of the historical values of the spread.26 Spreads outside this range are unusual in a probabilistic sense. In the last five years (2001:1–2006:3), the average

CANADIAN DEvELoPMENT REPoRT 2009 — FINANCING DEvELoPMENT IN TIMES oF GLoBAL CRISIS36
Table 1: Foreign Exchange Spreads and Volumes
MarketAveragespreada
Standarderrorb
Coefficient of variationc
Transactionvolumed
Volumeshare
$ / € 2.95 1.14 0.30 201,600 0.52$ / ¥ 3.39 0.95 0.23 95,280 0.25$ / £ 2.59 0.83 0.25 86,640 0.23
Wtd.ave. 2.98 1.02 0.27 … …Total … … … 383,520 1.00€ / ¥ 4 … … 16,800 …€ / £ 5 … … 15,360 …¥ / £ 9 … … 2,400e …
Source: Olsen Financial Technologies (www.olsendata.com) for $ spreads (with respect to the €, ¥, and £); FX Solutions (www.fxsol.com) for non-$ spreads; BIS (2007, Table 4) for volumes.
_________________a In basis points, averaged over 2005:04–2006:03, the last year for which we have data.b A measure of the variability of the spread, in basis points, for the period 2001:1–2006:3.c Standard error ÷ average spread for the period 2001:1–2006:3. Average spreads for this calculation are for the full five-year period, and thus
differ from those shown in the table.d US$ billions per year, based on daily averages reported by the BIS for April 2007 and assuming 240 business days a year.e Estimated as 1.36 × 7.4. The latter figure is from April 2004 (BIS, 2005, Table E.7, adding together the amounts traded in Japan and the UK).
The former figure is the average of the increases in trading volumes of the $/¥ and the €/¥ from 2004 to 2007.
standard error across the major currency pair markets was a little more than one basis point (Table 1). Dividing the standard error by the average spread defines the “coefficient of varia-tion”. In the past five years, the average standard error was 27 per cent of the average spread.
So, spreads in the major currency markets commonly fluctuate by up to a basis point and, less commonly, by more. They also increase persistently, by a basis point or more. Then a permanent increase in spreads of one basis point, due to a CTT of 0.5 basis points, would conform to recent experience.
How would a CTT affect the volume of trading and, by extension, market liquidity?
The CTT and Trading VolumeThe foreign exchange market is the largest in the world in terms of volume of transactions, and the volume in 2007 was the highest ever. We calculate that a CTT of 0.5 basis points would cause foreign exchange transaction volumes to fall by 14 per cent, given all other factors affecting transactions (see opposite for the calculation). If such a CTT had been applied since 2004, market size in 2007 would still be the largest ever for all the major currencies.
The foreign exchange market is not always expanding. Between 1998 and 2001 transaction volumes in the $ and ¥ markets fell by 11 and 4 per cent, respectively, nearly as much in the case of the $ as the estimated effect of a half-basis point CTT.
By these comparisons, it is unlikely that a CTT of 0.5 basis points would disrupt either exchange rate behaviour or market liquidity. This is a natural consequence of the fact that our choice of tax rate and estimate of tax-induced volume fall are based on past co-varia-tions of currency spreads and volumes.

INNovATIvE FINANCING 37
CTT Revenue EstimatesWe estimate revenue from a unilateral CTT of 0.5 basis points, levied separately and uniquely on the $, €, ¥, and £. We also estimate revenue from a CTT coordinated over multiple currencies, including all the major currencies, all the currencies except the $, and just the € and £ (Table 2).27
CalculationRevenue from a CTT would be equal to the tax rate (0.005 per cent) × the post-tax volume of foreign exchange transactions. The post-tax volume depends on the pre-tax volume (v0), the elasticity of volume with respect to the spread (-0.43), and the percentage increase of the spread due to the tax (1.0/ , where is the average spread).
Putting all this together, we calculate CTT revenues (R0.5) by the following formula.
R0.5 = 0.00005v0 1– 0.43 1.0
Recall that we checked these estimates for sensitivity to the spread elasticity of volume. When the elasticity is increased (in absolute value) arbitrarily from -0.43 to -1, estimated revenues fall by 10 per cent.
Expected RevenuesA CTT of 0.5 basis points levied only on the $, against all other currencies, would yield an annual revenue of US$28.38 billion. A CTT on the € alone would yield US$12.29 billion; on the ¥ alone, US$5.59 billion; and on £s alone, US$4.98 billion.
A coordinated CTT of 0.5 basis points on all the major currencies would yield an annual revenue of US$33.41 billion. This is only US$5.03 billion more than a tax on the $ alone, since most foreign exchange transactions occur among the major currencies, and most involve the $. A coordinated CTT on all the major currencies except the $ would yield a revenue of US$21.24 billion. A coordinated tax on just the € and £ together would yield US$16.52 billion.

CANADIAN DEvELoPMENT REPoRT 2009 — FINANCING DEvELoPMENT IN TIMES oF GLoBAL CRISIS38
Table 2: Estimated revenue from a CTT of 0.5 basis points (US$ billions, annual)
CurrencyPre-taxvolumea
Averagespreadb
Change inspreadc
Post-taxvolumed
Estimatedrevenuee
CTT on $ …$ 664,855 2.98 0.34 567,653 28.38
… and all other major currencies.+ € + 83,448 4.48 0.22 + 75,554 + 3.78+ £ + 13,560 9 0.11 + 12,919 + 0.65+ ¥ + 12,636 9f 0.11 + 12,038 + 0.60
Total 774,499 … … 668,164 33.41CTT on € …
€ 285,048 3.17 0.32 245,825 12.29… and £ and ¥.
+ £ + 100,200 2.78 0.36 + 84,689 + 4.23+ ¥ + 107,916 3.39 0.29 + 94,459 + 4.72
Total 493,164 … … 424,973 21.24CTT on ¥.
¥ 127,116 3.59 0.28 111,811 5.59CTT on £.
£ 115,560 3.08 0.32 99,659 4.98Source: BIS (2007, Table 1, at constant April 2007 exchange rates, and Table 3), and Table 1 here.__________________a Against all other currencies, less volumes in the relevant currency pair markets of Table 1 to eliminate double-counting.b Estimated from spreads and transaction volumes in the currency pair markets presented in Table 1.c Tax-induced increase in the spread relative to the pre-tax average spread: 1.0/ .d See page 37 for the calculation.e See page 37 for the calculation.f Assumed.
Comparison to Estimated Revenue from Other SourcesThere are other potential sources of new finance (Table 3). They are not all comparable to the CTT. The International Finance Facility (IFF) and International Finance Facility for Immunisation (IFFIm) do not raise new revenues, but bring forward normal flows of official development assistance (ODA) so they will peak between 2010 and 2015. Barring changes in policy, ODA would fall commensurately below normal levels after 2020. An issuance of Special Drawing Rights (SDRs) by the IMF for development would likely occur only once.
Some of the new revenue sources, such as the air ticket levy and the IFFIm, are underway, the former as a pilot project in France, the latter as a specialized version of the IFF-proper. We may have more confidence in these revenue estimates than in the others, which are neces-sarily speculative. At US$200 million and US$4 billion, respectively, they are at the low end of the new revenue generators, but will bring in much more as other governments join the schemes. The carbon tax has by far the greatest potential to raise revenue, estimated at between US$130 and US$750 billion each year, depending on the tax rate. However, it is also intended to discourage carbon emissions, so a large share of the revenue may go to the affected industries and employees.

INNovATIvE FINANCING 39
Table 3: Estimates of Revenue From Other New SourcesDevice Rate Base Special features Est.a
Air ticket levyb € 4 (econ) –€ 40 (busi)
France • Backed by Leading Group of 40+ government members
• Funds UNITAID, IDPF, IFFIm
0.200
Carbon taxc $0.05 – 0.35/US gal.
global • Applied to 5.2 b tons of carbon emissions expected by 2020
130-750
Global lotteryd … global • Applied by national lotteries 6
IFFe … contributions • Accelerates ODA to before 2020• Not additional to ODA post-2020• Requires agreement on need
50
IFFImf … contributions • Accelerates ODA to before 2020• Supported by eight countries• Funds GAVI Alliance
4
SDRsg … IMF issuance • One-time allocation for development• Requires rich governments to transfer
allocations to poor governments
25-30
___________________a US$ billions, annual.b Jouanneau (2006).c Cooper (1998); Sandmo (2004).d Addison and Chowdhury (2004).e Mavrotas (2004).f IFFIm (2007).g Aryeetey (2004).
Advantages of the Currency Transaction TaxThe CTT is a feasible new source of revenue for development and other global projects. From previous work by us and others, we know how to implement it. With this study, we also know that it can raise at least US$33 billion of independent, global, and stable revenue each year. This is a conservative estimate, since the actual tax base is likely to be much bigger than the traditional foreign exchange markets we use. We estimate that a CTT of 0.5 basis points, which increases spreads in the major currency markets by one basis point, would lead to a fall in transaction volumes of 14 per cent. Post-CTT spreads and transaction volumes would be well within the range of recent observations.
The Currency Transaction Tax appears to be the most immediate and effective new source of financing sought by the Monterrey Conference on Financing for Development in 2002, and by the UN and the “Leading Group on Solidarity Levies to Fund Development” since then.
Parliamentary ActivismWhile finance ministries and central bankers have been reluctant to engage with the CTT, interested parliamentarians have sought to advance the issue. In June 2008, the all-party Parliamentary Group on International Solidarity Levies (PGISL) of the Japanese parliament submitted a formal request to the government to join the Leading Group on Solidarity Levies for Development. Looking forward to the G8 Tokyo Summit, they argued that to deal with “problems without passports” like poverty, epidemics, and climate change, Japan should lead in providing solutions without borders. They promoted the leading group as a place to develop new ideas and initiatives.

CANADIAN DEvELoPMENT REPoRT 2009 — FINANCING DEvELoPMENT IN TIMES oF GLoBAL CRISIS40
The Japanese parliamentarians have hosted five study sessions over three months, sent an observer to the Dakar meeting of the leading group, and engaged academics, development practitioners and advocates. “In particular,” they state, “the PGISL has recognized the growing international acceptance towards CTDL (Currency Transaction Development Levy or CTT) and its effectiveness” (Katsumi 2008).
The UK All-Party Parliamentary Group (APPG) for Debt, Aid, and Trade launched a report on innovative finance on November 6, 2007. Having heard expert testimony from Joseph Stiglitz, among others, and utilized research by Rodney Schmidt, they recommended a “stamp duty” or levy on transactions in sterling currency to fight world poverty:
To be effective a sterling stamp duty would have to be easily and inexpensively imple-mented, capture the vast majority of sterling transactions around the world, and be set at a level that would not lead to avoidance or cause any adverse effect to UK trade or the City. We believe that it passes these tests and should be actively considered by the UK government (Stamp Out Poverty).
These recent initiatives, including a similar initiative in the Italian parliament, follow a decade of campaigning on the CTT and previously the Tobin Tax. On November 19, 2004, the Belgian Parliament passed a law introducing a tax on exchange of foreign currency, bank notes, and coins. Belgium thus became the first country to legislate a currency transaction tax within its border. However, the law will only come into effect when similar action is taken
by all other EU governments, or by EU regulation.28
Canada: On the SidelinesEarly on, in March 1999, a resolution calling for the implementation of a Tobin Tax, a prede-cessor proposal to the CTT was passed by the Canadian parliament. At that time, through the initiative of NGOs like ATTAC and many others, municipal resolutions favouring such a tax were passed in a number of countries and local jurisdictions.
Recently, however, Canadian governments have not seriously engaged with the innovative financing initiative and have been neither members nor observers of the leading group since the original Paris Conference. In general, the official government position is one of opposi-tion in principle to global levies and non-budgetary assistance channels, arguing that they subvert national budget principles and, where parallel administrative structures are erected, are costly and duplicative. Canada has signed on to one element of the “menu”, which is the Advanced Market Commitment for Vaccines project initiated by Italy and a number of other countries, in which donor governments “commit money to guarantee the price of vaccines once they have been developed, thus creating the potential for a viable future market.”29
Given the flurry of interest in the Tobin Tax in the late 1990s and the parliamentary motion endorsing the idea in 1999, one might have expected at least a measure of positive curiosity by Canadian governments, as the “taboo” regarding global levies was broken in this decade. The urgencies for additional, predictable, and sustainable funding have multiplied, with the escalating concern regarding funding for climate change, and current emergencies in food and energy costs. When estimates for funding needed to mitigate and adapt to climate change range in the hundreds of billions, the need for new and relatively automatic sources

INNovATIvE FINANCING 41
of funding is clear. The relative stagnation of aid flows and the timelines likely necessary to limit and recover illicit flows and capital flight suggest the implementation of projects such as the CTT or the expansion of existing pilots like the airlines levy, which can yield significant flows in the short term. The CTT, as our research has demonstrated, is one of the few initia-tives that can yield the scale of resources required.
In this context Canada’s official standoff from the leading group can only be regretted, and should be reversed in any meaningful review of our international development policy in the near future. More broadly, Canadians need to ask — given the current situation of ODA, the recognized threat of climate change, the growing crises in food and energy, and the insta-bility of financial markets dramatized by the sub-prime mortgage crisis — what fresh initiatives their government will contribute to the Doha preparatory process? To what extent will we measure up to the challenge of today?
The renewal of interest in a number of parliaments in the CTT offers some potential for an effective campaign. In Canada, the formation of an all-party parliamentary group that would advance study and promote parliamentary and government action could be a very useful way forward. The linkage of parliamentarians in various jurisdictions, committed to the implementation of the tax, would be a useful initiative for sympathetic NGOs to support.
John W. Foster is a Principal Researcher at The North-South Institute with focus on Civil Society and Governance. He has followed the UN Financing for Development process since prior to the original Monterrey Conference and has spoken periodically at High Level Meetings of the Economic and Social Council, the Millennium plus 5 Summit and the General Assembly sessions preparing the 2008 Doha FfD Review Conference. John is affiliated with Social Watch international network, the Commonwealth Civil Society Advisory Committee and UBUNTU – World Forum of Civil Society Networks. John Foster holds a bachelor degree (University of Saskatchewan) as well as a Masters and PhD from the University of Toronto and is an honorary Doctor of Divinity of St. Andrew’s College, Saskatoon. His most recent publication is Breaking the Taboo: Perspectives of African Civil Society on Innovative Sources of Financing Development.
Rodney Schmidt is a Principal Researcher at The North-South Institute with focus on Finance and Debt. Before joining the Institute in January 2002, Rodney was a Program Advisor for the International Development Research Centre and Coordinator of the Vietnam Economic and Environment Management Research Program in Hanoi. His current research interests focus on foreign direct investments in low-and middle-income countries, financing for development and currency transaction taxes. He received his PhD in Economics from the University of Toronto. His latest research work entitled on The Currency Transaction Tax: Rate and Revenue Estimates was published by UNU-Wider in 2008.

CANADIAN DEvELoPMENT REPoRT 2009 — FINANCING DEvELoPMENT IN TIMES oF GLoBAL CRISIS42
ReferencesAction Against Hunger and Poverty. (2004, September). Report of the Technical Group on Innovative Financing Mechanisms: Executive Summary.
Addison, T., & Chowdhury, A. R. (2004). A global lottery and a global premium bond. In A. B. Atkinson (Ed.), New Sources of Development Finance, Chapter 8. Oxford University Press.
Aryeetey, E. (2004). A development-focused allocation of the Special Drawing Rights. In A. B. Atkinson (Ed.), New Sources of Development Finance, Chapter 5. Oxford University Press.
Atkinson, A. B. (2004, September). New Sources of Development Finance: Funding the Millennium Development Goals. UNU-WIDER, Helsinki, v.
Baker, Raymond W. (2007, June 28). Speech: “The Ugliest Chapter in Global Economic Affairs Since Slavery” www.gfip.org.
BBC News. (2007, July 31) “In full: Brown’s speech at UN.” news.bbc.co.uk/1/hi/uk_politics/6924570.stm.
BIS (2005, March). Triennial central bank survey of foreign exchange and derivatives market activity in 2004. Statistical report, Bank for International Settlements, Basle.
BIS (2007, September). Triennial central bank survey of foreign exchange and derivatives market activity in April 2007: Preliminary global results. Statistical report, Bank for International Settlements, Basle.
Chirac, Jacques. (2006, February 28). Speech: Paris International Conference “Solidarity and Globalization: Innovative Financing for Development and against Pandemics.” Paris. www.diplomatie.gouv.fr/en/france-priorities_1/development_2108/ innovative-ways-to-fund-development_2109/index.html.
Cooper, R. N. (1998, April). Toward a real global warming treaty. Foreign Affairs, 77(2), 77.
Epstein, Gerald, ed. (2005). Capital Flight and Capital Controls in Developing Countries. Northampton, MA: Edward Elgar Publishing.
George, Susan. (2006, September 18). Why the Currency Transaction Tax is a Win/Win Scenario. Transnational Institute. www.tni.org/detail_page.phtml?&act_id=15924.
Hillman, D., Kapoor, S., & Spratt, S. (2006, December). Taking the next step: Implementing a currency transaction development levy. Technical report, Stamp Out Poverty, Commissioned by the Norwegian Ministry of Foreign Affairs.
IFFIm (2007, July). www.iff-immunisation.org.
Jouanneau, D. (2006, 28 February). Why that Paris trip will cost a little more. Globe and Mail Online, www.theglobeandmail.com/.
Katsumi, Takahiro. (2008, June 3). Parliamentary group on solidarity levy submits formal request to the Foreign Minister, Tokyo. uneps-japan.blogspot.com/2008//06/ parliamentary-group-on-solidarity-levy.html.
Landau, J.-P. (2004, December). Report to Mr Jacques Chirac, President of the Republic. Technical report, Working Group on New International Financial Contributions. (Groupe de Travail sur les nouvelles contributions financières internationales.)
Mavrotas, G. (2004). The international finance facility proposal. In A. B. Atkinson (Ed.), New Sources of Development Finance, Chapter 6. Oxford University Press.
Nissanke, M. (2004). Revenue potential of the currency transaction tax for development finance. In A. B. Atkinson (Ed.), New Sources of Development Finance, Chapter 4. Oxford University Press.
Sandmo, A. (2004). Environmental taxation and revenue for development. In A. B. Atkinson (Ed.), New Sources of Development Finance, Chapter 3. Oxford University Press.
Schmidt, R. (1999, March). A feasible foreign exchange transactions tax, www.nsi-ins.ca/english/pdf/tobin.pdf.
Schmidt, R. (2000). A feasible foreign exchange transactions tax. In W. Bello, N. Bullard, & K. Malhotra (Eds.), Global Finance: New Thinking on Regulating Speculative Capital Markets, 215 238. London and New York: Zed Books.
Schmidt, R. (2001). Efficient capital controls. Journal of Economic Studies, 28(3), 199 212.
Schmidt, R. (2007). The Currency Transaction Tax: Rate and Revenue Estimates, www.nsi-ins.ca/english/pdf/CTT%20revenue.pdf.
Spratt, S. (2006, July). The Tobin tax in the 21st century: Financing development and promoting international financial stability. Tech-nical report, New Economics Foundation, www.currencytax.org/files/policy_papers/spratt2006.pdf.
Stamp Out Poverty (n.d.). Cross-party group of MPs support sterling stamp duty. www.stampoutpoverty.org/?lid=10627.
Tax Justice Network. (2007, February) Closing the Floodgates. Collecting Tax to Pay for Development. Commissioned by the Norwegian Ministry of Foreign Affairs.
Tobin, J. (1996). Prologue. In M. ul Haq, I. Kaul, & I. Grunberg (Eds.), The Tobin Tax: Coping with Financial Volatility, ix xviii. New York and Oxford: Oxford University Press.

INNovATIvE FINANCING 43
Endnotes 1 Development Assistance Committee
2 The Global Monitoring Report 2008 findings were presented in powerpoint form at the high-level meeting, for details see: web.worldbank.org and follow the links to the Global Monitor-ing Report, 2008. Concern about available resources might be further enlarged by noting that the Bank reported that the top four recipients of ODA (including debt relief) for 2002-2006 were Nigeria, Iraq, Sudan, and Afghanistan.
3 From paragraph 115 of the Secretary-General’s paper as cited in: John W. Foster. “To Doha and Beyond”. Ottawa, February 1-2, 2008. Notes for an address. P. 2.
4 The North-South Institute has been well-represented in some of these preparatory events, including Rodney Schmidt’s presentation on CTT, incorporated into this chapter, a verbal intervention at the high -level meeting by John W. Foster (both co-authors of this chapter), and participation in substantive seminars by Roy Culpeper (co-author of chapter 4).
5 Friedrich Ebert Stiftung (FES), Challenges in Financing for De-velopment: Policy Issues for the Doha Conference. Conference Report. New York, October, 2007.
6 Association pour la Taxation des Transactions financières pour l’Aide aux Citoyennes et citoyens.
7 The SDR is an international reserve asset, created by the IMF in 1969 to supplement the existing official reserves of member countries. SDRs are allocated to member countries in propor-tion to their IMF quotas. The SDR also serves as the unit of account of the IMF and some other international organizations. Its value is based on a basket of key international currencies. SOURCE: IMF FACT SHEET, APRIL, 2008.
8 A brief treatment of the emergence of the CTT can be found in George, Susan. “Why the Currency Transaction Tax is a Win/Win Scenario.” Transnational Institute. 18 September, 2006. www.tni.org/detail_page.phtml?&act_id=15924
9 Action Against Hunger and Poverty. Report of the Technical Group on Innovative Financing Mechanisms: Executive Sum-mary.” September, 2004. P. 68.
10 Ibid.
11 Joint statement by Brazil, Chile, France, Germany, and Spain. 11/02/2005. See also Berlin Declaration by Algeria, Brazil, Chile, France, Germany, and Spain. Both at www.diplomatie.gouv.fr/ en/france-priorities_1/development_2108/ innovative-ways-to-fund-development_2109/index.html.
12 International conference on “Solidarity and Globalization: innovative financing for development and against pandemics” at www.diplomatie.gouv.fr/en/france-priorities_1/development_2108/ innovative-ways-to-fund-development_2109/index.html.
13 www.unitaid.eu/en/UNITAID-in-action.html.
14 Stamp Out Poverty, Taking The Next Step. A Report Commissioned by the Norwegian Ministry of Foreign Affairs, February, 2007.
15 Breaking the Taboo: Perspectives of African Civil Society on Innovative Sources of Financing Development. London. The Commonwealth Foundation, CONGAD, The North South
Institute, Social Watch. 2008.
16 Letter to Minister Bernard Kouchner, et al. June 11, 2008, from Joseph Xercavins on behalf of the NGO working group on CTT for FfD.
17 Paragraph 1.6 of the note of the Secretary-General of the United Nations, “Coherence, coordination and cooperation in the context of the implementation of the Monterrey Consen-sus, including new challenges and emerging issues,” E/2008/7, 14 March 2008.
18 The Guinean Government in taking up the Presidency of the Leading Group at the Dakar meeting, conveyed its approach in a letter read to the plenary.
19 Breaking the Taboo: Perspectives of African Civil Society on Innovative Sources of Financing Development. London. The Commonwealth Foundation, CONGAD, The North South Institute, Social Watch. 2008.
20 More than 50 heads of state and 200 senior ministers, as well as the heads of the United Nations (UN), International Monetary Fund (IMF), World Bank (WB), and World Trade Organization (WTO), attended the UN International Conference on Financing for Development at Monterrey, Mexico, in 2002. The Confer-ence began a search for new sources of development finance, led formally by the UN Department of Economic and Social Affairs (www.un.org/esa/ffd/), and informally by more than 40 governments participating in the Leading Group on Solidarity Levies to Fund Development (www.innovativefinance-oslo.no/).
21 The elasticity is a measure of normal demand for foreign exchange transactions. It does not reflect tax evasion.
22 The coefficient for the € spread was not statistically significant, while that for the £ spread, though marginally significant, had the “wrong” sign — a decline in the £ spread raised ¥ volume slightly.
23 Society for Worldwide Interbank Financial Telecommunication.
24 This point is made by Hillman et al. (2006, 24).
25 Professor Anthony Clunies-Ross of the University of Strathclyde pointed this out to me.
26 This is the case when realized spread values approximate a “Normal” distribution.
27 Since the CTT would be collected by clearing and settlement bodies, in which the two currencies and individual amounts of a trade are matched for processing (true of both netting and final settlement systems), the CTT would be assessed on “currency pairs.” For example, the tax would be collected once on a purchase or sale involving the ¥ and the $, and again, separately, on a purchase or sale involving £ and the $.
28 “Tax on foreign currency exchange in Belgium” members.virtualtourist.com/m/tt/5db10/. The European Central Bank was asked by the Belgian parliament for its assessment of the law in draft, and was critical of the initiative. See ecb.int/ecb/legal/pdf/en_con_2004_34_f_sign.pdf. Peter Wahl, of World Economy, Ecology, and Development (WEED), based in Germany, presented a thorough critique of the ECB’s position to the Special Commission on Globalization of the Belgian House of Representatives, July 13, 2005. www2.weed.-online.org/uploads/WEED_ECB_CTT.pdf.
29 www.vaccineamc.org. As part of the AMC, participating companies also make binding commitments to supply the vaccines at lower and sustainable prices after the donor funds made available for the initial fixed price are used up.

CANADIAN DEvELoPMENT REPoRT 2009 — FINANCING DEvELoPMENT IN TIMES oF GLoBAL CRISIS44

NEW FoRMS oF CooPERATIoN: FoR WhAT AND FoR WhoM? 45
ThREEChapter
New Forms of Cooperation: For What and For Whom? The Case of the Bank of the South
Fabrina Furtado

CANADIAN DEvELoPMENT REPoRT 2009 — FINANCING DEvELoPMENT IN TIMES oF GLoBAL CRISIS46

NEW FoRMS oF CooPERATIoN: FoR WhAT AND FoR WhoM? 47
New Forms of Cooperation: For What and For Whom? The Case of the Bank of the SouthFabrina Furtado
Introduction: The importance of South-South CooperationDuring the last decades, International Financial Institutions (IFIs) such as the World Bank, the International Monetary Fund (IMF), and the Inter-American Development Bank (IDB) have been dictating “rules of good behaviour” to Southern countries, violating their sovereignty and right to self-determination.1 These policies have been responsible for economic, cultural, social, and ecological destruction. Central to these policies is the use of massive public indebtedness in order to transfer capital from the South to the North in terms of payment of debt interests and services as well as of natural and human resources. This system of exploi-tation has been possible due the imposition of loan conditionalities that have infringed on national sovereignty, violated democratic and legal procedures, and imposed unilateral contracts with enormous costs for the countries of the South.
Due to the failure of these policies (for the peoples, not the market) and civil society resistance, the IFIs and their development model are facing what may be considered as one of their worst political crises even if only in terms of discourse.2 Parallel to this crisis is the recognition that new forms of cooperation to support development and break away from the permanent destruction caused by the vicious circle of indebtedness are needed. In this context South America is currently the global focus for the construction of new Southern institutions that may be capable of replacing the IFIs.
The last few years have seen a strengthening of the integration process in South America, especially after the Mar del Plata Presidential Summit, which slowed down the Free Trade Area of the Americas (FTAA). Next came the creation of a community of nations, expressed in the Union of South American Nations (UNASUR by its Spanish abbreviation) with a perma-nent secretariat in Quito, Ecuador. Then, in October 2007, representatives from the Brazilian, Argentinean, Bolivian, Ecuadorian, and Paraguayan governments signed the “Rio de Janeiro Declaration,” which established directives for the creation of the Bank of the South (MF 2007), a proposal for the establishment of a sovereign, financial integration as an alternative to the IFIs. On December 9 of the same year, representatives from the above countries plus Uruguay signed the foundation act of the new institution, making commitments to elaborate the bank’s statute within 60 days. The new institution was to be a development bank, oriented towards the financing of strategic sectors, scientific and technological development, and poverty reduction. The declaration also foresaw the creation of a natural emergencies fund

CANADIAN DEvELoPMENT REPoRT 2009 — FINANCING DEvELoPMENT IN TIMES oF GLoBAL CRISIS48
(Venezuela 2007). The 60-day period would give the governments time to reach consensus on the organizational structures, specific objectives, and operational instruments of the bank.
According to civil society organizations and networks, such as the Brazil Network on Multilateral Financial Institutions and Jubilee South, the Bank of the South, like other finan-cial institutions, is still not clearly defined in favour of the peoples’ interests. The UNASUR meetings so far point towards a model of development that may lead to greater accumula-tion of capital, not greater economic equality for the people. The 60-day deadline was not met and four months later the media discovered that the bank was still in negotiation. It seems that the only decision taken until now concerns the bank’s capital. The governments involved have not yet declared the progress and/or limits regarding the other points under negotiation, such as governance structure and objectives. The major concern here is what development strategies this bank aims at achieving. It seems that the Brazilian government, although resisting the initiative at first, then joined the negotiations with the objective of guaranteeing funds for its development model — mega infrastructure projects in the context of the Initiative for the Integration of Regional Infrastructure in South America (IIRSA), oriented towards the growth of international trade and the privatization of territories and natural resources — while neglecting local demands and socio-environmental impacts. Such a model requires a governance structure that maintains asymmetries in terms of decision making.
In the meantime, on January 26, 2008, the presidents of Venezuela (Hugo Chavez), Bolivia (Evo Morales), Nicaragua (Daniel Ortega) and the Cuban vice-president (Carlos Lage) signed the Constitutive Act of “Banco del ALBA” (The Bank of the Bolivarian Alternative for the Americas). While not dominated by the interests of the Brazilian government to export its own capitalism, the bank has still generated many concerns, with lack of transparency being a major issue.
Other proposals regarding the political and financial system in the region, although still premature, are also under discussion. A central bank, a stabilization fund, and a mechanism to settle investment disputes — initiatives to complement the Bank of the South — are some of these examples.
Firstly, however, it is important to remember that history has shown that IFIs are very effective in promoting so-called internal and external changes, adapting themselves to criticism and consolidating their hegemonic role in global governance. The Bank of the South seems to be no exception. Secondly, the mere fact that new forms of South-South cooperation are being constructed does not imply that the process is free from constraints and limitations, espe-cially considering the difficulties faced when attempting to break away from the neo-liberal development model. Therefore, although this moment represents the possibility of a new financial architecture and South-South processes of cooperation, the lack of transparency, delays in commitment, and silence about the processes of negotiations — especially regarding the Bank of the South — demonstrate the existing political conflicts and the incapacity of some governments to break away from models imposed by the IFIs. Thirdly, perhaps to truly break away from the current model, instead of creating institutions in the South that mirror those that the North has historically controlled, the South needs to go beyond current economic paradigms, be more creative, and find new forms of cooperation capable of guaranteeing justice and solidarity.

NEW FoRMS oF CooPERATIoN: FoR WhAT AND FoR WhoM? 49
With this in mind, this chapter will discuss some of the recent political and financial changes taking place in the region that have led to the possibility of constructing a Southern financial system. The chapter will also analyze the creation of the Bank of the South, its origins, and what is at stake, including the conflicting perspectives between the different governments, the role of the Brazilian government and its National Bank for Economic and Social Development (BNDES), the risk of the bank financing a development model based on IIRSA, and the relation of the Bank of the South with other proposals, such as the Bank of ALBA. The chapter will end by pointing out some of the issues being discussed within civil society in terms of South-South cooperation related to financing for development and a sovereign political and financial system, as well as the opportunities and challenges for the future.
Recent Changes in Latin AmericaCurrent South-South cooperation as well as official proposals, such as the Bank of the South, occur in a context of political and economic change in the region that revolves around recovering sovereignty, promoting autonomous and fair financing, and putting an end to the vicious circle of debt accumulation. While some actions of governments in the region have resulted in little change in practice, others raise optimism for a possible increase in the financial power, and consequently political autonomy, of some countries.
The financial relevance of the IFIs in the region, especially in South America, is shrinking. Countries such as Brazil and Venezuela no longer depend financially on loans from these institutions because they either have high internal credits (Venezuela due to the super-profits from the increase of oil prices since the invasion of Iraq in 2003), access to other sources of credit in more favourable conditions (such as the Brazilian National Bank for Economic and Social Development [BNDES]), and high external reserves. Brazil’s current international reserves stand at almost US$195 billion, for example (BC 2008). Nevertheless, to keep international reserves at such a high level, domestic debts increase unsustainably. In Brazil, for example, the domestic debt reached US$0.6 trillion (RS$ 1 trillion) in December 2007 (Ávila 2008).
Other institutions such as BNDES, although not a multilateral financial institution but rather a national bank with transnational activities, and the Andean Development Corporation (CAF), are increasingly gaining space as financing for development institutions in Latin America and the Caribbean. In 2006, for example, the World Bank disbursed around US$11 billion to the whole world, US$5.5 billion to Latin America and the Caribbean (including Brazil) and US$2.2 billion just in Brazil (World Bank 2007, MPOG 2007). During the same year, the Inter-American Development Bank disbursed US$6 billion to Latin America and the Caribbean and US$1.5 billion to Brazil (IDB 2007, MPOG 2007). However, the disburse-ments of BNDES were more than double these amounts, reaching a total of US$31 billion to different countries in 2006 (BNDES 2007). In 2007, the disbursement of BNDES increased to US$39 billion (BNDES 2008). Although most of the funds of BNDES stay in Brazil and are in fact used to fund Brazilian goods and services, this data shows that its resources are greater than those of the World Bank and IDB, providing it with more potential to expand financing in the region.
CAF, initially created to fulfil the development demands of the five Andean countries (Bolivia, Colombia, Peru, Ecuador, and Venezuela), expanded in 1990 to include amongst its share-holders Argentina, Brazil, Chile, Costa Rica, Spain, Jamaica, Mexico, Panama, Paraguay,

CANADIAN DEvELoPMENT REPoRT 2009 — FINANCING DEvELoPMENT IN TIMES oF GLoBAL CRISIS50
Dominican Republic, Trinidad & Tobago, Uruguay, and 15 private banks of the region. Although the 2007 data had not been published at the time this chapter was written, an analysis of the projects reveals that CAF is disbursing almost as much as the IDB. For the five Andean countries, CAF already represents 50 per cent of multilateral loans while the IDB and World Bank faced a decline of 25 per cent and 20 per cent, respectively. Since 2002, Venezuela has received few loans from the World Bank (two projects from 2005 worth US$7 million) or the IDB (US$930 million from 2005 and 2006). The country received 18 per cent of total CAF loans between 2002 and 2006 and 15 per cent only in 2006 (US$842 million). Furthermore, CAF loans are not restricted to Andean countries. In 2006, Brazil received US$577 million and Argentina US$580 million (World Bank 2006, IDB 2006, CAF 2007).
However, it is important to mention that the quantitative increases have not been translated into qualitative improvements. Both institutions are important funders of mega infrastructure projects that are not oriented to local, national, or regional demands but rather towards international trade and the privatization of natural resources and public services such as energy and transport, causing serious environmental impacts and harming the livelihoods of Indigenous, traditional, and local populations. These impacts can be proven with an analysis of the projects of IIRSA, which CAF is one of the institutions to coordinate and fund.
At the end of 2005, Argentina paid US$9.810 billion claimed by the IMF and Brazil paid US$15.5 billion (Folha 2005). At the end of 2006, it was Uruguay’s turn; they paid US$1.08 billion also to the IMF (BBC 2006). It is worth mentioning that while Brazil’s Gross Domestic Product (GDP) is US$340.247 billion, Argentina’s US$764.552 billion, and Venezuela’s US$146.638 billion, Uruguay’s is US$22.504 billion. In other words, US$1.08 billion for Uruguay represents more in terms of the country’s budget than the amounts paid by Brazil, Argentina, and Venezuela.
On May 1, 2007, Hugo Chavez announced the withdrawal of Venezuela from the World Bank and IMF, after having paid in April — five years before the due date — all of its debts to the institution which, at the time Chavez won the elections for the first time in 1998, were worth US$3.3 billion (UOL 2007). If Chavez had audited these debts, he would have been able to prove their illegitimacy. In other words, the debts were illegitimate because they resulted from loans primarily or exclusively contracted in the interest of the lender, to the detriment of the borrower, where the lender provided incorrect or damaging advice (eco-nomically, environmentally, or socially) and knew that they were given to regimes that would abuse their position of authority and not pursue the collective interests of their own people. However, the Venezuelan president considered that paying off the loans was an act against the international economic and political structure governed mainly by the US, classifying the World Bank and IMF as imperialist institutions. As a corollary, he suggested strengthening South-South integration in order to substitute them.
However, the payments made to the IMF not only deepened the impunity the Fund enjoys regarding its responsibility for the economic and socio-environmental conditions it created in the region, but also failed to result in greater autonomy and sovereignty. The Bush adminis-tration has always been against the large emergency loans given by the IMF at the end of the 1990s, which left the fund with dangerously high debt claims concentrated in a few countries. As such, since the beginning of his administration, the fund made it a priority to recover its liquidity and, consequently, its capacity to act through vigorous claims —

NEW FoRMS oF CooPERATIoN: FoR WhAT AND FoR WhoM? 51
anticipated when possible — of the largest debts pending. In July 2005, the IMF itself recom-mended that Brazil and Argentina pay their debts. Therefore, during the ceremony held to celebrate the anticipated payment of the Brazilian debt, Rodrigo Rato, then director-general of the fund, stated that the IMF was proud of Brazil and that the IMF and the Brazilian government would continue to collaborate (UOL 2006). Two days later, it was Argentina’s turn, and they also received congratulations from the IMF (UOL 2005). This strategy, how-ever, led the IMF to a financial crisis that forced the institution to approve in its last annual meeting, held in April 2008, the restructuring of its quotas — meaning greater financial contributions from developing countries with very little increase in voting powers — along with the sale of around 403.3 tonnes of its gold reserves, and cuts in administrative costs up to US$100 million for the following three years (Chowla 2008, IMF 2008).
As such, the decision of the governments in the region, which complemented Russia’s payment at the end of 2004, contributed to closing the circle of debt accumulation taken on by the IMF. The last of their largest borrowers, Turkey, is punctually paying the claims and is also preparing to settle its debts. However, in the case of Brazil, the country continues to receive loans from other IFIs, is still a member of the IMF, which still gives its endorsement, and — as it has internalized the policies of the fund — even without loans, continues to implement most of the IMF policies package, especially regarding fiscal control. In 2007, for example, the Brazilian government spent US$143 billion on interest and amortization of the domestic and external debts, while spending only US$24 billion on health, US$12 billion on education, and US$2 billion on agrarian reform (Ávila 2008).
In May 2007, Bolivian president Evo Morales announced the withdrawal of Bolivia from the International Centre for Settlement of Investment Disputes (ICSID) of the World Bank Group, considering it an instrument that primarily serves the interests of transnational corporations. However, although the Bolivian government has followed all the proper procedures, in October 2007 ICSID formed a tribunal to judge the case presented by the European com-pany Euro Telecom International (ETI) against the Bolivian government. The Bolivian government continues to declare that it does not recognize ICSID. The initiative resulted in the establishment of a working group in UNASUR to discuss the creation of an investment dispute settlement mechanism of the South. Since this initiative is still premature, not much has been discussed. This Bolivian initiative raises questions regarding the whole globalized financial, commercial, economic, and political structure currently in place, where capital circulates freely, always acts to its own advantage, and is protected and promoted by numerous rules and agreements implemented during the last thirty years or so. To break away from structures such as ICSID, and many others in place, is a sign that the country is attempting to break away from this logic. As Evo Morales states in the “Ten commandments to save the planet,” presented at the inauguration of the United Nation’s VII Indigenous Forum, putting an end to the capitalist model and the North paying its ecological debt to the South are key steps (Morales 2008).
Since January 2007, when Rafael Correa took over the presidency of Ecuador, the country is also carrying out various changes. Correa has taken on the concepts of historic, social and ecological debt, and debt illegitimacy and, consequently, is implementing an official audit of the country’s external and internal debt from 1976 to 2006. The final report should be presented in the second half of 2008 by the Debt Auditing Commission, which is formed

CANADIAN DEvELoPMENT REPoRT 2009 — FINANCING DEvELoPMENT IN TIMES oF GLoBAL CRISIS52
by national and international civil society organizations, as well as government officials. The audit carries out an integral evaluation of all the aspects involving Ecuadorian debt and the implementation of the projects for which the loans were contracted in the first place: legal, financial, economic, social, gender, ecological, and those related to nationalities and peoples (Ecuador 2007). The economic, political, and financial use of this audit — a means and not an end in itself — should have important consequences for the global financial architecture, proving illegitimacies in foreign lending and in the action of IFIs, private banks, and bilateral lenders.
In addition, on April 26, 2007, President Rafael Correa expelled the World Bank representative from the country, accusing the institution of extortion and declaring its representative, Eduardo Somensatto from Brazil, “persona non grata.” In 2005, when Rafael Correa was minister of the economy, the World Bank cancelled a loan of US$100 million to Ecuador after failing to achieve his dismissal from the government. During that period, Correa was pro-moting modifications in a fund created in 2002 through IMF, which was collecting and distributing part of the oil profits of Ecuador. That fund was initially structured around the allocation of 70 per cent of the resources towards the payment of external debt, 20 per cent for the stabilization of oil revenues, and 10 per cent for health and education. The restruc-turing increased the resources directed to health, education, and science and technology to 30 per cent and therefore reduced the funds directed to the payment of debt to 50 per cent. Despite the fact that half the fund’s resources were still directed to the payment of external debt, the World Bank cancelled the loan (Hurley 2007).
To complement these sovereignty initiatives, the governments of Brazil and Argentina are discussing the de-dollarization of trade between the two countries in 2008. The Brazilian and Argentinean exporters will be able to sell their products in Brazilian Reais or Argentinean Pesos without having to convert them into American dollars (O Estado de São Paulo 2007). It is also important to highlight the alternatives in “financing” already in place, such as the exchange of medical staff for oil between Cuba and Venezuela and other similar initiatives within the context of ALBA.
The Bank of the South: Its Origins and What is at StakeTo deepen the political and economic changes occurring in the region and to guarantee independence in relation to the IFIs, in February 2007, Argentina and Venezuela — and shortly afterwards Bolivia, Ecuador, and Paraguay — struck a deal to create the Bank of the South. On May 3, 2007, during a meeting between the president of Ecuador and the economy and finance ministers of Argentina, Bolivia, Brazil, Paraguay, Venezuela, and Ecuador, Brazil officially declared its adhesion to the process. On June 25, Uruguay, until then the only Mercosur member not participating in the initiative, also decided to join. Mercosur is the Common Market of the South, an integration agreement involving Brazil, Uruguay, Paraguay and Argentina as full members and Peru, Colombia, Ecuador and Venezuela as associated members.

NEW FoRMS oF CooPERATIoN: FoR WhAT AND FoR WhoM? 53
During the meeting on May 3, 2007, the “Declaration of Quito” was approved. This agreement, at the ministerial level, expressed the necessity for a new financial architecture for South America, seeking to strengthen the role of the continent in the globalized financial and trade context and prioritize the basic needs of the South American people. In addition to emphasizing the creation of the Bank of the South and scheduling meetings for the definition of objectives, functions, governance and capital structure, and chronology, the ministers agreed to analyze the possibility of creating a stabilization fund (which could result from the strengthening of the Latin American Reserve Fund [FLAR]), proceed in the development of a regional mon-etary system (initially through bilateral trade relations in local currencies), and invite all the countries of UNASUR to adhere to the initiative (Ecuador 2007, 1–2). Of the above, only the Bank of the South has been officially discussed until now.
As mentioned in the introduction, in October 2007 the “Rio de Janeiro Declaration” established directives for the creation of the Bank of the South, and on December 9 of the same year the bank was officially founded (MF 2007). On that date, it was agreed that the bank’s statute — including organizational structure, specific objectives, and operational instruments — would be elaborated within 60 days. This deadline, however, was not met. According to declarations in the media, the only decisions that have been made are that the headquarters of the bank will be in Caracas, Venezuela, with sub-offices in Argentina and Bolivia, and that the authorized capital of the bank will be US$20 billion, while the subscribed capital will be US$7 billion. The member countries decided that capital would be allocated on a basis of three groups of countries, considering their GDP: US$2 billion from Brazil, Argentina, and Venezuela; US$400 million from Ecuador and Uruguay; and US$100 million from Paraguay and Bolivia (Diário do Nordeste 2008). The question remains: if the basis for this decision was GDP, then why isn’t Brazil allocating more capital than Venezuela and Argentina? Firstly, it may be a sign that Brazil does not consider the Bank of the South a priority, as will be shown in more depth below. Secondly, the possible political costs of allocating more funds outside and inside Brazil may be a factor. Negotiations are already complicated enough, thus the need to maintain some level of equality, especially between Brazil, Venezuela, and Argentina, the three countries leading the negotiations. There may also be fears that if Brazil did allocate more funds, then it would use this to its advantage when discussing the decision-making structure. How this allocation was made, however, has not been publicly made clear. A minimum of 20 per cent paid-up share (10 per cent of which can be in local currencies) was also determined. The first group of countries have up to five years to pay the remainder while the other two groups have ten (Diário do Nordeste 2008). Such decisions will only be finalized after approval from the parliaments of each country, a fact that may delay the beginning of operations, still expected to start in 2008. This payment schedule is the result of an important demand from countries such as Ecuador and Bolivia that the financial contributions should be allocated according to the capacity of each country. However, an equal governance structure will depend on the relation between decision making and voting power and financial contributions, which will be explained further below.
The creation of the bank could provide a real alternative to traditional financing and development mechanisms, finally achieving an integral independence of South American countries from the World Bank, IDB, and IMF. Nevertheless, there are still disagreements regarding the operation, structure, and function of this institution in the region because of the different objectives of the countries participating in the initiative.

CANADIAN DEvELoPMENT REPoRT 2009 — FINANCING DEvELoPMENT IN TIMES oF GLoBAL CRISIS54
In this sense, the biggest problem in relation to the Bank of the South has been the almost absolute lack of transparency and participation of civil society in the process. Transparency would mean that the member countries would supply the public with all the information regarding the negotiations, strategies, analyses, political decisions, and procedures discussed in their meetings in an open and clear form with enough time for the public to act upon the information and participate. Civil society groups would be present at certain meetings and contribute to decision making regarding the organization of the bank. Especially in Brazil, civil society has been unable to access national negotiators for information, let alone partici-pation. Various meetings have been requested of the Ministry of Finance — a ministry with little or no history of civil society participation — and not confirmed, nor has any informa-tion been provided. Such secrecy has been publicly denounced by Brazilian civil society, which, in collaboration with parliamentarians, managed to hold a public hearing on the bank with the presence of representatives from the ministries of Finance and Foreign Affairs. The event was an important moment to question the Brazilian negotiators but was not much publicized. What mainly came out of the event was that the government representatives stated that the bank was still being negotiated so not much could yet be made public, but they explained its origins and the importance of financial integration in UNASUR. They also mentioned that the bank will be a classic development bank that will privilege the financing of infrastructure to benefit the physical and economic integration of the region and extra-regional trade, and that civil society will be called to participate when the bank has been fully formed. Civil society representatives at the event raised concerns over this concept of participation. According to the Brazil Network on Multilateral Institutions, participation should not take place after all the decisions are made. Civil society should be able to participate in the design of the bank (Camara dos Deputados 2007).
Furthermore, although governments like Ecuador, Bolivia, Uruguay, and to some extent Argentina, have been making efforts to answer the requests of civil society, or have held open and diverse events to discuss the bank, as has Ecuador, participation has not been collectively accepted as a concern in the technical committee where all member countries negotiate regarding the bank. This lack of transparency and participation is an important point, since an alternative for the peoples can only be constructed if there is collective participation. After so many years of criticism towards the IFIs in this sense, the governments of the South that are aiming to create an alternative should know better. Furthermore, the little information that has been disseminated by the media, or through isolated comments of government officials, reveals the need for civil society to enter the debate and influence the direction of the process.
According to Eric Toussaint, one of the advisors of the Ecuadorian Government on the Bank of the South, the initial proposal elaborated by the governments of Venezuela and Argentina (in March 2007) had striking similarities with the statutes of IFIs, a fact that resulted in official protests, mainly from Ecuador (Toussaint 2007, 1–2). The proposal presented in Quito in May not only reproduced the statutes of the IFIs in terms of the bank’s function — voting power corresponding to financial contributions, impunity and privileges for employees, secret archives, etc. — but also regarding the neo-liberal discourse on the financial context and the general role in South America. In this sense, the document analysed the continent’s problems in light of the malfunctioning of financial and capital markets. From this point of view, the solution could only follow the guidelines of the IFIs adapted to the region:

NEW FoRMS oF CooPERATIoN: FoR WhAT AND FoR WhoM? 55
the Bank of the South should assist the creation of multinational enterprises with regional capital. This financing for development would be directed to capital markets, industry, infrastructure, energy, and trade. In addition, the proposal opens an opportunity for the IFIs to participate in the bank as stakeholders, which could result in them controlling the bank’s policies (Toussaint 2007).
Ecuador on the other hand, proposes that the Bank of the South should observe international human rights treaties; should operate on the “one country = one vote” principle (and not “US$1 = one vote”), so that all the members have the same rights and power; should be governed by the member countries themselves and avoid the creation of a gigantic appa-ratus that would substitute for the state; its directors and employees should be legally responsible for their actions, not immune, and should pay taxes; all the information and archives of the bank should be public and subject to external auditing; and the bank should eliminate asymmetries. Therefore, the loans would be directed to cooperatives and small- and medium-sized companies and not to South American multinationals. According to the Ecuadorian proposal, the member countries would have to create annual financial reporting mechanisms, which should ensure the participation of parliamentarians who would have to approve them. The Bank of the South would not acquire debts from the capital market as the IFIs do, since this leads to justification of policies that seek profitability at any cost. If Ecuador’s proposal prevails, the capital of the Bank of the South will consist of part of the international reserves of the country members and also of global taxes — such as the Tobin Tax on financial transactions — and donations, and could also serve as a mechanism of negotiation of the external debts of the member countries (Ecuador 2007, 1–14). It is true that the founding act of the Bank of the South states that “South-American integration should constitute for the people of the region, a consecrated space for the promotion of economic and social development, the reduction of asymmetries, of poverty and social exclusion, towards convergence and complementarities of the economic integration processes” and that the “bodies to conduct the Bank of the South will have an equal representation of each of the South-American countries that integrate it based on a democratic operational system,” but concerns remain due to the power balance between the governments involved (Venezuela 2007).
The Brazilian Government and the Bank of the SouthOne of the main objectives of the current Brazilian government has been to strengthen leadership in regional and South-South integration processes and its own role in the global-ized economy in general. During a presentation in a seminar on IIRSA, the then president of BNDES and current Minister of Finance, Guido Mantega, stated that the instruments to achieve this are: the expansion of Mercosur (a regional trade bloc highly criticized because of unequal relations between its members in favour of Brazil and Argentina); the formation of political blocks like UNASUR to negotiate with other blocks, such as the North American Free Trade Agreement (NAFTA), the European Union (EU), and the Asian Community; and active participation in the process of globalization as a protagonist. The expected results are: increased competitiveness of national companies; attract one of national and foreign invest-ments to modernize the economy and overcome structural bottlenecks; increased inter-regional trade by exploiting economic complementarities in the fields of energy, transport — access to new export corridors — and telecommunications; and expanded access to other markets.

CANADIAN DEvELoPMENT REPoRT 2009 — FINANCING DEvELoPMENT IN TIMES oF GLoBAL CRISIS56
For this to be possible, Mr. Mantega continued, the construction of a South American infrastructure is necessary. He then went on to say that this depends fundamentally on financing due to the lack of resources in the region, which would be carried out by the BNDES. The model of South American integration presented by Mr. Mantega was IIRSA, with BNDES and other Brazilian export credit agencies being its funders (Mantega 2005).
As such, integration for the Brazilian Government may be translated into more liberalization of the economy in order to strengthen the insertion of the country in the globalized market. This option has no relation with strengthening the local economy, complementarity between countries, the well-being of the people, or respecting the environment. Thus, when Brazil cooperates with other countries in the region, it is this model of integration that it defends.
What is IIRSA?The Initiative for the Integration of Regional Infrastructure in South America (IIRSA) was created in 2000 during a summit of South American presidents. It is a plan aimed at creating an integrated system of logistics in South America through the integration of transport, energy, and telecommunication infrastructure. During this meeting, a document presenting the obstacles to intraregional trade and alternatives to improve the movement of products was elaborated: infrastructure and natural obstacles — as most of Inter-American Development Bank (IDB) and even Brazilian governmental documents state — are the problem. As shown in Map 1, presented in April 2007 by Secretary of Planning and Strategic Investments of the Ministry of Planning, Budget, and Management, Ariel Pares, also coordi-nator of IIRSA in Brazil, South America is a discontinuous territory and IIRSA will create bridges to link these islands in order to facilitate the circulation of products to be exported. Note that some of these islands are regions of extremely rich biodiversity where most of the Indigenous and traditional populations of the continent live.

NEW FoRMS oF CooPERATIoN: FoR WhAT AND FoR WhoM? 57
Map 1: South America: A Discontinuous Territory
IIRSA is coordinated by the twelve governments of South America and three financial institutions: IDB, CAF, and the Plata Basin Development Fund (Fonplata). It is made up of a portfolio of 507 infrastructure projects, clustered in 47 project groups, with an estimated budget of US$69 billion. Additionally, the governments established a list of priority projects to be implemented in the short-term (Implementation Agenda based on Consensus 2005–2010). The “Agenda” is composed of 31 projects and represents an estimated investment of US$7 billion (IIRSA 2008).
This initiative divides the continent into ten territorial hubs — so-called Integration and Development Hubs — where the infrastructure expansion programs will be implemented to facilitate the transport of raw materials from South America to the international markets (see Map 2). According to official IIRSA data, these are “territories involving natural spaces, human settlements, production areas, and current trade flow” (IIRSA 2008). Some of these territories have the potential of developing trade flows once the natural barriers — biodiversity — are overcome and replaced by mega infrastructure projects.
1
2
3
4
5
Amazon Forest
Which results in five “islands”:1. Caribbean
Platform2. Andean Costal
Strip3. Atlantic Platform4. Amazon
Enclosure5. South Amazon
Enclosure
Central-AmericanIsthmus
Amazon River
Wetlands
In IIRSA, the aim is to identify “bridges” that can link the “islands.”
Cordillera of the Andes
Source: Ministry of Planning

CANADIAN DEvELoPMENT REPoRT 2009 — FINANCING DEvELoPMENT IN TIMES oF GLoBAL CRISIS58
IIRSA is, in fact, a further structural reform based on the need of extracting natural resources and the creation of a physical base for transnational corporations to expand their activities and control strategic natural resources such as energy, water, and biodiversity (Carvalho 2004). The only deterrent to capital circulating even more freely and rapidly is the control over territories and natural resources (and harmonization and flexibilization of regulatory systems and legislation in the region — also an objective of IIRSA). The projected and imple-mented infrastructure projects cut across regions with the highest concentration of natural resources, not only the traditional ones such as minerals and hydrocarbons, but also biodi-versity resources. As such, the initiative fulfils the aspirations of corporations involved in the construction of projects as well as those that need this infrastructure to achieve free and faster circulation of capital and an increase in exports of soy and electro-intensive products such as aluminum and cellulose. The logic behind IIRSA does not reflect an approach capable of integrating the socio-environmental and economic dimensions of the appropriate development strategy for the region. These kinds of projects do not take into account the local infrastructure necessities or the strengthening of local markets; they aim at securing the free circulation of commodities and not people; they favour international markets and conse-quently companies with strong performance in them. These are not activities developed in favour of family farmers or other economy groups without access to international markets.
This is the model of development and integration that has been adopted as a priority by Brazil, as mentioned above. Furthermore, while governments like that of Venezuela (even though they plan to construct the south gas pipeline that will pass through the
Map 2: Integration and Development Hubs — IIRSA
Andean
Southern Andean
Amazon
Capricorn
Guaianese Shield
Mercosur – Chile
Parana-Paraguay Waterway
Peru–Brazil–Bolivia Central Interoceanic
Southern

NEW FoRMS oF CooPERATIoN: FoR WhAT AND FoR WhoM? 59
Amazon region), Bolivia, and Ecuador have criticized certain projects of the initiative or the involvement of IFIs, the model as such has not been questioned. As shown in the declarations on physical integration of the presidential summits, IIRSA has been adopted by UNASUR as the initiative of physical integration for the region (Comunidad Sudamericana de Naciones 2005 & 2006). According to the document on physical integration, the 12 presidents, during their first meeting in 2005, made commitments to search for funding for IIRSA that would take into account the financial reality of the countries and reserve the decision-making capacity and autonomy of the states (Comunidad Sudamericana de Naciones 2005). In the next meeting, there were already talks of the Bank of the South. Therefore, there are strong concerns that this will be the model of development financed by this Southern institution.
An example of this integration model is the Madeira River complex that involves the construction of two hydroelectric dams in Brazil — one on the Brazil/Bolivia frontier and one in Bolivia — along with transmission lines, waterways, and locks. Numerous social and environmental impacts have been identified (decrease of fish stocks, mercury accumulation, silting, expulsion of Indigenous populations from their territories, and so on) as well as irregularities in the environmental impact studies and doubts about the economic viability of the project (Novoa 2007). IIRSA’s largest project in terms of size, cost, and impacts and a major project of the current Brazilian government, is going ahead despite protests in both Brazil and Bolivia.
What is BNDES?The Brazilian National Bank of Economic and Social Development is a state bank created in 1952 with the objective of driving economic and social development in Brazil. Since its creation, it has been an important tool of public policy used to implement the main govern-mental programs: infrastructure construction, industrialization, and privatization, for example. As can be seen in Graph 1, this public policy tool is growing.
Graph 1: BNDES: Evolution of Disbursements
15
2320
2428
31
39
0
5
10
15
20
25
30
35
40
45
2001 2002 2003 2004 2005 2006 2007
US$
Billi
on
Year
Source: BNDES.

CANADIAN DEvELoPMENT REPoRT 2009 — FINANCING DEvELoPMENT IN TIMES oF GLoBAL CRISIS60
Although the bank is growing, only 3 per cent of its capacity currently goes to social development projects. Most of the funding goes to the most developed regions of Brazil (Southeast 61.22 per cent; South 19.06 per cent; Centre-west 7.13 per cent; North 3.17 per cent; Northeast 9.42 per cent) and mainly to large companies (78.34 per cent). Industry, infrastructure, and agribusiness represented 93 per cent of total credits (BNDES 2007).
Generally, BNDES does not prioritize socio-environmental criteria and lacks transparency and participation mechanisms. Apart from a short list of the largest 200 projects funded in 2007, published at the beginning of 2008 as a result of civil society pressure, it is not possible to know what other projects are funded and where, which companies are involved, the number of jobs generated, or the socio-environmental impacts of the projects. All this despite the fact that over 30 per cent of the funds come from the Brazilian Workers Support Fund (BNDES 2007). So, Brazil has its own sovereign financing mechanism but this is no guarantee of transparency, civil society participation in decision-making processes, or a different development paradigm.
As mentioned already, BNDES has incorporated into its mission the strategic objective of acting as a financial institution of South American integration and becoming an instrument of external policies. It does this by funding the export of Brazilian goods and services and Brazilian investments abroad. To understand this context better, it is enough to analyse the evolution of the disbursements of BNDES for export projects. Between 1998 and 2006, BNDES disbursed US$2.5 billion in operations related to South American integration. Its portfolio of projects for this integration is worth US$5.15 billion and includes 37 big projects of the IIRSA initiative (BNDES 2007). With a special department for South America and a new office in Montevideo, Uruguay, this bank is becoming one of the main funders of physical regional integration.
According to Graph 2, between 2004 and 2006, there was a steep increase of disbursements from BNDES-Exim (the export department of the institution), as a result of the liberation of funds related to the initiation of IIRSA projects, such as the Hydroelectric Plant San Francisco in Ecuador. Argentina appears to be the main destination of resources, followed by Ecuador and Venezuela (BNDES 2007).
Graph 2: Annual Disbursement of BNDES Export Credits (US$ million)
373 388
1,185
2,065 2,100 2,0832,603
3,948 4,0073,861
5,8626,377
0
1,000
2,000
3,000
4,000
5,000
6,000
7,000
1994 1995 1996 1997 1998 1999 2000 2001 2002 2003 2004 2005 2006
Source: BNDES.

NEW FoRMS oF CooPERATIoN: FoR WhAT AND FoR WhoM? 61
Therefore, it becomes evident that the strategic “sub-imperialist” option of the Brazilian Government is to transform BNDES into a regional financing agency, guaranteeing the export of Brazilian capitalism and influence in the region. BNDES — a public bank — has become the main agent of Brazilian foreign policy. So why should Brazil need another bank to fund “integration” if BNDES is already playing that role and better, only benefiting Brazilian exports and services in the name of integration and South-South cooperation?
Brazil’s Reasons for Participating in the Bank of the South initiativeWhen the negotiations regarding the Bank of the South began, Brazil realized it could not stay out of this initiative, both for geopolitical and commercial reasons. At the same time though, Brazil could not disconnect itself from the IFIs or the national political and financial elites. Therefore, when Brazil entered the negotiations, it was to change the course of the proposal. Brazil aimed at strengthening Mercosur and not ALBA, defending the involvement of only those South American countries where its “leadership” would be more concrete. In terms of structure, Brazil rejected the notion of equal power independent of financial contri-bution. Brazil also disagreed with the use of international reserves as the source of capital for the bank, given that this permits financing without the guarantees and conditions that the capital markets provide. To the IFIs, the Brazilian Government promised that the bank would not replace them but would rather work in partnership. To the national elites, the government promised an increase in exports (Strautman 2007, 12).
The evolution of Brazilian exports to South America is a good example of how this “integration” can be important and profitable for the Brazilian elite. Currently, trade with the countries of the region represents 20 per cent of total Brazilian exports, which equals that with the EU and surpasses trade with the US. Graph 3 shows that Venezuela is Brazil’s second biggest trading partner in the region, a fact that “calms down” the worries of the Brazilian elites. In addition to that, as seen in Graph 4, Brazil has a trade surplus with all South American countries except Bolivia due to natural gas imports (MDCI 2007).
Graph 3: Growth of Brazilian Exports to Members of the Bank of the South from Jan. 2000 to Sept. 2007 (US$)
0
2,000,000,000
4,000,000,000
6,000,000,000
8,000,000,000
10,000,000,000
12,000,000,000
14,000,000,000
2000 2001 2002 2003 2004 2005 2006 2007-Sept.
Argentina
Venezuela
Paraguay
Uruguay
Bolivia
Ecuador
Source: Ministry of Development, Trade, and Industry.

CANADIAN DEvELoPMENT REPoRT 2009 — FINANCING DEvELoPMENT IN TIMES oF GLoBAL CRISIS62
However, the presence of Brazil in the negotiations has created difficulties in terms of building consensus between the governments involved. Consequently, the bank’s statute, which defines its structure, intentions, and function, has not yet been elaborated. As the data regarding BNDES demonstrates, Brazil can only gain from paralyzing the negotiations.
Meanwhile, on January 26, 2008, the presidents of Venezuela (Hugo Chavez), Bolivia (Evo Morales), Nicaragua (Daniel Ortega), and the Cuban vice-president (Carlos Lage) signed the Constitutive Act of the “Bank of ALBA” with an initial capital of US$1 billion. ALBA is the Bolivarian Alternative for the People of Our America, an international cooperation organization based upon social, political, and economic integration between the countries of Latin America and the Caribbean. The Bank of ALBA aims to promote projects of economic integration and infrastructure development as well as progress in social, educational, cultural, and health programs in the member nations. It also aims to eliminate the economic weaknesses of these countries and eradicate economic asymmetries resulting from the process of financial globalization. The bank was funded based on a democratic decision-making process, where each country has one vote independent of its financial contribution, which will also depend on each country’s capabilities (ALBA 2008).
Although not involving the participation of the Brazilian government to impose its conditions in terms of unequal structures and model of development to be financed, there are also other concerns in relation to the Bank of ALBA. As with the Bank of the South, the lack of transparency and diverse and qualified participation of civil society organizations and social movements are issues yet to be overcome. Furthermore, concerns are also related to the priority that will be given to a model of development based on the investment on mega infrastructure projects — following the logic behind IIRSA — energy in general and oil in particular (Bendaña 2008). If this is the case, it will not represent a rupture from the neo-liberal capitalist
0
2,000,000,000
4,000,000,000
6,000,000,000
8,000,000,000
10,000,000,000
12,000,000,000
14,000,000,000Exports
Imports
Argentina Bolivia Ecuador Paraguay Uruguay Venezuela
Source: Ministry of Development, Trade, and Industry.
Graph 4: Brazilian Exports and Imports with Members of the Bank of the South in 2006 (US$)

NEW FoRMS oF CooPERATIoN: FoR WhAT AND FoR WhoM? 63
system based on market expansion, extraction, and consumption of limited natural resources and, as such, can only lead to more environmental and social destruction. This is especially the case at a time when the world is facing one of the most serious ecological disasters: climate change.
The Government of Ecuador however, continues to defend the creation of the Bank of the South in addition to other fundamental changes to the financial architecture of the region. In the seminar “Euro: Global Implications and Relevance for Latin America,” held in March 2008 in Brazil, the Ecuadorian Minister of Economic Coordination, Pedro Paez, affirmed that the Ecuadorian proposal for the region has three axes: the creation of a new regional finan-cial structure with proportional responsibilities and equal decision-making powers amongst the countries; the creation of a regional central bank that will coordinate the monetary policies of the countries involved; and a unique reserve fund for the countries of the Southern Cone (Gazeta Mercantil, 2008). The coordination between such initiatives could possibly decrease the need for such high levels of international reserves if serving as a clearing-house. The use of resources deposited into these institutions, some of which are currently frozen in the international reserves of the member country, could be transformed into a kind of insurance to which countries turn in case of economic crisis. The rest of the reserves not deposited into such regional financial institutions could then be invested in the productive sphere of the economies in the region. The possibility of monetary integration that could lead to the use of a common currency for intraregional trade, or the use of local currencies for such exchanges, would reduce the dependency on the dollar and perhaps increase trade surpluses. This could be an incentive for countries such as Brazil, Venezuela, and Argentina to increase their trade in the region, benefitting all those involved. At least at first, intraregional trade with a local currency would help maintain the surpluses in the region and stimulate the substitutions of imports from countries outside South America. Investment in research and development from a development bank such as the Bank of the South would then create new opportunities since products currently produced outside the region could be bought in South America. Nevertheless, as mentioned before, negotiations are a lot more conservative then what was expected by Ecuador. Only time — and political pressure — will tell if Ecuador can manage to fulfil its demands.
A New Financial Architecture: Opportunities and Limits for the FutureThe general aim of a new financial system for the region should be to limit the transfer of resources from the South to the North, change the power structures, and overcome asym-metries. In this sense, the IFIs should continue to be the focus of repudiation by the South as long as they search for new roles to continue exploiting peoples and the environment in favour of a small group of corporate interests. Their capacity to resuscitate should not be underestimated. The IMF approved a reform in its quota and voting system that guarantees greater financial contributions from developing countries, helping it to overcome its fiscal deficit and allowing it to declare improvements in the decision-making process. In practice, however, the so-called reform increases the voting power of developing countries — 15 per cent of members — by only 1.6 per cent (O Globo 2008). It also aims at having greater control over countries that devalue their currencies, and over sovereign investment funds created

CANADIAN DEvELoPMENT REPoRT 2009 — FINANCING DEvELoPMENT IN TIMES oF GLoBAL CRISIS64
by governments with accumulated reserves, such as China, Saudi Arabia, and Venezuela, as well as providing technical assistance on issues of regional and global importance, such as the current food and climate crises. Similarly, the World Bank implements changes to strengthen its role in global governance. It now plans to reinvent itself as the world leader in combating and adapting to climate change by increasing technical assistance mainly related to flexibilization of environmental and other policies — especially in countries where its finan-cial resources are not as central as before; increasing its direct funding to local governments; and continuing to fund fossil fuel projects.
As such, official and civil society audits of debts and the IFIs — in financial, social, historic, and ecological terms — should be supported. These audits should be used as instruments to document the illegitimacy of debts and of the institutions themselves, repudiate the pay-ment of debts, demand reparations and restitutions, denounce the model of financing for development promoted by the IFIs, and sanction them for their responsibilities.
The Bank of the South, the Bank of ALBA, and other initiatives being discussed in Latin America in terms of a new financial architecture, can effectively represent a unique opportu-nity for the region in terms of reaffirming sovereignty, financial autonomy, and strengthening of the regional integration process. It is also an opportunity to affect the IFIs, which are currently facing legitimacy issues. However, in order to guarantee financial autonomy in the region without reproducing the past and current model of the IFIs, the change in power structures also needs to be in relation to the peoples. In this sense, the capitalist corporations of the North should not simply be replaced by those of the South. First, there needs to be a radical transformation in national development strategies. Regional integration should be placed in practice primarily through complementary national policies. Such policies should be directed towards the elimination of asymmetries and socio-environ-mental, economic and political exclusion, to the regulation of the economy, and through the recovery of the state’s role as the guardian and promoter of socio-economic and environ-mental well-being. In other words, the state should organize the economy in such a way as to regulate the social, political, economic, and environmental health of the country, guaran-teeing necessary public services and protection of the population. In the current ecological crisis, socio-environmental justice has to be the priority of every public policy. In regional terms, this can only take place through the honest resolution of conflicts and the establish-ment of equality regarding participation and decision-making processes in existing and proposed integration spaces. Furthermore, it is necessary to break away from the perverse logic of debt accumulation — be it North-South or South-South — which damages profoundly the sovereignty and self-determination of the people.
But these are not the only challenges. The proposal for a Bank of the South, presented by Venezuela and Argentina, reflects the contradictions of the Venezuelan government, which has been a fierce critic of the IFIs and their policies. This from the government that declared that the Bank of the South would not reproduce hegemonic models and that the decisions would be based on consensus. Argentina — even with its criticisms towards the IFIs and the neo-liberal model — has not yet managed to implement the transformations that society demands in order to break away from the current and past models. Consequently, the Argentinean proposal for the Bank of the South is not a big surprise. Brazil wants to lead the

NEW FoRMS oF CooPERATIoN: FoR WhAT AND FoR WhoM? 65
process and guarantee that the bank will not be antagonistic to BNDES, which, considering the development model promoted by the Brazilian government and its institutions, repre-sents a proposal contrary to the one presented by Ecuador. Bolivia expresses concerns about the possibility of a progressive reduction of credit for countries with weaker economies and supports the creation of disbursement criteria in accordance with the reality of each country. In general, the Bolivian government prefers to strengthen the Bank of ALBA, where it can have more political influence. The creation of the Bank of ALBA also raises many questions. Is this President Chavez’s plan B, since the Bank of the South seems to be so strongly influ-enced by the Brazilian government, which at the same time invests in the expansion and strengthening of BNDES? What will be the relationship between these two different financial institutions governed by countries of the South? How will they relate to the IFIs? Will it be a relationship of dependency, subordination, and partnership, or will they create an alternative and transformative financial system that will seek to expel from the South not only the IFIs but also their policies? It is difficult to answer such questions when most of the decisions have been taken and are still being taken behind closed doors. Civil society needs to be critically engaged in these constructions.
Finally, apart from struggling against the IFIs and guaranteeing participation and social control over Southern initiatives, civil society organizations and social movements also need to reflect on the construction of processes capable of overcoming the capitalist neo-liberal paradigm. In this sense, perhaps a bank financing development would not even be neces-sary. At least not one based on loans that generate profits, an assumption that is at the heart of the capitalist system. It would have to be a process — not necessarily an institution — that could truly be based on solidarity, complementarity, and justice for all. This should be at the heart of any proposal coming from the South; it should represent the struggle in favour of the peoples’ rights and the salvation of the planet that can no longer wait.
Fabrina Furtado is currently Executive Secretary of Jubilee South, a network of debt campaigns and social movements in over 50 countries of the Global South. Previously, she was the Executive Secretary of the Brazil Network on Multilateral Financial Institutions, where she wrote on issues related to the role of multilateral financial institutions in defining public policy and the impact on people, the environment and other institutions that finance development such as the Brazilian Bank for Economic and Social Development and the Bank of the South. Fabrina has a degree in Economics and International Relations from the University of Reading, England and a Masters in International Political Economy from the University of Warwick, England. Her research focused on the policies of the World Bank and the IMF and their impacts in Latin America.

CANADIAN DEvELoPMENT REPoRT 2009 — FINANCING DEvELoPMENT IN TIMES oF GLoBAL CRISIS66
ReferencesALBA. (2008, January 26). Acta Fundacional del Banco del Alba: Documentos de la VI Cumbre, www.alternativabolivariana.org/modules.php?name=News&file=article&sid=2668#3 accessed Feb. 2008.
Alimonda, Héctor. (2007). El Banco del Sur en perspectiva ambiental. Alai-amlatina.
Ávila, Rodrigo. (2008, February 22). Acúmulo de Reservas Cambiais = Farra dos Especuladores e Explosão da Dívida Interna. Jubileu Sul Brasil, www.divida-auditoriacidada.org.br/artigos/ artigo.2008-02-29.8019634295/document_view accessed Feb. 22, 2008.
BC. Reservas Internacionais. (2008, March) Banco Central do Brasil, Brasília, www4.bcb.gov.br/?RP20080331 accessed March 31, 2008.
Bassegio, Luiz. (2007, May 4). ALBA, Alternativa para Nossa América. Brasil de Fato, www.brasildefato.com.br/v01/agencia/analise/ alba-alternativa-para-a-nossa-america accessed April 5, 2008.
BBC. (2006, November 9). Uruguai anuncia pagamento antecipado de dívida com FMI. BBC Brasil, www.bbc.co.uk/portuguese/ noticias/story/2006/11/061109_uruguaifmi.shtml accessed October 10, 2008.
Bendaña, Alejandro. (2008, February 6). Alternative Financing for Development: From Development Assistance to Development Solidarity: the Role of Venezuela and ALBA. http://alejandrobendana.blogspot.com/2008/02/ alternative-financing-for-development.html accessed March 4, 2008.
BNDES. (2007, June). El Apoyo de Brasil a los Proyectos en Sudamérica. IIRSA, www.iirsa.org/BancoMedios/Documentos%20PDF/ fir_montevideo07_bndes.pdf accessed September 3, 2007.
BNDES. (2007). Estatisticas Operacionais do Sistema BNDES. BNDES, Rio de Janeiro, www.bndes.gov.br/estatisticas/ apresentacao.asp accessed May 2007.
BNDES. (2008). Estatisticas Operacionais do Sistema BNDES. BNDES, Rio de Janeiro, www.bndes.gov.br/estatisticas/ apresentacao.asp accessed February 2008.
BNDES (n.d.) Fundo de Amparo ao Trabalhador — FAT. BNDES, Rio de Janeiro. http://www.bndes.gov.br/empresa/fundos/fat/ default.asp accessed April 2008.
CAF. (2007). Paises accionistas. Operaciones Por Pais, Caracas, www.caf.com/view/index.asp?ms=11 accessed May 2007.
Camara dos Deputados. (2007). Audiência Pública sobre a Cria-ção do Banco do Sul. Brasília. http://www.banco-sur.blogspot.com>accessed April 2008.
Carrion, Maria da Conceição & Paim, Elisangela. (2006, February. IIRSA: Desvendando os Interesses. Publicações, IIRSA. <www.rbrasil.org.br/file/795.pdf> accessed January 2008.
Carvalho, Guilherme. (2004). A Integração Sul-americana e o Brasil:o protagonismo brasileiro na implementação da IIRSA. Final Dissertation presented in the course on Development in Amazo-nian Areas, Federal University of Para, Belém Pará.
Carvalho, Jiane. (2008, March 19) Declaraciones de Pedro Paez en su recente viaje a Sao Paulo Equador defende o Banco do Sul. Gazeta Mercantil.
Chowla, Peter. (2008, April 8) IMF Makes Only Marginal Changes in Its Governance Reform, London. Received by email on April 8, 2008. http://www.twnside.org.sg/title2/finance/ twninfofinance20080402.htm.
Comunidad Sudamericana de Naciones. (2005, September 30). Declaración sobre Integración en el Área de Infraestructura. Comu-nidad Andina, www.comunidadandina.org/documentos/dec_int/casa_2005_2.htm accessed April 2007.
Comunidad Sudamericana de Naciones. (2006, December 9). Integración Física Sudamericana. Comunidad Andina, www.comunidadandina.org/documentos/ dec_int/dec_cochabamba_fisica.htm accessed April 2008.
Diário do Nordeste. (2008, April 25). Brasil vai colocar US$2 bilhões no Banco do Sul. Agência estado, http://diariodonordeste.globo.com/ noticia.asp?codigo=217767&modulo=968 accessed April 2008.
Ecuador. (2007, May). Banco del Sur: Declaracion de Quito. Cadtm, www.cadtm.org/article.php3?id_article=2630 accessed May 20, 2007.
Ecuador. (2007, April 30). Documento para Discusión: Nueva Arquitectura Financeira Regional Propuesta Ecuador. Quito.
Ecuador. (2007, July). Decree creating the official audit, Quito. www.divida-auditoriacidada.org.br/ accessed October 2007.
Folha Online. (2005, December). Argentina segue o Brasil e decide quitar sua dívida com FMI. Folha Online Dinheiro, www1.folha.uol.com.br/folha/dinheiro/ult91u103461.shtml accessed December 15, 2005.
Gazeta Mercantil (2008, March 19) Equador defende o Banco do Sul. (this is a newspaper)
Hurley, Gail. (2007, May). Ecuador in the spotlight as government seeks to renegotiate debt on its terms. Eurodad, www.eurodad.org/ whatsnew/articles.aspx?id=1144 accessed May 20, 2007.
IDB. (n.d.). Portal de Proyectos Venezuela. Portal de Proyectos BID. www.iadb.org/projects/index.cfm?language=Portuguese accessed September 5, 2007.
IDB. (2007). Relatório Anual 2006. Relatórios BID, Washington, www.iadb.org/exr/ar2006/financial_summary.cfm?language=PO accessed January 2008.
IMF. (2008, April 9). Report of the Managing Director to the International Monetary and Financial Committee on a New In-come and Expenditure Framework for the International Monetary Fund. Documents IMFC Meeting, www.imf.org/external/np/pp/eng/2008/040908b.pdf accessed April 2008.
Mantega, Guido. (2005, November 23). Integração da Infra-estrutura da América do Sul. Apresentação durante a Primeira Rodada de Con-sultas para Construção da Visão Estratégica Sul-Americana no Brasil.
MDIC (2007). Comercio Exterior. http://www.desenvolvimento.gov.br/ sitio/interna/index.php?area=5 accessed January 2008
MF (2007, October). Declaración de Rio de Janeiro. Rio. Brasília, 2007. www.fazenda.gov.br/portugues/releases/2007/outubro/r081007b.pdf accessed October 2007.
Morales, Evo. (2008, April 21). Los 10 mandamientos de Evo Mo-rales para salvar al planeta. www.jubileosuramericas.org/ item-info.shtml?x=86145 accessed April 2008.
MPOG. (2007). Fluxo Financeiro Banco Mundial e BID. SEAIN, Brasília, www.planejamento.gov.br/arquivos_down/seain/Fiscal.pdf accessed May 31, 2007.
Novoa, Luis Fernando. (2007). Usinas do Madeira, Interesses Mascarados. Artigos Rede Brasil. www.rbrasil.org.br/content,0,0,1935,0,0.html accessed January 2008.

NEW FoRMS oF CooPERATIoN: FoR WhAT AND FoR WhoM? 67
O Estado de São Paulo. (2007, November 11). Brasil e Argentina planejam ‘desdolarização’ para 2008. MRE Seleção Diária de Notí-cias Nacionais. www.mre.gov.br/portugues/noticiario/nacional/selecao_detalhe3.asp?ID_RESENHA=393296 accessed May 2008.
O Globo Online (2008, March 28). Brasil terá maior participação no FMI. http://oglobo.globo.com/economia/mat/2008/03/28/brasil_tera_maior_participacao_no_fmi-426592541.asp.
Strautman, Gabriel. (2007). O Banco do Sul desde a perspec-tiva Brasileira. Presentation during International Symposium “Construindo uma nova arquitetura financeira internacional para a integração sul-americana e a cooperação sul-sul,” Nov. 17–19th 2007, Caracas, Venezuela. www.cadtm.org/IMG/pdf/ Texto_Ponencia_Gabriel_Strautman_1_.pdf accessed April 2008.
Toussaint, Eric. (2007). Sobre las circunstancias que afectan a la creación del Banco del Sur. CADTM, Liége, Belgica, www.cadtm.org/article.php3?id_article=2657 accessed May 26, 2007.
UOL. (2005, December 15). Rato comemora decisão argentina de quitar sua dívida com FMI. UOL Economia, http://noticias.uol.com.br/ ultnot/economia/2005/12/15/ult35u44823.jhtm accessed January 2006.
UOL. (2006, January 10). Brasil paga dívida com FMI mas mantém política econômica austera. UOL Economia, http://noticias.uol.com.br/ economia/ultnot/efe/2006/01/10/ult1767u58456.jhtm accessed January 2006.
UOL. (2007, April 30). Chavez anuncia que Venezuela sairá do Banco Mundial e do FMI. UOL Economia, http://noticias.uol.com.br/ ultnot/economia/2007/04/30/ult1767u91931.jhtm accessed April 30, 2007.
Venezuela. (2007, December 9). Firma del Acta Constitutiva del Banco del Sur. Banco del Sur, Buenos Aires, http://archivos.minci.gob.ve/doc/09dic2007_firma_del_acta_con.doc accessed December 15, 2007.
World Bank. (2007). Annual Report 2006. World Bank Reports, Washington, http://treasury.worldbank.org/web/ AnnualReport2006.pdf accessed January 2008.
World Bank. (n.d.) Projects and Operations Venezuela. World Bank Projects and Operations. http://web.worldbank.org/external/projects/ main?query=Venezuela&menuPK=51526214&theSitePK=40941&pagePK=218616&piPK=217470 accessed September 2007.
Endnotes 1 North/South here is not a geographical definition, it is political.
It relates to a group of countries that has been historically dom-inated — either through colonization or economic and political imperialism — by another group of countries which has kept them tied in a vicious circle of dependence and underdevelop-ment. The Global South involves countries that have unjustly had their natural resources and labour over-exploited to benefit the development of the Global North. The countries col-lectively called Global South have common characteristics, such as economies highly dependent on the production of primary goods that are exported to the North. The North in turn has guaranteed market access for their value-added products. The South is characterized by high levels of poverty and inequality, traditional rural structures and communities, and abundant natural resources. This work does also recognize the existence of political and financial elites in Southern countries and injustices faced by some populations of the North, although in many cases there is a direct relation between the two.
2 Civil society here is defined as the active and organized formations and associations in the cultural sphere of society, which would include, for example, non-governmental organizations (NGOs), academia, social movements, and church groups. Civil society is distinct from but not necessarily in opposition to the formal apparatus of governance in the political and economic spheres.

CANADIAN DEvELoPMENT REPoRT 2009 — FINANCING DEvELoPMENT IN TIMES oF GLoBAL CRISIS68

REoRIENTING DEvELoPMENT FINANCE ThRouGh ENhANCED DoMESTIC RESouRCE MoBILIzATIoN IN DEvELoPING CouNTRIES 69
FouRChapter
Reorienting Development Finance Through Enhanced Domestic Resource Mobilization in Developing Countries
Roy Culpeper and Aniket Bhushan

CANADIAN DEvELoPMENT REPoRT 2009 — FINANCING DEvELoPMENT IN TIMES oF GLoBAL CRISIS70

REoRIENTING DEvELoPMENT FINANCE ThRouGh ENhANCED DoMESTIC RESouRCE MoBILIzATIoN IN DEvELoPING CouNTRIES 71
Reorienting Development Finance Through Enhanced Domestic Resource Mobilization in Developing Countries Roy Culpeper and Aniket Bhushan
IntroductionThis chapter explores the scope for enhanced domestic savings as a key part of a more dynamic growth, investment, and poverty-reduction strategy. It contrasts the advantages of such a strategy of greater self-reliance with those based more on drawing on external savings through, for example, foreign aid, or foreign direct investment.
Poverty reduction requires sustained economic growth, equitably distributed so that the poor benefit significantly. The higher and more sustained the level of economic growth, the more rapidly will poverty diminish. Sustained growth, in turn, requires high levels of invest-ment — in infrastructure, social services, and production that creates jobs and raises incomes.
The key role played in the development process by domestic savings as opposed to foreign capital is supported by historical evidence. The recent World Bank report of the Commission on Growth and Development (2008), which examined the experience of 13 high-growth economies since 1950,1 concludes that, “there is no case of a high investment path not backed up by high domestic savings.” It also asserts that, “In principle, countries could rely more on foreign capital to finance their investment needs. But capital inflows over the past several decades have a mixed record… foreign savings are an imperfect substitute for domestic saving, including public saving, to finance the investment a booming economy requires.”
Yet it is not intuitively obvious that developing countries should rely more on domestic than foreign resources. In the case of the poorest countries, it is easy to assume that entrenched and widespread poverty severely constrains the ability to mobilize their own savings for investment and growth. If they can barely meet their current consumption needs, does it not follow that enhanced savings, or “domestic resource mobilization,” would increase the hardships of those already desperately poor? In this chapter, we examine ways that very poor countries can dramatically enhance their domestic resource mobilization in ways that do not hurt the poor.
Enhanced domestic resource mobilization is appealing on a number of levels. First, it can provide an “exit” from aid dependence for poor countries that have relied too long and too extensively on aid. Second, for related reasons, it can reduce the degree of policy conditionality that comes with heavy aid dependence, and give developing countries more domestic

CANADIAN DEvELoPMENT REPoRT 2009 — FINANCING DEvELoPMENT IN TIMES oF GLoBAL CRISIS72
ownership, policy space, and autonomy. Third, concerning greater public-sector resource mobilization through taxation, it can be a building block toward strengthening governance and democratic accountability.
Defining “Domestic” vs. “External” Resource MobilizationOur first task in making the case for Domestic Resource Mobilization (DRM) is to distinguish domestic from external resources. A good entry point is the UN’s Report of the International Consensus on Financing for Development (2002) or, as it is commonly known, the Monterrey Consensus (MC) report.
The Monterrey Consensus emphasized DRM as the first among six leading actions on Financing for Development (FfD) called for by world leaders back in 2002. The other five actions all revolve around the mobilization of “external” resources. These include: mobiliza-tion of Foreign Direct Investment (FDI) and other private financial flows (e.g., debt, equity, and short-term funds); harnessing international trade as an engine of development (i.e., export promotion and development); scaling up international technical and financial coop-eration (i.e., big push in Official Development Assistance [ODA]); external debt relief; and addressing systemic issues (e.g., increasing Least Developed Country [LDC] participation in decision making in international organizations).
Box 1: Domestic and External Resource Mobilization
Domestic Resource Mobilization includes:
External Resource Mobilization includes:
Mobilizing domestic savings (public and private sector)
Sustaining high levels of investment (public and private sector)
Increasing the capacity of domestic markets, or establishing domestic markets where they don’t exist or are too thin2
Increasing public sector revenue and diversifying the revenue base
Increasing human capacity (employment generation and labour market policies)
Mobilizing FDI
Other Private Capital Flows (including portfolio equity, bond, and treasury)
Export Promotion
Scaling up ODA
External Debt Relief
Systemic Reforms
Box 1 (Continues) i

REoRIENTING DEvELoPMENT FINANCE ThRouGh ENhANCED DoMESTIC RESouRCE MoBILIzATIoN IN DEvELoPING CouNTRIES 73
A full accounting for “domestic resources” would include human capital, social capital, and natural and financial resources accruing within national boundaries. Mobilization of these resources in the broadest sense is called DRM. For the purposes of our discussion, however, we are restricting the definition of domestic resources to mean “fiscal and financial resources accruing within the domestic economy” in order to draw the contrast with external resource mobilization more sharply.
DRM originates from three sources: household savings, local businesses (via retained earnings), and governments or the public sector (via taxation and other revenue generation, i.e., the “fiscal” component of DRM). As a process, DRM evolves when households save and invest either in themselves, in small-enterprises (such as family farms), or in the domestic corporate sector through local financial markets; when local businesses plough back part of their profits and earnings into themselves (or invest in other businesses); and when governments invest in social and physical infrastructure that either directly or indirectly benefits households and the local private sector.
A key actor in this process is the financial sector — banks, credit unions, and other deposit- taking and lending institutions. The primary function of the financial sector is called “intermediation”. Simply put, intermediation comprises the transformation of a large number of short-term and often small-scale deposits (and other savings) into a relatively smaller number of large and long-term investments.3
Domestic Resource Mobilization involves: A public policy framework comprising:
Sound macroeconomic policies to sustain high rates of economic growth, full employment, poverty eradication, price stability, and sustainable fiscal and external balances
Effective, efficient, and equitable tax systems
Investments in basic economic and social infrastructure
Active labour market policies to increase employment and improve working conditions
Financial deepening and the orderly development of capital markets via:
Development of institutions: microfinance and credit; development banks and development finance institutions; commercial financial institutions; public-private partnerships; pension schemes; capital markets, and so on.
Development of appropriate financial sector legal and regulatory framework such that the local private sector is encouraged to use the services of and participate in the domestic financial sector in an equitable and sustainable manner that promotes household access to financial services and institutions such as cooperatives, small savings, and rotating credit organizations, with the aim of building trust in financial institutions.
Capacity building, human resource development, public financial education, better debt management, and overall an improved “informational climate”.
i Box 1

CANADIAN DEvELoPMENT REPoRT 2009 — FINANCING DEvELoPMENT IN TIMES oF GLoBAL CRISIS74
Financial sector intermediation enables the three principal domestic agents to invest in each other and in third parties, hence the efficiency and effectiveness of the domestic financial sector in the DRM process.4 As far as the role of the financial sector in reducing poverty and inequality is concerned, a key factor is the extent to which all sections of society have access to the products and services offered by the formal financial sector. Put another way, access to the financial system is a key determinant of DRM performance.
In the poorest regions of the world — such as Sub-Saharan Africa (SSA), where the rate is only 20 per cent of households — access to the formal financial sector is very low (Honohan and Beck 2007). Not surprisingly, DRM levels in SSA are lower than other parts of the devel-oping world. It is precisely in these regions that DRM must now take centre stage as the focus of development finance strategy. In the end, there are no external substitutes for DRM. Moreover there are key weaknesses and trade-offs involved in external resource mobilization that are not found in DRM. In the short- to medium-term, it must be emphasized, a number of countries find themselves in a position where such DRM processes cannot take root without donor assistance. Thus, strategies are required both at the country level and at the donor-recipient level.
The rest of this chapter proceeds as follows: In the next section, we provide a snapshot of the world of development finance, the kinds of external flows that go to different developing regions, and how these are utilized. We compare developing regions along basic DRM indicators. Three stylized findings emerge. First, echoing the findings of the Commission on Growth and Development, it is apparent that the bulk of resources for development in the more successful developing regions are mobilized domestically (see Box 2). Second, the net flow of financial resources over the past decade or so has taken a perverse turn whereby capital flows upstream from poor to rich countries. Third, external resources may be insuf-ficient to meet the developmental needs of the poorest countries. These findings help contextualize and strengthen the case for focusing on DRM in the poorest countries. We outline the explicit case for and identify some of the key issues in enhancing DRM in the poorest parts of SSA. Throughout the discussion, examples from The North-South Institute’s ongoing project on DRM in Sub-Saharan Africa will provide further illumination.5

REoRIENTING DEvELoPMENT FINANCE ThRouGh ENhANCED DoMESTIC RESouRCE MoBILIzATIoN IN DEvELoPING CouNTRIES 75
Box 2: Highly Correlated Savings and Investment Trends and their Relationship with Growth If the three graphs below look uncannily similar, it is because savings, investment, and growth levels are intimately related. Highly correlated savings and investment trends imply that domestically mobilized resources constitute the bulk of resources that most countries mobilize for investment.
In each graph, East Asia is steaming ahead of the rest of the developing regions. The divergence across regions is most pro-nounced in the savings trend. In the 1960s, East Asia, Latin America, and Sub-Saharan Africa were at roughly similar savings levels but with each passing decade, savings either stagnated or slumped (in the 1970s in Africa and 1980s in Latin America). Presently East Asia saves (and consequently has investable domestic resources to the tune of) 35–40 per cent of GDP, while Africa and Latin America save less than 20 per cent of GDP. Interestingly, investment trends very closely follow the same pattern. It is easy to see a high correlation between savings and investment levels across developing regions. This suggests that domestically mobilized resources (savings) constitute the bulk of resources that most countries can mobilize for investment. Even in a world where capital is readily mobile across borders, produc-tive investment is largely financed domestically. This is more so the case in poor countries that face significant external borrowing constraints. The implication is that strengthening savings mobilization and financial sector interme-diation could have a positive impact on overall investment levels.
The second interesting finding from these basic trends is that growth, over the long term, tends to be correlated with savings and investment levels. This finding is
reinforced by the Commission on Growth and Development’s final report (2008). Countries that exhibit sustained high growth are also the ones that maintain high savings and investment levels.6 This is best seen by observing South Asia. When savings began to slump in Africa and Latin America, savings levels increased in South Asia and it surpassed Africa and Latin America in terms of overall growth rates. This suggests savings and invest-ment levels are key ingredients in the growth process.
Source: World Development Indicators database.
Saving Trends
Dom
estic
Sav
ings
(%GD
P)
1990s-present
1960s 1970s 1980s
454035302520151050
Growth Trends
1990s-present
1960s 1970s 1980s
Annu
al G
row
th R
ates
(s
impl
e de
cade
ave
rage
s)
9.008.007.006.005.004.003.002.001.000.00
Investment Trends
1990s-present
1960s 1970s 1980s
Capi
tal F
orm
atio
n (%
GDP)
40.0035.0030.0025.0020.0015.0010.005.000.00
East AsiaLatin America
South AsiaSub-Saharan Africa

CANADIAN DEvELoPMENT REPoRT 2009 — FINANCING DEvELoPMENT IN TIMES oF GLoBAL CRISIS76
The key finding of this chapter is that enhancing DRM is crucial for effective development. While there are substantial differences between domestic and external resources, of the most important difference is the way in which resources are used for development. Domestic resources are better placed to finance domestic priorities.The potential for enhancing DRM in the poorest countries is vast despite the obvious challenges and obstacles. Strategies on both the country level and the donor level to overcome these can make DRM the corner-stone of a development finance strategy for sustainable growth and poverty reduction that can meet Millennium Development Goals (MDGs) and other such targets.
Setting the SceneThe global economy is going through one of the worst crisis periods in recent memory (at least since the Asian Crisis of 1997–98). Every year, the United Nations Department of Economic and Social Affairs (UNDESA) publishes a report called World Economic Situation and Prospects. The following cautionary message is from the 2008 mid-term report:
The world economy is teetering on the brink of a severe global economic downturn. The deepening credit crisis in major developed market economies, triggered by the continuing housing slump, the declining value of the US dollar vis-à-vis other major currencies, persisting global imbalances, and soaring oil and non-oil commodity prices all pose considerable risks to economic growth in both developed and developing economies. Additionally, the unfolding food crisis, which is not only a grave humani-tarian issue, but also a serious threat to social and political stability in some developing economies, endangers the achievement of the Millennium Development Goals.
While the final word on the impact of the current set of crises on development finance remains to be written, it is clear that the international environment has become less condu-cive to external FfD. Periodic outbreaks of international financial instability illustrate the fact that financial crises may be expected at least once every decade. In such periods of insta-bility, and over the long term, relatively greater reliance on DRM can provide much greater ballast for the growth and stability of developing countries than was acknowledged at the time of the Monterrey Conference.
Development finance options need to be weighed relative to one another and against this backdrop. For the poorest regions, external resource mobilization has been the traditional strategy. Mobilizing financial resources through foreign direct and indirect portfolio invest-ment, through increased development assistance (scaling up ODA), through export promotion, and other similar channels have traditionally been viewed as more attractive compared to the “hard option” of enhancing DRM.
The advantages associated with external finance are well known. FDI can be an important conduit for technology and organizational best-practice transfer. In certain manufacturing sectors, FDI can spur small ancillary industries in the local economy, which in turn could boost employment and over time help create new comparative advantages. Portfolio flows can deepen capital markets, thereby lowering the cost of credit, increasing access to financial services, and widening the range of products available. Aid can close the savings-investment gap and spur investment in less commercially viable but more socially productive sectors

REoRIENTING DEvELoPMENT FINANCE ThRouGh ENhANCED DoMESTIC RESouRCE MoBILIzATIoN IN DEvELoPING CouNTRIES 77
such as health, education, and basic infrastructure, which are critical to the long-term success of any economy. Aid can also help build local capacity by transferring relevant know-how. A dedicated export promotion strategy can offer a number of the same benefits, with the additional advantage of earning the country valuable foreign exchange.
What “Kinds” of External Flows Go to Developing Regions and How Are They Used?Before making an explicit case for DRM, let us look at how developing regions fare in terms of mobilizing external financial resources. As Table 1 shows, over the long term and across major developing regions, FDI is a key source of external finance. In recent years there has been a notable shift in the geography of FDI with developing and less developed countries emerging as important FDI destinations, and new emerging economies (such as China, India, Brazil, South Africa, and Russia) as significant new sources of FDI to other developing countries.
However, these figures mask the extent to which all private capital flows (FDI, equity, and bonds) are concentrated in a handful of developing countries. While the figure is declining, the top 10 developing country recipients accounted for over 65 per cent of FDI receipts in 2005 (UNDESA 2007).7 Furthermore, FDI in Low-Income Countries (LICs) tends to be concentrated primarily in extractive sectors (UNCTAD 2007b).
Table 1: External Resource Mobilization External Resource Flows to Developing Regions*
Region
Type of External Resource
(US$ millions) 1980s 1990s 2000–2006East Asia FDI (net inflows) $3,688 $40,946 $69,952
Portfolio Equity $264 $1,797 $24,792
Portfolio Bond ... $5,072 $3,499
Net Export Earnings -$5,273 $12,150 $104,041
ODA $4,601 $8,628 $7,851
Latin America FDI (net inflows) $6,021 $37,815 $64,613
Portfolio Equity $78 $8,580 $6,173
Portfolio Bond ... $13,204 $2,687
Net Export Earnings $11,853 -$20,035 $20,596
ODA $3,246 $5,702 $5,999
South Asia FDI (net inflows) $226 $2,234 $9,007
Portfolio Equity $6 $1,937 $7,722
Portfolio Bond ... $879 $950
Net Export Earnings -$12,412 -$16,384 -$27,174
ODA $4,992 $5,645 $6,868
Sub-Saharan Africa FDI (net inflows) $1,301 $4,481 $13,370
Portfolio Equity -$115 $2,842 $5,482
Portfolio Bond ... $780 $1,156
Net Export Earnings -$1,988 -$3,573 -$8,750
ODA $10,196 $16,957 $24,265
Source: World Development Indicators database.* Note: “Net export” regional figures based on available country data for limited number of countries within region (unweighted averages).

CANADIAN DEvELoPMENT REPoRT 2009 — FINANCING DEvELoPMENT IN TIMES oF GLoBAL CRISIS78
When it comes to deriving benefits from external private flows (in particular FDI), the key questions are the absorptive capacity of the recipient country and the extent to which new investment creates “backward linkages” (across ancillary sectors) and positive spillovers (in terms of know-how, and best practices) within the domestic economy. This depends partly on which sectors attract FDI. FDI concentrated in extractive sectors is least productive in terms of fostering backward linkages and creating positive spillovers. Moreover, the employ-ment impact of FDI in extractive industries may not be desirable relative to the associated human and social displacement costs. When assessing development impact it is important to look at the “net impact” of private flows. In this sense, the key question is what happens to profits and retained earnings. If these are repatriated to the parent company and not reinvested locally, then even positive FDI inflows can amount to a net drain on the domestic economy. Practices such as “misinvoicing” and “transfer-pricing”, common to multinational corpora-tions, further complicate understanding the real net effect of FDI, beneficial or otherwise.
Yet another major issue is the DRM trade-off associated with attracting FDI. Countries with the least bargaining power vis-à-vis multinationals have been known to grant overly gen-erous incentives in the form of tax holidays and exemptions to attract FDI. Often this is done in a haphazard manner without due consideration of the long-term opportunity cost involved. This has led to widespread erosion of the potential tax base.
In Mozambique for instance, efforts to increase tax revenue were undercut by very large fiscal exemptions to FDI in megaprojects such as Mozal (aluminum sector) and Temane Gas (natural gas). Therefore, despite significant DRM potential, Mozambique’s high dependence on external resources continues. Similarly in Zambia — a country where DRM performance on the fiscal front has been impressive in recent years — until the government decided to renegotiate tax and royalty agreements with multinationals in light of the upswing in copper prices, the Zambian Revenue Authority was collecting only $300 million in revenues from the copper sector where exports were in the order of $3 billion annually (discussed below). This is because the surge in FDI came at a time when the country was courting investment with attractive exemptions.8
A similar story seems to be emerging in Tanzania’s mineral sector. A slightly different case is Burundi. In a non–resource-rich, though post-conflict country eager to mobilize investment for reconstruction and development, such as Burundi, tax exonerations led to a nearly 55 per cent loss in fiscal revenues in 2005 (UNCTAD 2008). In these situations it is necessary to assess external resource mobilization in light of potential DRM trade-offs.
It is clear from Table 1 that export earnings are another important source of external flows (and foreign exchange) to developing regions. However, in “net” terms (minus cost of imports) they are not only volatile but also negative in the poorest developing regions (possibly reflecting high import costs associated with essentials such as energy, food, and other commodities). For many developing countries “exporting their way out of poverty” is an attractive strategy, more so because foreign currency earnings play an important role in maintaining macroeconomic balance by providing financial resources to cover imports. However, as is also evident from the table, among developing regions only East Asia has

REoRIENTING DEvELoPMENT FINANCE ThRouGh ENhANCED DoMESTIC RESouRCE MoBILIzATIoN IN DEvELoPING CouNTRIES 79
managed to profit substantially from export-led growth. Here it is worth recalling that the East Asian “developmental state” played a key role in forging a strong profit-based “export investment nexus” in the region. Governments created a pro-investment macroeconomic environment with tolerance towards some degree of inflationary pressure in order to boost investor confidence. When restrictive measures became necessary, consumption, rather than investment, was first sacrificed. Strong incentives were introduced to boost profits above free-market levels through a variety of fiscal instruments, whilst trade, financial, and competi-tion policies were used to create “rents” that boosted corporate profits and therefore the potential investible resources available to corporations (UNCTAD 2007a).
High profits of East Asian firms increased not only the incentives to invest, but also their capacity to finance new investments, and higher investment raised profits by enhancing rates of capital utilization and productivity growth. An integral part of this strategy was dynamic use of policy space by governments to develop a range of special measures and target specific sectors via selective protection, interest rate controls, managed competition, capacity expansion, and acquisition of technology (UNCTAD 2007a). The alliance between government and big business was central to the efficacy of this policy mix.
Arguably, most developing and poor countries today lack the policy space required to promote export-led growth in the manner of East Asia. Liberalization and the evolution of international trade policy has eroded policy space needed to forge the export-investment nexus required to address poverty and growth on a continent-wide scale in the poorest regions of SSA. The key to mobilization of export earnings as an engine of development finance is the manner in which these earnings are reinvested. In the case where earnings are not reinvested in the domestic economy (instead remitted offshore) the net impact could be negative.
In Sub-Saharan Africa, aid has been the dominant source of external financial flows for over three decades. While aid flows to the region have been rising steadily, they are still well short of — at most half — the level of 0.7 per cent of donors’ GNI that has been an international target for almost four decades. At the individual donor-recipient level, the story is further complicated by the fact that actual disbursed funds rarely meet stated commitments and policy-makers in poor countries waste precious time and resources courting rich donors.
Just below the veneer of these figures, another important change is taking place. While government-to-government flows to LICs have grown only in line with GDP, private inflows have quadrupled relative to LIC GDP since the 1980s (Dorsey 2008). This rise is taking place at a time when promised large increases in official aid to poor countries have failed to materialize. In fact, if debt forgiveness is excluded, official lending turned negative in 2006 (Dorsey 2008). Given the importance of aid flows in overall external flows to the poorest regions of Sub-Saharan Africa, it is worth questioning how aid is used in the region.

CANADIAN DEvELoPMENT REPoRT 2009 — FINANCING DEvELoPMENT IN TIMES oF GLoBAL CRISIS80
Chart 1: How ODA is Used in Sub-Saharan Africa
Source: IMF 2007.
The IMF’s Evaluation Office indicates that, since 1999, nearly three-quarters of aid to poor countries in Sub-Saharan Africa is not being spent; rather, at the IMF’s request, it is used to pay off debt and accumulate reserves instead of necessary economic and social investment to eradicate overwhelming poverty (see Chart 1).9
The shift in balance from public to private external resources will have important implications in terms of policy space and the efficacy of public policy in LICs. Policy-makers face new challenges as the shift from official to private financing implies a less direct role for govern-ments in determining the uses of external financing. These flows could provide a fillip to the domestic private sector in LICs, but they come with a greater risk of reversal and may become the main source of external vulnerability. It should be reiterated that much of these flows are in the form of FDI to the extractive sector in the poorest regions such as SSA. These are driven largely by the developmental needs of large emerging economies, such as South Africa, China, and other parts of East Asia and India. In sum, these flows can be highly volatile and sharp reversals could happen in tandem with a substantial correction in commodity prices. This would jeopardize the recent strong macroeconomic performance of the SSA region.
SSA policy-makers can mitigate such volatility by emphasizing the development and integration of the domestic financial sector and enhanced DRM through wider participation in local financial markets and improved revenue collection from a wider tax base. In some cases, this could entail renegotiating longstanding contracts.
Zambia’s recent experience is instructive in this regard. In light of the upswing in copper prices, the Zambian government decided to renegotiate tax and royalty agreements with multinationals. A dedicated fund was created to manage the windfall commodity-based revenues and a system of checks and balances on expenditures was introduced, led by parlia-mentary oversight. These changes, along with recent reforms to tax policy and administration, have helped Zambia reduce overall dependence on external resources from about 30 per cent to 24 per cent of the national budget (projected) over the past three years, indicating that enhancing DRM can help wean countries away from external dependence. The share of income taxes has increased even as Value added tax (VAT) collection stagnated and trade taxes declined (Gayi 2008). Zambian authorities credit enhanced DRM for the reduction in external dependence, as a greater reliance on domestic resources led to better program implementation.10
Debt Reduction 37%
Net Fiscal Expansion 27%
Reserve Accumulation 36%

REoRIENTING DEvELoPMENT FINANCE ThRouGh ENhANCED DoMESTIC RESouRCE MoBILIzATIoN IN DEvELoPING CouNTRIES 81
Enhanced DRM can provide the necessary balance to counteract changes in the external finance environment and, at the same time, counteract dependence on volatile11 and unpredictable aid flows, which have posed serious challenges to macroeconomic stability in a number of aid-dependent poor countries.
Table 2: Aid LevelsAid Dependence Indicators (Per cent, 2005)
Aid/GNI Aid/Gross Capital Formation Burkina Faso 12.9 61.8
Burundi 12.8 378.2
DR Congo 26.9 181.2
Eritrea 36.9 182.2
Ethiopia 17.4 66.0
Gambia 12.2 50.4
Ghana 12.4 36.0
Guinea-Bissau 39.5 180.0
Liberia 54.1 270.9
Madagascar 18.7 82.4
Malawi 28.4 191.1
Mali 13.6 57.5
Mozambique 20.7 95.2
Niger 15.2 81.8
Rwanda 27.1 119.5
Sierra Leone 29.6 191.6
Tanzania 12.5 65.8
Uganda 14.0 64.8
Zambia 13.9 50.3
Sub-Saharan Africa 5.5 27.3
Source: World Bank, World Development Indicators. (2005), database accessed June 2008
Countries that are so heavily dependent on aid (Table 2) are at considerable risk of losing their policy autonomy. Much aid is tied, both to sources of procurement (typically to sup-pliers in the donor country) or to uses (to specific projects or policy conditionality). By definition, such restrictions can drastically reduce the policy space and domestic ownership of the recipient country. Although many aid donors now espouse untying aid and recognize the critical importance for aid effectiveness of domestic ownership, practice has lagged behind the rhetoric (e.g., in the Paris Declaration). More aid is now being allocated to budget support and program-based approaches. In theory, such shifts in donor allocations may accord greater domestic ownership to recipients, but they also engender other prob-lems not associated with more tied, project-based aid. For example, they may infringe expenditure ceilings or lead to macroeconomic repercussions such as Dutch disease.12 For this reason, there is a real danger that macroeconomic policy conditionality is likely to be reinforced by the trend toward budget support.

CANADIAN DEvELoPMENT REPoRT 2009 — FINANCING DEvELoPMENT IN TIMES oF GLoBAL CRISIS82
A political economy dimension is also very important. A greater proportion of budgetary resources financed by donors discourages mobilization of public revenues through domestic taxation. This weakens the linkages and accountability between poor country governments and their taxpayers. If taxation plays a central role in building states and shaping their ties to society, chronic aid dependence weakens the social contract based on bargaining around tax, and institution building based on the revenue imperative (see Bräutigam, Fjelstad, and Moore 2008).
In the above discussion, we have shown how developing regions have fared in terms of external resource mobilization and the associated challenges. Before we move on to the issues around enhancing DRM, let us look at how developing regions fare on some basic DRM indicators.
Basic DRM Indicators: Developing Regions Relative to One AnotherTo recall, our definition of DRM relates to fiscal and financial resources accruing within the domestic economy. Enhancing DRM would involve one or more of the following:
Increasing savings mobilization: this could take the form of increased private-corporate and household savings mobilization and/or increased public savings.13
Increased investment levels, more efficient intermediation of savings into investment, and greater productivity of investment.
Increased and improved public sector (non-debt domestic) revenue mobilization (ideally through direct taxes) and more efficient public investment and recurrent expenditures.
The most basic indicators of DRM are domestic savings and investment levels, public sector revenue levels, and indicators of financial sector performance. Let us look at these in turn, beginning with savings, investment, and growth trends across developing regions over a long period.
As we saw in Box 2 earlier in this chapter, savings and investment are highly correlated despite increased capital mobility, suggesting that domestic resources constitute the bulk of resources mobilized for investment. Furthermore, growth trends across developing regions are broadly in line with savings and investment trends, and higher savings/investment regions are able to maintain higher growth rates.
Table 3: Savings and Investment Trends 1960s 1970s 1980s 1990s–present
Savings Invest. Savings Invest. Savings Invest. Savings Invest. East Asia & Pacific 21.73 19.65 28.63 28.68 32.87 33.44 38.24 35.74
Latin America & Caribbean 20.00 20.16 22.20 23.27 22.95 20.87 19.84 19.72
South Asia 12.95 15.28 14.81 17.13 17.45 21.31 21.81 23.88
Sub-Saharan Africa 18.60 18.35 22.71 24.23 19.86 20.25 17.12 18.29
High income: OECD 24.05 23.91 24.65 24.98 22.14 22.77 21.07 21.14
Source: World Bank, World Development Indicators database, accessed June 2008

REoRIENTING DEvELoPMENT FINANCE ThRouGh ENhANCED DoMESTIC RESouRCE MoBILIzATIoN IN DEvELoPING CouNTRIES 83
In order to achieve the first MDG of reducing by half the proportion of people living in poverty, it is estimated that SSA would need to maintain annual GDP growth rates of about 7–8 per cent (NEPAD 2001). It is further clear from the above table that the present invest-ment levels in SSA are far behind the 34 per cent estimated by UNECA to be required in order to meet the first MDG target. The region has two options if investment levels are to be boosted (to nearly double the present rate). The first is increasing external resource mobiliza-tion, while the second is boosting domestic savings and intermediation. As we have already seen, there are significant challenges associated with further enhancing external flows such as ODA, FDI, or other private capital. A significant amount of energy and political capital has already been employed in enhancing external finance. SSA policy-makers are now increasingly aware of the importance of enhanced DRM to support these efforts (UNECA 2007, 2008).
The domestic financial sector plays a key role in the DRM process. A basic assessment of financial sector performance can be made using the indicators summarized in Table 4. SSA lags far behind other developing regions in terms of financial sector performance. Perhaps most alarming is the very wide lending and deposit spread, which points to either a lack of efficiency or simply a lack of competition in the domestic financial sector.14
These factors have combined to create a peculiar picture in SSA: the majority of the population lacks access to credit, the private sector is credit constrained, and the financial system is highly uncompetitive and inefficient; yet, banks are flush with capital and one of the least competitive banking sectors in the world is also the most profitable (see Table 5). One implication of this scenario is that if key financial sector bottlenecks can be eased over the medium to short term, a significant amount of resources could be freed up for investment in the region.
Addressing issues such as the lack of credit information, lack of risk monitoring agencies, public registries, and other supportive financial market institutions as part of a wider DRM strategy could have large payoffs in the region. Here the state in partnership with the private sector has a crucial role to play in the establishment of financial infrastructure.
Table 4: Basic Indicators of Financial Sector Performance (2002)
RegionDomestic Credit to Private Sector
(% of GDP)Interest Rate Spread
(lending rate minus deposit rate)East Asia 105.4 6.3
Latin America 25.8 9.6
South Asia 31.1 6.9
Sub-Saharan Africa (excl. South Africa) 19.0 13.0
High Income 144.3 4.5
Source: World Bank, World Development Indicators database, accessed June 2008
Table 5: Bank Profits ComparisonRegion/Bank Return on Assets (%) Return on Equity (%)Africa 2.1 20.1
Sub-sample of Foreign Banks in Africa 4.7 43.2
Rest of World (ROW) 0.6 8.5
Foreign Banks in ROW 0.9 8.6
Source: Honohan and Beck 2007.

CANADIAN DEvELoPMENT REPoRT 2009 — FINANCING DEvELoPMENT IN TIMES oF GLoBAL CRISIS84
The third component of enhanced DRM is public sector revenue. On this front, there is a vast difference between low- and high-income countries. Government revenue as a share of GDP in LICs is about half that of high-income countries and nearly a third of the EU average. There are vast differences in the composition of government revenues in developed and developing countries. Trade taxes account for a much larger share of total tax revenue in developing countries (24.9 per cent) as compared to developed countries (0.5 per cent), and the share for Africa is highest (33 per cent) (Fitzgerald 2008). Trade liberalization and tariff reduction, therefore, have a much greater impact on the revenue structure of poor countries. The trade-off between trade liberalization and DRM is further complicated by the fact that poor countries find it harder to recover tariff revenues than their middle income and rich counterparts.15
Box 3: Role of the State in Financial Sector Integration and DevelopmentIn Cameroon, the state could play a much larger role in making credit available to small farmers and small and medium enterprises (SMEs) through the use of informal/semi-formal institutions such as tontines and cooperatives (which are quite significant). This is important because most of the population lacks access to the formal financial system. The informal sector in Cameroon is estimated at 46.7 per cent of GDP. As in many other SSA countries, Cameroon’s financial sector is highly oligopolistic and dominated by a handful of banks, most of which are based overseas (in France). Six major foreign banks account for 67 per cent of the commercial banking system or 57 per cent of all financial assets in the country. The majority of the population is unable to save or invest in the formal banking system, as the minimum deposit rates required by banks are far greater than the incomes of most people. It is not surprising that intermediation rates (i.e., transformation of savings into investment) are very low in Cameroon, even as compared to neighbouring and other countries at a similar income level.
Years of Structural Adjustment Policies (SAPs, still ongoing) have stifled both policy creativity and economic growth.
It is time for the state to reassess its role in the development and integration of the financial sector.
What can the state do?
Enact policies to spur competition in the financial sector. This can be done by incentivizing small (but significant) players such as microcredit, small revolving savings and credit organiza-tions, and cooperatives to evolve into the formal sector, while preserving their existing client base (see note 16 for a discussion of the Equity Bank in Kenya, for example).
Remove ceilings on lending and deposit rates to open the sector to further competition.
Explore the re-establishment of development finance institutions (DFIs) with the specific mandate of integrating fragmented financial markets. (DFIs were closed as per IMF conditionality.) The new approach could take the form of a public-private partnership where the private sector assumes part of the management responsibilities and, along with equitable and sustainable develop-ment, commercial as well as transparency and accountability criteria would be met.
Create a strategy to widen the tax-base by exploring the potential for new taxes currently being ignored, such as property taxes.
Source: Khan 2008.

REoRIENTING DEvELoPMENT FINANCE ThRouGh ENhANCED DoMESTIC RESouRCE MoBILIzATIoN IN DEvELoPING CouNTRIES 85
Table 6: Government Revenue LevelsCentral Government Revenue (% of GDP) (2004)
High-Income Countries 26.0
EU 35.7
Low-Income Countries 13.0
Sub-Saharan Africa (excl. South Africa and Nigeria, 2000–2002) 19.1
Source: World Bank, World Development Indicators, 2005; African Development Indicators, 2005.
Table 7: Select Sub-Saharan and High-Income Countries Government Revenue (% of GDP)
Country Total Revenue Tax Revenue Non-tax RevenueBenin (2001) 16.2 14.2 2.0
Burkina Faso (2001) 11.1 10.5 0.6
Burundi (2002) 20.3 18.0 2.3
Cameroon (2000/2001) 20.6 12.6 7.8a
Chad (2002) 7.9 7.1 0.8
Ethiopia (1999/2000) 18.3 12.5 5.8
Gambia (2001) 15.1 13.0 2.1
Ghana (2000) 17.7 16.2 1.5
Guinea (2001) 11.5 7.5 4.0b
Kenya (2001/2002) 21.6 17.6 4.0
Madagascar (2001) 10.0 9.6 0.4
Malawi (2001/2002) 17.2 15.3 1.9
Mali (2002) 16.6 13.8 2.8
Mozambique (2002) 14.2 12.5 1.7
Senegal (2000) 18.0 17.3 0.7
Sierra Leone (2002) 14.2 14.0 0.2
Sudan (2003) 16.8 6.1 10.7a
Tanzania (2001/2002) 12.1 10.9 1.2
Uganda (2003/2004) 12.6 11.7 0.9
Zambia (2003) 18.1 17.4 0.5
Select High Income (2006)
Canada 19.9
France 43.3
Germany 28.6
Great Britain 36.6
Italy 37.7
Netherlands 41.1
Norway 49.3
Notes: a = mainly oil revenue; b = mainly mining revenue.Source: adapted from McKinley (2005); Data for “select high income” from World Bank, World Development Indicators, accessed June 2008.

CANADIAN DEvELoPMENT REPoRT 2009 — FINANCING DEvELoPMENT IN TIMES oF GLoBAL CRISIS86
The social contract between state and citizen on which taxation is based is absent in many Sub-Saharan African countries. This can be due to both the perception and reality of misuse of funds and low fiscal coverage. The majority of the population in many countries is essen-tially too expensive to tax (as they live in remote areas where the economic cost involved in reaching them often outweighs the benefits). Addressing the issue of fiscal coverage is a key part of DRM strategy. While this applies across the region, the point really comes home in a physically large country such as Mozambique. Mozambique is divided into 128 districts; however, only 32 of these are designated fiscal areas where the Mozambique Revenue Authority collects taxes. Increasing fiscal revenue therefore implies investing in increasing fiscal coverage.
Beyond geography, fiscal coverage also refers to the share of the potential tax base within the informal sector, where economic activity is largely untaxed. In Tanzania where the tax/GDP ratio is very low at about 11 per cent (see Table 7), it is estimated that a third to more than half of economic activity takes place outside the formal economy and thus not counted in the formal figures. Fiscal coverage in this sense entails broadening the tax base by incentiv-izing participation in the formal sector, for example through the extension of basic physical infrastructure and institutional support for private sector development. The potential payoff is clearly large. More coherent efforts are needed to develop a holistic approach that fits with national developmental goals and takes into account the trade-offs we have talked about (such as between DRM and investment in extractive sectors, which is growing in Tanzania).
Where citizens are willing to pay taxes, the perception (and the undeniable reality) of misuse of funds by the state creates an atmosphere of distrust. In this sense, fiscal and financial resource mobilization is but one side of the coin. The other side is the utilization of mobilized resources and the citizen’s perception of the state-society social contract. Building this social contract is a long-term process. However, if recent trends are any indication, these are not insurmountable obstacles. Countries as diverse as Ethiopia, Ghana, Mali, Rwanda, and Uganda, for example, increased their revenue/GDP ratios by four percentage points or more during 1994–2004, largely by increasing their reliance on multiple sources of revenue, streamlining and strengthening collection authorities, and establishing checks and balances on public expenditures (McKinley 2007, Gayi 2008).
Three Stylized FactsThree stylized facts further contextualize the importance of focusing on DRM in the poorest countries. There is considerable debate surrounding each of these arguments, nevertheless they are helpful in terms of situating ground realities.
Domestically mobilized resources constitute the bulk of resources that most countries mobilize for investment. Domestic savings, either directly or indirectly, influence overall investment rates, including attracting foreign investment. A lesson for the poorest countries (including most of SSA) from the East Asian experience is that higher savings and investment rates are critical for development and poverty reduction. If DRM constitutes the bulk of savings for investment, strategies to enhance DRM are critical for development and poverty reduction.
Poor countries are net creditors to rich countries. Over the past decade or so, a paradoxical flow of financial resources from poor to rich countries has taken place, which adds to the pattern of global imbalances. The building up of official reserves has been a key mechanism

REoRIENTING DEvELoPMENT FINANCE ThRouGh ENhANCED DoMESTIC RESouRCE MoBILIzATIoN IN DEvELoPING CouNTRIES 87
through which these financial net transfers have occurred. This mechanism poses opportunity costs for developing countries. As reserve build-up becomes excessive, consequent monetary effects (e.g., “sterilization”) become increasingly harmful to the domestic economy.
Capital flight is an important channel for this perverse South-North/poor-rich financial transfer. It has been estimated that the cumulative stock of flight capital for SSA from 1970 to 1996 was approximately $285 billion. Considering that the combined external debt of the region was $178 billion as of 1996, this makes SSA a “net creditor” vis-à-vis the rest of the world (Boyce and Ndikumana 2001). A recent update of this study puts the accumulated stock of flight capital in SSA at $476 billion in 2004, representing more than two times the region’s external debt. In some countries, capital flight is estimated to be as much as four times their external debt (Ndikumana and Boyce 2007).
A large proportion of capital flight takes the form of illicit outflows captured by elites.16 On another level, capital flight — as a “portfolio choice” to hold assets abroad by private sector actors who might otherwise invest in their own countries — can be seen as an ulti-mate reflection of a country’s failure to mobilize and retain its domestic financial resources (UNCTAD 2007a). In this sense, a portfolio decision is responsive to macroeconomic and political stability, financial market depth, investment climate, and other factors affecting risk-adjusted returns.
DRM strategies aimed at improving the domestic informational and investment climate could affect the reversal of portfolio outflows. The very recent past (half-decade) is a good indication of the potential. In recent years, SSA growth has far exceeded global growth. There is considerable optimism about the region’s prospects.17 However, if substantial and coherent efforts are not made in order to harness the present upswing towards deeper structural transformation, today’s progress would be remembered as just another phase in another boom-bust cycle (African Development Bank 2007). Deeper structural transforma-tion involves enhancing DRM as the future engine of development finance in the region. The key difference between DRM-led structural transformation and the failed adjustment programs of the past is that the former would be wholly domestically owned and not tied to any external conditionality. The main incentive for policy-makers to develop such DRM strategies would be to counteract an increasingly unpredictable external financing climate and to build local capacity to integrate with the external economy on their own terms. The present upswing in SSA should be seen as an auspicious moment on which to capitalize while optimism surrounding the region is high.
External resources are insufficient to meet the investment needs of the poorest countries. There is consensus around the fact that poor countries face a significant resource gap in financing development. There is less agreement on the size of the gap and how best to close it,
Table 8: Poor Countries are “Net Creditors”Net Financial Transfers to Developing Countries (2006 estimates)
Region (US$ billions)East and South Asia -244.7
Latin America -123.1
Africa -95.3
Sub-Saharan Africa (excluding Nigeria and South Africa) -10.1
Source: UN/DESA (WESP, 2007)

CANADIAN DEvELoPMENT REPoRT 2009 — FINANCING DEvELoPMENT IN TIMES oF GLoBAL CRISIS88
such that equitable and sustainable economic growth and poverty reduction can take place. It is estimated that SSA requires sustained GDP growth of about 7 per cent to be on track to attain the first MDG (halving poverty). However, there is lack of consensus on the amount of ODA required to bridge the resource gap.
The difficulty in estimating the precise size of Africa’s resource gap stems from assumptions regarding infrastructure needs, the outcome of efforts to increase DRM, and the current state of absorptive capacity. Nevertheless, UNCTAD estimates SSA’s additional ODA requirement at $20 billion per annum by 2008–2010, increasing to about $25 billion per annum by 2015. Even with the steep rise in ODA in recent years and external debt relief, this figure is likely to be hard to achieve. This figure could be halved if DRM strategies are adopted and these bear fruit in the medium term (Gayi, 2008).
These three stylized facts highlight the importance and urgency of focusing on DRM in the poorest regions. The global economy at present is characterized by a perverse upstream transfer of financial resources from poor to rich countries. This implies that if a persuasive case can be made for enhanced domestic utilization and mobilization of financial resources, the early spark could come from the deployment of part of these reserves domestically, provided this is done in a careful manner. Second, poor countries should be cautioned against uncritically buying into the “development through globalization” mantra, which can be both persuasive and misleading. While globalization has indeed thrown up several new opportunities for developing countries, the extent to which globalization can actually be harnessed for development is mediated through domestic policies and supportive institu-tional (and physical) infrastructure. Finally, investment demand in the poorest regions might be so substantial that external resources are simply not enough to meet targets such as halving poverty. Increased DRM could make up for the shortfall in the post-ODA resource gap, if not help wean countries away from ODA completely in the long term.
The Case for Focusing on “Domestic” ResourcesIn large part, the case for focusing development finance strategy on enhancing DRM has already been made above. In this section, we bring out the argument more explicitly and outline policy recommendations that emerge from our analysis.
The Case for DRM Emerges from Weaknesses Associated with External FinancePlacing greater emphasis on DRM does not imply that external resources for development ought to be spurned, much less that autarky is the ultimate objective. However, there are a number of disadvantages associated with external resources that are not shared by domestic resources and this is often overlooked or downplayed in the policy discourse. For instance:
Promoting FDI often involves extending incentives in the form of tax exemptions. The DRM trade-off might be quite high and, in net terms, the recipient country may end up losing rather than gaining if profits and finished goods are repatriated overseas (most often the case in extractive sectors). Moreover, FDI will only go to sectors that are profitable to overseas investors. In the poorest countries, this leaves the majority of the domestic economy untouched. Coherent sector-based strategies are required if

REoRIENTING DEvELoPMENT FINANCE ThRouGh ENhANCED DoMESTIC RESouRCE MoBILIzATIoN IN DEvELoPING CouNTRIES 89
the investment needs of these unserved sectors are to be met. For instance, agriculture is the main employment-generating sector in poor countries and yet is ignored by both FDI and ODA (discussed below). Addressing the needs of the sector requires both increased public investment in basic infrastructure and improvement of the intermediation process so that access to credit is improved. A development finance strategy based on enhancing DRM would provide a more coherent and holistic approach than is practised at present in many developing countries.
LICs often face a situation of entirely “missing markets”. For instance, corporate bond markets or markets for mortgages and insurance might simply not exist or be too thin. Public- and private-sector DRM must create and populate these markets before external resources (e.g., foreign investors) can play any role.
There are key weaknesses associated with ODA and scaling up ODA. Aid is most often associated with intrusive conditionality that restricts policy autonomy. Aid tends to be pro-cyclical, exacerbating the impact of potential reversals. In several SSA countries, including Ethiopia, Mozambique, Tanzania, and Uganda, aid volatility at different times has been associated with macroeconomic instability and exchange rate vola-tility, which make improving the domestic climate very difficult. ODA has also been shown to be four times as volatile as domestic revenues. The relative predictability and stability of domestic sources makes them a more attractive financial resource compared to ODA. The challenge then is to increase domestic fiscal revenues in a pro-poor and sustainable manner.
The political economy dynamic must again be recalled. While the development discourse labours on about the importance of domestic ownership, evidence is accumulating that higher aid levels erode the quality of governance. Governments that depend largely on external resource mobilization through aid to finance their budgets are more inclined to satisfy donor priorities than respond to their domestic policy demands (where the two are inconsistent). Public policy becomes rooted in external considerations rather than domestic priorities, and the mobilized resources become ripe for elite capture.
There is another fundamental, if general, difference between domestic and foreign finance. While improvements in the former depreciate the real exchange rate, surges in the latter appreciate it. For poor countries, a relatively depreciated real exchange rate is very important if their goods and services are to be attractive in foreign mar-kets. Enhancing DRM, is more consistent with the goal of developing export sectors than a direct strategy that promotes foreign investment in sectors whose outputs are then exported, only to leave the economy with a net loss.
DRM is Crucial to Development EffectivenessA notable change is taking place in the development discourse, led by Southern perspectives on development finance. This change argues for the need to modify the effectiveness prin-ciple from “aid effectiveness” to “development effectiveness”. The underlying argument is that, for development to be effective, the process must be rooted in domestic priorities and owned domestically (see Riddell 2008).

CANADIAN DEvELoPMENT REPoRT 2009 — FINANCING DEvELoPMENT IN TIMES oF GLoBAL CRISIS90
The rationale of a greater focus on DRM springs from the quest for sustainable growth and poverty reduction, and the need to create “policy space” to accommodate genuine domestic ownership and country diversity. Greater DRM leading to higher proportions of investment financed through domestic savings, and a greater percentage of the government budget financed through taxation, can clearly reduce the degree of aid dependence. This, in turn, contributes towards widening policy space and enhancing genuine domestic ownership.
The key point is that there is a fundamental difference between domestic and external resources in terms of application. Domestically mobilized resources are more consistent with local ownership. The motivations for and the impact of external resources may differ signifi-cantly from domestic resources. It would be difficult, if not impossible, to meet development objectives principally through mobilization of external resources. Not only would the quan-tity fall considerably short, but also they would also not fit the needs of many sectors.
For instance, most low-income countries are agrarian; yet the resource needs of agriculture and the rural population are seldom high priorities for FDI or even aid agencies. Agricultural growth is more effective at reducing poverty than growth led by other sectors. For this reason, the World Bank’s World Development Report 2008 focused on “Agriculture for Development”. The report argues that improving agricultural productivity is crucial to poverty eradication and equitable development. The key is to make smallholder farming more productive and sustainable, and the first three steps the bank calls for in this regard are: increasing the quality and quantity of public investment and improving price incentives; making product markets work better; and improving access to financial services through dedicated rural finance and coverage for uninsured risks (World Bank 2008b). These priorities require sus-tained and predictable long-term investment for which resources (in the absence of FDI and ODA) would need to be mobilized domestically.
In principle, DRM is more consistent with local ownership, can increase policy space, and would facilitate investment in domestic priority sectors otherwise neglected by external flows. If these goals are realized through enhanced DRM, then the case can be made that DRM is more consistent with development effectiveness than external mobilization.
Inevitably, in an LIC context one faces the question: Where would these resources come from and how do we estimate the potential for DRM? There are no easy or direct answers, unfortunately. Of course, when income levels are as low as they are in parts of Sub-Saharan Africa, it is very hard to talk about mobilizing domestic savings or enhancing investment.
That said, even a brief look at the typical “resource leakages” found in developing countries indicates that the potential for DRM could be substantial. First, much of the economic activity in poor countries is not reported to authorities and is thus not counted in official figures. This activity takes place in the so-called “shadow economy” and researchers have come a long way in estimating the rate of this activity across developing regions (Schneider 2004). Second, income accruing on assets held overseas by nationals is again discounted from estimates of the domestic financial resource base. Third, corporate profits shifted abroad through transfer pricing also fly under the DRM radar. Finally, especially in the poorest countries, a large share of domestic revenue that is due to be paid into public coffers is simply not paid (i.e., tax avoidance). Cobham (2005) estimates the total of these leakages

REoRIENTING DEvELoPMENT FINANCE ThRouGh ENhANCED DoMESTIC RESouRCE MoBILIzATIoN IN DEvELoPING CouNTRIES 91
across developing regions at a staggering $385 billion each year. As the estimates presented in Table 9 indicate, if even a small proportion of the vast of amount activity in poor countries that takes place outside the formal economy can be brought into the formal sector, the potential fiscal payoff could be significant.
Issues in Enhancing DRMThree broad areas cover the main issues at stake in enhancing DRM in SSA. The first is Policy Space, Ownership, and the Political Economy of Resource Mobilization and Utilization. We have already elaborated on this by arguing that an emphasis on DRM is more consistent with local ownership and could increase policy space and help restore the political economy of policymaking in poor countries, which has been hijacked by donor-recipient rather than state-citizen priorities.
The second is Macroeconomic Stability and Policy Consistency. Macroeconomic policy covers both monetary (central bank) and fiscal policy (ministry of finance). Although greater domestic savings and investment must be generated by households, government, and businesses, the principal drivers of enhanced DRM are in the remit of governments, since they must define and implement policies and create or strengthen the institutions that are fundamental to a well-functioning financial sector. Macroeconomic policy is fundamental in establishing the overall savings and investment climate. Policies that fuel high levels of inflation (such as chronic fiscal deficits and monetary policies that lead to negative real interest rates) undermine the incentive to save and create uncertainty about the future in the minds of investors. On the other hand, stringent fiscal and monetary policies that are exces-sively targeted on low inflation rates can lead to high interest rates that inhibit investment in productive capacity and hence constrain growth. In SSA for instance, it has been argued that persistently high real interest rates have hampered long-term growth for the majority of low income countries (Weeks and McKinley 2007). Policy-makers will need to weigh the oppor-tunity cost of stringent inflation targeting against real indicators, such as poverty reduction, income growth, and employment generation.
Fiscal policy has a more direct impact on DRM. On the revenue side, low taxes constrain government revenues; high taxes constrain private savings (by reducing disposable income or retained earnings) and investment. There are also important administrative issues related to taxation. Taxes may not be collected by revenue authorities or may be evaded by tax-payers. Taxes collected may be vulnerable to corruption. The tax structure may be inequitable or regressive.
Table 9: Potential Tax Increase from Partial Formalization of the Shadow Economy (2002–2003)
RegionShadow Economy
(% GDP)Tax Revenue(US$ billions)
Potential Tax Increase from Partial Formalization (US$ billions)
East Asia 21.4 182.2 10.3
South Asia 28.5 71.3 7.4
Latin America 37.7 265.5 43.9
Sub-Saharan Africa 41.1 62.6 11.7
Source: Cobham 2005; “Shadow Economy” data from Schneider 2004.

CANADIAN DEvELoPMENT REPoRT 2009 — FINANCING DEvELoPMENT IN TIMES oF GLoBAL CRISIS92
On the expenditure side of fiscal policy, budgetary allocations to infrastructure or other public investment have a crucial impact on the productive sectors. Governments that restrain taxes in order to encourage private investment while maintaining fiscal balance may not have the scope to finance infrastructure, the inadequacy of which may discourage private investment.
The third broad issue area is Financial Sector Integration and Development. Financial markets in Sub-Saharan Africa are highly fragmented, with a large percentage of productive economic activity taking place in the informal and semi-formal sectors. Bridging the gap between the informal, semi-formal, and formal financial sectors is a key DRM priority in SSA. Tackling this issue requires regulatory changes in the financial sector to accommodate new actors. The regulatory mechanism should be used to encourage the emergence of new categories of indigenous financial sector actors and integrate already significant players, such as rotating savings and credit organizations, cooperatives, microcredit organizations, and rural finance. There is abundant evidence that these objectives are realistic and can be attained through creative use of technology (such as mobile and telephone banking) and regulatory incentives aimed at encouraging small local players to grow into formal financial sector actors.18 In the long run, these efforts will help rebuild the African citizen’s trust in the formal financial system and create a viable alternative to often predatory informal relationships.
The financial sector in SSA is clearly not yet serving DRM. The sector is characterized by key bottlenecks caused partly by the prevailing macroeconomic environment (high real interest rates and de facto inflation targeting as opposed to growth oriented polices) and partly by the oligopolistic nature of the financial sector.
A well-functioning financial system of banks, non-bank intermediaries, and bond and stock markets can only be created and regulated by governments, although in a market-based system most of the institutions themselves (e.g., banks) are likely to be in the private sector. SSA policy-makers need to reassess the role of the state in the development of a more inclusive financial system that supports DRM. There is a need to take a fresh look at the prospects for the development of new public-private and development finance institutions (DFIs) on the continent. The history of DFIs in SSA is not very edifying — in the 1980s and 1990s, many succumbed to corruption or mismanagement and were phased out as part of the economic reforms and SAPs. Nonetheless, publicly-owned development banks continue to play a role in many industrial and developing countries, so it is quite conceivable that if they are managed properly they could play a role in the poorest countries of SSA.
Immediate Steps to Support DRMIn Sub-Saharan Africa, DRM strategies are required on more than one level. The first level, as outlined above, is national policymaking and we have noted a number of steps SSA policy-makers can take to enhance DRM.
The second level on which DRM strategies are required is the donor-recipient level. What steps must donors take to support DRM immediately? Here are nine interrelated recommendations that could be taken up quite easily:

REoRIENTING DEvELoPMENT FINANCE ThRouGh ENhANCED DoMESTIC RESouRCE MoBILIzATIoN IN DEvELoPING CouNTRIES 93
1. Recognize DRM as a goal in its own right: For donors to play a more active and constructive role in facilitating DRM, they must first recognize it as an objective in its own right. Donors can conceptualize explicit support for DRM as part of an “exit strategy.” Aid was never meant to represent an unending subsidy or transfer of resources from rich to poor countries. Donors have hoped for, rather than explicitly planned, their exit strategies. Such exit strategies need not, and should not, be time-dated, but more explicitly linked to enhanced DRM by recipient countries. Given the growing “aid fatigue” and scepticism about the effectiveness of aid programs in donor countries, the recognition of the need to adopt exit strategies linked to greater autonomy by recipient countries would likely be welcomed by taxpayers in donor countries.
2. Instill the “do no harm principle”: The first principle in doing good is to do no harm. Donors need to take a more comprehensive approach to the impact of their assistance on DRM. This involves better monitoring of the potential macroeconomic effect of budget support, and ensuring that donor-led initiatives support DRM. Donors may undermine DRM through support for other policies; for example, trade liberalization, which undermines a key revenue source in the poorest countries. Supporting DRM entails taking a holistic view of the impact of aid and beginning by doing no harm.
3. Assess the trade-offs involved in budget support and/or program/project loans and grants: Budget support and program aid present new challenges that need more substantive assessment. To begin with, when donors underwrite a significant portion of a recipient country’s budget, the government may be considerably less willing to mobilize resources through domestic taxation. Furthermore, substantial budget support from aid donors could lead to macroeconomic repercussions including inflation and Dutch disease — reflected in an escalation of the value of the local currency, along with a corresponding erosion of trade competitiveness and export earnings. Moreover, attempts to counter such repercussions (through so-called “sterilization” measures) lead to other undesirable outcomes, such as higher interest rates and lower investment. Such considerations suggest that instead of emphasizing budget support and program aid, donors should work with developing country partners in mobilizing their own resources domestically, through more efficient tax and expenditure measures and through deepening local financial markets.
4. Draw up criteria to support country-led DRM strategies: Develop a set of key questions to ask when supporting country-led DRM efforts. Donors may have different strengths in supporting DRM efforts. In addition to assisting their partners in strengthening their tax and expenditure regimes, some may be able to help in the reconstitution of local development banks and financial institutions or assist in the development of public-private partnerships. Others may be in a position to build capacity in key areas such as macroeconomic monitoring, so that fiscal and mon-etary policies facilitate rather than inhibit DRM. Moreover, given the diverse ways in which they can support DRM, it is incumbent on donors to coordinate their efforts and a well thought out framework for supporting recipient country strategies could be a useful tool in this regard.

CANADIAN DEvELoPMENT REPoRT 2009 — FINANCING DEvELoPMENT IN TIMES oF GLoBAL CRISIS94
5. Build capacity in tax policy and administration, and financial sector monitoring, and support institutions in recipient countries: Donors have already played a significant capacity-building role in fiscal institutions across SSA (e.g., Revenue Authorities in Rwanda, Zambia, Tanzania, and Uganda). Efforts must be continued and need to move in the direction of capacity-building for financial sector support institutions, such as risk monitoring agencies, credit bureaus, and supporting local public-private partnerships where viable. Donors must also recognize the crucial role development finance institutions (DFIs) and development banks (DBs) play in financial sector capacity-building by offering finance plus services to the local private sector beyond simply extending credit. Structural reforms have led to the closure of DFIs and DBs across SSA. However, there are interesting examples of those that survived liberalization and have emerged as important (if smaller and more niche) players in SSA countries.19
6. Ensure trade and investment policies are consistent with DRM: Donors must recognize that their trade and investment policies towards developing countries need to be consistent with objectives attached to ODA policies. Often the former undercut the latter, as when donors push for reciprocal trade liberalization and incentives for FDI and portfolio investments (through investment promotion agreements). The EU-ACP (Africa, Caribbean, and Pacific) Economic Partnership Agreement (EPA) is a good example of these contradictions. Given the prominence of EU imports to Africa and the reliance of the majority of African countries on tariff revenues, tariff dismantlement would lead to significant revenue shortfalls and high adjustment costs associated with tax policy and administration reforms. These will undermine the developmental objectives of African countries unless appropriate measures are put in place to forestall macroeconomic imbalances. Donors engaged in SSA need to acknowledge that it is important for governments in the region to harness the present upswing in demand for their natural resources to bolster state capacity and build countercyclical reserves to safeguard against future downturns. Trade and investment promotion agreements that erode the tax base of developing countries are serious threats to DRM objectives.
7. Encourage and ease remittance transfer through formal channels from the overseas diaspora in donor countries: The diaspora is uniquely placed as a potential direct investment source, given that it has intimate knowledge of the particu-larities of the home country as well as experience overseas. A recent World Bank study estimates that SSA countries can potentially raise $1 to $3 billion by reducing the cost of international migrant remittances, $5 to $10 billion by issuing diaspora bonds, and $17 billion by securitizing future remittances and other future receivables. For instance, the European Commission has been successful in driving improved inter-national retail payment technologies and in ensuring lower consumer prices for intra-Europe payments in the context of the Euro. These ideas could be easily (and profitably) extended to remittance transfers to Africa.
8. Increase oversight of the activity of multinational banks originating in donor countries and operating in recipient countries, and share information: This could go a long way to securing against future capital flight and improving coordination between regulatory authorities.

REoRIENTING DEvELoPMENT FINANCE ThRouGh ENhANCED DoMESTIC RESouRCE MoBILIzATIoN IN DEvELoPING CouNTRIES 95
9. Assist in the identification, analysis, and repatriation of illicit flight capital: These efforts are already taking place under the auspices of international anti money-laundering policies, but need to be stepped up on bilateral terms between donors and SSA countries.
ConclusionMany developing countries, particularly the poorest, rely excessively on external resources whether in the form of private investment or aid to meet their development finance needs. No amount of foreign assistance or investment in its myriad forms can substitute for a coherent domestic resource mobilization process. Such a process urgently needs to be enhanced in the poorest countries so that over time they may be weaned away from dependence on aid and other unpredictable and volatile external flows.
In this chapter we have shown that enhancing domestic resource mobilization in the poorest countries is crucial for development effectiveness and poverty reduction. Enhancing domestic resource mobilization will reduce dependence on external sources and open up much needed policy space for developing country governments. Moreover, domestic savings are better placed to finance domestic investment priorities, but their importance is often underplayed in the development finance policy discourse.
The potential for enhancing both public and private sector savings, and improving the efficiency of the financial sector in Sub-Saharan Africa is vast. If this potential is to be real-ized, then the recent upswing in the fortunes of many African countries will need to be harnessed to bolster government revenue bases, increase private sector investment rates, and greatly expand access to credit and other basic financial sector services, particularly by the poor, from the present low base. Donors must explicitly recognize the importance of enhancing domestic resource mobilization in Africa and work to ensure that their aid and technical assistance is consistent with this priority. African policy-makers for their part need to acknowledge the fundamental role of the state in the development of an inclusive finan-cial system that supports savings mobilization and productive investment. Governments must also accept that they will be able to play this developmental role effectively once their own revenue bases are firmly rooted in domestic revenue sources (taxes).
Roy Culpeper was appointed President of The North-South Institute in 1995. Before joining the Institute, his work experience included positions in the Manitoba government’s Cabinet Planning Secretariat, the federal Department of Finance, the Department of External Affairs and International Trade and the World Bank in Washington. At the Institute, he has conducted research, and has published, on a broad range of issues relating to international finance. His current projects are on Southern Perspectives on the aid system, domestic resource mobilization and development, as well as on governance of international financial markets. Since his appointment as President, the Institute has annually published the Canadian Development Report, and has launched research in new areas such as corporate social responsibility and human security. Roy Culpeper received his PhD in Economics from the University of Toronto in 1975.
Aniket Bhushan is a Researcher at The North-South Institute. His past work has focused on trade liberalization and health policy, and includes “Liberalization, Health and Social Protection” (forthcoming in Globalization and Health: pathways, evidence, policy, Routledge, 2009). His present research work focuses on finance and development, with particular emphasis on resource mobilization in Sub-Saharan Africa, financial sector development in emerging economies and governance reform of the international financial system. His educational background is in commerce (B.Com, Mumbai University, India), political science (B.A. University of Windsor, Canada), political economy and international affairs (M.A. Carleton University, Canada).

CANADIAN DEvELoPMENT REPoRT 2009 — FINANCING DEvELoPMENT IN TIMES oF GLoBAL CRISIS96
ReferencesAfrican Development Bank. (2007). Investing in Africa’s Future: The ADB in the 21st Century Report of the High Level Panel.
Boyce, J. K., & Ndikumana, L. (2001). Is Africa a net creditor? New estimates of capital flight from highly indebted Sub-Saharan African countries, 1970 1996, Journal of Development Studies, 38(2), 27 56.
Bräutigam D, Fjelstad O and Moore M., (2008). Taxation and State Building in Developing Countries: Capacity and Consent, IDS (UK).
Bulir, Ales and Hamann, Javier (2005) Volatility of Development Aid: From the Frying Pan into the Fire? Washington, DC: International Monetary Fund.
Cobham, A. (2005). Tax evasion, tax avoidance and development finance. Oxford: Queen Elizabeth House (QEH Working Paper Series).
Bulir, Ales and Hamann, Javier (2005) Volatility of Development Aid: From the Frying Pan into the Fire? Washington, DC: International Monetary Fund.
Culpeper Roy and Bhushan Aniket (2008), Domestic Resource Mobilization: A Neglected Factor in Development Strategy, Back-ground Paper prepared for inception workshop on Domestic Resource Mobilization in Sub-Saharan African, held on May 27
and 28 in Entebbe, Uganda
Dorsey, T. (2008). A Capital Story. IMF, Finance & Development, June.
Fitzgerald, V. (2008, forthcoming). Tax Reform in a Globalized World. FONDAD.
Gayi, S. (2008). Mobilizing Domestic Financial Resources for Africa’s Development. ATDF Journal, 4 (4).
Honohan, P., & Beck, T. (2007). Making Finance Work for Africa, Washington: World Bank.
IMF. (2007). The IMF and Aid to Sub-Saharan Africa, Washington: IMF Evaluation Office.
Khan, Sunday. (2006). Official Flows, Export Volatility and Domestic Investment in Cameroon, The North-South Institute http://www.nsi-ins.ca/english/events/DAW/2_Khan.ppt
Khan, S. (2008). Country Assessment: Cameroon, “Domestic Resource Mobilization in Sub-Saharan Africa” Phase I of the col-laborative project of The North-South Institute, in partnership with African Development Bank (AfDB), AERC, Canadian International Development Agency (CIDA).
McKinley T (2005), Economic Alternatives for Sub-Saharan Africa: Poverty Traps, MDG based Strategies and Accelerated Capital Accu-mulation, Draft Paper for the G-24 Meeting, 15–16 September
McKinley, T. (2007). Raising Domestic Revenue for the MDGs: Why wait until 2015? One Pager, No. 29, International Poverty Centre, UNDP.
Ndikumana, L, & Boyce, J. K. (2007). New estimates of capital flight from sub-Saharan African countries: Linkages with External Borrowing and Policy Options, Paper prepared for the Senior Policy Seminar on “Capital Flight from Sub-Saharan Africa: Implications for Mac-roeconomic Management and Growth,” October 30–November 2, 2007, Pretoria, South Africa.
NEPAD Secretariat. (2001). The New Partnership for Africa’s Development (NEPAD), October 2001, Abuja-Nigeria.
Riddell, R. (2008). Does Aid Work? The North-South Institute (June 2008).
Schneider, F. (2004). The Size of the Shadow Economies of 145 Countries all over the World: First Results over the Period 1999 to 2003. Bonn, Germany: IZA.
The North South Institute, Does Aid Work? Can it Work better? Crucial questions on the road to Accra and Doha, Tuesday and Wednesday, June 17-18, 2008 Crowne Plaza Hotel, 101 Lyon St. Ottawa, Ontario. http://www.nsi-ins.ca/english/events/aid.asp
The North-South Institute, Domestic Resource Mobilization in Sub-Saharan Africa, A Collaborative Research Project in partnership with AfDB, CIDA and AERC UNCTAD. (2008). Enhancing the Role of Domestic Resources in Africa’s Development: A Policy Handbook (Draft version).
UNCTAD. (2007a). Reclaiming Policy Space: Domestic Resource Mobilization and Development States, UNCTAD/ALDC/AFRICA/2007/1, Economic Development in Africa.
UNCTAD. (2007b). Transnational Corporations, Extractive Industries and Development, World Investment Report.
UNDESA (2008), World Economic Situation and Prospects, United Nations New York 2008
UNDESA (2007), World Economic Situation and Prospects, United Nations New York 2007
UNDESA. (2008). World Economic Situation and Prospects.
UNDESA. (2007). World Economic Situation and Prospects.
UNECA. (2008). Africa and the Monterrey Consensus: Tracking Performance and Progress.
UNECA. (2007). Perspectives of African Policymakers on the Status of the Implementation of the Monterrey Consensus.
UN. (2002). Report of the International Consensus on Financing for Development, Monterrey Mexico, March 18–22.
Weeks, J. & McKinley, T. (2007). The Macroeconomic Implications of MDG-Based Strategies in Sub-Saharan Africa, International Poverty Center, UNDP.
World Bank. (2008a). Commission on Growth and Development.
World Bank (2008), Agriculture for Development, World Development Report 2008, Washington D.C.
Commission on Growth and Development (2008), The Growth Report: Strategies for Sustained Growth and Inclusive Development, published by World Bank, Washington D.C on behalf of the Commission
World Bank, World Development Indicators database, accessed June 2008.

REoRIENTING DEvELoPMENT FINANCE ThRouGh ENhANCED DoMESTIC RESouRCE MoBILIzATIoN IN DEvELoPING CouNTRIES 97
Endnotes 1 Botswana, Brazil, China, Hong Kong, Indonesia, Japan, Republic
of Korea, Malaysia, Malta, Oman, Singapore, Taiwan, and Thailand. These countries have all grown at a rate of 7 per cent or more annually for 25 years or longer.
2 While increasing the capacity of domestic markets and sustaining higher levels of investment aren’t peculiar to DRM, they are more critical to the success of a domestically driven strategy because domestic financial markets are the engine of DRM and sustained and visibly effective investment is crucial to encouraging future savings and incentivizing savings mobilization.
3 The financial system provides four other important functions: diversification of financial and non-financial risk (e.g., risks asso-ciated with non-market natural shocks); providing information on new opportunities and investments; exerting governance by closely monitoring performance (particularly of the private sector); and easing the overall exchange of goods and services.
4 In the sections to follow, we provide some basic quantitative indicators of financial sector performance efficiency, efficacy, and profitability across developing regions.
5 The North-South Institute has initiated a research project in collaboration with the African Development Bank, the African Economic Research Consortium and the Canadian International Development Agency titled “Domestic Resource Mobilization in Sub-Saharan Africa.” The project will include two detailed theme papers, five DRM country case studies in Burundi, Cameroon, Ethiopia, Mozambique, and Tanzania, and work-shops on DRM in Africa and overseas. For more details see: http://www.nsi-ins.ca/english/research/progress/58.asp
6 The question of direction of causality — whether savings and investment drive growth or vice-versa — has been a favou-rite preoccupation of the economics profession for decades. It would be difficult to elaborate on this debate further here except to say that the principle lesson of high savings/invest-ment developing regions (East and more recently South Asia) is that they have pursued dynamic capital accumulation and grow strategies that enabled them to achieve developmental objectives independent of external conditionality.
7 The levels of concentration for other private flows are very similar.
8 Another example is the Democratic Republic of Congo: as recently as 2006 DRC received only $86,000 in mineral royalties (Paul Collier cited in Commission on Growth and Development 2008, 80).
9 It may come as a surprise that only a third of disbursed aid is actually spent. In technical terms, aid, like other external flows, presents a dilemma for recipients. The choices are either to spend, or to absorb, or some intermediate combination of the two; or neither to absorb nor to spend (i.e., accumulate re-serves). The dilemma is compounded by strict macroeconomic stability goals (e.g., inflation and fiscal targets) imposed by the IMF and donors. Spending aid (or fiscal expansion) on public infrastructure, for instance, can lead to inflationary pressure and thus goes against the grain of the very conditionality imposed to access the resource. The question to ask instead is whether reserve accumulation has helped attain the stabilization goals and if that led to better growth prospects in any discernable manner, or if debt servicing has improved the domestic invest-ment climate. If the answers are no, then it is likely that more than two-thirds of aid is going to waste in the poorest region.
10 Comments by Zambian minister of commerce at UNCTAD stakeholders meeting in Lusaka, April 15, 2008.
11 Aid flows are about four times as volatile as domestic resources. See: Khan (2006) and Bulir and Haman (2005
12 “Dutch disease”refers to the harmful consequences of large and unexpected increases in a country’s income caused by large inflows of foreign currency. Generally associated with natural resource discovery, it can occur from any development that results in a large inflow of foreign currency, including a sharp surge in resource prices, foreign assistance, or FDI. The term is attributed to the unexpected discovery of natural gas in the North Sea in the 1960s, which led to a sharp rise in Dutch national income and a steep appreciation in the currency. The currency appreciation weakened competitiveness of traditional Dutch exports and led to a boom in domestic sectors support-ing the gas industry. However, most inflow surges are short-lived and can reverse just as easily, complicating policy-making (hence the tag “disease”).
13 Fiscal surpluses in poor countries aren’t really the goal because, by definition, these countries require additional long-term capital expenditure (e.g., public sector investments in infrastructure) that would undercut the objective of maintaining cash surpluses. Nevertheless, the aim should be balanced-budget taxation.
14 The impact of high spreads should be viewed against the backdrop of high real interest rates. One of the key effects of financial liberalization in SSA has been introduction of posi-tive real interest rates. This has undoubtedly played a role in containing inflation, but in a number of countries real interest rates are persistently high even though inflation is falling. More worrying is the trend that even when real interest rates seem to fall, the oligopolistic financial sector maintains high spreads instead of passing on the reduced cost of capital to consumers.
15 As we have seen, there are exceptions. Countries such as Zam-bia, Kenya, and India have fared better in recovering revenues lost to tariff reduction. The key lesson for poor countries is the importance of phased and gradual tariff reduction, linked with reforms to domestic tax policy and administration.
16 Tax Justice Network estimates that about 80 per cent of Africa’s external borrowings have been captured by ruling elites and channelled offshore in the form of capital flight. As a result, external debt contracted by African governments and private firms with government guarantees have been transformed into private assets held in offshore accounts.
17 See: Economist (online edition), ‘On Safari’ Dec, 13 2007, Finance & Economics section (url: http://www.economist.com/finance/displaystory.cfm?story_id=10286761); Euvin Naidoo, ‘Africa as an investment’ http://www.ted.com/talks/view/id/154 (video from a conference in California, available online at the given link) ; Razia Khan (Head of Research-Africa, Standard Chartered Bank), ‘In Search of Safe Havens’, Standard Chartered Global Focus (monthly analysis), December 12th, 2007 pp.10-12; Vijay Mahajan (2006) ‘Africa Rising’, Wharton School Publishing (this is a book); Economist (online edition), ‘Africa Shines’ July 8, 2008, Business View section (url: http://www.economist.com/business/displaystory.cfm?story_id=11698186)
18 The Equity Bank in Kenya (which started as a microfinance institution), for example, has increased its delivery of financial services in rural areas without incurring the large costs involved in setting up a branch network. It has invested in vans that serve as mobile branches. The bank has also combined this extension of coverage with new savings products more adapted to the needs of poor and rural households. In South Africa, some banks have improved their cash delivery service to remote areas by installing ATMs or even small bank branches powered by solar electricity and using satellite communications. It is ironic that Africa has managed to reach the cutting edge of the financial services industry out of sheer necessity.
19 A good example is the Development Bank of Zambia, DBZ.

CANADIAN DEvELoPMENT REPoRT 2009 — FINANCING DEvELoPMENT IN TIMES oF GLoBAL CRISIS98

2009Statistical Annex

CANADIAN DEvELoPMENT REPoRT 2009 — FINANCING DEvELoPMENT IN TIMES oF GLoBAL CRISIS100

STATISTICAL ANNEx 101
Canada’s Relations with Developing Countries
Table 1: The Developing Countries: Selected Social and Economic Indicators (2005-06) .......................... 102
Progress Toward the Millennium Development Goals
Table A: Sub-Saharan Africa (2007) ........................................................................................................ 106
Table B: Latin America and the Caribbean (2007) ................................................................................... 107
Table 2: Canada and Other High Income OECD Countries (2005-2007) .....................................................111
Table 3: Canadian Official Development Assistance (All Sources): Basic Data (2005-06)................................. 114
Table 4: Canadian Bilateral Official Development Assistance by Channel and by Country (2005-06) ........................................................................................... 118
Table 5: Canadian Bilateral Official Development Assistance by Sector (2005-06) .....................................122
Table 6: Canadian Technical Assistance to Developing Countries (2000-2005) ...........................................124
Table 7: Canadian Multilateral Official Development Assistance by Channel and by Country (2005-06) ...........................................................................................128
Table 8: Canadian Balance of Merchandise Trade with Developing Countries (2007) .................................132
Table 9: Finance and Investment Flows Between Canada and Developing Countries (2006-07) ................137
Table 10: Temporary Workers and Immigrants in Canada (1997, 2001 and 2006) .........................................143
Technical Notes ...............................................................................................................................................146
Table of Contents
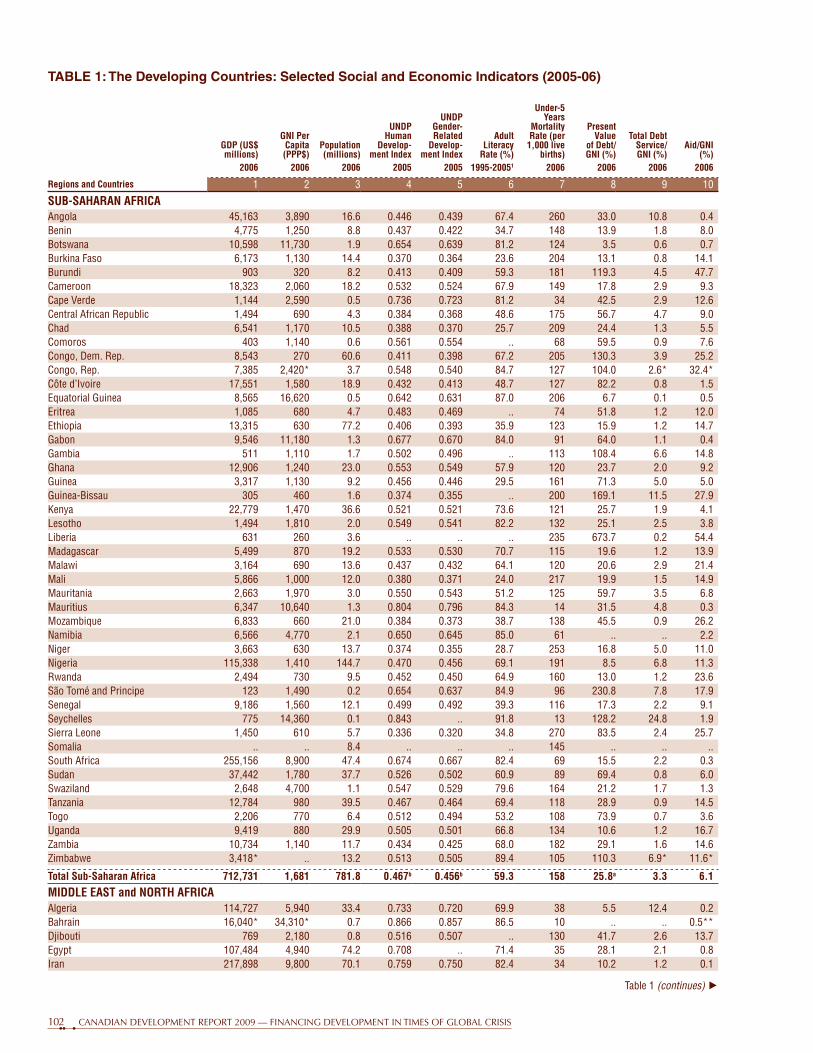
CANADIAN DEvELoPMENT REPoRT 2009 — FINANCING DEvELoPMENT IN TIMES oF GLoBAL CRISIS102
Table 1: The Developing Countries: Selected Social and economic Indicators (2005-06)
GDP (US$ millions)
GNI Per Capita(PPP$)
Population (millions)
UNDP Human
Develop-ment Index
UNDP Gender-Related
Develop-ment Index
Adult Literacy
Rate (%)
Under-5 Years
Mortality Rate (per
1,000 live births)
Present Value
of Debt/ GNI (%)
Total Debt Service/ GNI (%)
Aid/GNI (%)
2006 2006 2006 2005 2005 1995-20051 2006 2006 2006 2006
Regions and Countries 1 2 3 4 5 6 7 8 9 10
SUB-SAHARAN AFRICAAngola 45,163 3,890 16.6 0.446 0.439 67.4 260 33.0 10.8 0.4 Benin 4,775 1,250 8.8 0.437 0.422 34.7 148 13.9 1.8 8.0 Botswana 10,598 11,730 1.9 0.654 0.639 81.2 124 3.5 0.6 0.7 Burkina Faso 6,173 1,130 14.4 0.370 0.364 23.6 204 13.1 0.8 14.1 Burundi 903 320 8.2 0.413 0.409 59.3 181 119.3 4.5 47.7 Cameroon 18,323 2,060 18.2 0.532 0.524 67.9 149 17.8 2.9 9.3 Cape Verde 1,144 2,590 0.5 0.736 0.723 81.2 34 42.5 2.9 12.6 Central African Republic 1,494 690 4.3 0.384 0.368 48.6 175 56.7 4.7 9.0 Chad 6,541 1,170 10.5 0.388 0.370 25.7 209 24.4 1.3 5.5 Comoros 403 1,140 0.6 0.561 0.554 .. 68 59.5 0.9 7.6 Congo, Dem. Rep. 8,543 270 60.6 0.411 0.398 67.2 205 130.3 3.9 25.2 Congo, Rep. 7,385 2,420* 3.7 0.548 0.540 84.7 127 104.0 2.6* 32.4* Côte d’Ivoire 17,551 1,580 18.9 0.432 0.413 48.7 127 82.2 0.8 1.5 Equatorial Guinea 8,565 16,620 0.5 0.642 0.631 87.0 206 6.7 0.1 0.5 Eritrea 1,085 680 4.7 0.483 0.469 .. 74 51.8 1.2 12.0 Ethiopia 13,315 630 77.2 0.406 0.393 35.9 123 15.9 1.2 14.7 Gabon 9,546 11,180 1.3 0.677 0.670 84.0 91 64.0 1.1 0.4 Gambia 511 1,110 1.7 0.502 0.496 .. 113 108.4 6.6 14.8 Ghana 12,906 1,240 23.0 0.553 0.549 57.9 120 23.7 2.0 9.2 Guinea 3,317 1,130 9.2 0.456 0.446 29.5 161 71.3 5.0 5.0 Guinea-Bissau 305 460 1.6 0.374 0.355 .. 200 169.1 11.5 27.9 Kenya 22,779 1,470 36.6 0.521 0.521 73.6 121 25.7 1.9 4.1 Lesotho 1,494 1,810 2.0 0.549 0.541 82.2 132 25.1 2.5 3.8 Liberia 631 260 3.6 .. .. .. 235 673.7 0.2 54.4 Madagascar 5,499 870 19.2 0.533 0.530 70.7 115 19.6 1.2 13.9 Malawi 3,164 690 13.6 0.437 0.432 64.1 120 20.6 2.9 21.4 Mali 5,866 1,000 12.0 0.380 0.371 24.0 217 19.9 1.5 14.9 Mauritania 2,663 1,970 3.0 0.550 0.543 51.2 125 59.7 3.5 6.8 Mauritius 6,347 10,640 1.3 0.804 0.796 84.3 14 31.5 4.8 0.3 Mozambique 6,833 660 21.0 0.384 0.373 38.7 138 45.5 0.9 26.2 Namibia 6,566 4,770 2.1 0.650 0.645 85.0 61 .. .. 2.2 Niger 3,663 630 13.7 0.374 0.355 28.7 253 16.8 5.0 11.0 Nigeria 115,338 1,410 144.7 0.470 0.456 69.1 191 8.5 6.8 11.3 Rwanda 2,494 730 9.5 0.452 0.450 64.9 160 13.0 1.2 23.6 São Tomé and Principe 123 1,490 0.2 0.654 0.637 84.9 96 230.8 7.8 17.9 Senegal 9,186 1,560 12.1 0.499 0.492 39.3 116 17.3 2.2 9.1 Seychelles 775 14,360 0.1 0.843 .. 91.8 13 128.2 24.8 1.9 Sierra Leone 1,450 610 5.7 0.336 0.320 34.8 270 83.5 2.4 25.7 Somalia .. .. 8.4 .. .. .. 145 .. .. .. South Africa 255,156 8,900 47.4 0.674 0.667 82.4 69 15.5 2.2 0.3 Sudan 37,442 1,780 37.7 0.526 0.502 60.9 89 69.4 0.8 6.0 Swaziland 2,648 4,700 1.1 0.547 0.529 79.6 164 21.2 1.7 1.3 Tanzania 12,784 980 39.5 0.467 0.464 69.4 118 28.9 0.9 14.5 Togo 2,206 770 6.4 0.512 0.494 53.2 108 73.9 0.7 3.6 Uganda 9,419 880 29.9 0.505 0.501 66.8 134 10.6 1.2 16.7 Zambia 10,734 1,140 11.7 0.434 0.425 68.0 182 29.1 1.6 14.6 Zimbabwe 3,418* .. 13.2 0.513 0.505 89.4 105 110.3 6.9* 11.6*
Total Sub-Saharan Africa 712,731 1,681 781.8 0.467b 0.456b 59.3 158 25.8a 3.3 6.1
MIDDLE EAST and NORTH AFRICAAlgeria 114,727 5,940 33.4 0.733 0.720 69.9 38 5.5 12.4 0.2 Bahrain 16,040* 34,310* 0.7 0.866 0.857 86.5 10 .. .. 0.5** Djibouti 769 2,180 0.8 0.516 0.507 .. 130 41.7 2.6 13.7 Egypt 107,484 4,940 74.2 0.708 .. 71.4 35 28.1 2.1 0.8 Iran 217,898 9,800 70.1 0.759 0.750 82.4 34 10.2 1.2 0.1
Table 1 (continues) h

STATISTICAL ANNEx 103
Iraq 12,602*** .. .. .. .. .. .. .. .. .. Jordan 14,101 4,820 5.5 0.773 0.760 91.1 25 57.9 4.7 3.9 Kuwait 80,780* 48,310* 2.6 0.891 0.884 93.3 11 .. .. 0.4** Lebanon 22,722 9,600 4.1 0.772 0.759 .. 30 115.6 19.8 3.2 Libya 50,320 11,630 6.0 0.818 0.797 84.2 18 .. .. 0.1 Morocco 65,401 3,860 30.5 0.646 0.621 52.3 37 29.7 5.3 1.6 Oman 30,834* 19,740* 2.5 0.814 0.788 81.4 12 16.3 5.0* -0.01* Qatar 42,462* .. 0.8 0.875 0.863 89.0 21 .. .. .. Saudi Arabia 349,138 22,300 23.7 0.812 0.783 82.9 25 .. .. 0.0 Syria 33,407 4,110 19.4 0.724 0.710 80.8 14 23.2 0.6 0.1 Tunisia 30,299 6,490 10.1 0.766 0.750 74.3 23 65.5 8.8 1.5 United Arab Emirates 129,701* 31,190** 4.2 0.868 0.855 88.7 8 .. .. 0.5** West Bank and Gaza 4,059 3,720 3.8 0.731 .. 92.4 22 .. .. 34.6 Yemen 19,057 2,090 21.7 0.508 0.472 54.1 100 24.6 1.3 1.6
Total Middle East and North Africa 734,423 6,710 310.7 0.730b 0.539b 73.0 42 19.8a 4.8 2.1
SOUTH ASIAAfghanistan 8,399 .. .. .. .. .. .. 5.4 0.1 35.7 Bangladesh 61,897 1,230 156.0 0.547 0.539 47.5 69 22.4 1.0 1.9 Bhutan 942 4,000 0.6 0.579 .. 47.0 70 86.0 1.1 10.0 India 911,813 2,460 1,109.8 0.619 0.600 61.0 76 14.5 2.0 0.2 Maldives 927 4,740 0.3 0.741 0.744 96.3 30 49.6 3.9 4.4 Nepal 8,939 1,010 27.6 0.534 0.520 48.6 59 28.1 1.6 5.7 Pakistan 126,836 2,410 159.0 0.551 0.525 49.9 97 25.5 1.8 1.7 Sri Lanka 26,964 3,730 19.9 0.743 0.735 90.7 13 39.6 3.6 3.0
Total South Asia 1,146,716 2,289 1,499.4 0.594b 0.575b 59.5 83 16.9a 1.9 0.8
EAST ASIA and the PACIFICBrunei 11,562 49,900 0.4 0.894 0.886 92.7 9 .. .. 0.9** Cambodia 7,258 1,550 14.2 0.598 0.594 73.6 82 47.7 0.4 7.6 China 2,644,681 4,660 1,311.8 0.777 0.776 90.9 24 13.9 1.1 0.1 Fiji 3,138 4,450 0.8 0.762 0.757 .. 18* 7.9 0.5 1.8 Hong Kong, China 189,799 39,200 6.9 0.937 0.926 .. .. .. .. 0.4** Indonesia 364,790 3,310 223.0 0.728 0.721 90.4 34 44.6 5.9 0.4 Kiribati 71 6,230 0.1 .. .. .. 65* .. .. -37.6Korea, Dem. Rep. .. .. 23.7 .. 0.910 .. 55 .. .. .. Laos 3,437 1,740 5.8 0.601 0.593 68.7 75 86.6 5.6 12.0 Malaysia 150,672 12,160 26.1 0.811 0.802 88.7 12 39.4 5.2 0.2 Marshall Islands 155 8,040 0.1 .. .. .. 58* .. .. 28.5 Micronesia 245 6,070 0.1 .. .. .. 42* .. .. 41.3 Mongolia 3,132 2,810 2.6 0.700 0.695 97.8 43 42.8 1.6 6.7 Myanmar .. .. 48.4 0.583 .. 89.9 104 69.9 .. .. Palau 157 14,340 0.0 .. .. .. 11* .. .. 23.5 Papua New Guinea 5,654 1,630 6.2 0.530 0.529 57.3 73 34.7 5.8 5.5 Philippines 117,562 3,430 86.3 0.771 0.768 92.6 32 56.9 10.7 0.4 Samoa 424 5,090 0.2 0.785 0.776 98.6 29* 205.3 7.1 11.2 Solomon Islands 337 1,850 0.5 0.602 .. .. 29* 43.4 1.3 60.3 Singapore 132,159 43,300 4.5 0.922 .. 92.5 3 .. .. 0.9** Thailand 206,338 7,440 63.4 0.781 0.779 92.6 8 30.3 7.3 -0.1Timor-Leste 356 5,100 1.0 0.514 .. 50.1 55 .. .. 24.7 Tonga 223 5,470 0.1 0.819 0.814 98.9 24* 28.8 1.4 9.5 Vanuatu 388 3,480 0.2 0.674 .. 74.0 38* 19.0 1.0 13.6 Vietnam 60,999 2,310 84.1 0.733 0.732 90.3 17 32.7 1.5 3.1
Total East Asia and the Pacific 3,616,708 4,359 1,898.9 0.758b 0.749b 90.7 29 20.7a 2.4 0.2
EUROPE and CENTRAL ASIAAlbania 9,098 6,000 3.2 0.801 0.797 98.7 17 21.4 1.4 3.5 Armenia 6,387 4,950 3.0 0.775 0.772 99.4 24 29.2 2.6 3.3 Azerbaijan 19,851 5,430 8.5 0.746 0.743 98.8 88 11.9 1.4 1.2
Table 1 (continues) h
Table 1 h
GDP (US$ millions)
GNI Per Capita(PPP$)
Population (millions)
UNDP Human
Develop-ment Index
UNDP Gender-Related
Develop-ment Index
Adult Literacy
Rate (%)
Under-5 Years
Mortality Rate (per
1,000 live births)
Present Value
of Debt/ GNI (%)
Total Debt Service/ GNI (%)
Aid/GNI (%)
2006 2006 2006 2005 2005 1995-20051 2006 2006 2006 2006
Regions and Countries 1 2 3 4 5 6 7 8 9 10

CANADIAN DEvELoPMENT REPoRT 2009 — FINANCING DEvELoPMENT IN TIMES oF GLoBAL CRISIS104
Belarus 36,945 9,700 9.7 0.804 0.803 99.6 13 17.4 2.0 0.2 Bosnia and Herzegovina 12,255 6,780 3.9 0.803 .. 96.7 15 42.8 4.6 3.9 Bulgaria 31,483 10,270 7.7 0.824 0.823 98.2 14 73.5 8.7 2.4** Croatia 42,926 13,850 4.4 0.850 0.848 98.1 6 92.9 18.5 0.5 Czech Republic 143,018 20,920 10.3 0.891 0.887 .. 4 .. .. 0.2** Cyprus 18,372 25,060 0.8 0.903 0.899 96.8 4 .. .. 0.4**Estonia 16,410 18,090 1.3 0.860 0.858 99.8 7 .. .. 1.2** Georgia 7,744 3,880 4.4 0.754 .. 100.0 32 22.5 3.6 4.8 Hungary 112,920 16,970 10.1 0.874 0.872 .. 7 99.5 29.4 0.3** Kazakhstan 81,003 8,700 15.3 0.794 0.792 99.5 29 132.2 20.3 0.2 Kyrgyzstan 2,818 1,790 5.2 0.696 0.692 98.7 41 70.9 3.5 11.2 Latvia 20,116 14,840 2.3 0.855 0.853 99.7 9 135.0 16.9 1.2** Lithuania 29,766 14,550 3.4 0.862 0.861 99.6 8 78.8 15.3 1.2** Macedonia, FYR 6,217 7,850 2.0 0.801 0.795 96.1 17 49.8 8.4 3.2 Moldova 3,356 2,660 3.8 0.708 0.704 99.1 19 64.9 8.9 6.1 Poland 338,733 14,250 38.1 0.870 0.867 .. 7 41.1 11.1 0.6** Romania 121,609 10,150 21.6 0.813 0.812 97.3 18 58.4 7.3 1.2** Russia 986,940 12,740 142.5 0.802 0.801 99.4 16 33.5 5.2 0.2** Serbia and Montenegro 31,989 9,320 7.4 .. .. .. 8 51.9 8.5 5.0 Slovak Republic 55,049 17,060 5.4 0.863 0.860 .. 8 58.1 7.8 0.5** Slovenia 37,303 23,970 2.0 0.917 0.914 99.7 4 .. .. 0.2**Tajikistan 2,812 1,560 6.6 0.673 0.669 99.5 68 35.7 5.0 8.8 Turkey 402,710 8,410 73.0 0.775 0.763 87.4 26 60.7 10.1 0.1 Turkmenistan 10,497 3,990* 4.9 0.713 .. 98.8 51 10.8 2.6 0.3 Ukraine 106,469 6,110 46.8 0.788 0.785 99.4 24 57.9 9.0 0.5 Uzbekistan 17,178 2,190 26.5 0.702 0.699 .. 43 26.0 5.4 0.9
Total Europe and Central Asia 2,499,359 9,791 460.5 0.808b 0.782b 97.4 26 50.5a 9.0 0.3
LATIN AMERICA and the CARIBBEANAntigua and Barbuda 998 15,130 0.1 0.815 .. 85.8 11 .. .. 36.0 Argentina 214,241 11,670 39.1 0.869 0.865 97.2 17 67.5 9.1 0.1 Bahamas 5,502*** .. 0.3 0.845 0.841 .. 14 .. .. 0.1**** Barbados 3,431 15,150* 0.3 0.892 0.887 .. 12 .. .. -0.1*Belize 1,214 7,080 0.3 0.778 .. 75.1 16 103.7 12.3 0.7 Bolivia 11,162 3,810 9.4 0.695 0.691 86.7 61 50.7 4.0 5.4 Brazil 1,067,472 8,700 189.3 0.800 0.798 88.6 20 26.3 6.0 0.0 Chile 145,843 11,300 16.4 0.867 0.859 95.7 9 42.5 10.9 0.1 Colombia 153,405 6,130 45.6 0.791 0.789 92.8 21 31.9 7.2 0.7 Costa Rica 22,229 9,220 4.4 0.846 0.842 94.9 12 35.5 2.8 0.1 Cuba .. .. 11.3 0.838 0.839 99.8 7 .. .. .. Dominica 319 7,870* 0.1 0.798 .. 88.0 15 84.4 6.8* 7.6* Dominican Republic 31,846 5,550 9.6 0.779 0.773 87.0 29 34.6 4.5 0.2 Ecuador 41,402 6,810 13.2 0.772 .. 91.0 24 51.5 10.5 0.5 El Salvador 18,654 5,610 6.8 0.735 0.726 80.6 25 55.5 6.2 0.9 Grenada 525 8,770* 0.1 0.777 .. 96.0 20 118.0 2.1* 10.8* Guatemala 35,325 5,120 13.0 0.689 0.675 69.1 41 17.9 1.6 1.4 Guyana 896 3,410 0.7 0.750 0.742 .. 62 131.5 3.8 20.1 Haiti 4,975 1,070 9.4 0.529 .. .. 80 24.4 1.3 13.4 Honduras 9,235 3,420 7.0 0.700 0.694 80.0 27 41.0 3.6 6.6 Jamaica 10,023 7,050 2.7 0.736 0.732 79.9 31 99.4 8.8 0.4 Mexico 839,182 11,990 104.2 0.829 0.820 91.6 35 21.4 6.8 0.0 Nicaragua 5,301 2,720 5.5 0.710 0.696 76.7 36 71.8 2.4 14.2 Panama 17,097 8,690 3.3 0.812 0.810 91.9 23 76.8 21.5 0.2 Paraguay 9,275 4,040 6.0 0.755 0.744 93.5 22 42.6 4.5 0.6 Peru 92,416 6,490 27.6 0.773 0.769 87.9 25 41.9 4.4 0.6 St. Kitts and Nevis 477 12,440* 0.1 0.821 .. 97.8 19 67.2 12.3* 0.6* St. Lucia 899 8,500* 0.2 0.795 .. 94.8 14 42.8 4.0* 1.3* St. Vincent and the Grenadines 423 6,220* 0.1 0.761 .. 88.1 20 67.5 6.9* 1.2*
Table 1 (continues) h
Table 1 h
GDP (US$ millions)
GNI Per Capita(PPP$)
Population (millions)
UNDP Human
Develop-ment Index
UNDP Gender-Related
Develop-ment Index
Adult Literacy
Rate (%)
Under-5 Years
Mortality Rate (per
1,000 live births)
Present Value
of Debt/ GNI (%)
Total Debt Service/ GNI (%)
Aid/GNI (%)
2006 2006 2006 2005 2005 1995-20051 2006 2006 2006 2006
Regions and Countries 1 2 3 4 5 6 7 8 9 10

STATISTICAL ANNEx 105
Suriname 2,115 7,720 0.5 0.774 0.767 89.6 39 .. .. 3.1 Trinidad and Tobago 18,136 16,800 1.3 0.814 0.808 98.4 38 .. .. 0.1 Uruguay 19,308 9,940 3.3 0.852 0.849 96.8 12 65.9 30.3 0.1 Venezuela 181,862 10,970 27.0 0.792 0.787 93.0 21 34.4 5.5 0.0
Total Latin America and the Caribbean 2,964,189 8,682 556.1 0.801b 0.767b 89.9 26 31.4a 6.9 0.2 Total Developing Countries 12,455,095 6,843 b 5,512 0.691 0.652b 74.7b 57.8a 16.3a 4.7b 0.6b Of which:
Least Developed Countries (LDCs) 36,6825 1,076 781 0.488 0.422b 52.3b 142 31.0a 3 8.5b
Low Income Countries 1,618,703 1,860 2,420 0.570 0.536b 60.8 112 9.2a 2 3Middle Income Countries 10,059,157 6,451 3,088 0.776 0.742b 90.0 33 18.6a 6 0High Income Developing Countries2 739,330 31,266 47 0.879 0.751b 90.8b 11.1b .. .. 0
High Income Countries3 36,794,507 34,933 1,031 0.936 .. 98.7 7 .. .. 0.0
Table 1 h
Notes: Bold-italicized countries are not ODA eligible (see Technical Notes) but official assistance (OA) to these countries was used in constructing Column 10. Italicized countries are identified as non independent countries at the time of writing (see Technical Notes). *2005, ** 2004, ***2003 1 Latest available data between (1995-2005). 2 High Income Developing Countries - Totals differ from High Income Developed and Developing countries (in charts 2.1.a and 2.2.a). 3 Hign Income Countries total or average includes both developed and developing countries. a Weighted average calculated using GDP as weight. b Weighted average calculated using Population as weight.
Sources: UNDP, Human Development Report 2008; World Bank Group, World Development Indicators 2008; World Bank, Global Development Finance 2006
GDP (US$ millions)
GNI Per Capita(PPP$)
Population (millions)
UNDP Human
Develop-ment Index
UNDP Gender-Related
Develop-ment Index
Adult Literacy
Rate (%)
Under-5 Years
Mortality Rate (per
1,000 live births)
Present Value
of Debt/ GNI (%)
Total Debt Service/ GNI (%)
Aid/GNI (%)
2006 2006 2006 2005 2005 1995-20051 2006 2006 2006 2006
Regions and Countries 1 2 3 4 5 6 7 8 9 10

CANADIAN DEvELoPMENT REPoRT 2009 — FINANCING DEvELoPMENT IN TIMES oF GLoBAL CRISIS106
Progress Toward the Millennium Development GoalsTable a: Sub-Saharan africa (2007)
Goal 1: Share of people living on less than $1 a day
Goal 2: Primary School Completion Rates
55
65
46
56
100
40
50
60
70
80
90
100
110
1990 1995 2000 2005 2010 2015
% of relevant age group
Actual female Actual male Goal female Goal male
41.1
31.446.7
23.4
0
10
20
30
40
50
1990 1995 2000 2005 2010 2015
% of population
Actual $1/day Projected $1/day Path to goal
Goal 3: Ratio of girls to boys enrolled in primary and secondary education
Goal 4: Under-five mortality rate
157184
61
0
50
100
150
200
1990 1995 2000 2005 2010 2015
Deaths per 1,000 live births
Actual Goal
8679
100
50
60
70
80
90
100
1990 1995 2000 2005 2010 2015
Percent
Actual Goal
Goal 5: Maternal mortality rates Goal 6.a: Tuberculosis incidence and prevalence rates
900920
230
0
1002003004005006007008009001000
1990 1995 2000 2005 2010 2015
Deaths per 100,000 live births
Actual Goal
0
100
200
300
400
500
600
1990 1994 1998 2002 2006
Rate per 100,000 people
Incidence Prevalence

STATISTICAL ANNEx 107
Goal 6.b: estimated Prevalence of HIV Trends (ages 15-49)
Goal 7: Population without access to an improved water source or sanitation facilities
0
1
2
3
4
5
6
7
1990 1994 1998 2002 2006
Global
Sub-Saharan Africa
% HIV prevalence
26
34
2010 2015
44
6351
69
0
15
30
45
60
75
90
1990 1995 2000 2005
% of population
Without water access actual Without sanitation access actual
Without water access goal Without sanitation access goal
Goal 1: Share of people living on less than $1 and $2 a day
Goal 2: Primary School Completion Rates
Table b: latin america and the Caribbean (2007)
26.222.2
16.3
8.65.5
10.2
5.10
10
20
30
40
50
1990 1995 2000 2005 2010 2015
% of population
Actual $2/day Projected $2/day Actual $1/day Projected $1/day Path to goal
100
98
83
82
100
60
70
80
90
100
110
1990 1995 2000 2005 2010 2015
% of relevant age group
Actual female Actual male Goal female Goal male
Goal 3: Ratio of girls to boys enrolled in primary and secondary education
Goal 4: Under-five mortality rate
101
99 100
60
70
80
90
100
110
1990 1995 2000 2005 2010 2015
Percent
Actual Goal
26
55
18
0
50
100
150
200
1990 1995 2000 2005 2010 2015
Deaths per 1,000 live births
Actual Goal

CANADIAN DEvELoPMENT REPoRT 2009 — FINANCING DEvELoPMENT IN TIMES oF GLoBAL CRISIS108
Goal 5: Maternal mortality rates Goal 6: Tuberculosis incidence and prevalence rates
130
180
45
0
50
100
150
200
250
300
350
400
450
500
1990 1995 2000 2005 2010 2015
Deaths per 100,000 live births
Actual Goal
0
100
200
300
400
500
600
1990 1994 1998 2002 2006
Rate per 100,000 people
Incidence Prevalence
Source: World Bank, World Development Indicators 2008
Goal 7: Population without access to an improved water source or sanitation facilities
9
17
9
3324
17
0
15
30
45
60
75
90
1990 1995 2000 2005 2010 2015
% of population
Without water access actual Without sanitation access actual
Without water access goal Without sanitation access goal

STATISTICAL ANNEx 109
Chart 1.1: UNDP Human Development Index (2005)
Source: UNDP, Human Development Report 2007/2008
Chart 1.1.a: by Income Group Chart 1.1.b: by Region
HDI
0.467
0.594
0.808 0.801 0.691
0 0.1 0.2 0.3 0.4 0.5 0.6 0.7 0.8 0.9
1
Sub-SaharanAfrica
Middle East
and NorthAfrica
SouthAsia
East Asiaand thePacific
Europeand
CentralAsia
LatinAmericaand the
Caribbean
DevelopingCountries
HDI
0.488 0.570
0.776
0 0.1 0.2 0.3 0.4 0.5 0.6 0.7 0.8 0.9
1
LeastDevelopedCountries
Low Income Middle Income High Income
0.936
0.73 0.758
Chart 1.2: Social and economic Indicators (2006)
Chart 1.2.a: GNI per Capita by Income Group Chart 1.2.b: GNI per Capita by Region
0
5,000
10,000
15,000
20,000
25,000
30,000
35,000
40,000
1,076
LeastDevelopedCountries
Low IncomeCountries
1,860
MiddleIncome
Countries
6,451
HighIncome
Countries
34,933
PPP$
0
2,000
4,000
6,000
8,000
10,000
12,000
1,681
Sub-SaharanAfrica
6,710
Middle-East and
NorthAfrica
2,289
SouthAsia
4,359
East Asiaand thePacific
9,791
Europeand
CentralAsia
8,682
LatinAmericaand the
Caribbean
6,843
DevelopingCountries
PPP$
Chart 1.3: Total Debt Service (TDS) and aid as Percentage of GNI (2006)
Chart 1.3.a: TDS/GNI and aid/GNI by Income Group
0.0
2.0
4.0
6.0
8.0
10.0%
TDS/GNI Aid/GNI
8.49
Least DevelopedCountries
2.61 2.20
Low IncomeCountries
3.02
0.35
Middle IncomeCountries
5.56
0.0
2.0
4.0
6.0
8.0
10.0
6.05
Sub-SaharanAfrica
%
TDS/GNI Aid/GNI
Middle-East and
NorthAfrica
4.84
2.06 1.92
SouthAsia
0.81
East Asia and the Pacific
2.41
0.22
Europe and
CentralAsia
0.26
9.04
LatinAmericaand the
Caribbean
6.85
0.24
Devel-oping
Countries
4.75
0.60
3.27
Sources: World bank, World Development Indicators 2008
Chart 1.3.b: TDS/GNI and aid/GNI by Region

CANADIAN DEvELoPMENT REPoRT 2009 — FINANCING DEvELoPMENT IN TIMES oF GLoBAL CRISIS110
Map 1.1: UNDP Human Development Index by Region (2005)
Chart 2.1: DaC Members’ ODa: 1990-2007 and Simulations to 2010
Source: OECD, Preliminary data for 2007, http://www.oecd.org/dataoecd/27/55/40381862.pdf
Source: UNDP, Human Development Report 2007/2008
ODA as a % of GNI(left scale)
1990
1991
1993
1992
1994
1995
1997
1996
1998
1999
2003
2000
2004
2005
2007
2006
2001
2002
2008
2009
2010
0.40
0.35
0.25
0.30
0.15
0.10
0.00
0.05
0.20
% o
f GNI
120
80
100
40
20
0
60
ODA
(200
4 US
D bi
llion
)
0.33
0.22
0.33
0.35Increase required to meet current 2010 targets
0.28
Total ODA(right scale)
Very High (+0.9) High (0.8-0.9) Medium (0.65-0.8) Low (0.4-0.65) Very Low (0-0.4)

STATISTICAL ANNEx 111
Table 2: Canada and Other High Income OeCD Countries (2005-2007) Selected indicators of relations with developing countries
Figure 2.1: Top 20 Recipients of Net DaC ODa/Oa (2006)
Sources: OECD Stat. Data extracted on 2008/04/18
(US$ millions) % of Total (US$ millions) % of Total1 Nigeria 11,434 10.9 11 Mozambique 1,611 1.53 2 Iraq 8,661 8.2 12 Serbia 1,586 1.51 3 Afghanistan 3,000 2.8 13 Uganda 1,551 1.47 4 Pakistan 2,147 2.0 14 Palestinian adm.areas 1,449 1.38 5 Sudan 2,058 2.0 15 Zambia 1,425 1.35 6 Congo Dem.Rep. (Zaire) 2,056 2.0 16 Indonesia 1,405 1.33 7 Ethiopia 1,947 1.8 17 India 1,379 1.31 8 Vietnam 1,846 1.8 18 China 1,246 1.18 9 Tanzania 1,825 1.7 19 Bangladesh 1,223 1.16
10 Cameroon 1,684 1.6 20 Ghana 1,176 1.12
GNI Per Capita (PPP$)
Total Net ODA (US$
millions)
% Change Over
Previous Year (real
terms)ODA/GNI
Ratio
ODA/GNI Rank
Among DAC
Countries
Multilateral Share as % of Net ODA
Grant Share of Total ODA
Share of Net ODA
to Low Income
Countries
Share of Total
Exports to Developing
Countries
Share of Total Imports
from Developing
Countries
Net Private Financial Flows to
Developing Countries
(long-term) (US$
millions)
Foreign-born population as
% of total population
2006 2007 2007 2007 2007 2007 2005-2006 2005-2006 2006 2006 2006 2005
Countries 1 2 3 4 5 6 7 8 9 10 11 12Canada 36,280 3,922 -2.7 0.28 14 21.6 100.0 67.7 8.5 26.1 9,093 19.1 Australia 33,940 2,471 1.0 0.30 13 14.5 99.4 56.8 53.7 49.6 6,074 23.8 Austria 36,040 1,798 7.6 0.49 6 27.1 100.0 41.1 27.9 21.9 2,045 13.5 Belgium 33,860 1,953 -11.2 0.43 7 36.3 98.1 68.4 15.9 19.6 3,514 12.0 Denmark 36,190 2,563 2.9 0.81 4 35.6 99.2 76.6 17.6 20.8 454 6.5 Finland 33,170 973 5.5 0.40 9 41.6 98.6 61.3 37.2 32.0 553 0.4 France 32,240 9,940 -15.9 0.39 10 36.6 86.9 61.5 25.4 23.7 13,116 8.1 Germany 32,680 12,267 5.9 0.37 11 34.2 82.4 55.6 29.8 32.2 21,149 12.9* Greece 30,870 501 5.3 0.16 18 50.2 100.0 40.3 46.8 40.3 2,454 10.3** Iceland 33,740 .. .. .. .. .. .. .. 11.8 19.1 .. .. Ireland 34,730 1,190 4.6 0.54 5 30.7 100.0 81.3 11.6 15.3 3,877 11.0 Italy 28,970 3,929 -3.6 0.19 16 68.8 87.9 58.3 31.7 39.4 2,705 2.5** Japan 32,840 7,691 -30.1 0.17 17 24.2 54.1 53.3 59.1 70.0 12,290 .. Korea, Rep. 22,990 .. .. .. .. .. .. .. 62.0 57.2 .. .. Luxembourg 60,870 365 11.7 0.90 3 30.5 100.0 71.4 11.1 23.8 .. 33.4 Netherlands 37,940 6,215 3.1 0.81 4 24.9 100.0 70.4 16.9 37.6 22,544 10.6 New Zealand 25,750 315 3.7 0.27 15 22.7 100.0 57.6 37.8 39.8 24 19.4 Norway 50,070 3,727 13.4 0.95 1 23.6 86.3 71.8 9.6 24.0 1,345 8.2 Portugal 19,960 403 -9.4 0.19 16 49.6 94.5 76.4 15.3 21.1 286 6.3 Spain 28,200 5,744 33.8 0.41 8 53.3 87.9 46.0 22.0 34.3 7,333 5.3** Sweden 34,310 4,334 -2.6 0.93 2 31.8 99.7 65.6 21.2 21.1 210 12.4 Switzerland 40,840 1,680 -3.0 0.37 11 24.6 98.2 62.0 24.2 14.7 9,241 23.8 United Kingdom 33,650 9,921 -29.1 0.36 12 47.7 95.7 79.0 20.9 29.3 14,127 9.7 United States 44,070 21,753 -9.9 0.16 19 13.1 99.9 38.2 48.3 57.1 62,345 12.9
Average or Total 35,586 103,655 -8.4 0.28 .. 30.9 89.4 56.9 27.8 32.1 194,779 ..
Notes: * 2003, ** 2001
Sources: UNDP, Human Development Report 2007/2008; World Bank, World Development Indicators 2008; OECD, International Migration Outlook 2007; OECD DAC, Development Co-operation Report 2007; IMF, Direction of Trade Statistics Yearbook 2007

CANADIAN DEvELoPMENT REPoRT 2009 — FINANCING DEvELoPMENT IN TIMES oF GLoBAL CRISIS112
Chart 2.2: Net ODa as Percentage of GNI of the DaC Members (2007)
0.90.81 0.81
0.490.41 0.4 0.39
0.3 0.28 0.270.19 0.19
0.28
00.10.20.30.40.50.60.7*0.80.91
Norw
ay
Swed
en
Cana
da
Italy
Japa
n
Unite
d St
ates
Denm
ark
Irelan
d
Belg
ium
Finl
and
Germ
any
Unite
d Ki
ngdo
m
Luxe
mbo
urg
Neth
erlan
ds
Austr
ia Sp
ain
Fran
ce
Switz
erlan
d
Austr
alia
New
Zeala
nd
Portu
gal
Gree
ce
DAC
TOTA
L
%0.95 0.93
0.54
0.430.37 0.37 0.36
0.17 0.16 0.16
Chart 2.3: Total DaC Countries Gross bilateral ODa by Region, Income Group and Sector (2005-06)
Chart 2.3.a: by Region (US$ millions) Chart 2.3.b: by Income Group (US$ millions)
Chart 2.3.c: by Sector (US$ millions)
Sources: OECD DAC, Development Co-operation Report 2007
Sub-SaharanAfrica36,225
South andCentral Asia10,903
Other Asiaand Oceania14,420
Middle Eastand NorthAfrica25,674
Latin Americaand Caribbean8,323
Europe4,103
Unspecified17,468
LeastDevelopedCountries23,329
Other LowIncomeCountries23,564
Lower Middle-IncomeCountries43,962
Upper Middle-IncomeCountries3,869
Unallocated22,509
Educ
ation
Healt
h
Popu
latio
n
Wate
r Sup
ply a
ndSa
nitat
ion
Gove
rnm
ent a
ndCi
vil S
ociet
y
Othe
r Soc
ialIn
frastr
uctu
re
Econ
omic
Infra
struc
ture
Prod
uctio
n
Mul
tisec
tor
Prog
ram
Assis
tance
Debt
forg
ivene
ss(in
cludi
ngfo
rgive
ness
of n
on-
ODA
debt
), sw
aps
buy-
back
s,re
sche
dulin
g an
dre
finan
cing
Hum
anita
rian
Aid
Adm
inist
rativ
eex
pens
es
Unsp
ecifi
ed
0% 10% 20% 30% 40% 50% 60% 70% 80% 90% 100%
Note: *United Nations target for Official Development Assistance.

STATISTICAL ANNEx 113
Chart 3.2: Canadian bilateral ODa (2005-06)
Chart 3.2.a: by Region (C$ millions) Chart 3.2.b: by Income Group (C$ millions)
Notes: * Debt relief includes the forgiveness of non-ODA debt. ** Other includes: Economic Infrastrucuture/services, Promotion of Development Awareness, Humanitarian Aid, Support to NGOs and Commodity Assistance.
Sub-SaharanAfrica765
South Asia320
East Asia andthe Pacific165
Middle East and North Africa*539
Latin Americaand Caribbean250Europe and
Central Asia94
826
1,133
1,000
0
200
400
600
800
1000
1200
LDCs Low IncomeCountries
Middle IncomeCountries
Note:* Including 426 C$ millions in Debt Relief to Iraq.
Educ
ation
,He
alth
and
Popu
latio
n
Gove
rnm
ent
and
Civil
Socie
ty
Wate
r Sup
ply
and
Sani
tatio
nan
d Ot
her S
ocial
Infra
struc
ture
/Ser
vices
Debt
relie
f*,sw
aps,
buy-
back
s,re
sche
dulin
gan
d re
finan
cing
Adm
inist
rativ
eCo
st of
Don
ors
Refu
gees
inDo
nor C
ount
ries
Prod
uctio
nSe
ctors
Mul
tisec
tor/
Cros
scut
ting
Othe
r**
0% 10% 20% 30% 40% 50% 60% 70% 80% 90% 100%
Chart 3.3.a: by Region (C$ millions) Chart 3.3.b: by Income Group (C$ millions)
Chart 3.3: Canadian Multilateral allocated ODa (2005-06)
Sub-SaharanAfrica603
South Asia123
East Asia andthe Pacific87
Middle Eastand North Africa31
Latin Americaand the Caribbean92
Europe andCentral Asia43
557
735
244
0
200
400
600
800
1,000
1,200
LDCs Low IncomeCountries
MiddleIncome
Countries
Source: CIDA, Statistical Report on ODA 2005-06
Chart 3.2.c: by Sector

CANADIAN DEvELoPMENT REPoRT 2009 — FINANCING DEvELoPMENT IN TIMES oF GLoBAL CRISIS114
BILATERAL TotalMultilateral
TotalCanadian
Aid
Rank of Canada
Among DAC Bilateral
Donors in Recipient Country2
Rank of Canada
Among ALL Donors in Recipient Country3
Total Bilateral1 Total Bilateral 1995-1996
Real Yearly
Change
2005-06 (2005 prices)4 1995-2005 2005-06 2005-06 2006 2006Regions and Countries 1 2 3 4 5 6 7
SUB-SAHARAN AFRICAAngola 4.27 5.01 -1.58 14.15 18.42 13 23Benin 7.50 19.09 -8.92 10.02 17.52 9 13Botswana 1.78 2.39 -2.89 1.43 3.21 4 6Burkina Faso 17.83 14.37 2.18 17.67 35.50 9 13Burundi 4.92 6.85 -3.26 7.79 12.71 13 25Cameroon 49.81 25.15 7.07 10.76 60.57 6 10Cape Verde 0.30 0.73 -8.45 2.05 2.35 11 19Central African Republic 0.51 1.60 -10.80 5.21 5.72 9 18Chad 4.26 0.89 17.01 8.09 12.35 10 19Comoros 0.16 .. .. 0.44 0.60 2 9Congo, Dem. Rep. 32.18 1.22 38.74 37.71 69.89 5 9Congo, Rep. 26.76 0.23 60.65 3.78 30.54 5 8Côte d’Ivoire 4.89 39.02 -18.75 9.21 14.10 7 14Equatorial Guinea 0.23 0.17 2.94 0.86 1.09 3 9Eritrea 3.23 6.43 -6.66 7.00 10.23 15 24Ethiopia 87.29 22.72 14.41 52.21 139.50 8 12Gabon 2.46 4.00 -4.77 1.27 3.73 2 6Gambia 1.08 0.89 2.00 4.49 5.57 5 12Ghana 70.34 38.02 6.35 33.85 104.19 6 10Guinea 9.31 7.24 2.54 6.26 15.57 5 9Guinea-Bissau 0.84 0.90 -0.66 2.17 3.01 11 19Kenya 24.41 9.48 9.92 6.83 31.24 10 15Lesotho 3.99 1.19 12.83 3.68 7.67 9 20Liberia 2.60 2.53 0.26 3.86 6.46 12 19Madagascar 2.92 1.86 4.63 20.59 23.51 9 21Malawi 17.05 16.62 0.26 16.80 33.85 7 11Mali 28.91 24.46 1.68 15.27 44.18 6 9Mauritania 2.11 1.29 5.03 4.80 6.91 7 15Mauritius 0.35 0.41 -1.47 0.52 0.87 3 6Mozambique 53.82 23.57 8.61 25.77 79.59 9 12Namibia 1.45 1.70 -1.56 4.44 5.89 9 15Niger 15.75 6.06 10.02 14.52 30.27 9 16Nigeria 22.78 2.74 23.58 29.60 52.38 5 9Rwanda 8.37 21.49 -9.00 20.32 28.69 11 20São Tomé and Principe 0.24 0.27 -1.19 0.82 1.06 6 15Senegal 20.70 24.13 -1.52 18.39 39.09 8 12Seychelles 0.19 0.79 -13.25 0.30 0.49 4 8Sierra Leone 6.65 0.79 23.79 8.04 14.69 7 15Somalia 6.23 2.01 12.01 5.36 11.59 7 10South Africa 13.24 20.21 -4.14 9.65 22.89 12 13Sudan 72.01 5.74 28.77 12.96 84.97 4 6Swaziland 3.96 1.05 14.24 6.53 10.49 3 6Tanzania 48.74 14.74 12.71 51.37 100.11 10 14Togo 2.26 1.16 6.93 3.75 6.01 3 8Uganda 17.11 2.74 20.09 38.81 55.92 13 21Zambia 46.99 13.96 12.90 32.47 79.46 10 16Zimbabwe 12.17 20.52 -5.09 10.99 23.16 8 10
Total Sub-Saharan Africa 764.95 418.41 6.22 602.86 1,367.81
Table 3: Canadian Official Development assistance (all Sources): basic Data (2005-06) (In millions of Canadian dollars)
Table 3 (continues) h

STATISTICAL ANNEx 115
MIDDLE EAST and NORTH AFRICAAlgeria 2.03 4.78 -8.22 1.04 3.07 16 23Djibouti 0.91 0.22 15.18 3.04 3.95 4 10Egypt 18.99 109.77 -16.09 3.01 22.00 6 7Iran .. .. .. 0.83 0.83 .. ..Iraq 467.25 2.58 68.17 0.26 467.51 4 4Jordan 6.69 15.92 -8.30 2.74 9.43 5 7Lebanon 3.75 5.12 -3.06 1.51 5.26 8 10Libya 0.63 .. .. 0.10 0.73 .. ..Morocco 6.32 11.25 -5.61 1.82 8.14 6 7Syria 0.06 .. .. 0.96 1.02 11 18Tunisia 1.14 0.02 46.76 0.95 2.09 10 14West Bank and Gaza 30.07 2.46 28.45 6.14 36.21 9 11Yemen 1.25 0.89 3.51 8.26 9.51 8 18
Total Middle East and North Africa 539.09 153.01 13.42 30.66 569.75
SOUTH ASIAAfghanistan 101.86 7.55 29.72 13.46 115.32 3 5Bangladesh 62.69 91.29 -3.69 23.73 86.42 3 7Bhutan 1.80 0.42 15.71 1.06 2.86 5 10India 38.46 63.64 -4.91 40.07 78.53 5 9Maldives 0.75 0.04 35.15 0.93 1.68 3 7Nepal 13.33 7.49 5.93 2.60 15.93 8 12Pakistan 87.67 -0.07 .. 33.76 121.43 4 6Sri Lanka 13.82 9.52 3.80 7.63 21.45 6 8
Total South Asia 320.38 179.88 5.94 123.24 443.62
EAST ASIA and the PACIFICCambodia 9.42 4.33 8.08 9.89 19.31 10 14China 37.31 87.16 -8.13 13.48 50.79 7 10Fiji 0.08 0.20 -8.76 0.43 0.51 7 11Indonesia 49.91 27.44 6.16 10.81 60.72 4 9Korea, Dem. Rep. 1.80 0.12 30.78 1.21 3.01 9 16Laos 3.64 1.65 8.25 5.55 9.19 11 18Malaysia 0.16 5.56 -29.87 0.29 0.45 11 16Mongolia 1.22 0.05 37.86 1.97 3.19 10 18Myanmar 0.56 0.22 9.72 5.98 6.54 16 23Papua New Guinea 0.51 0.01 17.88 1.67 2.18 4 11Philippines 21.28 28.09 -2.74 4.11 25.39 5 6Samoa 0.02 .. .. 0.60 0.62 .. ..Solomon Islands 0.25 .. .. 0.05 0.30 4 7Thailand 4.25 20.21 -14.44 2.75 7.00 9 14Timor-Leste 1.42 .. .. 0.93 2.35 11 17Tonga 0.01 .. .. 0.22 0.28 5 8Vanuatu 0.62 0.02 40.97 0.03 0.61 6 8Vietnam 32.88 15.24 7.99 27.03 59.91 10 13
Total East Asia and the Pacific 165.34 190.39 -1.40 87.01 252.35
EUROPE and CENTRAL ASIAAlbania 0.73 0.16 16.40 1.94 2.67 17 24Armenia 0.13 .. .. 3.72 3.85 17 29Azerbaijan 0.08 0.06 2.66 3.54 3.62 8 16Belarus 0.07 .. .. 0.18 0.25 11 19Bosnia and Herzegovina 9.32 .. .. 3.41 12.73 11 13Croatia 0.58 .. .. 1.29 1.87 10 16Georgia 0.09 0.07 2.00 5.48 5.57 13 21Kazakhstan 0.21 1.38 -17.15 2.06 2.27 14 21Kyrgyzstan 0.26 0.07 13.42 3.75 4.01 14 26Macedonia, FYR 0.07 .. .. 1.40 1.47 17 27
Table 3 (continues) h
Table 3 h BILATERAL TotalMultilateral
TotalCanadian
Aid
Rank of Canada
Among DAC Bilateral
Donors in Recipient Country2
Rank of Canada
Among ALL Donors in Recipient Country3
Total Bilateral1 Total Bilateral 1995-1996
Real Yearly
Change
2005-06 (2005 prices)4 1995-2005 2005-06 2005-06 2006 2006
Regions and Countries 1 2 3 4 5 6 7

CANADIAN DEvELoPMENT REPoRT 2009 — FINANCING DEvELoPMENT IN TIMES oF GLoBAL CRISIS116
Moldova 0.27 .. .. 3.19 3.46 14 26Serbia and Montenegro 58.20 .. .. 6.08 64.28 11 14Tajikistan 7.20 0.04 69.45 2.56 9.76 9 21Turkey -2.36 6.06 .. 1.60 -0.76 14 22Turkmenistan .. 0.02 .. 0.31 0.31 5 11Ukraine 19.03 .. .. 2.35 21.38 4 6
Total Europe and Central Asia 93.88 7.87 28.13 42.86 136.74
LATIN AMERICA and the CARIBBEANArgentina 1.28 2.63 -6.96 2.66 3.94 7 11Belize 0.23 0.43 -6.08 1.71 1.94 3 7Bolivia 20.80 24.42 -1.59 7.38 28.18 9 12Brazil 7.86 7.13 0.97 6.00 13.86 4 6Chile 2.87 2.66 0.77 5.66 8.53 5 8Colombia 10.22 6.11 5.27 2.18 12.40 7 8Costa Rica 3.08 4.78 -4.31 1.51 4.59 5 6Cuba 9.19 2.31 14.80 1.39 10.58 3 3Dominica 0.27 1.46 -15.55 1.67 1.94 3 6Dominican Republic 1.85 0.54 13.08 2.33 4.18 6 8Ecuador 2.92 4.49 -4.21 2.69 5.61 7 10El Salvador 3.75 3.01 2.21 3.04 6.79 8 10Grenada 0.28 0.07 14.26 3.80 4.08 4 9Guatemala 9.62 5.41 5.92 3.82 13.44 8 9Guyana 8.79 4.54 6.83 5.48 14.27 3 8Haiti 98.37 37.88 10.01 7.76 106.13 2 2Honduras 23.24 8.86 10.13 11.76 35.00 5 8Jamaica 4.34 9.27 -7.31 2.07 6.41 2 4Mexico 7.10 6.10 1.53 3.21 10.31 5 7Nicaragua 13.66 22.53 -4.88 6.37 20.03 11 15Panama 0.72 0.89 -2.05 0.17 0.89 5 7Paraguay 0.91 0.42 8.09 0.18 1.09 6 9Peru 15.27 31.76 -7.06 6.64 21.91 6 7St. Kitts and Nevis 0.02 0.05 -8.61 0.77 0.79 2 5St. Lucia 0.31 6.52 -26.26 0.85 1.16 2 4St. Vincent and the Grenadines 0.24 .. .. -0.53 -0.29 3 5Suriname 0.15 0.12 2.00 0.66 0.81 7 12Trinidad and Tobago 0.66 1.97 -10.35 0.04 0.70 3 5Uruguay 0.74 2.28 -10.63 0.17 0.91 4 6Venezuela 0.90 1.55 -5.29 0.15 1.05 7 13
Total Latin America and the Caribbean 249.64 200.21 2.23 91.59 341.23Regional Programs 602.13 129.60 16.60 48.35 650.48Total ODA Allocated 2,767.89 1,659.22 5.25 1,077.00 3,844.89 Of which:
LDCs 825.83 404.70 7.39 556.60 1,382.43 Low Income Countries 1,132.58 586.25 6.81 734.52 1,867.10 Middle Income Countries 1,000.04 561.54 5.94 243.66 1,243.70
Unallocable by Country 460.40 529.42 -1.39 155.03 615.43 Total ODA 3,228.38 2,188.65 3.96 1,231.89 4,460.27
Table 3 h
Notes: Bold-italicized countries are not ODA eligible (see Technical Notes) but data on official assistance (OA) to these countries is included in this table. Italicized countries are identified as non independent countries at the time of writing (see Technical Notes). 1 Bilateral aid totals may differ from CIDA totals which include the multilateral branch’s disbursements to International Financial Insititutions. 2 Donor Ranking is based on net ODA excluding humanitarian assistance, debt relief and interest subsidies for calendar year 2006. 3 Ranking among all donors (including multilateral and non-OECD donors) is based on net ODA excluding humanitarian assistance, debt relief and interest
subsidies for calendar year 2006. 4 1995-06 values at 2005 prices calculated using GDP deflator (2005$ = 1995$*1.23).
Sources: CIDA, Statistical Report on ODA 2005-06; CIDA, Statistical Report on ODA 1995-96; OECD, Geographical Distribution of Financial Flows to Aid Recipients, 2002-06
BILATERAL TotalMultilateral
TotalCanadian
Aid
Rank of Canada
Among DAC Bilateral
Donors in Recipient Country2
Rank of Canada
Among ALL Donors in Recipient Country3
Total Bilateral1 Total Bilateral 1995-1996
Real Yearly
Change
2005-06 (2005 prices)4 1995-2005 2005-06 2005-06 2006 2006
Regions and Countries 1 2 3 4 5 6 7

STATISTICAL ANNEx 117
Figure 3.1: Top 3 Recipients of Canadian bilateral ODa in each Region (2005-06)
Rank Region and Country C$ millions % of Region % of TotalRank among
all recipients
SUB-SAHARAN AFRICA1 Ethiopia 87.29 11.32 2.67 52 Sudan 72.01 9.33 2.20 63 Ghana 70.34 9.12 2.15 7
MIDDLE EAST and NORTH AFRICA1 Iraq 467.25 86.58 14.28 12 West Bank and Gaza 30.07 5.57 0.92 193 Egypt 19.04 3.53 0.58 29
SOUTH ASIA1 Afghanistan 101.86 31.79 3.11 22 Pakistan 87.67 27.36 2.68 43 Bangladesh 62.69 19.57 1.92 8
EAST ASIA and the PACIFIC1 Indonesia 49.91 30.35 1.53 112 China 37.31 22.69 1.14 163 Vietnam 32.88 20.00 1.01 17
EUROPE and CENTRAL ASIA1 Serbia and Montenegro 58.2 61.95 1.78 92 Ukraine 19.03 20.26 0.58 283 Bosnia and Herzegovina 9.32 9.92 0.28 43
LATIN AMERICA and the CARIBBEAN1 Haiti 98.42 39.41 3.01 32 Honduras 23.24 9.31 0.71 233 Bolivia 20.8 8.33 0.64 26
Sources: CIDA, Statistical Report on ODA 2005-2006
Chart 3.4: evolution of Canadian ODa (1950-2007)
0500
1,000
1,5002,0002,5003,0003,500
4,000
4,5005,000
1950 1955 1960 1965 1970 1975 1980 1985 1990 1995 2000 2005
(C$ millions)
Multilateral
Bilateral
Notes: CIDA 2006 data adjusted (IFI and UN commonwealth removed from bilateral total, added to multilateral total). Bilateral aid in 2006 includes 581.39 C$ millions in Official Debt Relief, out of which 426 C$ millions to Iraq.
2007 data from DAC corresponds to calendar year. Previous data from CIDA corresponds to fiscal year.
Chart 3.5: evolution of Canadian ODa/GNI Index (1950-2007)
Sources: CIDA, Statistical Report on ODA 2005-06
0
0.1
0.2
0.3
0.4
0.5
0.6
1950 1955 1960 1965 1970 1975 1980 1985 1990 1995 2000 2005
%
ODA/GNI

CANADIAN DEvELoPMENT REPoRT 2009 — FINANCING DEvELoPMENT IN TIMES oF GLoBAL CRISIS118
Canadian International Development Agency (CIDA) Other Government Department (OGD) / Other Official Canadian Source
Government-to-Govern-
ment Aid
Voluntary Sector
and Special
ProjectsPrivate Sector
International Humanitarian
Assistance (IHA)1
CIDA and Common-
wealth Scholarships
Bilateral Food
Aid
Official Bilateral
Debt Relief
International Development
Research Centre (IDRC)
Int’l Centre for Human Rights and
Democratic Development
(ICHRDD) DFAITTotal
Bilateral2
Rank of Recipient
Country(if in top
30)
Regions and Countries 1 2 3 4 5 6 7 8 9 10 11 12
SUB-SAHARAN AFRICAAngola 0.19 0.34 .. .. .. 2.24 .. 0.09 .. .. 4.27Benin 4.30 1.99 0.08 0.11 0.16 0.01 .. 0.33 .. .. 7.50Botswana 0.08 1.31 .. .. .. .. .. 0.17 .. 0.08 1.78Burkina Faso 8.70 6.69 0.07 0.02 0.15 0.76 .. 0.41 .. .. 17.83Burundi 0.14 0.68 .. .. 0.15 2.54 .. .. .. 0.64 4.92Cameroon 6.36 1.28 0.13 .. 0.16 .. 40.94 0.13 .. 0.14 49.81 11Cape Verde 0.14 .. .. .. 0.15 .. .. .. .. .. 0.30Central African Republic 0.13 0.05 .. .. 0.15 .. .. .. .. .. 0.51Chad 0.13 0.24 .. 0.18 0.15 3.53 .. .. .. .. 4.26Comoros .. .. .. .. 0.15 .. .. .. .. .. 0.16Congo, Dem. Rep. 13.00 2.11 0.49 4.11 0.15 5.95 1.82 0.04 0.16 3.05 32.18 18Congo, Rep. 0.07 0.14 .. .. 0.15 .. 26.16 .. .. .. 26.76 21Côte d’Ivoire 0.45 0.17 .. 0.88 0.16 0.75 .. 0.02 0.11 1.02 4.89Equatorial Guinea 23.00 .. 0.03 .. 0.15 .. .. .. .. .. 0.23Eritrea .. 0.07 .. 0.35 .. 2.50 .. .. .. .. 3.23Ethiopia 12.39 4.79 0.35 1.13 0.02 37.57 .. 0.56 .. 0.34 87.29 5Gabon 1.05 0.06 0.40 .. 0.15 .. .. .. .. .. 2.46Gambia 0.10 0.74 .. .. .. .. .. 0.05 .. 0.02 1.08Ghana 62.56 4.88 0.48 0.11 0.07 0.75 .. 0.54 .. 0.08 70.34 7Guinea 6.36 0.88 0.11 .. 0.16 1.33 .. .. .. .. 9.31Guinea-Bissau 0.13 0.27 .. .. 0.15 .. .. .. .. 0.16 0.84Kenya 4.98 4.67 0.14 1.11 0.09 9.90 .. 1.14 .. 0.08 24.41 22Lesotho 0.10 0.56 .. 0.14 .. 2.98 .. 0.01 .. 0.01 3.99Liberia 0.08 0.09 .. .. .. 1.34 .. .. .. 1.09 2.60Madagascar 0.23 1.32 .. .. 0.15 .. .. .. .. .. 2.92Malawi 7.97 3.22 .. 1.15 .. 3.19 .. 0.20 0.08 0.07 17.05Mali 20.44 6.26 0.05 0.01 0.15 0.75 .. 0.13 .. .. 28.91 20Mauritania 0.11 0.99 0.53 .. 0.16 0.01 .. 0.02 .. .. 2.11Mauritius .. 0.03 0.01 .. 0.15 .. .. .. .. 0.06 0.35Mozambique 46.18 3.02 0.20 0.15 .. 3.18 .. 0.25 .. .. 53.82 10Namibia 0.08 0.92 .. 0.14 .. .. .. 0.11 .. .. 1.45Niger 2.80 2.38 0.01 3.01 0.15 7.01 .. .. .. .. 15.75 30Nigeria 16.48 1.19 0.47 .. 0.02 .. .. 0.43 0.03 0.28 22.78 24Rwanda 3.71 1.07 0.12 .. 0.16 2.53 .. 0.08 .. 0.05 8.37São Tomé and Principe 0.06 0.03 .. .. 0.15 .. .. .. .. .. 0.24Senegal 11.99 4.25 0.42 .. 0.16 0.90 .. 1.30 .. .. 20.70 26Seychelles .. 0.04 .. .. 0.15 .. .. .. .. .. 0.19Sierra Leone .. 1.36 .. 0.61 .. 1.33 .. 0.08 0.02 1.18 6.65Somalia 0.22 0.37 .. 1.01 .. 4.50 .. .. .. .. 6.23South Africa 8.30 3.09 0.03 .. .. .. .. 1.58 .. 0.15 13.24Sudan 42.69 0.41 .. 22.00 .. 13.70 .. 0.07 .. 3.36 72.01 6Swaziland 0.10 0.53 .. 0.14 .. 3.17 .. 0.01 .. 0.02 3.96Tanzania 36.66 4.31 .. 0.01 0.04 4.84 .. 0.53 .. 0.11 48.74 13Togo 0.07 1.51 0.24 .. 0.15 .. .. 0.04 0.05 .. 2.26Uganda 1.60 4.06 0.22 1.03 .. 7.10 .. 0.95 .. 0.13 17.11Zambia 9.84 2.12 0.22 0.14 0.02 4.21 29.15 0.11 .. 0.05 46.99 14Zimbabwe 5.51 2.03 .. 0.95 .. 2.98 .. 0.04 0.06 0.04 12.17
Total Sub-Saharan Africa 359.48 76.52 4.8 38.50 4.08 131.51 98.07 9.42 0.51 12.21 764.95
MIDDLE EAST and NORTH AFRICAAlgeria 1.43 0.04 0.41 .. .. 1.50 .. 0.27 0.02 0.13 2.03Djibouti 0.10 .. .. .. 0.15 0.60 .. .. .. .. 0.91Egypt 17.38 0.67 0.63 .. 0.15 .. .. 0.31 .. 0.05 18.99 28Iran .. .. .. .. .. .. .. .. .. .. ..
Table 4: Canadian bilateral Official Development assistance by Channel and by Country (2005-06) (In millions of Canadian dollars)
Table 4 (continues) h

STATISTICAL ANNEx 119
Table 4 (continues) h
Table 4 h Canadian International Development Agency (CIDA) Other Government Department (OGD) / Other Official Canadian Source
Government-to-Govern-
ment Aid
Voluntary Sector
and Special
ProjectsPrivate Sector
International Humanitarian
Assistance (IHA)1
CIDA and Common-
wealth Scholarships
Bilateral Food
Aid
Official Bilateral
Debt Relief
International Development
Research Centre (IDRC)
Int’l Centre for Human Rights and
Democratic Development
(ICHRDD) DFAITTotal
Bilateral2
Rank of Recipient
Country(if in top
30)
Regions and Countries 1 2 3 4 5 6 7 8 9 10 11 12Iraq 40.94 0.10 .. .. .. .. 426.19 .. .. .. 467.25 1Jordan 5.30 0.34 0.53 0.10 .. .. .. 0.21 0.03 0.17 6.69Lebanon 2.03 0.65 0.24 0.42 0.15 .. .. 0.50 .. 0.17 3.75Libya .. .. .. .. .. .. .. .. .. .. 0.63Morocco 5.71 0.92 0.47 0.01 0.15 0.01 .. 0.21 0.04 .. 6.32Syria 0.02 .. .. 0.01 .. .. .. .. .. .. 0.06Tunisia 2.46 0.27 0.50 .. 0.15 .. .. .. .. .. 1.14West Bank and Gaza 25.82 1.25 0.39 6.52 .. .. .. 1.01 .. 0.55 30.07 19Yemen 0.66 0.10 .. .. .. .. .. 0.04 .. 0.31 1.25
Total Middle East and North Africa 101.85 4.34 3.17 7.06 0.75 2.11 426.19 2.55 0.09 1.38 539.09
SOUTH ASIAAfghanistan 95.66 0.47 0.05 .. .. 4.68 .. 0.13 0.02 0.60 101.86 2Bangladesh 58.23 2.37 0.61 0.03 0.04 0.53 .. 0.36 .. 0.21 62.69 8Bhutan 1.33 0.20 .. .. .. .. .. 0.26 .. .. 1.80India 14.33 13.58 2.75 4.73 0.05 .. .. 2.19 .. 0.50 38.46 15Maldives 0.61 .. .. .. .. .. .. .. .. 0.11 0.75Nepal 8.12 2.50 0.11 .. 0.01 0.01 .. 0.57 .. 0.08 13.33Pakistan 40.58 0.57 0.04 36.22 .. 0.50 .. 0.36 .. 0.11 87.67* 4Sri Lanka 11.64 2.39 0.21 1.00 0.01 .. .. 0.66 .. 0.11 13.82
Total South Asia 230.5 22.08 3.77 41.99 0.11 5.72 .. 4.53 0.02 1.72 320.38
EAST ASIA and the PACIFICCambodia 4.55 1.94 0.09 .. 0.15 0.30 .. 1.13 .. 0.17 9.42China 30.32 4.49 4.07 0.02 0.06 .. .. 1.08 0.14 0.16 37.31 16Fiji .. 0.08 .. .. .. .. .. .. .. .. 0.08Indonesia 44.31 2.62 1.07 17.43 .. .. .. 0.28 0.19 0.34 49.91 12Korea, Dem. Rep. 0.16 .. .. .. .. 0.02 .. 0.04 .. .. 1.80Laos 1.33 1.26 0.39 .. 0.15 .. .. 0.11 .. .. 3.64Malaysia .. 0.08 0.45 .. .. .. .. 0.06 .. 0.08 0.16Mongolia 0.42 0.45 0.11 .. .. .. .. 0.23 .. .. 1.22Myanmar .. .. .. 0.13 .. .. .. .. 0.11 .. 0.56Papua New Guinea .. 0.48 .. .. .. .. 0.51Philippines 16.15 3.18 1.21 0.01 0.11 .. .. 0.36 0.03 0.03 21.28 25Samoa .. .. .. .. .. .. .. .. .. 0.02 0.02Solomon Islands .. 0.25 .. .. .. .. .. .. .. .. 0.25Thailand 2.73 1.69 1.11 0.55 .. 0.02 .. 0.08 .. .. 4.25Timor-Leste 0.40 0.47 .. .. .. .. .. .. .. .. 1.42Tonga .. .. .. .. .. .. .. .. .. 0.01 0.01Vanuatu .. 0.46 .. .. 0.15 .. .. .. .. .. 0.62Vietnam 23.89 7.05 0.71 0.01 0.17 .. .. 0.35 .. .. 32.88 17
Total East Asia and the Pacific 124.26 24.5 9.21 18.16 0.79 0.33 .. 3.72 0.47 0.81 165.34
EUROPE and CENTRAL ASIAAlbania 0.33 0.01 .. .. .. .. .. .. .. 0.36 0.73Armenia 0.04 0.08 .. .. .. .. .. .. .. .. 0.13Azerbaijan 0.04 0.02 .. .. .. .. .. .. .. 0.02 0.08Belarus .. 0.03 .. .. .. .. .. .. .. 0.04 0.07Bosnia and Herzegovina 6.99 0.04 0.13 .. .. .. .. .. .. 0.51 9.32Croatia .. 0.03 0.54 .. .. .. .. .. .. .. 0.58Georgia 0.05 0.03 .. .. .. .. .. .. .. .. 0.09Kazakhstan 0.04 0.11 0.03 .. .. .. .. .. .. .. 0.21Kyrgyzstan 0.04 0.09 .. .. .. .. .. .. .. 0.12 0.26Macedonia, FYR 0.07 .. .. .. .. .. .. .. .. .. 0.07Moldova 0.24 0.02 .. .. .. .. .. .. .. .. 0.27Serbia and Montenegro 10.50 0.15 0.15 .. .. .. 47.27 .. .. 0.07 58.20 9Tajikistan .. .. .. .. .. .. .. .. ..Turkey .. .. .. .. .. .. .. .. 7.20

CANADIAN DEvELoPMENT REPoRT 2009 — FINANCING DEvELoPMENT IN TIMES oF GLoBAL CRISIS120
Turkmenistan .. .. .. .. .. .. .. .. -2.36Ukraine 17.73 0.41 0.20 .. .. .. .. .. .. 0.35 ..Uzbekistan .. .. .. .. .. .. .. .. .. .. 19.03 29
Total Europe and Central Asia 36.07 1.02 1.05 .. .. .. 47.27 .. .. 1.47 93.88
LATIN AMERICA and the CARIBBEANArgentina .. 0.55 0.11 0.34 .. .. .. 0.45 0.03 .. 1.28Belize .. 0.20 .. 0.02 .. .. .. .. .. 0.02 0.23Bolivia 14.29 5.62 0.04 0.37 0.03 .. 0.43 .. 0.08 20.80 27Brazil 4.10 2.69 0.86 .. 0.01 .. .. 0.94 .. 0.06 7.86Chile .. 1.84 0.63 0.34 0.02 .. .. 0.06 .. 0.05 2.87Colombia 4.98 1.15 0.27 1.34 0.05 0.50 .. 0.48 .. 0.49 10.22Costa Rica 0.90 1.49 0.48 0.03 .. .. .. 0.13 .. .. 3.08Cuba 4.29 3.99 0.37 0.01 0.05 0.10 .. 0.14 .. 0.01 9.19Dominica .. 0.10 .. 0.02 0.15 .. .. .. .. 0.01 0.27Dominican Republic 0.51 0.89 0.38 0.02 .. .. .. .. .. .. 1.85Ecuador 0.79 1.56 .. 0.34 .. .. .. 0.38 .. .. 2.92El Salvador 0.68 2.14 .. 0.38 .. .. .. 0.25 .. .. 3.75Grenada .. 0.12 0.04 0.27 .. .. .. .. .. 0.02 0.28Guatemala 4.57 2.71 0.18 0.94 .. 0.50 .. 0.45 0.03 .. 9.62Guyana 7.75 0.67 .. 0.02 .. .. .. .. .. 0.10 8.79Haiti 77.26 4.76 0.30 0.47 0.15 12.00 .. .. 0.02 1.10 98.37 3Honduras 8.76 3.36 0.68 0.04 .. .. 9.86 0.51 .. .. 23.24 23Jamaica 3.20 0.98 0.05 0.02 0.05 .. .. 0.18 .. 0.06 4.34Mexico .. 3.79 1.74 0.03 0.01 .. .. 0.32 0.02 0.32 7.10Nicaragua 9.24 3.80 0.21 0.04 .. 0.01 .. 0.14 .. .. 13.66Panama .. 0.33 0.28 .. .. .. 0.06 .. .. 0.72Paraguay .. 0.72 .. .. .. .. .. 0.17 .. .. 0.91Peru 9.07 4.36 0.45 0.37 .. 0.01 .. 0.80 0.03 .. 15.27St. Kitts and Nevis .. 0.02 .. .. .. .. .. .. .. .. 0.02St. Lucia .. 0.05 0.04 0.02 0.16 .. .. .. .. 0.06 0.31St. Vincent and the Grenadines .. 0.19 0.01 .. .. .. .. .. .. 0.04 0.24
Suriname .. 0.15 .. .. .. .. .. .. .. .. 0.15Trinidad and Tobago .. 0.45 0.06 0.02 0.03 .. .. 0.02 .. 0.10 0.66Uruguay .. 0.46 .. .. .. .. .. 0.23 .. .. 0.74Venezuela .. 0.02 0.63 0.47 .. .. .. .. .. 0.01 0.90
Total Latin America and the Caribbean 150.39 49.16 7.81 6.01 0.68 13.15 9.86 6.14 0.13 2.53 249.64
Regional Programs 284.77 35.69 4.98 19.12 0.16 13.69 .. 27.43 0.78 49.71 602.13Total ODA Allocated to Developing Countries 1,271.33 213.64 35.39 142.78 6.65 154.99 581.39 53.82 2.02 70.07 2,767.89
Of which:LDCs3 501.31 70.49 4.69 35.82 3.78 132.09 30.97 7.85 0.46 12.86 825.83Low Income Countries 646.97 104.76 9.36 79.68 3.74 141.16 30.97 13.09 0.66 14.95 1,132.58Middle Income Countries 355.58 72.41 20.39 32.01 2.64 11.66 550.42 13.25 0.56 5.07 999.96
Unallocable by Country .. 13.41 0.69 .. 0.45 .. 80.88 6.73 9.34 460.39Countries not Specified .. 12.68 0.62 .. 0.44 .. .. 27.12 0.43 9.34 59.93Total ODA 1,271.33 227.05 36.09 142.78 7.10 154.99 581.39 134.70 8.75 79.14 3,228.28
Table 4 h Canadian International Development Agency (CIDA) Other Government Department (OGD) / Other Official Canadian Source
Government-to-Govern-
ment Aid
Voluntary Sector
and Special
ProjectsPrivate Sector
International Humanitarian
Assistance (IHA)1
CIDA and Common-
wealth Scholarships
Bilateral Food
Aid
Official Bilateral
Debt Relief
International Development
Research Centre (IDRC)
Int’l Centre for Human Rights and
Democratic Development
(ICHRDD) DFAITTotal
Bilateral2
Rank of Recipient
Country(if in top
30)
Regions and Countries 1 2 3 4 5 6 7 8 9 10 11 12
Notes: Bold-italicized countries are not ODA eligible (see Technical Notes) but data on official assistance (OA) to these countries is included in this table. Italicized countries are identified as non independent countries at the time of writing (see Technical Notes). 1 IHA excludes Emergency Food Aid, (which is included in Bilateral Food Aid). It includes Material Relief Assistance and Services, Reconstruction, Relief and
Rehabilitation and Unearmarked Humanitarian Aid. 2 Included in Total bilateral aid, but not featured as a separate category in this table are: bilateral disbursements under multilateral branch initiatives (Humanitarian
Assistance Peace and Security (HAPS) and Health and Nutrition (HAND) division), disbursements from DND, disbursements from provinces, municipalities and other expenses. Total bilateral aid differs from CIDA totals which include the multilateral branch’s disbursements to International Financial Insititutions.
3 Some countries included in the LDCs category are also in the Low income or Middle Income categories. For this reason, the three categories do not cumulatively add up to the total. See Technical Notes for description of Income Groups.
* Bilateral Total for Pakistan included 10.33 C$ million from the Department of National Defence (DND) for the Disaster Assistance Response Team (DART) humanitarian assistance for the Pakistan earthquake.
Source: CIDA, Statistical Report on ODA 2005-06

STATISTICAL ANNEx 121
Chart 4.1: Canadian bilateral ODa allocated by Channel (2005-06)
Note:* Including 426 C$ millions in Debt Relief to Iraq.
Chart 4.2: Canadian bilateral ODa by Channel and Income Group (2005-06)
Source: CIDA, Statistical Report on ODA 2005-2006
OtherOfficialCanadianSources1,032
GeographicPrograms1,271
Canadian Partnership270
CIDA Other branches126
Provinces and Other Official Sources228DFAIT
79ICHRDD9
IDRC135
Department of Finance(Official Debt Relief)*581
(C$ millions)
0
100
200
300
400
500
600
700
Gove
rnm
ent-
to-G
over
nmen
tAi
d
Volu
ntar
ySe
ctor a
ndSp
ecial
Pro
jects
Priva
te Se
ctor
Inter
natio
nal
Hum
anita
rian
Assis
tance
(IHA
)Ex
cludi
ng E
mer
genc
yFo
od A
id
CIDA
and
Com
mon
wealt
hSc
holar
ship
s
Bilat
eral
Food Ai
d
Offic
ialBi
later
al De
btRe
lief*
Inter
natio
nal
Deve
lopm
ent
Rese
arch
Cent
re (I
DRC)
Inter
natio
nal C
entre
for H
uman
Rig
hts a
ndDe
moc
ratic
Dev
elopm
ent
(ICHR
DD)
DFAI
T
LDCs
Low Income Countries
Middle Income Countries
501.31
70.49
355.58
72.41
104.76
4.69 9.36 20.39
32.0179.68
35.81
70.49
3.78
3.74
2.64
132.08
141.16
11.65
30.97
30.97
550.42
7.85
13.09
13.25
0.46
0.46
0.56
12.86
14.95
5.07
(C$ millions)
Chart 5.1: Comparative Net Canadian Disbursements across Category of Recipients (1996-2006)
Chart 5.1.a: across Category of Recipients Chart 5.1.b: across Regions
0%
10%
20%
30%
40%
50%
60%
70%
80%
90%
100%
1995-06 2000-2001 2005-06
Latin America and the Caribbean
Europe
Other Asia and Oceania
South andCentral Asia
Middle East andNorth Africa
Sub-SaharanAfrica0%
10%
20%
30%
40%
50%
60%
70%
80%
90%
100%
1995-06 2005-06
Upper-MiddleIncome Countries
Lower-MiddleIncome Countries
Other Low Income Countries
LDCs
Source: OECD DAC, Development Cooperation Report 2007, Statistical Annex, Tables 26 and 28
Note:* Including 426 C$ millions in Debt Relief to Iraq.

CANADIAN DEvELoPMENT REPoRT 2009 — FINANCING DEvELoPMENT IN TIMES oF GLoBAL CRISIS122
BILATERAL
CIDA OGDs/Other Official Canadian Sources
TOTAL Country
to CountrySector
Geographic
ProgramsCanadian
Partnership Other1 SUBTOTAL DFAIT ICHRDD IDRC Others2 Subtotal
$ $ $ $ % $ $ $ $ $ % $ %SOCIAL INFRASTRUCTURE/SERVICESEducation 180.24 45.41 0.14 225.79 13.54 2.97 0.27 1.54 14.27 19.05 1.65 244.84 8.67
Primary Education 61.50 2.65 0.02 64.17 3.85 .. .. .. .. .. .. 64.17 2.27Education Policy and Administrative Management 17.55 13.58 .. 31.13 1.87 .. .. .. .. .. .. 31.13 1.10
Education unspecified 19.88 1.53 .. 21.41 1.28 .. .. .. .. .. .. 21.41 0.76Post Secondary Education 2.72 0.24 .. 2.96 0.18 2.97 .. 0.85 14.07 17.89 1.55 20.85 0.74Teacher Training 18.03 1.96 .. 19.99 1.20 .. .. .. .. .. .. 19.99 0.71Education Facilities and Training 15.44 1.97 0.01 17.42 1.04 .. .. .. .. .. .. 17.42 0.62Other Education 45.12 23.48 0.11 68.71 4.12 0.00 0.27 0.69 0.20 1.16 0.10 69.87 2.47
Health 98.85 22.58 0.06 121.49 7.29 0.36 .. 9.77 3.07 13.20 1.14 134.69 4.77Basic Nutrition 1.16 3.14 .. 4.30 0.26 .. .. 0.40 .. 0.40 0.03 4.70 0.17Infectious Disease Control 24.98 2.54 0.05 27.57 1.65 .. .. 2.18 .. 2.18 0.19 29.75 1.05Basic Health Care 23.75 1.99 .. 25.74 1.54 .. .. 0.37 .. 0.37 0.03 26.11 0.92Basic Health 3.73 0.33 .. 4.06 0.24 .. .. .. 0.07 0.07 0.01 4.13 0.15Health Policy and Administrative Management 10.95 3.43 .. 14.38 0.86 0.26 .. 4.31 .. 4.57 0.40 18.95 0.67
Other Health 34.28 11.15 0.01 45.44 2.73 0.10 .. 2.51 3.00 5.61 0.49 51.05 1.81Population Policies/ Programs and Reproductive Health (incl. HIV/AIDS) 70.42 9.92 0.08 80.42 4.82 .. .. 1.33 0.22 1.55 0.13 81.97 2.90
Water Supply and Sanitation 51.56 8.47 0.02 60.05 3.60 .. .. 2.67 0.05 0.57 0.05 64.36 2.28Government and Civil Society 363.55 47.76 5.91 417.22 25.02 19.21 1.39 14.47 4.05 39.12 3.38 456.34 16.16
Strengthening Civil Society 69.81 30.75 2.58 103.14 6.19 0.24 0.53 .. .. 0.77 0.07 103.91 3.68Conflict Prevention and Resolution, Peace and Security 43.96 1.55 0.01 45.52 2.73 17.17 0.06 4.10 .. 21.33 1.84 66.85 2.37
Government Administration 57.76 2.18 0.33 60.27 3.61 0.57 .. .. .. 0.57 0.05 60.84 2.15Economic Development/Policy Planning 43.67 3.14 0.02 46.83 2.81 .. .. .. .. .. .. 46.83 1.66
Elections 43.37 0.62 2.24 46.23 2.77 0.08 0.02 .. .. 0.10 0.01 46.33 1.64Human Rights 21.61 6.87 0.38 28.86 1.73 0.29 0.61 .. .. 0.90 0.08 29.76 1.05Legal and Judicial Management 27.13 1.39 0.23 28.75 1.72 0.15 0.06 .. .. 0.21 0.02 28.96 1.03Public Sector Financial Management 26.99 0.94 .. 27.93 1.68 0.07 .. .. .. 0.07 0.01 28.00 0.99Government and Civil Society General 23.97 .. 0.08 24.05 1.44 0.38 0.03 10.37 4.05 14.83 1.28 38.88 1.38Free Flow of Information 5.28 0.32 0.04 5.64 0.34 0.26 0.08 .. .. 0.34 0.03 5.98 0.21
Other Social Infrastructure and Services 46.66 7.97 .. 54.63 3.28 0.06 .. 0.80 0.16 1.02 0.09 55.65 1.97Subtotal 811.27 142.10 6.28 959.65 57.56 22.60 1.65 30.57 76.67 6.63 1,036.32 36.70ECONOMIC INFRASTRUCTURE/SERVICESTransport and Storage 1.54 1.70 .. 3.24 0.19 .. .. .. .. .. .. 3.24 0.11Communications 6.39 2.86 0.02 9.27 0.56 .. 0.13 13.10 .. 13.23 1.14 22.50 0.80Energy Generation and Supply 10.14 4.59 0.02 14.75 0.88 .. .. 0.09 0.13 0.22 0.02 14.97 0.53Banking and Financial Services 26.61 9.10 .. 35.71 2.14 .. .. 0.46 .. 0.46 0.04 36.17 1.28Business and Other Services 17.00 5.00 .. 22.00 1.32 .. .. 0.92 .. 0.92 0.08 22.92 0.81Subtotal 61.68 23.25 0.04 84.97 5.01 .. 0.13 14.58 0.14 14.85 1.28 99.82 3.53PRODUCTION SECTORSAgriculture 93.65 24.23 0.02 117.89 7.07 .. .. 4.90 0.81 5.70 0.49 123.60 4.38Forestry 4.36 2.77 0.01 7.15 0.43 0.15 .. 1.93 .. 2.08 0.18 9.23 0.33Fishing 0.63 0.84 0.02 1.50 0.09 .. .. 0.52 .. 0.52 0.04 2.01 0.07Industry 24.52 10.45 0.01 34.97 2.01 .. .. 2.11 .. 2.11 0.18 37.08 1.31Mineral Resources and Mining 3.10 1.09 .. 4.19 0.25 .. .. 0.96 .. 0.96 0.08 5.15 0.18Construction 1.51 0.35 .. 1.86 0.11 .. .. .. .. .. .. 1.86 0.07Trade Policy and Regulations 9.15 1.96 .. 11.12 0.67 .. .. 4.06 .. 4.06 0.35 15.18 0.54Tourism 0.25 0.62 .. 0.88 0.05 .. .. 0.14 .. 0.14 0.01 1.02 0.04Subtotal 137.18 42.31 0.07 179.55 10.77 0.15 .. 14.61 0.81 15.57 1.35 195.13 6.91
Table 5: Canadian bilateral Official Development assistance by Sector (2005-06) (In millions of Canadian dollars)
Table 5 (continues) h

STATISTICAL ANNEx 123
MULTISECTOR/ CROSSCUTTING3
Multisector Aid 18.58 0.09 13.39 32.06 1.92 .. .. .. .. .. .. 32.06 1.14Environment Policy and Administrative Management 15.28 2.69 0.10 18.07 1.08 0.04 .. .. .. 0.04 0.00 18.11 0.64
Rural Development 11.85 4.24 .. 16.09 0.97 0.15 .. .. .. 0.15 0.01 16.24 0.58General Environment Protection 8.71 0.67 .. 9.37 0.56 .. .. 5.61 0.14 5.74 0.50 15.12 0.54Other Multisector/Crosscutting 22.00 3.64 0.01 25.65 1.54 1.09 0.62 38.90 3.33 43.95 3.80 69.59 2.46Subtotal 76.42 11.33 13.50 101.24 6.07 1.28 0.62 44.51 3.47 49.88 4.31 151.12 5.35COMMODITY AID AND GENERAL PROGRAMME ASSISTANCEGeneral Budget Support 28.05 .. .. 28.05 1.68 .. .. .. .. .. .. 28.05 0.99Developmental Food Aid /Food Security Assistance 1.73 0.09 0.01 1.83 0.11 .. .. .. .. .. .. 1.83 0.06
Other Commodity Assistance 0.07 0.02 .. 0.09 0.01 .. .. .. .. .. .. 0.09 0.00Subtotal 29.85 0.11 0.02 29.97 1.80 .. .. .. .. .. .. 29.97 1.06ACTION RELATING TO DEBT 18.00 0.11 .. 18.11 1.09 .. .. .. 581.39 581.39 50.27 599.50 21.23HUMANITARIAN AIDEmergency Food Aid 0.17 .. .. 0.17 0.01 .. .. .. .. .. .. 0.17 0.01Material Relief Assistance and Services 8.90 0.21 .. 9.11 0.55 .. .. .. .. .. .. 9.11 0.32Reconstruction Relief and Rehabilitation 17.20 0.31 .. 17.51 1.05 .. .. 0.08 0.19 0.28 0.02 17.79 0.63Other Humanitarian Aid 15.01 0.01 .. 15.03 0.90 .. .. 0.96 10.43 11.39 0.98 26.50 0.94Subtotal 41.28 0.53 .. 41.82 2.51 .. .. 1.04 10.62 11.67 1.01 53.57 1.90ADMINISTRATIVE COSTS OF DONORS 70.35 16.48 118.07 204.90 12.29 1.72 0.79 27.07 0.48 30.06 2.60 234.96 8.32SUPPORT TO NON-GOVERNMENTAL ORGANISATIONS (NGOs) 5.25 22.77 0.03 28.05 1.68 .. 0.31 1.60 0.51 2.42 0.21 30.46 1.08
REFUGEES IN DONOR COUNTRIES .. .. .. .. .. .. .. .. 211.65 211.65 18.30 211.65 7.49PROMOTION OF DEVELOPMENT AWARENESS 0.21 8.04 3.50 11.76 0.71 53.01 .. .. .. 53.01 4.58 64.77 2.29
ALLOCABLE BY SECTOR 1,271.33 270.23 125.74 1,667.31 100.00 79.41 8.75 134.70 933.71 1,156.58 100.00 2,823.89 100.00
Notes: 1 Includes aid program of communications branch, policy branch and the office for democratic governance. It also includes bilateral loan repayments and corporate administrative costs.
2 This column includes aid expenditures from the Federation of Canadian Municipalities; the Department of National Defence for DART humanitarian assistance in Pakistan (10.33 C$ millions); the Department of Finance for bilateral debt relief (581 C$ millions); and the costs of refugees during their first year in Canada.
3 Expenditures for Gender Equality as a crosscutting theme are integrated across all CIDA programming within all sectors.
Source: CIDA, Statistical Report on ODA 2005-06
Table 5 h BILATERAL
CIDA OGDs/Other Official Canadian Sources
TOTAL Country
to CountrySector
Geographic
ProgramsCanadian
Partnership Other1 SUBTOTAL DFAIT ICHRDD IDRC Others2 Subtotal
$ $ $ $ % $ $ $ $ $ % $ %

CANADIAN DEvELoPMENT REPoRT 2009 — FINANCING DEvELoPMENT IN TIMES oF GLoBAL CRISIS124
Table 6: Canadian Technical assistance to Developing Countries (2000-2005)
Table 6.1.a: experts on assignments abroad by area of expertise and Gender
Area of ExpertiseTotal Experts 2005 Gender
Ratio M/FFemale Male Total
Government and Civil Society 1,044 1,254 2,298 1.20 Education 869 725 1,594 0.83 Health 449 410 859 0.91 Agriculture 182 391 573 2.15 Multisector1 240 311 551 1.30 Business and Other Services 150 189 339 1.26 Water Supply and Sanitation 79 225 304 2.85 Population Policies/Programs and Reproductive Health 176 90 266 0.51
Social Infrastructure and Services 144 119 263 0.83 Banking and Financial Services 95 159 254 1.67 Support to NGOs 109 101 210 0.93 Energy Generation and Supply 27 149 176 5.52 Industry 20 92 112 4.60 Trade Policy and Regulations 40 71 111 1.78 Mineral Resources and Mining 17 63 80 3.71 Communications 37 41 78 1.11 Tourism 31 46 77 1.48 Forestry 17 42 59 2.47 Transport and Storage 6 32 38 5.33 Fisheries 13 19 32 1.46 Construction - 13 13 .. Unallocated / Unspecified 10 5 15 0.50 Total 3,755 4,547 8,302 1.21
Area of ExpertiseTotal Experts 2000 ** Gender
Ratio M/FFemale Male Total
Education 1,190 1,297 2,487 1.09 Government and Civil Society 618 1,601 2,219 2.59 Multisector * 512 705 1,217 1.38 Agriculture 164 458 622 2.79 Industry 94 488 582 5.19 Health 311 264 575 0.85 Population Policies 242 266 508 1.01 Communications 157 279 436 1.78 Energy 54 373 427 6.91 Water Supply and Sanitation 55 157 212 2.85 Transport 30 152 182 5.07 Forestry 24 148 172 6.17 Mineral Resources and Mining 14 104 118 7.43 Fisheries 21 77 98 3.67 Social Infrastructure and Services 8 51 59 6.38 Commodity Aid/ Gen. Prog Assistance 8 12 20 1.50
Business and Other Services 1 3 4 3.00 Total 3,503 6,435 9,938 1.84
Region of AssignmentTotal Experts 2005 Gender
Ratio M/FFemale Male Total
Africa and Middle East 1,204 1,496 2,700 1.80 Americas 1,341 1,212 2,553 2.11 Asia and Oceania 933 1,353 2,286 1.69 Europe 243 398 641 1.61 Multinational 34 88 122 1.39 Total 3,755 4,547 8,302 1.21
Table 6.1.b: experts on assignment abroad by Region of assignment and Gender
Region of AssignmentTotal Experts 2000 ** Gender
Ratio M/FFemale Male Total
Asia and Oceania*** 992 1,970 2,962 1.99 Americas 1,105 1,727 2,832 1.56 Africa and Middle East 900 1,533 2,433 1.70 Europe 490 1,182 1,672 2.41 Multinational 16 23 39 1.44 Total 3,503 6,435 9,938 1.84
Table 6.1.c: experts on assignment abroad by Region of assignment and Duration
Region of AssignmentTotal Experts 2005
Short-term Experts Long-term Experts Total
Africa and Middle East 1,826 727 2,553Americas 1,831 869 2,700Asia and Oceania 1,631 655 2,286Europe 534 107 641Multinational 118 4 122Total 5,940 2,362 8,302.00
Region of AssignmentTotal Experts 2000 **
Short-term Experts Long-term Experts Total
Asia and Oceania*** 2,154 808 2,962Americas 2,080 752 2,832Africa and Middle East 1,570 863 2,433Europe 1,344 328 1,672Multinational 37 2 39Total 7,185 2,753 9,938.00
Notes: 1 Multisector includes crosscutting themes such as Environment and Gender Equality. * Technical Cooperation Experts either fully or partially supported by CIDA, working for CIDA directly, or through private firms, institutions, associations, and
non-governmental organizations. ** Tables 6.1.a, 6.1.b and 6.1.c for 2000 include 888 experts from developing countries. The total also includes 1,119 experts sent to non-ODA countries in Central
and Eastern Europe as well as 65 experts sent to non-ODA more advanced developing countries. CIDA’s Statistical report 2005-06 does not specify the number of experts from developing countries.
*** Only 37 of these experts are assigned in Oceania (20 women and 17 men; Gender Ratio:0.85). In the 2005-06 CIDA Statistical Report, Asia and Oceania are considered one region.
Sources: CIDA, Statistical Report on ODA 2005-06

STATISTICAL ANNEx 125
Chart 6.1: Canadian Technical assistance to Developing Countries
Note: M/F Ratios above the Gender Equality Line indicate a larger number of male than female experts.
Chart 6.1.a: experts on assignment by area of expertise
Chart 6.1.b: experts on assignment by expertise and Gender
Government and Civil Society2,298
Education1,594
Health859
Agriculture573
Multisector551
Business andOther Services339
Water Supplyand Sanitation304
Population Policies/Programs and Reproductive Health266
Social Infrastructureand Services263
Banking andFinancial Services254
Support to NGOs210
Other791
Energy Generation and Supply 176
Industry 112
Trade Policy and Regulations 111
Mineral Resources and Mining 80
Communications 78
Tourism 77
Forestry 59
Transport and Storage 38
Fisheries 32
Construction 13
Unallocated/Unspecified 15
No. of experts
1,044869
449
182 240
79176 218
1,254
189 22590
0
0.5
1
1.5
2
2.5
3
0
200
400
600
800
1,000
1,200
1,400
Governmentand
Civil Society
Education Health Agriculture Multisector Businessand OtherServices
WaterSupply
andSanitation
Population Policies/
Programs andReproductive
Health
SocialInfrastructure
andServices
Bankingand
FinancialServices
Supportto
NGOs
Other
No. of experts M/F Ratio
Female Experts (Left Axis) Male Experts (Left Axis) M/F Ratio (Right Axis) Gender Equality Line (Right Axis)
150 144 109
725
410 391311
119 159 101
573
95
Note: M/F Ratios above the Gender Equality Line indicate a larger number of male than female experts.
Chart 6.1.c: experts on assignment by Region and Gender
1,204
243
34
1,212
398
0
0.5
1
1.5
2
2.5
0
200
400
600
800
1,000
1,200
1,400
1,600
Africa andMiddle East
Americas Asia and Oceania Europe Multinational
No. of experts M/F Ratio
Female Experts (Left Axis)
Male Experts (Left Axis) M/F Ratio (Right Axis)
Gender Equality Line (Right Axis)
1,341
933
1,4961,353
88

CANADIAN DEvELoPMENT REPoRT 2009 — FINANCING DEvELoPMENT IN TIMES oF GLoBAL CRISIS126
Field of Study
Total Students and Trainees 2005
Female Male Total Ratio M/F
Government and Civil Society 3,865 6,022 9,887 1.56 Education 4,035 2,946 6,981 0.73 Health 3,325 3,292 6,617 0.99 Business and Other Services 1,734 1,958 3,692 1.13 Multisector 1,265 812 2,077 0.64 Support to NGOs 944 859 1,803 0.91 Agriculture 565 966 1,531 1.71 Other Social Infrastructure and Services 506 788 1,294 1.56
Population Policies/Programs and Reproductive Health 463 409 872 0.88
Water Supply and Sanitation 213 462 675 2.17 Trade Policy and Regulations 193 423 616 2.19 Communications 92 157 249 1.71 Forestry 82 138 220 1.68 Tourism 81 66 147 0.81 Banking and Financial Services 58 82 140 1.41 Energy Generation and Supply 19 121 140 6.37 Mineral Resources and Mining 29 96 125 3.31 Fishing 29 49 78 1.69 Transport and Storage 7 52 59 7.43 Industry 13 23 36 1.77 Construction 0 6 6 .. Unallocated/unspecified 0 3 3 .. Total 17,518 19,730 37,248 1.13
Table 6.2.a: CIDa’s Investment in Training and education by Field of Study and Gender
Field of Study
Total Students and Trainees 2000
Female Male TotalRatio
M/F
Environment 1,037 3,135 4,172 3.02 Management and Administration 976 1,987 2,963 2.04
Health and Nutrition 703 564 1,267 0.80 Education 586 581 1,167 0.99 Human Settlements, Urban Dev. 267 883 1,150 3.31
Social Sciences 499 453 952 0.91 Communications 265 519 784 1.96 Law 285 443 728 1.55 Engineering and Technology 98 378 476 3.86 Agriculture, Animal Husbandry 113 353 466 3.12 Economics 170 205 375 1.21 Energy 45 302 347 6.71 International Trade 80 221 301 2.76 Mathematics and Statistics 85 116 201 1.36 Transportation 36 124 160 3.44 Finance and Credit 67 73 140 1.09 Computer Science 37 101 138 2.73 Forestry 30 93 123 3.10 Geology, Mining, Metallurgy 20 92 112 4.60 Natural Sciences 39 59 98 1.51 Accounting and Auditing 30 55 85 1.83 Arts and Humanities 29 22 51 0.76 Fisheries 18 33 51 1.83 Languages and Linguistics 25 13 38 0.52 Architecture 9 11 20 1.22 Tourism, Hotel Mngt, Catering 10 10 20 1.00 Surveying 5 14 19 2.80 Geography 4 13 17 3.25 Customs and Excise 1 4 5 4.00 Secretarial and Clerical 0 1 1 .. Total 5,569 10,858 16,427 1.95
Table 6.2.b: CIDa’s Investment in Training and education by Region of Origin, location of Study and Gender
Location of Study
Total Students and Trainees 2005
Africa and Middle East Americas
Asia and Oceania Europe Total
Country of Origin 11,655 9,750 8,064 889 30,358 Canada 941 682 1,442 513 3,578 Third Country 1,242 446 1,580 44 3,312 Total 13,838 10,878 11,086 1,446 37,248 Of which:
Female 6,151 5,962 4,643 762 17,518 Male 7,687 4,916 6,443 684 19,730
Gender Ratio (M/F) 1.25 0.82 1.39 0.90 1.13
Location of Study
Total Students and Trainees 2000
Africa and Middle East Americas Asia Europe Total
Country of Origin 927 1,099 6,301 970 9,297 Canada 1,357 1,720 1,785 1,190 6,052 Third Country 167 310 211 390 1,078 Total 2,451 3,129 8,297 2,550 16,427 Of which:
Female 775 1,330 2,154 1,127 5,386 Male 1,676 1,799 5,960 1,423 10,858
Gender Ratio (M/F) 2.16 1.35 2.77 1.26 2.02
Notes: Tables 6.2.a and 6.2.b include both fully and partially supported students and trainees. The total includes 48 trainees and 3 students from non-ODA more advanced developing countries as well as 2,141 trainees and 6 students from non-ODA countries
in Central and Eastern Europe.
Sources: CIDA, Statistical Report on ODA 2005-06; CIDA, Statistical Report on ODA 2000-01

STATISTICAL ANNEx 127
Government andCivil Society9,887
Education6,981
Health6,617
Multisector2,077Business and
Other Services3,692
Population Policies/Programs and Reproductive Health872
Other Social Infrastructureand Services1,294
Supportto NGOs1,803
Other2,494
Energy Generation and Supply 140
Water Supply and Sanitation 675
Trade Policy and Regulations 616
Banking and Financial Services 140
Mineral Resources and Mining 125
Communications 249
Tourism 147
Forestry 220
Transport and Storage 59
Fishing 78
Industry 36
Construction 36
Unallocated / Unspecified 3
No. of students and trainees
Agriculture1,531
4,0353,325
1,7341,265
944
213 193 410
6,022
2,946 3,292
1,958
966409 423
0
0.5
1
1.5
2
2.5
0
1,000
2,000
3,000
4,000
5,000
6,000
7,000
Governmentand
Civil Society
Education Health Businessand OtherServices
Multisector Supportto
NGOs
Agriculture Other SocialInfrastructure
andServices
PopulationPolicies/Programs
andReproductive
Health
Water Supplyand
Sanitation
Trade Policy and
Regulations
Other
No. of students and trainees M/F Ratio
812 859 788 793
3,865
565 506 463 462
Note: M/F Ratios above the Gender Equality Line indicate a larger number of male than female experts.
6,151 5,962
4,916
6,443
0
0.2
0.4
0.6
0.8
1
1.2
1.4
1.6
0
1,000
2,000
3,000
4,000
5,000
6,000
7,000
8,000
9,000
Africa and Middle East Americas Asia and Oceania Europe
No. of students and trainees M/F Ratio Female Students and Trainees (Left Axis)
Male Students and Trainees (Left Axis)
M/F Ratio (Right Axis)
Gender Equality Line (Right Axis)
7,687
4,643
762 684
Sources: CIDA, Statistical Report on ODA, 2005-06
Chart 6.2.a: Students and Trainees by Field of Study (2005-06)
Chart 6.2.b: Students and Trainees by Field of Study and Gender (2005-06)
Chart 6.2.c: Students and Trainees by location of Study and Gender (2005-06)

CANADIAN DEvELoPMENT REPoRT 2009 — FINANCING DEvELoPMENT IN TIMES oF GLoBAL CRISIS128
UN and other Multilateral
Organizations and Initiatives
International Financial
Institutions(IFIs) and Regional Development
Banks
Multilateral from other
agencies
Total Multilateral
(All agencies)
Multilateral/ Bilateral
Ratio
UN Agencies/ IFIs and
Regional Banks Ratio
Regions and Countries 1 2 3 4 5 6
SUB-SAHARAN AFRICAAngola 12.61 0.05 1.49 14.15 3.31 252.20Benin 4.00 3.24 2.79 10.03 1.34 1.23Botswana 1.60 -0.14 -0.02 1.44 0.80 ..Burkina Faso 5.53 5.52 6.61 17.66 0.99 1.00Burundi 5.98 0.48 1.34 7.80 1.58 12.46Cameroon 5.52 2.20 3.05 10.77 0.22 2.51Cape Verde 0.15 0.79 1.11 2.05 6.83 0.19Central African Republic 4.66 0.39 0.17 5.22 10.22 11.95Chad 2.64 1.92 3.54 8.10 1.90 1.38Comoros 0.29 0.13 .. 0.42 2.75 2.23Congo, Dem. Rep. 16.38 2.24 19.09 37.71 1.17 7.31Congo, Rep. 0.87 1.21 1.70 3.78 0.14 0.72Côte d’Ivoire 5.84 0.19 3.19 9.22 1.88 30.74Equatorial Guinea 0.68 0.23 -0.05 0.86 3.74 2.96Eritrea 2.55 1.32 3.13 7.00 2.17 1.93Ethiopia 27.23 12.35 12.62 52.20 0.60 2.20Gabon 1.18 0.09 .. 1.27 0.52 13.11Gambia 2.83 0.84 0.82 4.49 4.16 3.37Ghana 10.76 5.56 17.54 33.86 0.48 1.94Guinea 3.49 0.50 2.27 6.26 0.67 6.98Guinea-Bissau 1.10 0.36 0.72 2.18 2.58 3.06Kenya 8.10 1.92 -3.18 6.84 0.28 4.22Lesotho 3.42 -0.14 0.40 3.68 0.92 ..Liberia 3.86 .. .. 3.86 1.48 ..Madagascar 7.87 1.54 11.18 20.59 7.05 5.11Malawi 8.83 2.69 5.29 16.81 0.99 3.28Mali 3.41 4.88 6.97 15.26 0.53 0.70Mauritania 1.23 0.66 2.91 4.80 2.27 1.86Mauritius 0.41 0.14 -0.03 0.52 1.49 2.93Mozambique 4.69 7.66 13.43 25.78 0.48 0.61Namibia 4.47 -0.02 .. 4.45 3.06 ..Niger 5.62 4.05 4.85 14.52 0.92 1.39Nigeria 16.48 1.28 11.84 29.60 1.30 12.88Rwanda 10.57 3.64 6.11 20.32 2.43 2.90São Tomé and Principe 0.43 0.24 0.14 0.81 3.42 1.79Senegal 5.35 1.92 11.10 18.37 0.89 2.79Seychelles 0.11 0.19 .. 0.30 1.58 0.58Sierra Leone 4.04 1.96 2.05 8.05 1.21 2.06Somalia 5.36 .. .. 5.36 0.86 ..South Africa 9.65 .. .. 9.65 0.73 ..Sudan 13.03 .. -0.06 12.97 0.18 ..Swaziland 6.62 -0.09 -0.01 6.52 1.65 ..Tanzania 22.03 11.96 17.38 51.37 1.05 1.84Togo 3.15 0.21 0.39 3.75 1.66 15.00Uganda 14.97 6.17 17.67 38.81 2.27 2.43Zambia 16.95 1.67 13.86 32.48 0.69 10.15Zimbabwe 10.99 .. .. 10.99 0.90 ..
Total Sub-Saharan Africa 307.53 92.00 203.40 602.93 0.79 3.34
MIDDLE EAST and NORTH AFRICAAlgeria 0.98 0.06 .. 1.04 0.51 16.33Djibouti 2.37 0.25 0.41 3.03 3.34 9.48Egypt 1.62 0.05 1.34 3.01 0.16 32.40Iran 0.83 .. .. 0.83 .. ..
Table 7: Canadian Multilateral Official Development assistance by Channel and by Country (2005-06) (In millions of Canadian dollars)
Table 7 (continues) h

STATISTICAL ANNEx 129
Iraq 0.26 .. .. 0.26 0.00 ..Jordan 2.85 .. -0.12 2.73 0.41 ..Lebanon 1.46 0.05 .. 1.51 0.40 29.20Libya 0.10 .. .. 0.10 0.16 ..Morocco 1.68 0.20 -0.06 1.82 0.29 8.40Syria 1.02 .. .. 1.02 16.00 ..Tunisia 0.94 0.11 -0.10 0.95 0.83 8.55West Bank and Gaza 6.14 .. .. 6.14 0.20 ..Yemen 3.35 .. 4.92 8.27 6.61 ..
Total Middle East and North Africa 23.60 0.72 6.39 30.71 0.06 32.78
SOUTH ASIAAfghanistan 3.81 .. 9.65 13.46 0.13 ..Bangladesh 7.96 .. 15.78 23.74 0.38 ..Bhutan 0.64 .. 0.42 1.06 0.59 ..India 12.31 .. 27.77 40.08 1.04 ..Maldives 0.48 .. 0.44 0.92 1.24 ..Nepal 1.84 .. 0.76 2.60 0.20 ..Pakistan 6.19 .. 27.58 33.77 0.39 ..Sri Lanka 2.12 .. 5.50 7.62 0.55 ..
Total South Asia 35.35 .. 87.90 123.25 0.38 ..
EAST ASIA and the PACIFICCambodia 7.84 0.04 2.01 9.89 1.05 196.00China 20.54 .. -7.06 13.48 0.36 ..Fiji 0.43 .. .. 0.43Indonesia 8.88 .. 1.93 10.81 0.22 ..Korea, Dem. Rep. 1.21 .. .. 1.21 0.67 ..Laos 3.50 0.04 2.01 5.55 1.52 87.50Malaysia 0.29 .. .. 0.29 1.81 ..Mongolia 1.18 .. 0.79 1.97 1.61 ..Myanmar 5.98 .. .. 5.98 10.68 ..Papua New Guinea 1.85 .. -0.17 1.68 3.27 ..Philippines 4.44 .. -0.33 4.11 0.19 ..Samoa 0.23 .. 0.37 0.60 30.00 ..Solomon Islands 0.05 .. .. 0.05 0.20 ..Thailand 2.91 .. -0.16 2.75 0.65 ..Timor-Leste 0.68 .. 0.25 0.93 0.65 ..Tonga 0.01 .. 0.21 0.22 22.00 ..Vanuatu .. 0.04 -0.01 0.03 0.05 ..Vietnam 6.90 .. 20.13 27.03 0.82 ..
Total East Asia and the Pacific 66.92 0.12 19.97 87.01 0.53 557.67
EUROPE and CENTRAL ASIAAlbania 0.57 0.03 1.33 1.93 2.66 19.00Armenia 1.39 0.03 2.30 3.72 28.62 46.33Azerbaijan 1.15 .. 2.38 3.53 44.25 ..Belarus 0.17 .. .. 0.17 2.57 ..Bosnia and Herzegovina 0.72 .. 2.68 3.40 0.37 ..Bulgaria .. .. .. .. .. ..Croatia 1.26 0.03 .. 1.29 2.22 42.00Czech Republic .. .. .. .. .. ..Estonia .. .. .. .. .. ..Georgia 2.27 0.03 3.18 5.48 60.89 75.67Hungary .. .. .. .. .. ..Kazakhstan 2.06 .. .. 2.06 9.81 ..Kyrgyzstan 1.59 .. 2.16 3.75 14.42 ..Latvia .. .. .. .. .. ..Lithuania .. .. .. .. .. ..Macedonia, FYR 0.81 0.04 0.55 1.40 20.00 20.25Moldova 1.97 0.03 1.19 3.19 11.81 65.67
UN and other Multilateral
Organizations and Initiatives
International Financial
Institutions(IFIs) and Regional Development
Banks
Multilateral from other
agencies
Total Multilateral
(All agencies)
Multilateral/ Bilateral
Ratio
UN Agencies/ IFIs and
Regional Banks Ratio
Regions and Countries 1 2 3 4 5 6
Table 7 h
Table 7 (continues) h

CANADIAN DEvELoPMENT REPoRT 2009 — FINANCING DEvELoPMENT IN TIMES oF GLoBAL CRISIS130
Poland .. .. .. .. .. ..Romania .. .. .. .. .. ..Russia .. .. .. .. .. ..Serbia and Montenegro 1.61 .. 4.47 6.08 0.10 ..Slovak Republic .. .. .. .. .. ..Tajikistan 1.33 .. 1.24 2.57 0.36 ..Turkey 1.88 .. -0.28 1.60 .. ..Turkmenistan 0.31 .. .. 0.31 .. ..Ukraine 2.35 .. .. 2.35 0.12 ..Uzbekistan 1.95 .. .. 1.95 .. ..
Total Europe and Central Asia 23.39 0.19 21.20 44.78 0.48 123.11
LATIN AMERICA and the CARIBBEANArgentina 2.66 .. .. 2.66 2.08 ..Belize 0.32 1.39 .. 1.71 7.43 0.23Bolivia 1.85 .. 5.52 7.37 0.35 ..Brazil 6.00 .. .. 6.00 0.76 ..Chile 5.68 .. -0.03 5.65 1.97 ..Colombia 2.21 .. -0.03 2.18 0.21 ..Costa Rica 1.53 .. -0.01 1.52 0.49 ..Cuba 1.39 .. .. 1.39 0.15 ..Dominica 0.04 1.74 -0.11 1.67 6.19 0.02Dominican Republic 2.35 .. -0.03 2.32 1.26 ..Ecuador 2.74 .. -0.05 2.69 0.92 ..El Salvador 3.08 .. -0.04 3.04 0.81 ..Grenada 0.12 3.51 0.16 3.79 13.57 0.03Guatemala 3.82 .. .. 3.82 0.40 ..Guyana 1.40 4.19 -0.11 5.48 0.62 0.33Haiti 6.72 0.05 0.99 7.76 0.08 134.40Honduras 3.60 .. 8.16 11.76 0.51 ..Jamaica 1.05 1.02 .. 2.07 0.48 1.03Mexico 3.21 .. .. 3.21 0.45 ..Nicaragua 1.70 .. 4.67 6.37 0.47 ..Panama 0.17 .. .. 0.17 0.24 ..Paraguay 0.25 .. -0.07 0.18 0.20 ..Peru 6.64 .. .. 6.64 0.43 ..St. Kitts and Nevis 0.05 0.72 .. 0.77 38.50 ..St. Lucia 0.05 0.63 0.17 0.85 2.74 0.08St. Vincent and the Grenadines 0.05 -0.59 .. -0.54 .. ..Suriname 0.66 .. .. 0.66 4.40 ..Trinidad and Tobago 0.22 -0.18 .. 0.04 0.06 ..Uruguay 0.17 .. .. 0.17 0.23 ..Venezuela 0.15 .. .. 0.15 0.17 ..
Total Latin America and the Caribbean 59.88 12.48 19.19 91.55 0.37 4.80Regional Programs 31.59 17.27 14.63 63.49 0.11 1.83Total ODA Allocated 577.82 126.07 372.94 1,077.00 0.39 4.58Of which:
LDCs 269.70 79.89 207.07 556.66 0.67 3.38Low Income Countries 337.12 87.62 312.05 736.79 0.65 3.85Middle Income Countries 179.33 18.07 46.00 243.40 0.24 9.92
Unallocable by Country 85.62 0.98 68.42 155.02 0.34 87.37Total ODA 663.44 127.05 441.36 1, 231.89 0.38 5.22
Notes: Bold-italicized countries are not ODA eligible (see Technical Notes) but data on official assistance (OA) to these countries is included in this table. Italicized countries are identified as non independent countries at the time of writing (see Technical Notes). Source: CIDA, Statistical Report 2005-06
UN and other Multilateral
Organizations and Initiatives
International Financial
Institutions(IFIs) and Regional Development
Banks
Multilateral from other
agencies
Total Multilateral
(All agencies)
Multilateral/ Bilateral
Ratio
UN Agencies/ IFIs and
Regional Banks Ratio
Regions and Countries 1 2 3 4 5 6
Table 7 h

STATISTICAL ANNEx 131
Figure 7: Top 50 Recipients of Total Canadian allocated ODa (2005-06) *ODA includes Debt Relief
Bilateral Multilateral Total Canadian Aid Rank and Country C$ millions % C$ millions % C$ millions %
1 Iraq 467.25 14.47 0.26 0.02 467.51 10.48 2 Ethiopia 87.29 2.70 52.21 4.24 139.50 3.13 3 Pakistan 87.67 2.72 33.76 2.74 121.43 2.72 4 Afghanistan 101.86 3.16 13.46 1.09 115.32 2.59 5 Haiti 98.37 3.05 7.76 0.63 106.13 2.38 6 Ghana 70.34 2.18 33.85 2.75 104.19 2.34 7 Tanzania 48.74 1.51 51.37 4.17 100.11 2.24 8 Bangladesh 62.69 1.94 23.73 1.93 86.42 1.94 9 Sudan 72.01 2.23 12.96 1.05 84.97 1.91 10 Mozambique 53.82 1.67 25.77 2.09 79.59 1.78
Top 10 Total 1,150.04 35.62 255.13 20.71 1,405.17 31.50 11 Zambia 46.99 1.46 32.47 2.64 79.46 1.78 12 India 38.46 1.19 40.07 3.25 78.53 1.76 13 Congo, Dem. Rep. 32.18 1.00 37.71 3.06 69.89 1.57 14 Serbia and Montenegro 58.20 1.80 6.08 0.49 64.28 1.44 15 Indonesia 49.91 1.55 10.81 0.88 60.72 1.36 16 Cameroon 49.81 1.54 10.76 0.87 60.57 1.36 17 Vietnam 32.88 1.02 27.03 2.19 59.91 1.34 18 Uganda 17.11 0.53 38.81 3.15 55.92 1.25 19 Nigeria 22.78 0.71 29.60 2.40 52.38 1.17 20 China 37.31 1.16 13.48 1.09 50.79 1.14 21 Mali 28.91 0.90 15.27 1.24 44.18 0.99 22 Senegal 20.70 0.64 18.39 1.49 39.09 0.88 23 West Bank and Gaza 30.07 0.93 6.14 0.50 36.21 0.81 24 Burkina Faso 17.83 0.55 17.67 1.43 35.50 0.80 25 Honduras 23.24 0.72 11.76 0.95 35.00 0.78 26 Malawi 17.05 0.53 16.80 1.36 33.85 0.76 27 Kenya 24.41 0.76 6.83 0.55 31.24 0.70 28 Congo, Rep. 26.76 0.83 3.78 0.31 30.54 0.68 29 Niger 15.75 0.49 14.52 1.18 30.27 0.68 30 Rwanda 8.37 0.26 20.32 1.65 28.69 0.64
Top 30 Total 1,748.76 54.17 633.43 51.42 2,382.19 53.41 31 Bolivia 20.80 0.64 7.38 0.60 28.18 0.63 32 Philippines 21.28 0.66 4.11 0.33 25.39 0.57 33 Madagascar 2.92 0.09 20.59 1.67 23.51 0.53 34 Zimbabwe 12.17 0.38 10.99 0.89 23.16 0.52 35 South Africa 13.24 0.41 9.65 0.78 22.89 0.51 36 Egypt 18.99 0.59 3.01 0.24 22.00 0.49 37 Peru 15.27 0.47 6.64 0.54 21.91 0.49 38 Sri Lanka 13.82 0.43 7.63 0.62 21.45 0.48 39 Ukraine 19.03 0.59 2.35 0.19 21.38 0.48 40 Nicaragua 13.66 0.42 6.37 0.52 20.03 0.45 41 Cambodia 9.42 0.29 9.89 0.80 19.31 0.43 42 Angola 4.27 0.13 14.15 1.15 18.42 0.41 43 Benin 7.50 0.23 10.02 0.81 17.52 0.39 44 Nepal 13.33 0.41 2.60 0.21 15.93 0.36 45 Guinea 9.31 0.29 6.26 0.51 15.57 0.35 46 Sierra Leone 6.65 0.21 8.04 0.65 14.69 0.33 47 Guyana 8.79 0.27 5.48 0.44 14.27 0.32 48 Côte d’Ivoire 4.89 0.15 9.21 0.75 14.10 0.32 49 Brazil 7.86 0.24 6.00 0.49 13.86 0.31 50 Guatemala 9.62 0.30 3.82 0.31 13.44 0.30
Top 50 Total 1,981.58 61.38 787.62 63.94 2,769.20 62.09 Total Canadian Aid 3,228.38 1,231.89 4,460.27
Sources: CIDA, Statistical Report on ODA 2005-06

CANADIAN DEvELoPMENT REPoRT 2009 — FINANCING DEvELoPMENT IN TIMES oF GLoBAL CRISIS132
Total Exports
2007
Total Imports
2007
Balance of Trade
2007
Total Exports
1997
Total Imports
1997
Balance of Trade
1997
Real % Change
Per Year in Exports
1997-2007
Real % Change
Per Year in Imports 1997-2007
Total Tariff Revenue
Collected1 2007
Average Tariff Rate
(%) 2007
(2007 prices)
(2007 prices)
(2007 prices)
Regions and Countries 1 2 3 4 5 6 7 8 9 10
SUB-SAHARAN AFRICAAngola 82.50 1,196.00 -1,113.51 10.66 0.09 10.57 23 159 0.00 0.00Benin 10.77 0.24 10.53 10.64 0.01 10.64 0 43 0.00 0.02Botswana 12.24 109.52 -97.28 31.50 1.72 29.78 -9 52 0.00 0.00Burkina Faso 13.19 0.31 12.89 1.29 0.02 1.26 26 31 0.00 0.29Burundi 1.94 0.07 1.87 0.06 0.13 -0.07 42 -6 0.00 2.23Cameroon 19.50 7.17 12.33 3.51 8.24 -4.72 19 -1 0.05 0.72Cape Verde 0.15 0.02 0.13 0.64 0.07 0.57 -13 -11 0.00 1.39Central African Republic 0.48 0.24 0.23 0.24 0.23 0.00 7 0 0.01 2.48Chad 14.70 0.03 14.68 0.25 0.07 0.18 50 -10 0.00 2.53Comoros 0.47 0.04 0.43 0.08 0.04 0.03 20 1 0.00 1.10Congo, Dem. Rep. 39.52 0.30 39.21 7.17 11.05 -3.87 19 -30 0.00 1.39Congo, Rep. 25.96 4.07 21.89 3.13 8.34 -5.21 24 -7 0.01 0.13Côte d’Ivoire 18.21 283.39 -265.18 6.92 66.96 -60.03 10 16 0.13 0.05Equatorial Guinea 2.46 232.85 -230.39 .. 0.10 .. .. 117 0.00 0.00Eritrea 0.96 0.02 0.94 .. .. .. .. .. 0.00 0.07Ethiopia 16.20 8.52 7.68 9.64 7.99 1.65 5 1 0.02 0.28Gabon 19.70 1.72 17.98 9.45 0.12 9.34 8 31 0.00 0.08Gambia 0.77 0.08 0.69 0.24 0.15 0.09 12 -6 0.00 1.13Ghana 157.77 21.72 136.05 66.81 14.36 52.45 9 4 0.07 0.30Guinea 10.32 43.39 -33.07 7.74 28.60 -20.86 3 4 0.00 0.01Guinea-Bissau 0.12 0.00 0.11 0.33 0.19 0.14 -10 -32 0.00 0.95Kenya 69.45 16.73 52.72 34.28 19.38 14.91 7 -2 0.33 2.00Lesotho 0.32 7.81 -7.49 0.14 8.55 -8.42 9 -1 0.15 1.92Liberia 8.35 19.76 -11.41 1.48 0.04 1.44 19 87 0.01 0.02Madagascar 10.96 18.29 -7.33 0.71 6.24 -5.54 32 11 0.58 3.15Malawi 5.16 1.75 3.41 8.24 3.18 5.06 -5 -6 0.01 0.80Mali 7.82 0.46 7.37 11.00 14.82 -3.82 -3 -29 0.00 2.18Mauritania 8.92 0.76 8.15 0.61 0.12 0.49 31 20 0.01 1.96Mauritius 5.12 11.46 -6.34 5.01 16.51 -11.41 0 -4 0.68 5.93Mozambique 17.81 0.25 17.56 20.42 1.26 19.16 -1 -15 0.00 0.64Namibia 5.09 135.43 -130.34 0.55 17.91 -17.36 25 22 0.00 0.00Niger 6.49 0.99 5.50 10.06 9.08 0.99 -4 -20 0.02 2.38Nigeria 184.55 290.01 -105.46 94.44 562.18 -467.75 7 -6 0.02 0.01Rwanda 1.78 0.29 1.49 4.34 0.25 4.01 -9 2 0.00 0.50São Tomé and Principe 0.12 0.01 0.11 0.05 0.05 0.00 9 -13 0.00 3.97Senegal 34.66 1.19 33.48 17.02 3.84 13.18 7 -11 0.00 0.30Seychelles 1.25 3.91 -2.67 0.33 1.73 -1.39 14 9 0.05 1.28Sierra Leone 11.70 11.80 -0.10 1.83 10.59 -8.76 20 1 0.03 0.22Somalia 1.75 0.05 1.70 1.02 0.09 0.93 6 -7 0.00 0.26South Africa 786.16 1,041.79 -255.63 335.81 537.22 -201.41 9 7 3.09 0.31Sudan 210.13 64.72 145.42 24.19 0.08 24.11 24 95 0.00 0.00Swaziland 6.05 2.48 3.57 0.07 5.79 -5.72 56 -8 0.10 4.15Tanzania 46.56 2.13 44.43 15.08 3.14 11.94 12 -4 0.02 0.71Togo 14.77 2.45 12.32 7.05 58.98 -51.93 8 -27 0.00 0.17Uganda 13.18 2.58 10.60 8.21 11.07 -2.87 5 -14 0.00 0.15Zambia 67.70 0.35 67.35 6.62 34.85 -28.23 26 -37 0.00 1.24Zimbabwe 6.71 3.14 3.57 12.60 18.98 -6.38 -6 -17 0.01 0.27
Total Sub-Saharan Africa 1,980.49 3,550.33 -1,569.84 791.55 1,494.39 -702.74 10 9 5.44 0.15
Table 8 (continues) h
Table 8: Canadian balance of Merchandise Trade with Developing Countries (2007) (In millions of Canadian dollars)

STATISTICAL ANNEx 133
MIDDLE EAST and NORTH AFRICA Algeria 505.31 5,071.17 -4,565.86 563.90 659.43 -95.53 -1 23 0.01 0.00Bahrain 40.62 8.44 32.19 9.76 2.58 7.17 15 13 0.13 1.48Djibouti 1.16 0.00 1.16 0.72 0.01 0.71 5 -21 0.00 0.46Egypt 348.17 161.28 186.88 168.22 31.34 136.88 8 18 4.43 2.76Iran 268.34 44.71 223.62 659.69 546.42 113.27 -9 -22 0.30 0.68Iraq 217.47 1,516.75 -1,299.29 1.12 143.09 -141.97 69 27 0.00 0.00Jordan 60.43 15.96 44.46 13.34 0.96 12.39 16 33 1.72 10.79Kuwait 114.89 1.70 113.18 50.22 2.13 48.09 9 -2 0.01 0.83Lebanon 68.57 15.57 53.00 56.94 6.12 50.82 2 10 0.25 1.81Libya 195.52 0.00 195.52 198.81 0.00 198.81 0 -15 0.00 34.80Morocco 243.48 218.02 25.46 181.58 70.99 110.59 3 12 3.93 1.80Oman 117.75 3.31 114.43 13.45 0.91 12.54 24 14 0.31 3.90Qatar 90.74 0.31 90.43 14.78 40.86 -26.08 20 -39 0.01 2.13Saudi Arabia 682.20 1,871.27 -1,189.06 505.24 699.51 -194.27 3 10 0.31 0.00Syria 64.92 80.36 -15.43 21.97 1.48 20.49 11 49 0.21 0.26Tunisia 110.57 49.83 60.73 77.34 9.92 67.42 4 18 3.20 6.44United Arab Emirates 1,131.32 30.47 1,100.85 235.87 14.74 221.12 17 8 1.16 3.86Yemen 27.14 0.18 26.96 9.12 31.23 -22.11 12 -40 0.00 0.08
Total Middle East and North Africa 4,288.59 9,089.34 -4,800.75 2,782.05 2,261.71 520.34 4 15 15.99 0.18
SOUTH ASIAAfghanistan 13.58 0.76 12.82 4.75 0.88 3.86 11 -2 0.03 4.14Bangladesh 355.83 542.40 -186.56 86.82 130.67 -43.85 15 15 8.49 1.57Bhutan 0.31 0.02 0.29 .. 0.06 .. .. -13 0.00 2.88India 1,762.31 1,979.83 -217.52 444.64 802.55 -357.90 15 10 99.39 5.02Maldives 6.45 0.61 5.84 8.57 0.21 8.36 -3 11 0.03 5.22Nepal 11.37 14.07 -2.70 4.72 5.89 -1.17 9 9 0.31 2.21Pakistan 450.35 242.94 207.40 127.42 222.54 -95.12 14 1 30.08 12.39Sri Lanka 247.00 111.31 135.69 49.32 89.95 -40.62 18 2 11.44 10.29
Total South Asia 2,847.20 2,891.93 -44.73 726.24 1,252.74 -526.44 15 9 149.78 5.18
EAST ASIA and the PACIFIC Brunei 3.03 2.09 0.93 3.16 0.06 3.10 0 43 0.33 15.83Cambodia 5.70 202.39 -196.69 1.78 4.48 -2.69 12 46 7.19 3.55China 9,269.34 38,295.54 -29,026.20 2,181.06 6,847.85 -4,666.78 16 19 1,516.68 3.96Fiji 4.82 7.49 -2.67 11.25 2.66 8.59 -8 11 0.13 3.59Hong Kong, China 1,542.46 532.13 1,010.33 1,586.65 1,364.39 222.25 0 -9 16.00 3.03Indonesia 989.11 993.71 -4.59 726.14 879.34 -153.20 3 1 43.27 4.36Kiribati (includes Tuvalu) 0.23 0.05 0.17 .. 0.00 .. .. 32 0.00 4.81Korea, Dem. Rep. 20.22 0.16 20.06 7.77 0.15 7.62 10 1 0.05 33.50Laos 0.72 6.62 -5.89 0.24 8.56 -8.32 12 -3 0.07 1.13Malaysia 591.58 2,916.45 -2,324.87 633.19 2,150.28 -1,517.09 -1 3 29.00 0.99Mongolia 10.19 192.74 -182.55 .. .. .. .. .. 0.21 0.11Myanmar 1.29 7.91 -6.63 3.28 21.81 -18.53 -9 -10 0.31 3.90Papua New Guinea 3.62 3.31 0.32 22.03 1.89 20.15 -17 6 0.00 0.06Philippines 458.86 765.72 -306.86 386.40 783.50 -397.10 2 0 20.63 2.70Samoa (Western) 0.32 0.31 0.00 0.10 0.92 -0.82 12 -10 0.00 0.26Solomon Islands 0.24 0.15 0.09 0.15 0.02 0.13 5 20 0.01 4.80Singapore 913.56 1,492.39 -578.82 495.99 1,268.26 -772.27 6 2 4.40 0.29Thailand 592.92 2,300.01 -1,707.09 422.26 1,271.52 -849.26 4 6 50.93 2.22Timor-Leste 0.31 1.34 -1.03 .. .. .. .. .. 0.01 0.38Tonga 0.57 0.09 0.48 0.03 0.05 -0.02 33 6 0.00 0.48Vanuatu (New Hebrides) 0.27 0.06 0.21 0.12 0.00 0.12 8 39 0.00 0.23Vietnam 288.70 758.17 -469.47 47.24 161.54 -114.30 20 17 64.24 8.48
Total East Asia and the Pacific 14,698.07 48,478.83 -33,780.76 6,528.85 14,767.29 -8,238.44 9 13 1,753.46 3.62
Table 8 h
Total Exports
2007
Total Imports
2007
Balance of Trade
2007
Total Exports
1997
Total Imports
1997
Balance of Trade
1997
Real % Change
Per Year in Exports
1997-2007
Real % Change
Per Year in Imports 1997-2007
Total Tariff Revenue
Collected1 2007
Average Tariff Rate
(%) 2007
(2007 prices)
(2007 prices)
(2007 prices)
Regions and Countries 1 2 3 4 5 6 7 8 9 10
Table 8 (continues) h

CANADIAN DEvELoPMENT REPoRT 2009 — FINANCING DEvELoPMENT IN TIMES oF GLoBAL CRISIS134
EUROPE and CENTRAL ASIA Albania 13.13 2.07 11.06 2.31 0.19 2.12 19 27 0.10 5.00Armenia 9.17 2.07 7.10 2.18 0.09 2.01 15 37 0.19 9.44Azerbaijan 31.79 123.39 -91.61 1.85 0.18 1.67 33 92 0.01 0.01Belarus 5.95 50.35 -44.40 1.29 7.11 -5.82 17 22 0.51 1.02Bosnia and Herzegovina 5.34 5.31 0.02 3.83 0.29 3.54 3 34 0.41 7.70Bulgaria 31.76 120.18 -88.42 8.55 84.61 -76.06 14 4 6.53 5.48Croatia 27.94 37.53 -9.59 11.25 10.81 0.44 10 13 1.01 2.96Czech Republic 239.68 319.14 -79.47 62.74 118.94 -56.20 14 10 5.42 1.74Cyprus 18.64 3.13 15.50 14.16 1.28 12.88 3 9 0.03 1.01Estonia 33.22 57.46 -24.24 6.20 9.85 -3.65 18 19 0.94 1.64Georgia 15.29 70.26 -54.97 17.67 0.48 17.19 -1 65 0.03 0.05Hungary 204.47 320.74 -116.27 84.04 81.05 2.99 9 15 6.65 2.09Kazakhstan 182.76 30.49 152.26 6.22 7.90 -1.68 40 15 0.00 0.01Kyrgyzstan 8.44 0.02 8.42 10.87 0.12 10.75 -3 -17 0.00 10.61Latvia 39.72 13.66 26.05 11.63 2.37 9.27 13 19 0.48 3.55Lithuania 42.42 153.22 -110.80 6.83 23.87 -17.04 20 20 2.77 1.81Macedonia, FYR 15.91 8.73 7.19 1.54 4.94 -3.40 26 6 0.74 8.94Moldova 1.49 2.47 -0.98 0.84 3.49 -2.65 6 -3 0.32 13.93Poland 306.53 669.26 -362.74 149.95 158.32 -8.36 7 16 17.00 2.59Romania 142.18 161.58 -19.40 59.75 74.19 -14.44 9 8 10.93 6.82Russia 1,147.59 1,437.03 -289.44 343.76 670.81 -327.05 13 8 2.75 0.20Serbia and Montenegro 12.33 13.77 -1.45 .. .. .. .. .. 0.37 2.49Slovak Republic 97.88 170.21 -72.33 32.52 59.69 -27.16 12 11 8.47 5.00Slovenia 93.78 80.75 13.02 28.54 45.82 -17.29 13 6 4.13 5.16Tajikistan 2.22 0.09 2.13 0.05 0.75 -0.69 45 -20 0.00 1.07Turkey 654.69 657.45 -2.76 303.78 209.98 93.80 8 12 29.40 4.48Turkmenistan 7.41 1.03 6.38 0.22 0.01 0.21 42 62 0.14 13.59Ukraine 128.31 117.78 10.53 24.41 29.08 -4.66 18 15 1.49 1.27Uzbekistan 8.18 33.19 -25.02 7.89 13.03 -5.14 0 10 0.01 0.02
Total Europe and Central Asia 3,528.19 4,662.40 -1,134.21 1,204.88 1,619.24 -414.37 11 11 100.94 2.16
LATIN AMERICA and the CARIBBEAN Antigua and Barbuda 19.12 0.56 18.56 8.50 1.36 7.14 8 -8 0.00 0.25Argentina 255.42 471.50 -216.08 370.68 251.47 119.21 -4 7 4.29 1.04Bahamas 96.04 63.30 32.74 19.58 8.69 10.89 17 22 0.08 0.13Barbados 62.16 8.12 54.04 33.69 14.96 18.73 6 -6 0.00 0.31Belize 7.10 10.97 -3.87 8.92 13.75 -4.83 -2 -2 0.04 0.34Bolivia 15.18 106.42 -91.25 28.61 16.84 11.78 -6 20 0.13 0.12Brazil 1,515.58 3,340.87 -1,825.29 1,533.73 1,425.57 108.17 0 9 46.16 1.41Chile 768.68 1,685.76 -917.08 355.53 351.94 3.59 8 17 0.96 0.06Colombia 662.19 473.44 188.75 428.43 338.65 89.78 5 3 7.94 1.68Costa Rica 81.57 368.88 -287.31 67.22 199.97 -132.75 2 6 2.33 0.63Cuba 563.37 1,062.33 -498.96 329.82 381.33 -51.51 6 11 0.18 0.01Dominica 4.92 0.40 4.52 1.67 1.52 0.15 11 -13 0.01 2.08Dominican Republic 198.09 113.50 84.59 76.06 121.02 -44.96 10 -1 4.45 4.06Ecuador 243.92 218.40 25.52 78.51 152.65 -74.14 12 4 3.12 1.43El Salvador 47.85 43.42 4.43 19.54 48.18 -28.64 9 -1 5.69 13.13Grenada 7.24 0.70 6.54 3.01 1.20 1.81 9 -5 0.00 0.11Guatemala 130.87 221.65 -90.78 74.78 144.13 -69.34 6 4 3.16 1.43Guyana 27.19 161.53 -134.34 9.67 219.65 -209.98 11 -3 0.02 0.01Haiti 31.73 22.08 9.65 24.58 4.59 19.99 3 17 1.95 8.85Honduras 51.30 124.42 -73.12 15.02 58.74 -43.72 13 8 9.84 7.99Jamaica 179.48 366.33 -186.85 79.67 278.30 -198.63 9 3 0.68 0.19Mexico 4,950.29 17,166.46 -12,216.18 1,157.21 7,582.35 -6,425.14 16 9 24.45 0.15Nicaragua 21.04 90.00 -68.95 9.90 10.60 -0.70 8 24 2.06 2.33Panama 86.38 28.66 57.72 37.76 49.32 -11.56 9 -5 0.02 0.08Paraguay 8.60 14.84 -6.24 10.08 3.56 6.51 -2 15 0.15 1.04
Table 8 h
Total Exports
2007
Total Imports
2007
Balance of Trade
2007
Total Exports
1997
Total Imports
1997
Balance of Trade
1997
Real % Change
Per Year in Exports
1997-2007
Real % Change
Per Year in Imports 1997-2007
Total Tariff Revenue
Collected1 2007
Average Tariff Rate
(%) 2007
(2007 prices)
(2007 prices)
(2007 prices)
Regions and Countries 1 2 3 4 5 6 7 8 9 10
Table 8 (continues) h

STATISTICAL ANNEx 135
Peru 326.09 2,128.29 -1,802.20 282.40 145.33 137.07 1 31 5.16 0.24St. Kitts and Nevis 9.42 4.26 5.15 1.82 4.81 -2.99 18 -1 0.02 0.49St. Lucia 16.75 0.31 16.44 7.91 1.40 6.51 8 -14 0.01 2.03St. Vincent and the Grenadines 10.34 0.57 9.77 3.68 0.15 3.53 11 14 0.00 0.06Suriname 10.14 402.62 -392.48 5.88 27.18 -21.30 6 31 0.01 0.00Trinidad and Tobago 225.74 413.37 -187.62 92.90 28.55 64.35 9 31 0.67 0.16Uruguay 25.05 95.63 -70.58 21.70 71.73 -50.03 1 3 10.58 11.06Venezuela 762.40 1,476.01 -713.61 863.87 1,049.96 -186.09 -1 4 1.81 0.12
Total Latin America and the Caribbean 11,421.25 30,685.60 -19,264.35 6,062.32 13,009.43 -6,947.10 7 9 135.98 0.44
Total Developing Countries 38,763.78 99,358.42 -60,594.64 18,095.89 34,404.81 -16,308.75 8 11 2,161.58 2.18Of which:
LDCs 1,119.07 2,415.36 -1,296.29 332.00 424.31 -92.14 13 19 19.30 0.80Low Income Countries 4,016.44 4,804.44 -788.00 1,194.02 2,298.77 -1,104.69 13 8 213.66 4.45Middle Income Countries 29,775.20 90,054.06 -60,278.86 13,836.54 28,627.79 -14,791.15 8 12 1,920.67 2.13
High Income Developing Countries 4,746.40 4,086.55 659.85 2,972.43 3,449.69 -477.26 5 2 26.59 0.65Total Other Countries (excluding US) 94,654.58 186,208.78 -91,554.20 49,087.81 95,603.08 -46,515.26 7 7 .. ..Total Emerging Market Economies2 30,200.13 81,549.01 -51,348.96 14,245.20 30,236.26 -15,991.05 8 10 1,962.28 2.41United States 355,895.53 220,403.14 135,492.38 220,950.55 199,141.04 21,809.50 5 1 .. ..Total World 450,550.11 406,611.92 43,938.18 270,038.36 294,744.12 -24,705.76 5 3 .. ..
Table 8 h
Total Exports
2007
Total Imports
2007
Balance of Trade
2007
Total Exports
1997
Total Imports
1997
Balance of Trade
1997
Real % Change
Per Year in Exports
1997-2007
Real % Change
Per Year in Imports 1997-2007
Total Tariff Revenue
Collected1 2007
Average Tariff Rate
(%) 2007
(2007 prices)
(2007 prices)
(2007 prices)
Regions and Countries 1 2 3 4 5 6 7 8 9 10
Notes: Italicized countries are identified as non independent countries at the time of writing (see Technical Notes). 1 Revenue collected by Canada through tariffs on developing country imports. 2 See Technical Notes for list of Emerging Market Economies.
Sources: Finance Canada, International Finance and Economics Analysis Division, June 2008; Statistics Canada, CANSIM II, Tables 228-0003 and 380-0056

CANADIAN DEvELoPMENT REPoRT 2009 — FINANCING DEvELoPMENT IN TIMES oF GLoBAL CRISIS136
Exports C$ millions % of Total Imports C$ millions % of Total
1 China 9,269 23.9 1 China 38,296 38.52 Mexico 4,950 12.8 2 Mexico 17,167 17.33 India 1,762 4.5 3 Algeria 5,071 5.14 Hong Kong, China 1,543 4.0 4 Brazil 3,341 3.45 Brazil 1,516 3.9 5 Malaysia 2,917 2.96 Russia 1,148 3.0 6 Thailand 2,300 2.37 United Arab Emirates 1,131 2.9 7 Peru 2,128 2.18 Indonesia 989 2.6 8 India 1,980 2.09 Singapore 914 2.4 9 Saudi Arabia 1,871 1.9
10 South Africa 786 2.0 10 Chile 1,686 1.7Top 10 Total 24,008 61.9 Top 10 Total 76,756 77.3
Total Canadian Exports 38,764 Total Canadian Imports 99,358
Chart 8.1: Comparative Canadian balance of Merchandise Trade with Developing Countries (1997 and 2007)
Note: Exports, imports and balance of trade figures for 1997 are measured at 2007 prices.
Chart 8.2: Distribution of Trade Partners by Income Group (2007)
Note: Some countries classified as Least Developed Countries (LDCs) are also included in the Low Income or Middle Income categories. See Technical Notes for a list of countries included in each category.
Figure 8: Top 10 export and Import Partner Developing Countries (2007)
Source: Statistics Canada, CANSIM II, Table 2280003
Exports (1997)18,096
Imports (1997)34,405
Balance of Trade (1997)-16,309
Imports (2007) 99,358
Balance of Trade (2007)-60,595
Exports (2007) 38,764
-80,000
-60,000
-40,000
-20,000
0
20,000
40,000
60,000
80,000
100,000C$ millions
Latin America and the Caribbean
Europe and Central Asia
East Asia and the Pacific
South Asia
Middle East and North Africa
Sub-Saharan Africa
1,119
29,775 30,200
90,05481,549
010,00020,00030,00040,00050,00060,00070,00080,00090,000100,000
LDCs Low IncomeCountries
Middle IncomeCountries
Emerging MarketEconomies
C$ millions
Exports
Imports
4,0162,415 4,804

STATISTICAL ANNEx 137
Table 9: Finance and Investment Flows between Canada and Developing Countries (2006-07) (In millions of Canadian dollars)
Public or Official Debt* Private or Commercial Debt
Non-Concessional Concessional Total Official Debt
Total Canadian Chartered Bank
Claims
Total Canadian Debt Claims
(Estimate)
Stock of Foreign
Direct Investment
Abroad
Stock of Foreign
Direct Investment in Canada
31-Mar-2008 31-Mar-2008 31-Mar-2008 31-Dec-2007 31-Mar-2008 2006 2006Regions and Countries 1 2 3 4 5 6 7
SUB-SAHARAN AFRICAAngola 3.62 .. 3.62 .. 3.62 x xBenin .. .. .. .. .. x xBotswana .. .. .. .. .. x xBurkina Faso .. .. .. .. .. x xCameroon .. .. .. .. .. x xCentral African Republic .. .. .. .. .. x xCongo, Dem. Rep. 46.49 .. 46.49 .. 46.49 x xCongo, Rep. 29.17 .. 29.17 .. 29.17 x xCôte d’Ivoire 128.53 .. 128.53 .. 128.53 x xEritrea .. .. .. .. .. x xEthiopia 0.08 .. 0.08 .. 0.08 x xGabon 26.80 8.29 35.09 .. 35.09 x xGambia .. .. .. .. 0.00 x xGhana 0.26 .. 0.26 .. 0.26 x xGuinea .. .. .. .. 0.00 x xGuinea-Bissau .. .. .. .. 0.00 x xKenya 27.53 5.63 33.16 .. 33.16 x xLesotho .. .. .. .. .. x xLiberia .. .. .. .. .. x xMadagascar .. .. .. .. .. x xMalawi .. .. .. .. .. x xMali .. .. .. .. .. x xMauritania .. .. .. .. .. x xMauritius .. .. .. .. .. x xMozambique 14.72 .. 14.72 .. 14.72 x xNamibia .. .. .. .. .. x xNiger .. .. .. .. .. x xNigeria 43.13 .. 43.13 .. 43.13 x xRwanda .. .. .. .. .. x xSenegal 6.45 .. 6.45 .. 6.45 x xSeychelles .. .. .. .. .. x xSierra Leone .. .. .. .. .. x xSouth Africa 18.99 .. 18.99 825.00 843.99 774 1,250Sudan 10.70 .. 10.70 .. 10.70 x xSwaziland .. .. .. .. .. x xTanzania 14.51 .. 14.51 .. 14.51 x xTogo .. .. .. .. .. x xUganda .. .. .. .. .. x xZambia 31.11 .. 31.11 .. 31.11 x xZimbabwe .. .. .. .. .. 27 xSub-Saharan Africa unspecified .. .. .. 914.00 914.00 3,236 11
Total Sub-Saharan Africa 402.07 13.92 416.00 1,739.00 2,155.00 4,037 1,261
MIDDLE EAST and NORTH AFRICAAlgeria 192.20 6.58 198.78 179.00 377.78 278 xBahrain .. .. .. .. .. x ..Egypt 211.73 54.66 266.39 .. 266.39 158 xIran 21.11 .. 21.11 .. 21.11 x xIraq 284.22 .. 284.22 .. 284.22 x xJordan 2.22 .. 2.22 .. 2.22 x xKuwait .. .. .. 146.00 146.00 x xLebanon .. .. .. .. .. x xLibya .. .. .. .. .. x xMorocco 0.04 88.19 88.23 .. 88.23 x x
Table 9 (continues) h

CANADIAN DEvELoPMENT REPoRT 2009 — FINANCING DEvELoPMENT IN TIMES oF GLoBAL CRISIS138
Oman 178.60 .. 178.60 .. 178.60 x xQatar .. .. .. .. .. x ..Saudi Arabia 1.73 .. 1.73 59.00 60.73 x xSyria .. .. .. .. .. x xTunisia 26.92 51.89 78.81 .. 78.81 x xUnited Arab Emirates .. .. .. .. .. 5 xYemen .. .. .. .. .. 251 xMiddle East and North Africa unspecified .. .. .. 1,283.00 1,283.00 .. ..
Total Middle East and North Africa 918.78 201.31 1,120.09 1,667.00 2,787.09 692 0
SOUTH ASIABangladesh 12.59 .. 12.59 .. 12.59 x xIndia 894.30 46.88 941.18 3,818.00 4,759.18 327 201Maldives .. .. .. .. 0.00 .. ..Nepal .. .. .. .. 0.00 x xPakistan 104.72 447.51 552.23 .. 552.23 x xSri Lanka .. 86.58 86.58 .. 86.58 x x
Total South Asia 1,011.61 580.97 1,592.58 3,818.00 5,410.58 327 201
EAST ASIA and the PACIFICBrunei .. .. .. .. .. x ..Cambodia .. .. .. .. .. x xChina 1,018.77 467.88 1,486.65 2,598.00 4,084.65 1,563 1,297Indonesia 334.97 206.97 541.94 .. 541.94 3,127 xKorea, Dem. Rep. .. .. .. .. .. x xMalaysia 14.97 1.48 16.46 1,651.00 1,667.46 568 118Mongolia 0.20 .. 0.20 .. 0.20 x xMyanmar .. 8.31 8.31 .. 8.31 x xPapua New Guinea 25.70 .. 25.70 .. 25.70 x xPhilippines 145.94 1.65 147.59 147.00 294.59 141 1Singapore 0.75 2.27 3.02 1,716a 1,719c 4,007 41Thailand 52.99 22.39 75.38 105.00 180.38 972 2Timor-Leste .. .. .. .. 0.00 .. ..Vietnam .. .. .. .. 0.00 142 xEast Asia and the Pacific unspecified .. .. .. 684.00 684.00 .. ..
Total East Asia and the Pacific 1,594.29 710.94 2,305.24 5,185b 7,490b 10,520 1,459
EUROPE and CENTRAL ASIAAlbania .. .. .. .. .. x xArmenia .. .. .. .. .. x xBosnia and Herzegovina 4.76 .. 4.76 .. 4.76 .. ..Bulgaria .. .. .. .. .. x xCroatia 8.95 .. 8.95 .. 8.95 x xCzech Republic .. .. .. .. .. 189 xCyprus .. .. .. .. .. 168 92Estonia .. .. .. .. .. x xGeorgia .. .. .. .. .. x xHungary .. .. .. .. .. 9,938 xKazakhstan 66.45 .. 66.45 .. 66.45 x xKyrgyzstan .. .. .. .. .. x xLatvia .. .. .. .. .. x xLithuania .. .. .. .. .. x xMacedonia, FYR .. .. .. .. .. 0 0Moldova .. .. .. .. .. 0 0Poland .. .. .. 78.00 78.00 451 xRomania .. .. .. .. .. 16 xRussia .. .. .. 863.00 863.00 x xSerbia and Montenegro 140.31 .. 140.31 .. 140.31 .. ..Slovak Republic .. .. .. .. .. x xSlovenia .. .. .. .. .. x x
Public or Official Debt* Private or Commercial Debt
Non-Concessional Concessional Total Official Debt
Total Canadian Chartered Bank
Claims
Total Canadian Debt Claims
(Estimate)
Stock of Foreign
Direct Investment
Abroad
Stock of Foreign
Direct Investment in Canada
31-Mar-2008 31-Mar-2008 31-Mar-2008 31-Dec-2007 31-Mar-2008 2006 2006Regions and Countries 1 2 3 4 5 6 7
Table 9 h
Table 9 (continues) h

STATISTICAL ANNEx 139
Tajikistan .. .. .. .. .. x xTurkey 166.22 96.73 262.95 .. 262.95 800 xTurkmenistan .. .. .. .. .. x xUkraine 38.39 .. 38.39 .. 38.39 x xEurope and Central Asia unspecified .. .. .. 1,439.00 1,439.00 .. ..
Total Europe and Central Asia 425.08 96.73 521.80 2,380.00 2,901.80 11,562 92
LATIN AMERICA and the CARIBBEANAntigua and Barbuda 37.23 0.00 37.23 .. 37.23 x ..Argentina 225.66 0.17 225.82 79.00 304.82 3,981 5Bahamas .. .. .. 10,229a 10,229c x 136Barbados 13.88 0.00 13.88 3,763a 3,777c 38,392 471Belize .. .. .. .. .. x xBolivia 11.57 0.59 12.16 0.00 12.16 87 xBrazil 492.52 0.23 492.75 3,056.00 3,548.75 8,244 9,405Chile 451.31 0.93 452.24 5,221.00 5,673.24 5,171 xColombia 8.36 0.26 8.63 .. 8.63 453 1Costa Rica 0.56 .. 0.56 .. 0.56 448 ..Cuba 24.42 9.55 33.96 .. 33.96 x xDominica .. .. .. .. .. x xDominican Republic 218.54 3.65 222.19 .. 222.19 1,847 ..Ecuador 40.33 4.15 44.48 .. 44.48 46 xEl Salvador 14.22 .. 14.22 .. 14.22 x xGrenada 0.75 .. 0.75 .. 0.75 x xGuatemala 0.15 1.88 2.03 .. 2.03 x xGuyana .. .. .. .. .. 41 xHaiti 2.32 .. 2.32 .. 2.32 x xHonduras 0.31 .. 0.31 .. 0.31 101 ..Jamaica 124.54 5.74 130.27 .. 130.27 x xMexico 1,468.86 0.02 1,468.88 21,671.00 23,139.88 4,369 277Nicaragua .. .. .. .. .. x xPanama 11.72 .. 11.72 .. 11.72 149 55Paraguay 0.22 0.18 0.40 .. 0.40 x xPeru 43.70 0.04 43.74 5,332.00 5,375.74 2,910 xSt. Kitts and Nevis .. .. .. .. .. 0 0St. Lucia .. .. .. .. .. x xSt. Vincent and the Grenadines .. .. .. .. .. 0 0Suriname .. .. .. .. .. x xTrinidad and Tobago 50.09 .. 50.09 2,479.00 2,529.09 276 xUruguay .. .. .. .. .. x xVenezuela 248.77 .. 248.77 141.00 389.77 574 xLatin America and the Caribbean unspecified .. .. .. 13,707.00 13,707.00 .. ..
Total Latin America and the Caribbean 3,490.00 27.40 3,517.39 51,686b 55,203b 67,089 10,350Total Developing Countries 7,841.84 1,631.27 9,473.10 66,475.00 75,948.10 94,227 13,363Of which:
LDCs 142.57 8.31 150.88 0.00 150.88 251 0Low Income Countries 1,363.32 508.33 1,871.65 3,818.00 5,689.65 747 201Middle Income Countries 6,388.72 1,120.67 7,509.39 41,946.00 49,455.39 85,788 12,882High Income Developing Countries 89.80 2.27 92.07 2,684.00 2,776.07 4,456 269
Unspecified Countries .. .. .. 18,027.00 18,027.00 3,236 11
Public or Official Debt* Private or Commercial Debt
Non-Concessional Concessional Total Official Debt
Total Canadian Chartered Bank
Claims
Total Canadian Debt Claims
(Estimate)
Stock of Foreign
Direct Investment
Abroad
Stock of Foreign
Direct Investment in Canada
31-Mar-2008 31-Mar-2008 31-Mar-2008 31-Dec-2007 31-Mar-2008 2006 2006Regions and Countries 1 2 3 4 5 6 7
Table 9 h
Note: * Sovereign and commercial gross loans and guarantees. ** China Official Debt data includes Hong Kong and Taiwan. x Confidential data. a Claims in offshore banking centres. Not included in regional or income group totals. Canadian Chartered Bank claims in other offshore banking centres were:
Bermuda (1,609 C$ m), Cayman Islands (16,073 C$ m), Hong Kong (4,299 C$ m), Panama (924 C$ m). b Group totals exclude claims in offshore banking centres. c Country total includes claims in offshore banking centres.
Sources: Finance Canada, International Finance and Economics Analysis Division, June 2008; Bank of Canada, Banking and Financial Statistics, May 2008, Table C10 Statistics Canada, Cansim II, Table 376-0051
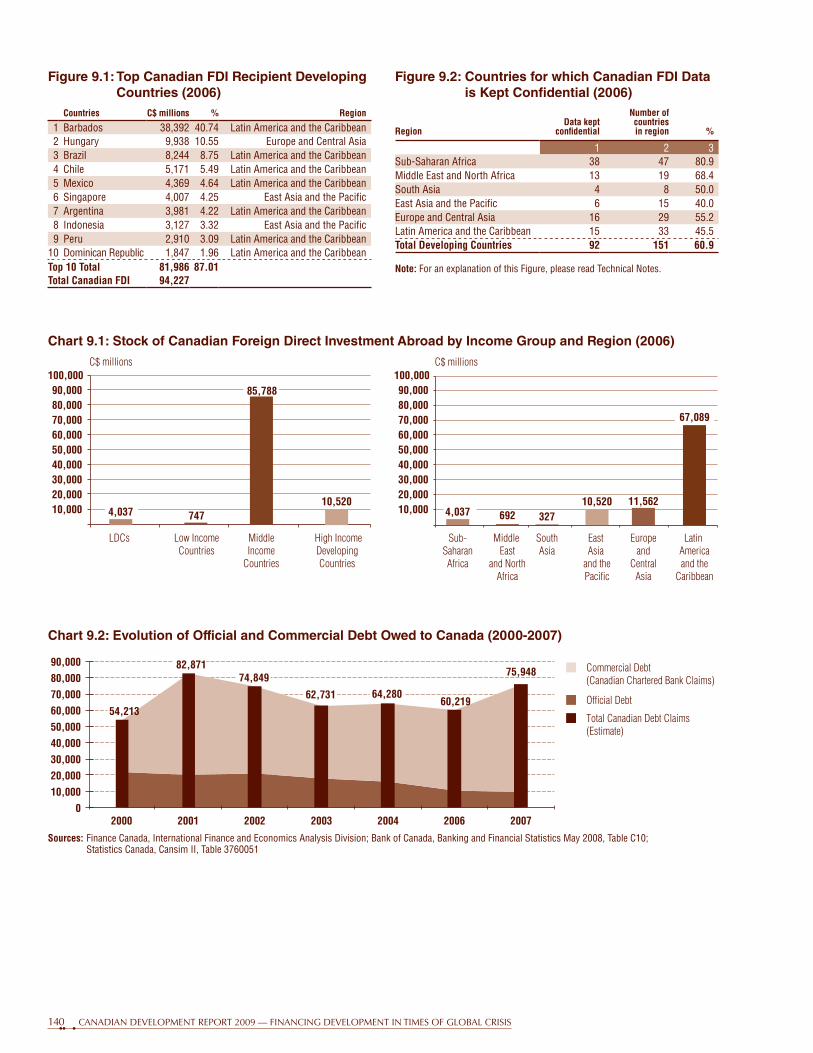
CANADIAN DEvELoPMENT REPoRT 2009 — FINANCING DEvELoPMENT IN TIMES oF GLoBAL CRISIS140
Countries C$ millions % Region
1 Barbados 38,392 40.74 Latin America and the Caribbean2 Hungary 9,938 10.55 Europe and Central Asia3 Brazil 8,244 8.75 Latin America and the Caribbean4 Chile 5,171 5.49 Latin America and the Caribbean5 Mexico 4,369 4.64 Latin America and the Caribbean6 Singapore 4,007 4.25 East Asia and the Pacific7 Argentina 3,981 4.22 Latin America and the Caribbean8 Indonesia 3,127 3.32 East Asia and the Pacific9 Peru 2,910 3.09 Latin America and the Caribbean
10 Dominican Republic 1,847 1.96 Latin America and the CaribbeanTop 10 Total 81,986 87.01 Total Canadian FDI 94,227
RegionData kept
confidential
Number of countries in region %
1 2 3Sub-Saharan Africa 38 47 80.9Middle East and North Africa 13 19 68.4South Asia 4 8 50.0East Asia and the Pacific 6 15 40.0Europe and Central Asia 16 29 55.2Latin America and the Caribbean 15 33 45.5Total Developing Countries 92 151 60.9
Figure 9.1: Top Canadian FDI Recipient Developing Countries (2006)
Figure 9.2: Countries for which Canadian FDI Data is Kept Confidential (2006)
Note: For an explanation of this Figure, please read Technical Notes.
Chart 9.1: Stock of Canadian Foreign Direct Investment abroad by Income Group and Region (2006)
Chart 9.2: evolution of Official and Commercial Debt Owed to Canada (2000-2007)
Sources: Finance Canada, International Finance and Economics Analysis Division; Bank of Canada, Banking and Financial Statistics May 2008, Table C10; Statistics Canada, Cansim II, Table 3760051
747
Low IncomeCountries
C$ millions
10,00020,00030,00040,00050,00060,00070,00080,00090,000100,000
10,00020,00030,00040,00050,00060,00070,00080,00090,000100,000
692
Middle East
and NorthAfrica
327
SouthAsia
10,520
High IncomeDevelopingCountries
10,520
East Asia
and thePacific
11,562
Europeand
CentralAsia
C$ millions
MiddleIncome
Countries
85,788
Sub-SaharanAfrica
4,037
Latin Americaand the
Caribbean
67,089
LDCs
4,037
Commercial Debt(Canadian Chartered Bank Claims)
Official Debt
Total Canadian Debt Claims(Estimate)
60,219
75,948
010,00020,00030,00040,00050,00060,00070,00080,00090,000
2000 2001 2002 2003 2004 2006 2007
54,213
82,87174,849
64,28062,731

STATISTICAL ANNEx 141
Chart 10.1: Immigration Flow by Category (1980-2006)
Chart 10.2: Immigration Flow by Source area (1997-2006)
0
50,000
100,000
150,000
200,000
250,000
300,000
1980 1985 1990 1995 2000 2005
PersonsOther Immigrants
Refugees
Economic Immigrants
Family Class
1997 1998 1999 2000 2001 2002 2003 2004 2005 2006
Persons
Europe and United Kingdom
United States
South and Central America
Asia and Pacific
Africa and the Middle East
0
50,000
100,000
150,000
200,000
250,000
300,000
Source: Citizenship and Immigration Canada, Facts and Figures 2006: Immigration Overview, Permanent and Temporary Residents
Note: The ‘Humanitarian Population’ category includes refugee claimants and temporary residents allowed to remain in Canada on humanitarian grounds and who are not categorized as either foreign workers or foreign students.
Chart 10.3: Inflow of Foreign Workers, Students and Humanitarian Population (1980-2006)
0
50,000
100,000
150,000
200,000
250,000
1980 1985 1990 1995 2000 2005
Persons
HumanitarianPopulation
Foreign Students
Foreign Workers

CANADIAN DEvELoPMENT REPoRT 2009 — FINANCING DEvELoPMENT IN TIMES oF GLoBAL CRISIS142
Chart 10.4: Gender Ratios among Immigrants (2006)
0.5 0.6 0.7 0.8 0.9 1 1.1 1.2 1.3 1.4 1.5
Africa and the Middle East
Asia and Pacific
South and Central America
United States
Europe and the United Kingdom
Source area not stated
TotalM/F > 1 M/F < 1
Gender Equity Line
0 0.2 0.4 0.6 0.8 1 1.2 1.4 1.6 1.8 2
0 to 9 years of schooling
10 to 12 years of schooling
13 or more years of schooling
Trade certificate
Non-university diploma
Bachelor's degree
Master's degree
Doctorate
TotalM/F > 1 M/F < 1
Gender Equity Line
Chart 10.6: Immigration Flow into Canada (2006)
Source: Citizenship and Immigration Canada, Facts and Figures 2006: Immigration Overview, Permanent and Temporary Residents
Chart 10.6.a: by Source area and Gender Chart 10.6.b: by level of education and Gender
Chart 10.5: Gender Ratios of Foreign Workers by Occupational Skill level (1997-2006)
0
1
2
3
4
5
6
1997 1998 1999 2000 2001 2002 2003 2004 2005 2006
M/F Ratio
Skill Level 0 - Managerial
Skill Level A - Professionals
Skill Level B - Skilled and Technical
Skill Level C - Intermediate and Clerical
Skill Level D - Elemental and Labourers
Skill Level Not Stated
Gender Equality Line
0
10,000
20,000
30,000
40,000
50,000
60,000
70,000
0 to 9years of
schooling
10 to 12years of
schooling
13 or more
years ofschooling
Tradecertificate
Non-universitydiploma
Bachelor'sdegree
Master'sdegree
Doc-torate
Persons
126,479
24,30637,946
020,00040,00060,00080,000
100,000120,000140,000
Africaand the
Middle East
Asia andPacific
South andCentralAmerica
UnitedStates
Europe andthe UnitedKingdom
Persons
Female Male Female Male
51,863
10,942
34,48631,796
16,0869,953
22,487
57,688
23,557
4,274

STATISTICAL ANNEx 143
1996 2001 2006Number % of population Number % of population Number % of population
Newfoundland and Labrador 8,918 1.6 8,030 1.6 8,380 1.7Prince Edward Island 4,489 3.3 4,140 3.1 4,785 3.6Nova Scotia 43,821 4.7 41,320 4.6 45,190 5.0New Brunswick 24,835 3.3 22,470 3.1 26,400 3.7Quebec 682,216 9.4 706,965 9.9 851,560 11.5Ontario 2,849,497 25.6 3,030,075 26.8 3,398,725 28.3Manitoba 140,692 12.4 133,660 12.1 151,230 13.3Saskatchewan 55,057 5.4 47,820 5.0 48,160 5.1Alberta 424,044 15.2 438,335 14.9 527,035 16.2British Columbia 955,307 24.5 1,009,820 26.1 1,119,215 27.5Yukon 3,286 10.4 3,020 10.6 3,010 10.0Northwest Territories 2,747 6.6 2,385 6.4 2,810 6.8Nunavut 489 1.9 445 1.7 450 1.5Canada 5,195,399 17.5 5,448,480 18.4 6,186,950 19.8
Figure 10.1: Immigrants in Canada by Province (1996, 2001 and 2006)
Sources: Statistics Canada, CANSIM tables 510-005 and 109-0013; Statistics Canada, 2006 Census of Population, Statistics Canada catalogue no. 97-557-XCB2006006.
1997Ratio
M/F
2001Ratio
M/F
2006Ratio
M/FFemale Male Female Male Female MaleOccupational skill level Number % Number % Number % Number % Number % Number %
Skill level 0 - Managerial 461 2.2 2,406 4.4 5.22 509 1.7 2,616 3.7 5.14 645 1.7 3,142 4.2 4.87 Skill level A - Professionals 6,093 29.7 20,205 36.8 3.32 7,518 25.6 24,099 33.8 3.21 5,656 15.0 16,994 22.7 3.01 Skill level B - Skilled and technical 1,705 8.3 9,120 16.6 5.35 2,354 8.0 11,849 16.6 5.03 2,265 6.0 12,102 16.2 5.34 Skill level C - Intermediate and clerical 3,123 15.2 14,324 26.1 4.59 5,307 18.1 20,187 28.3 3.80 10,119 26.8 23,800 31.8 2.35 Skill level D - Elemental and labourers 263 1.3 806 1.5 3.06 302 1.0 608 0.9 2.01 795 2.1 2,758 3.7 3.47 Skill level not stated 8,907 43.3 8,097 14.7 0.91 13,340 45.5 11,917 16.7 0.89 18,263 48.4 16,118 21.5 0.88 Total 20,552 100.0 54,958 100.0 2.67 29,330 100.0 71,276 100.0 2.43 37,743 100.0 74,914 100.0 1.98
Table 10.1: Flow of Temporary Workers by Occupational Skill level and Gender in Canada (1997, 2001 and 2007)
1997Ratio
M/F
2001Ratio
M/F
2006Ratio
M/FFemale Male Female Male Female MaleRegion Number % Number % Number % Number % Number % Number %
Africa and the Middle East 17,711 16.2 20,084 18.9 1.13 22,817 18.0 25,421 20.6 1.11 25,281 19.5 26,582 21.8 1.05 Asia and Pacific 60,309 55.0 56,761 53.4 0.94 68,240 53.7 64,704 52.3 0.95 67,322 52.0 59,157 48.4 0.88 South and Central America 9,379 8.6 8,043 7.6 0.86 10,929 8.6 9,282 7.5 0.85 12,655 9.8 11,651 9.5 0.92 United States 2,791 2.5 2,238 2.1 0.80 3,260 2.6 2,651 2.1 0.81 5,542 4.3 5,400 4.4 0.97 Europe and the United Kingdom 19,500 17.8 19,174 18.0 0.98 21,753 17.1 21,542 17.4 0.99 18,637 14.4 19,309 15.8 1.04 Source area not stated 2 - 6 - 3.00 15 - 19 - 1.27 64 - 47 - 0.73 Total 109,692 100.0 106,306 100.0 0.97 127,014 100.0 123,619 100.0 0.97 129,501 100.0 122,146 100.0 0.94
Table 10.2: Immigration Flow by Source area and Gender in Canada (1997, 2001 and 2006)
Source: Citizenship and Immigration Canada, Facts and Figures 2006: Immigration Overview, Permanent and Temporary Residents.
Table 10: Temporary Workers and Immigrants in Canada (1997, 2001 and 2006)

CANADIAN DEvELoPMENT REPoRT 2009 — FINANCING DEvELoPMENT IN TIMES oF GLoBAL CRISIS144
Table 10.3: Immigration Flow by Top Source Countries (1997, 2001 and 2006)
Table 10.4: Immigration Flow by Category and Gender in Canada (1997, 2001 and 2006)
1997 Ratio M/F
2001 Ratio M/F
2006 Ratio M/FFemale Male Female Male Female Male
Category Number % Number % Number % Number % Number % Number %
Family class 35,851 32.70 24,089 22.70 0.67 40,738 32.10 26,049 21.10 0.64 41,988 32.40 28,516 23.30 0.68 Economic immigrants 61,523 56.10 66,828 62.90 1.09 73,182 57.60 82,538 66.80 1.13 66,361 51.20 71,896 58.90 1.08 Refugees 10,818 9.90 13,489 12.70 1.25 12,995 10.20 14,924 12.10 1.15 15,801 12.20 16,691 13.70 1.06 Other immigrants 1,500 1.40 1,900 1.80 1.27 99 0.10 107 0.10 1.08 5,344 4.10 5,038 4.10 0.94 Category not stated 0 0.00 0 0.00 .. 0 0.00 1 0.00 .. 7 0.00 5 0.00 0.71 Total 109,692 100.00 106,306 100.00 0.97 127,014 100.00 123,619 100.00 0.97 129,501 100.00 122,146 100.00 0.94
1997 2001 2006Country Number % Rank Number % Rank Number % Rank
China, People’s Republic of 18,526 8.6 3 40,365 16.1 1 33,080 13.2 1India 19,615 9.1 2 27,904 11.1 2 30,753 12.2 2Philippines 10,872 5.0 6 12,928 5.2 4 17,717 7.0 3Pakistan 11,239 5.2 5 15,354 6.1 3 12,332 4.9 4United States 5,030 2.3 9 5,911 2.4 6 10,943 4.4 5Colombia 7,486 3.5 7 5,746 2.3 7 7,073 2.8 6United Kingdom 4,657 2.2 10 5,360 2.1 10 6,542 2.6 7Korea, Republic of 4,001 1.9 11 9,608 3.8 5 6,178 2.5 8Iran 571 0.3 60 2,967 1.2 21 5,813 2.3 9France 2,858 1.3 17 4,428 1.8 12 4,915 2.0 10Romania 5,071 2.4 8 5,520 2.2 9 4,490 1.8 12Sri Lanka 3,916 1.8 12 5,589 2.2 8 4,393 1.8 13Russia 3,735 1.7 14 4,073 1.6 13 2,851 1.1 20Taiwan 13,324 6.2 4 3,114 1.2 19 2,823 1.1 22Hong Kong, China 22,250 10.3 1 1,965 0.8 29 1,489 0.6 33Yugoslavia (former) 1,384 0.6 35 2,803 1.1 22 126 0.1 120Top 10 source countries 118,070 54.7 134,285 53.6 135,346 53.8Other countries 97,968 45.4 116,356 46.4 116,303 46.2Total 216,038 100.0 250,641 100.0 251,649 100.0
Chart 10.6: evolution Over Time of Gender Ratio (Male/Female) by Category (1980 to 2006)
Source: Citizenship and Immigration Canada, Facts and Figures 2006: Immigration Overview, Permanent and Temporary Residents.
0
0.2
0.4
0.6
0.8
1
1.2
1.4
1.6
1.8
1980 1985 1990 1995 2000 2005
Ratio (M/F)
Family Class
Economic Immigrants
Refugees
Other Immigrants
Gender Equality Line

STATISTICAL ANNEx 145
Table 10.5: Immigration Flow, 15 Years of age or Older by Gender and level of education (1997, 2001 and 2006)
1997 2001 2006
Level of EducationFemale Male Ratio
M/F Female Male Ratio M/F Female Male Ratio
M/FNumber % Number % Number % Number % Number % Number %
0 to 9 years of schooling 16,590 10.1 10,961 6.6 0.66 16,871 8.7 11,414 5.9 0.77 18,168 9.1 13,628 6.8 0.75 10 to 12 years of schooling 22,156 13.4 17,079 10.3 0.77 18,627 9.6 14,129 7.3 1.08 18,721 9.3 15,765 7.9 0.84 13 or more years of schooling 7,347 4.5 6,400 3.9 0.87 9,709 5.0 7,215 3.7 0.75 8,527 4.3 7,559 3.8 0.89 Trade certificate 8,384 5.1 7,277 4.4 0.87 4,679 2.4 4,524 2.3 1.64 4,717 2.4 5,236 2.6 1.11 Non-university diploma 7,352 4.5 6,340 3.8 0.86 10,125 5.2 7,974 4.1 0.64 12,524 6.3 9,963 5.0 0.80 Bachelor’s degree 18,590 11.3 22,247 13.5 1.20 30,571 15.8 35,505 18.4 0.68 30,301 15.1 27,387 13.7 0.90 Master’s degree 4,038 2.4 7,555 4.6 1.87 7,215 3.7 11,269 5.8 0.92 10,501 5.2 13,056 6.5 1.24 Doctorate 698 0.4 2,029 1.2 2.91 1,038 0.5 2,488 1.3 1.97 1,433 0.7 2,841 1.4 1.98 Total 85,155 51.6 79,888 48.4 0.94 98,835 51.1 94,518 48.9 0.85 104,892 52.4 95,435 47.6 0.91
Table 10.6: Immigration Flow by labour Market Intention and Occupational Skill level (1997, 2001 and 2006)
Occupational Skill Level1997 2001 2006
Number % Number % Number %
Skill level 0 - Managerial 3,305 1.5 4,873 1.9 8,123 3.2Skill level A - Professionals 31,224 14.5 46,708 18.6 31,214 12.4Skill level B - Skilled and technical 23,214 10.7 18,248 7.3 14,493 5.8Skill level C - Intermediate and clerical 7,096 3.3 6,931 2.8 6,538 2.6Skill level D - Elemental and labourers 1,037 0.5 1,152 0.5 607 0.2Occupational skill level identified 65,876 30.5 77,912 31.1 60,975 24.2New workers - 15 years of age or older 42,587 19.7 51,848 20.7 67,850 27.0Industrial codes - 15 years of age or older 2,864 1.3 1,631 0.7 712 0.3Intending to work 111,327 51.5 131,391 52.4 129,537 51.5Children under 15 years of age 50,965 23.6 57,288 22.9 51,322 20.4Students 15 years of age or older 19,825 9.2 21,877 8.7 27,633 11.0Retirees 15 years of age or older 6,682 3.1 7,206 2.9 6,421 2.6Other non-workers 15 years of age or older 27,216 12.6 32,863 13.1 36,497 14.5Labour market intention not stated 23 0.0 16 0.0 239 0.1Total 216,038 100.0 250,641 100.0 251,649 100.0
Region1997 2001 2006
Number % Number % Number %
Africa and the Middle East 7,975 32.8 9,663 34.6 10,226 31.5Asia and Pacific 7,201 29.6 9,858 35.3 10,567 32.5South and Central America 1,752 7.2 2,657 9.5 7,597 23.4United States 54 0.2 55 0.2 1,246 3.8Europe and the United Kingdom 7,321 30.1 5,683 20.4 2,763 8.5Source area not stated 5 0.0 3 0.0 93 0.3Total Refugees 24,308 100.0 27,919 100.0 32,492 100.0
Table 10.7: Refugees by Source area (1997, 2001 and 2006)
Source: Citizenship and Immigration Canada, Facts and Figures 2006: Immigration Overview, Permanent and Temporary Residents.

CANADIAN DEvELoPMENT REPoRT 2009 — FINANCING DEvELoPMENT IN TIMES oF GLoBAL CRISIS146
Technical Notes
General CommentsVirtually all data in these tables is available or derived from existing, publicly accessible information issued by the Government of Canada, the Organization for Economic Co-operation and Development (OECD), the World Bank, and United Nations agencies. The North-South Institute selects the data for this annex chiefly for its development interest. However, data availability, including annual updates, also is an important factor. Some additions (and deletions) have been made to this year’s report.
Selection of Developing Countries The statistical annex lists developing countries under country groupings which reflect the eight Millennium Development Goals (MDGs) reference regions as set by the World Bank. Regional country groupings are the following:
• Sub-SaharanAfrica, • MiddleEastandNorthAfrica, • SouthAsia, • EastAsiaandthePacific, • EuropeandCentralAsia,and • LatinAmericaandtheCaribbean.
Tables 1, 3, 4 and Tables 7 through 9 list this common set of developing countries. Countries for which no dataisavailableforallthevariableslistedinaspecifictablehavebeenexcludedfromthatspecifictable.None of the countries on the list is a dependent or colonial territory. However, the following entities listed inthesetablesandidentifiedinitalics-HongKongandthe West Bank and Gaza - are not “independent countries.”HongKongbecametheHongKongSpecialAdministrative Region (SAR) of China on 1 July 1997. The West Bank and Gaza, at the time of writing, had not yet been granted independent status.
ODa Ineligible CountriesThe Europe and Central Asia grouping includes 13 countries, categorized as “developing” that are ineligible for Official Development Assistance (ODA) according to the criteria of the OECD Development Assistance Committee (DAC). These countries, identi-fiedinbold-italicswhenfeaturedinTables1,3, 4 and 7 are: Belarus, Bulgaria, the Czech Republic, Estonia, Hungary, Latvia, Lithuania, Poland, Romania, the Russian Federation, the Slovak Republic, Slovenia, and Ukraine. These countries may receive “official assist-ance (OA)” from Canada and other donors, which is included in the above listed tables and the corresponding chartsandfigures,forconsistencywithCIDAdata.
Year of CoverageData generally is given for the latest calendar year for which complete information exists - normally 2006 or 2007. However, in the case of Official Development AssistanceinTables3through7,thefiguresareforfiscalyear2005-06(April1,2005toMarch31,2006).In other cases where the data is not for calendar year 2006 or 2007, the relevant date is indicated. Some statistics were readily available for 2006 however, in some cases, information from 2005 was used – see the Human Development Index (HDI).
SymbolsWe use standard symbols, as follows:
.. = not available or not applicable
0 or 0.00 = true zero or a value rounded to zero
Unlessotherwiseindicated,figuresarein Canadian dollars.
Income-Grouped TotalsSub-totals for country income-groupings can be found at the bottom of columns in Tables 1, 3, 4 and Tables 7 through 9. These groupings follow the World Bank’s classificationofcountriesbyincomelevel,aslistedinthe UNDP Human Development Report and in CIDA’s Statistical Report on Development Assistanceforfiscalyear 2005-06.
The list of least developed countries (LDCs), low income countries, middle income and high income developing countries is provided below.
least Developed Countries: Afghanistan, Angola, Malawi, Bangladesh, Benin, Mali, Bhutan, Burkina, Burundi, Cambodia, Cape Verde, Central African Republic, Chad, Comoros, São, Democratic Republic of Congo, Djibouti, Sierra, Equatorial Guinea, Eritrea, Ethiopia, Gambia, Guinea, Guinea-Bissau, Haiti, Kiribati,Laos,Lesotho,Liberia,Madagascar,Malawi,Maldives, Mali, Mauritania, Mozambique, Myanmar, Nepal, Niger, Rwanda, Samoa, Sao Tomé and Principe, Senegal, Sierra Leone, Solomon Islands, Somalia, Sudan, Tanzania, Togo, Timor-Lesté, Tuvalu, Uganda, Vanuatu, Yemen, and Zambia.
low-income countries: Afghanistan, Bangladesh, Benin, Bhutan, Burkina Faso, Burundi, Cambodia, Central African Republic, Chad, Comoros, Democratic Republic of Congo, Côte d’Ivoire, Eritrea, Ethiopia, Gambia, Ghana, Guinea, Guinea-Bissau, Haiti, India, Kenya,DemocraticRepublicofKorea,Kyrgyzstan,Laos, Liberia, Madagascar, Malawi, Mali, Mauritania, Mongolia, Mozambique, Myanmar, Nepal, Niger, Nigeria, Pakistan, Papua New Guinea, Rwanda,

STATISTICAL ANNEx 147
Sao Tome and Principe, Senegal, Sierra Leone, Solomon Islands, Somalia, Sudan, Tajikistan, Tanzania, Timor-Leste, Togo, Uganda, Uzbekistan, Vietnam, Yemen, Zambia, and Zimbabwe.
Middle-income countries: Albania, Algeria, Angola, Argentina, Armenia, Azerbaijan, Barbados, Belarus, Belize, Bolivia, Bosnia and Herzegovina, Botswana, Brazil, Bulgaria, Cameroon, Cape Verde, Chile, China, Colombia, Congo Republic, Costa Rica, Croatia, Cuba, Czech Republic, Djibouti, Dominica, Dominican Republic, Ecuador, Egypt, El Salvador, Equatorial Guinea, Estonia, Fiji, Gabon, Georgia, Grenada, Guatemala, Guyana, Honduras, Hungary, Iran, Iraq, Jamaica,Jordan,Kazakhstan,Kiribati,Latvia,Lebanon, Libya, Lithuania, Macedonia FYR, Malaysia, Maldives, Marshall Islands, Mauritius, Mexico, Micronesia, Moldova, Morocco, Namibia, Oman, Palau, Panama, Paraguay, Peru, Philippines, Poland, Romania, Russia,Samoa,SaintKittsandNevis,SaintLucia,Saint Vincent and the Grenadines, Serbia and Montenegro, Seychelles, Slovakia, South Africa, Sri Lanka, Suriname, Swaziland, Syria, Thailand, Tonga, Trinidad and Tobago, Tunisia, Turkey, Turkmenistan, Ukraine, Uruguay, Vanuatu, Venezuela, and the West Bank and Gaza.
High-income developing countries: Antigua and Barbuda, Bahamas, Bahrain, Brunei, Cyprus, Hong Kong,China,Kuwait,Qatar,SaudiArabia,Singapore,Slovenia, and United Arab Emirates.
Income-group and regional-group totals Note that totals by income-group may differ from totals for all developing countries because income-group totalsarebasedoncountry-specificinformationonly,while overall totals for developing countries also include allocations to regions that cannot be attributed tospecificcountries.
Data for low income countries, middle income and high income developing countries cumulatively add up to incomegrouptotalsbasedoncountry-specificinforma-tion. The LDCs category however, includes countries from both the low income and middle income groups. When data for LDCs is cumulatively added to other income groups, the total is not based on country-specificinformation,orincomegroupsaredivideddifferently, as in Chart 2.3.b or Chart 5.1.a.
emerging Market economies In Table 8 this country grouping is included alongside the income-based grouping. This grouping is not, strictly speaking, income based because it includes low, middle, and high-income countries (but no LDCs). These are countries that are considered to have fairly
dynamic economies, which have already undergone significantlevelsofindustrialandfinancialdevelopment,and achieved substantial integration into international capital markets. The countries (included in the “Emerging-market indicators” section of The Economist, as of December 13, 2006 http://www.economist.com/markets/indicators/displaystory.cfm?story_id=8413906) are: Argentina, Brazil, Chile, China,CzechRepublic,Egypt,HongKong,Hungary,India, Indonesia, Iran, Israel, Malaysia, Mexico, Nigeria, Pakistan, Philippines, Poland, Russia, Saudi Arabia,Singapore,SouthAfrica,SouthKorea,Taiwan,Thailand, Turkey, Ukraine and Venezuela.
Tables
Table 1: The Developing Countries: Selected Social and Economic Indicators (2005 and 2006)
Figures on the GDI, HDI, Adult Literacy, and Under-5 Mortality rates are taken from the UNDP’s Human Development Report 2008. Figures on GNI per capita, total GDP, population, present value of debt/GNI, total debt service/GNI and aid/GNI are taken from the World Bank’s World Development Indicators (WDI) and Global Development Finance (GDF) 2008, available online by subscription at: www.worldbank.org.
Country groupings totals for columns 4-7, are weighted by population. Country groupings totals for columns 8, 9, and 10 are weighted by GNI (current $US). PopulationfiguresaretakenfromtheWorldBank’sWorld Development Indicators (WDI) 2008.
Per capita incomes were reported in PPP$ rather than US$. The PPP$ is a more accurate standardization of the ‘value in consumption’ of income across all reporting countries. This denomination, therefore, forms a better basis for comparative incomes across countries. In addition, exchange rate changes can significantlyaltertherecordedUS$incomesofcoun-tries from year to year, even when it is averaged (as in the World Bank’s Atlas method) and can therefore give misleading information about actual changes in domestic income.
Table 2: Canada and Other High Income OECD Countries: Selected Indicators (2005-2007)
Table 2 includes the 22 OECD DAC Member Countries and two other high-income OECD Member Countries (IcelandandtheRepublicofKorea).TheGNIpercapitafiguresarefromtheWorldBank’sWorld Development Indicators 2006. As in Table 1, per capita estimatesarealsoreportedinPPP$.Thejustificationgiven above applies here as well. Data on foreign aid andnetprivatefinancialflowsaretakenfromthe

CANADIAN DEvELoPMENT REPoRT 2009 — FINANCING DEvELoPMENT IN TIMES oF GLoBAL CRISIS148
OECD’s DAC Development Cooperation Report 2007. Numbers for the shares of exports to and imports from developing countries are from the IMF’s Direction of Trade Statistics Yearbook 2007. Data on the foreign-born proportion of the population is taken from the OECD’s International Migration Outlook 2007.
Table 3: Canadian Official Development Assistance: Basic Data (2005-06)
The basic data on Canadian official development assistance in Tables 3 through 7 are taken or derived from the “Statistical Report on Development Assistance”forfiscalyear2005-06,publishedbyCIDA’s International Development Information Centre. Information in Table 3 is taken from “Table D-4: Canada’s Bilateral ODA by Recipient” and “Table D-5: Canada’s Multilateral ODA by Recipient”. Data was also taken from CIDA’s “Statistical Report on Development Assistance”forfiscalyear1995-96.Forbettercom-parison purposes the 1995-96 total bilateral ODA flows have been translated into 2005 prices using the GDP deflator ($ 2005 = $ 1995 * 1.23). Information on Canada’s rank among other bilateral donors in recipient countries is derived from the OECD’s Geographic Distribution of Financial Flows to Aid Recipients 2000-2006.Includedundertheclassifica-tion “Unallocable by Country” at the bottom of Table 3 are imputed administrative costs, interest costs, other government department costs and services, provincial government support to development, CIDA’s Public Outreach (Development Information) Program as well as other costs.
Table 4: Canadian Bilateral ODA by Channel and by Country (2005-06)
Data in Table 4 is taken from “Table B-2: Canada’s International Humanitarian Assistance”, “Table B-3: CIDA’s Bilateral Food Aid by Country” and “Table D-4: Canada’s Bilateral ODA by Recipient” of CIDA’s “Statistical Report on Development Assistance” for fiscalyear2005-06.Includedundertheclassification“Unallocable by Country” at the bottom of Table 4, are imputed administrative costs, interest costs, other government department costs and services, provincial government support to development, CIDA’s Public Outreach (Development Information) Program as well as other costs.
Table 5: Canadian Bilateral ODA by Sector (2005-06)
Data in Table 5 is taken from “Table B-1: Canada’s Bilateral ODA by Sector” of CIDA’s “Statistical Report onDevelopmentAssistance”forfiscalyear2005-06.
Table 6: Canadian Technical Assistance to Developing Countries (2000-2005)
Data in Table 6 is taken from “Annex-1: CIDA-Funded Students and Trainees During Calendar Year 2005, by Region of Origin and Location of Study”, “Annex 2: CIDA-Funded Students and Trainees During Calendar Year 2005 by Sector”, “Annex 3: CIDA-Funded Technical Cooperation Experts on Assignment Abroad During Calendar Year 2005, by Region of Assignment” and “Annex 4: CIDA-Funded Technical Cooperation Experts on Assignment During Calendar Year 2005, by Sector” of CIDA’s “Statistical Report on Development Assistance”forfiscalyear2005-06.Correspondingdata for Calendar Year 2000 was taken from CIDA’s “Statistical Report on Development Assistance” for fiscalyear2000-01.
Table 7: Canadian Multilateral ODA by Agency and by Country (2005-06)
In table 7, the imputed shares of Canadian Multilateral Assistance by Agency and Country were computed from “Table D-4: Canada’s Bilateral ODA by Recipient” and “Table D-5: Canada’s Multilateral ODA by Recipient”.ThesefiguresonlyestimatetheallocationofCanadian funds to particular countries by multilateral agencies.Thefiguresunderstatetheamountofmultilateral aid going to relatively small developing countries.Includedundertheclassification“Unallocable by Country” at the bottom of Table 7, are imputed administrative costs, interest costs, other government department costs and services, provincial government support to development, CIDA’s Public Outreach (Development Information) Program as well as other costs.
Table 8: Canadian Balance of Merchandise Trade with Developing Countries (2007)
The data on exports and imports are obtained from Statistics Canada CANSIM II Tables 228-0003 and 380-0056, for 2007 and 1997. Export and import prices for 1997 were translated into real terms using the respective implicit price indices (Fisher index formula). The Department of Finance provided the information on total tariff revenue collected on imports from developing countries and average tariff rate, disaggre-gated by country.
Table 9: Finance and Investment Flows between Canada and Developing Countries (2006-07)
Data on the stock of public Canadian claims were made available by Finance Canada’s International Finance and Economic Analysis Division and by Export Development Canada (EDC). Data on the stock of

STATISTICAL ANNEx 149
private Canadian claims were taken from the Bank of Canada’s Banking and Financial Statistics, June 2008. Data on Foreign Direct Investment in Canada and Abroad were taken from Statistics Canada, Cansim II, Table 376-0051.
Public or official debt is constituted by non-concessional and concessional loans. Statistics Canada’s Balance of PaymentsDivisionprovidedthefiguresonCanadiandirect investment abroad in developing countries and foreign direct investment by developing countries in Canada. The symbol “x” in the two columns relating to foreign direct investment signals that data are not availableinordertoprotectconfidentiality.Hence,country-grouping and income-grouping totals under-estimate the total stock of foreign investment.
Non-concessional loans are: EDC’s Corporate Account (sovereign and commercial) loans which include principal outstanding, recognized accrued revenue, and unrecognized accrued revenue; EDC’s non-concessional loans under the Canada Account; Department of Finance loans; and the Canadian Wheat Board loans (sovereign and commercial).
Concessional loans are: CIDA loans; and EDC’s concessional loans under the Canada Account.
Private or commercial debt includes total claims booked worldwide vis-à-vis non-residents by Canadian chartered banks.
Table 10: Temporary Workers and Immigrants in Canada (1997, 2001 and 2006)
The Department of Citizenship and Immigration’s Facts and Figures 2006 - Immigration Overview: Permanent and Temporary Residents (available online at http://www.cic.gc.ca/english/resources/statistics/facts2006/index.asp) was the main source of data reflecting population inflows from other countries to Canada. This publication provided information on immigration flows generally disaggregated by permanent residents and temporary residents. Data was also disaggregated by occupational skill level, source areas and top source areas, categories, level of education, and refugees. Data was further disaggregated by gender, whenever possible.
Whenever data permitted, a gender ratio was generated to show the relation between male to females, for different cross-section data. This index clearly shows the direction of policy, especially when depicted over time. Accordingly, Gender Equity Lines and Gender Ratio data points are included in charts to show the genderrelationsacrossdifferentseries.Definitionsused by CIC, applicable to the NSI CDR, follows in Box A.

CANADIAN DEvELoPMENT REPoRT 2009 — FINANCING DEvELoPMENT IN TIMES oF GLoBAL CRISIS150
Category: Four immigration categories are shown for permanent residents: family class, economic immigrants, refugees and other immigrants. The economic immigrant category is further divided into: principal applicants, and spouses and dependants.
Economic immigrants: Permanent residents selected for their skills and ability to contribute to Canada’s economy; including, skilled workers, business immigrants, provincial or territorial nominees and live-in caregivers.
Family class: Permanent residents sponsored by a Canadian citizen or a permanent resident living in Canada who is 18 years of age or over. This includes spouses and partners; parents and grandparents; and others (i.e., dependent children, children under the age of 18 whom the sponsor intends to adopt in Canada, brothers, sisters, nephews, nieces and grandchildren who are orphans under 18 years of age, or any other relative if the sponsor has no relative as described above). Fiancé(e)s are no longer designated as a component of the family class under the Immigration and Refugee Protection Act.
Foreign workers: This category includes individuals who enter Canada to work on a temporary basis. Every foreign worker must have been issued a work permit but may also have been issued other types of permits or authorizations. The foreign worker category excludes foreign students who may have been issued a work permit associated with their studies or status as a student and individuals who have been issued a work permit for humanitarian reasons, such as refugee claimants.
Immigration Act (1976): Federal legislation respecting immigration to Canada. The Immigration Act of 1976 became law in 1978 and remained in effect until June 27, 2002.
Immigration and Refugee Protection Act (IRPA): Federal legislation respecting immigration to Canada and the granting of refugee protection to people who are displaced, persecuted or in danger. IRPA received royal assent on November 1, 2001, and came into effect on June 28, 2002.
Independent immigrants: The independent immigrant category is a pre-IRPA immigration category that includes skilled workers selected for their labour market skills and business immigrants selected on the basis of their business experience and other related skills.
Level of education: Eight levels of education have been determined for permanent residents who are 15 years of age or older, based on the number of years of schooling or the certificate, diploma or degree obtained.
• 0 to 9 years of schooling
• 10 to 12 years of schooling
• 13 or more years of schooling, with no additional certificate, diploma or degree
• Trade certificate: completion of vocational training at non-university educational institutions
• Non-university diploma: completion of a diploma program not at the university or trade level
• Bachelor’s degree: completion of a bachelor’s program at the university level
• Master’s degree: completion of a master’s program at the university level
• Doctoral degree: completion of a doctoral program at the university level
Occupational skill level: Five skill levels, based on the National Occupational Classification, have been determined for permanent residents 15 years of age or older as well as for foreign workers.
• Skill level O (managerial): management occupations.
• Skill level A (professionals): professional occupations in business and finance; natural and applied sciences; health; social science, education, government service, and religion; and art and culture. Educational or training requirements: university degree.
• Skill level B (skilled and technical): skilled or technical occupations in administration and business; natural and applied sciences; health; law, social service, education, and religion;
art, culture, recreation and sport; sales and service; as well as trades and skilled transport and equipment operators; skilled occupations in primary industries; and processing, manufacturing and utilities supervisors and skilled operators. Educational or training requirements: two to three years of post-secondary education, or two to five years of apprenticeship training, or three to four years of secondary school and more than two years of on-the-job training, occupation-specific training courses or specific work experience.
• Skill level C (intermediate and clerical): clerical occupations; assisting occupations in health services; intermediate occupations in sales and services; transport, equipment operations, installation and maintenance; primary industries; as well as processing and manufacturing machine operators and assemblers. Educational or training requirements: one to four years of secondary school education, or up to two years of on-the-job training, training courses or specific work experience.
• Skill level D (elemental and labourers): elemental sales and service occupations and labourers in construction; primary industries; and processing, manufacturing and utilities. Educational or training requirements: no formal educational requirements; short work demonstration or on-the-job training.
Permanent residents: People who have been granted permanent resident status in Canada. Permanent residents must live in Canada for at least 730 days (two years) within a five-year period or risk losing their status. Permanent residents have all the rights guaranteed under the Canadian Charter of Rights and Freedoms such as equality rights, legal rights, mobility rights, freedom of religion, freedom of expression and freedom of association. They do not, however, have the right to vote in elections.
box a: Citizenship and Immigration Canada Definitions

STATISTICAL ANNEx 151
Refugees: Permanent residents in the refugee category include government-assisted refugees, privately sponsored refugees, refugees landed in Canada and refugee dependants (i.e., dependants of refugees landed in Canada, including spouses and partners living abroad or in Canada). With the introduction of IRPA, “refugees” are referred to as “Protected persons”.
Skilled workers: Economic immigrants selected for their ability to participate in the labour market and to establish themselves economically in Canada. Skilled workers are assessed on the basis of selection criteria that stress education, language ability and skilled work experience rather than a specific occupation. Before IRPA, the skilled worker category included assisted relatives and independent immigrants.
Source area: Five major world regions are shown: Africa and the Middle East, Asia and Pacific, South and Central America, the United States, and Europe and the United Kingdom.
Source countries: Refers to the principal country of last permanent residence (CLPR) for all permanent residents and temporary residents, unless otherwise indicated. For refugee claimants, source country refers to the principal country of alleged persecution (COAP). The ranking of the top ten source countries is based on the annual flow or stock in the most recent year.
Temporary resident flow: This repre-sents the number of temporary residents identified as entering the CIC system (and presumably the country) for the first time. CIC commonly measures the annual flow of foreign workers, foreign students and the humanitarian com-ponent of the temporary resident population. Flows are calculated as of the earliest effective date of any valid permit issued to a temporary resident. Seasonal workers are counted each time they re-enter the system.
Temporary residents: Foreign nationals who are lawfully in Canada on a temporary basis under the authority of a
temporary permit. Temporary residents include foreign workers, foreign students, the humanitarian population and other temporary residents. The humanitarian population includes refugee claimants and temporary residents allowed to remain in Canada on humanitarian grounds and who are not categorized as either foreign workers or foreign students. The other category of tem-porary residents includes people in Canada on a temporary basis who are not under the authority of a work permit or a study permit and who are not refugee claimants. The other category of temporary residents is not profiled in this publication.
Province or territory: Refers to the province or territory of intended destination in Canada.

CANADIAN DEvELoPMENT REPoRT 2009 — FINANCING DEvELoPMENT IN TIMES oF GLoBAL CRISIS152
Government andCivil Society9,887
Education6,981
Health6,617
Multisector2,077Business and
Other Services3,692
Population Policies/Programs and Reproductive Health872
Other Social Infrastructureand Services1,294
Supportto NGOs1,803
Other2,494
Energy Generation and Supply 140
Water Supply and Sanitation 675
Trade Policy and Regulations 616
Banking and Financial Services 140
Mineral Resources and Mining 125
Communications 249
Tourism 147
Forestry 220
Transport and Storage 59
Fishing 78
Industry 36
Construction 36
Unallocated / Unspecified 3
No. of students and trainees
Agriculture1,531
0
1
2
3
4
5
6
1997 1998 1999 2000 2001 2002 2003 2004 2005 2006
M/F Ratio
Skill Level 0 - Managerial
Skill Level A - Professionals
Skill Level B - Skilled and Technical
Skill Level C - Intermediate and Clerical
Skill Level D - Elemental and Labourers
Skill Level Not Stated
Gender Equality Line
Charts, Figures and MapsThe North-South Institute Canadian Development Report2009includescharts,figuresandGISmaps. In this edition, enhanced graphics have been added to basic bar, pie and composite charts to convey an additional level of information. All charts carry both axes (x and y), which are properly labeled and each series has its own value depicted accordingly.
Certain pie charts are composite pie charts, constructed by further disaggregating data:
In this issue of the CDR, information on gender distribution for different series is conveyed in two ways. It may be integrated in bar charts where a Gender Equality Line (denoting the same number ofmalesandfemales)andspecificGenderRatios (the number of males per female) are plotted on a secondary axis.
Alternatively, information on gender distribution for different series is provided by a separate chart, with the y-axis representing Gender Equality (M/F = 1). Series involving a smaller number of males than females (M/F < 1) appear on the left-hand side of the Gender Equality Line, while series involving a larger number of males than females (M/F > 1) are plotted along the right-hand side of the Gender Equality Line.
Gender ratios were also depicted over time, and built around a Gender Equity Line. Statistics for males and females are equal when they converge at the Gender Equality Line. A value above the Gender Equality Line indicates more males than females. A value below the Gender Equality Line indicates more females than males.
Stacked Bars are used to compare individual values to cumulative data for each category. The bars in a stacked bar graph are divided into categories and together represent a total.
0%
10%
20%
30%
40%
50%
60%
70%
80%
90%
100%
1995-06 2000-2001 2005-06
Latin America and the Caribbean
Europe
Other Asia and Oceania
South andCentral Asia
Middle East andNorth Africa
Sub-SaharanAfrica0%
10%
20%
30%
40%
50%
60%
70%
80%
90%
100%
1995-06 2005-06
Upper-MiddleIncome Countries
Lower-MiddleIncome Countries
Other Low Income Countries
LDCs
HDI
0.467
0.594
0.808 0.801 0.691
0 0.1 0.2 0.3 0.4 0.5 0.6 0.7 0.8 0.9
1
Sub-SaharanAfrica
Middle East
and NorthAfrica
SouthAsia
East Asiaand thePacific
Europeand
CentralAsia
LatinAmericaand the
Caribbean
DevelopingCountries
HDI
0.488 0.570
0.776
0 0.1 0.2 0.3 0.4 0.5 0.6 0.7 0.8 0.9
1
LeastDevelopedCountries
Low Income Middle Income High Income
0.936
0.73 0.758
Specific values
Values
Labels
1,204
243
34
1,212
398
0
0.5
1
1.5
2
2.5
0
200
400
600
800
1,000
1,200
1,400
1,600
Africa andMiddle East
Americas Asia and Oceania Europe Multinational
No. of experts M/F Ratio
Female Experts (Left Axis)
Male Experts (Left Axis) M/F Ratio (Right Axis)
Gender Equality Line (Right Axis)
1,341
933
1,4961,353
88
Gender Ratio Points for each series
Gender Equality Line
0.5 0.6 0.7 0.8 0.9 1 1.1 1.2 1.3 1.4 1.5
Africa and the Middle East
Asia and Pacific
South and Central America
United States
Europe and the United Kingdom
Source area not stated
TotalM/F > 1 M/F < 1
Gender Equity Line
0 0.2 0.4 0.6 0.8 1 1.2 1.4 1.6 1.8 2
0 to 9 years of schooling
10 to 12 years of schooling
13 or more years of schooling
Trade certificate
Non-university diploma
Bachelor's degree
Master's degree
Doctorate
TotalM/F > 1 M/F < 1
Gender Equity Line
100% Stacked bar ceiling value
Categories
Percentage contribution of each category
Grid

STATISTICAL ANNEx 153
Categories
There are some stacked areas plotted against a time-line and accompanied by trend lines for the same period. Valuesforeachtime-specificseriesarecombinedandthen projected over time:
Chart 3.5: evolution of Canadian ODa (1950-2007)
Chart 3.6: evolution of Canadian ODa/GNI Index (1950 to 2007)
Secondary Tables
Secondary tables are also included as Figures, containing additional information relative to main tables or other charts.
Figure 3.1: Top 3 Recipients of Canadian bilateral ODa in each Region (2005-06)
Rank in Region C$ millions% of
Region % of Total
Rank among all recipients
SUB-SAHARAN AFRICA1 Ethiopia 87.29 11.32 2.67 52 Sudan 72.01 9.33 2.20 63 Ghana 70.34 9.12 2.15 7MIDDLE EAST and NORTH AFRICA1 Iraq 467.25 86.58 14.28 12 West Bank and Gaza 30.07 5.57 0.92 193 Egypt 19.04 3.53 0.58 29SOUTH ASIA1 Afghanistan 101.86 31.79 3.11 22 Pakistan 87.67 27.36 2.68 43 Bangladesh 62.69 19.57 1.92 8EAST ASIA and the PACIFIC1 Indonesia 49.91 30.35 1.53 112 China 37.31 22.69 1.14 163 Vietnam 32.88 20.00 1.00 17EUROPE and CENTRAL ASIA1 Serbia and Montenegro 58.2 61.95 1.78 92 Ukraine 19.03 20.26 0.58 283 Bosnia and Herzegovina 9.32 9.92 0.28 43LATIN AMERICA and the CARIBBEAN1 Haiti 98.42 39.41 3.01 32 Honduras 23.24 9.31 0.71 233 Bolivia 20.8 8.33 0.64 26
0500
1,000
1,5002,0002,5003,0003,500
4,000
4,5005,000
1950 1955 1960 1965 1970 1975 1980 1985 1990 1995 2000 2005
(C$ millions)
Multilateral
Bilateral
0
0.1
0.2
0.3
0.4
0.5
0.6
1950 1955 1960 1965 1970 1975 1980 1985 1990 1995 2000 2005
%
ODA/GNI
Cumulative areas
Time line
Trend line
Time line

CANADIAN DEvELoPMENT REPoRT 2009 — FINANCING DEvELoPMENT IN TIMES oF GLoBAL CRISIS154
Regions
Data kept confidential
Number of countries in
region %
1 2 3Sub-Saharan Africa 38 47 80.9Middle East and North Africa 13 19 68.4South Asia 4 8 50.0East Asia and the Pacific 6 15 40.0Europe and Central Asia 16 29 55.2Latin America and the Caribbean 15 33 45.5Total Developing Countries 92 151 60.9
Figure 9.2: Countries for which Canadian FDI Data is Kept Confidential
Thisfigureshowsthenumberofcountriesforwhichdata on Canadian Foreign Direct Investment is kept confidential.Column1providesthenumberofcoun-triesforwhichthedataisconfidential;column2 is the total number of countries in each region; and column 3 is the percentage of countries for which confidentialityaboutFDIismaintained.
Figure 9.2: Countries for which Canadian FDI Data is Kept Confidential (2006)
Figure 10.1: Immigrants in Canada by Province (1996, 2001 and 2006)
Data presented in Figure 10.1 is taken from Statistics Canada, CANSIM tables 510-005 and 109-0013 and from the 2006 Census of Population, Statistics Canada catalogue no. 97-557-XCB2006006.
Maps
This edition of the CDR 2009 includes a GIS maps derived from data contained in Table 1.
Map 1.1: UNDP Human Development Index by Region (2005)


55 Murray Street, Suite 200Ottawa, Canada, K1N 5M3Tel: 613.241.3535Fax: 613.241.7435Email: [email protected]: www.nsi-ins.ca
ISBN 978-1-897358-05-4Printed in Canada
The North-South Institute
CanadianDevelopment Report 2009