canada’s low-risk alcohol drinking guidelines among...
TRANSCRIPT
October 2014 (Revised July 2015)
Canada’s low-risk alcohol drinkingguidelines among post-secondary students

AuthorsVéronique Charbonneau, B.P.H.E - Laurentian University/Sudbury & District Health UnitAlain P. Gauthier, PhD, Principal Investigator - Laurentian UniversityJoëlle Martel, MHP, Principal Investigator - Sudbury & District Health UnitDiana J. Urajnik, PhD, Principal Investigator - Laurentian UniversityJulie Dénommé, BSW - Sudbury & District Health UnitSandra Laclé, RN, MScN - Sudbury & District Health UnitMarc Lefebvre, MA - Sudbury & District Health UnitDar Malaviarachchi, MSc - Sudbury & District Health UnitIsabelle Michel, MA - Collège BoréalNathalie Thistle, RN, BScN - Sudbury & District Health Unit
AcknowledgementsThe authors would like to thank Alissa Palangio of the Sudbury & District Health Unit for herassistance with the data analyses, as well as the Sudbury & District Health Unit’s Health PromotionDivision for their contribution to practice recommendations.
This project was funded by a Louise Picard Public Health Research Grant (Principal Applicants:Alain P. Gauthier (LU), Diana J. Urajnik (LU), and Joëlle Martel (SDHU)).
This project was also supported by the Northern Ontario Heritage Fund Corporation YouthInternship Program. (Principal Applicants: Alain P. Gauthier (LU) and Sandra Laclé (SDHU) –Youth Internship Program Recipient: Véronique Charbonneau (LU/SDHU)).
Contact for More InformationAlain P. Gauthier, PhD Sandra Laclé, MScNAssociate Professor, School of Human Kinetics Director, Health PromotionLaurentian University Sudbury & District Health Unit705. 675.1151, ext. 1071 705.522.9200, ext. [email protected] [email protected]
CitationCharbonneau, V., Gauthier, A.P., Martel, J., Urajnik, D., Dénommé, J., Laclé. S., Lefebvre, M.,Malaviarachchi, D., Michel, I., Thistle, N. (2014). Canada’s low-risk alcohol drinking guidelinesamong post-secondary students. Sudbury, ON: Sudbury & District Health Unit.
Le sommaire de ce rapport est disponible en français.
Canada’s low-risk alcohol drinking guidelines among post-secondary students ■ iii
Contents
List of Figures and Tables v
Fact Sheet viiKey Findings vii
Conclusions and Recommendations viii
Executive Summary ixBackground ix
Methods x
Results x
Conclusions xi
Recommendations xi
Introduction 1Background 2
Consequences of Alcohol Use and Misuse 2
Factors Linked to Student Alcohol Use and Misuse 3
Individual Factors 3
Social Factors 4
Environmental Factors 5
Prevention of Alcohol Misuse in Post-Secondary Institutions 5
Policies, Restricted Access to Alcohol and Environmental Support5
On-campus Housing 6
Social Marketing Strategies 7
Education and Support Services 7
Skill-building 7
Student Engagement 8
Community Partnerships 8
iv ■ Canada’s low-risk alcohol drinking guidelines among post-secondary students
Summary 8
Methods 10Survey Development 10
Data Collection 10
Statistical Analyses 11
Results 12Survey Findings 12
Respondent Characteristics 12
A. Alcohol Use 12
B. Knowledge and Awareness of the LRADG 17
C. Beliefs and Attitudes 19
D. General Health Information 21
Comparison to Population Data 22
Recommendations 24Students 24
Administrators and Decision-Makers 25
Educators and Health Promoters 26
Conclusion 28
Endnotes 29
References 33
Appendix 40

Canada’s low-risk alcohol drinking guidelines among post-secondary students ■ v
List of Figures and Tables
Figure 1: Respondents Having Consumed Alcohol in the Past 12 Months 13Figure 2: Students Having Binge Drank at Least Once a Month in the Past Year 14Figure 3: Exceeding the LRADG - All Students 15Figure 4: Exceeding the LRADG - By Sex 16Figure 5: Exceeding the LRADG - By Age Category 17Figure 6: Awareness of the LRADG 18Figure 7: Preferred Means to Receive Information about the LRADG 19Figure 8: Disposition towards Having More Alcohol Education Programs on Campus 20Figure 9: Preferred Means to Receive General Health Information 22
Table 1: Demographics 41Table 2: Behaviours (Total) 43Table 3: Behaviours by Sex 47Table 4: Behaviours by Age 50Table 5: Behaviours by Ethnicity 54Table 6: Behaviours by Mother Tongue 57Table 7: Behaviours by Institution Type 60Table 8: Behaviours by Academic Discipline 64Table 9: Behaviours by Living Arrangement 68Table 10: Knowledge (Total) 72Table 11: Knowledge by Sex 73Table 12: Knowledge by Age 74Table 13: Knowledge by Ethnicity 76Table 14: Knowledge by Mother Tongue 77Table 15: Knowledge by Institution Type 78Table 16: Knowledge by Academic Discipline 80Table 17: Knowledge by Living Arrangement 82Table 18: Behaviours by Knowledge 84Table 19: Beliefs (Total) 86Table 20: Beliefs by Sex 89Table 21: Beliefs by Age 92Table 22: Beliefs by Ethnicity 95Table 23: Beliefs by Mother Tongue 98Table 24: Beliefs by Institution Type 100
vi ■ Canada’s low-risk alcohol drinking guidelines among post-secondary students
Table 25: Beliefs by Academic Discipline 102Table 26: Beliefs by Living Arrangement 105Table 27: Beliefs by Levels of Alcohol Consumption 108Table 28: Health Information Preferences (Total) 111Table 29: Health Information Preferences by Sex 112Table 30: Health Information Preferences by Age 113Table 31: Health Information Preferences by Ethnicity 114Table 32: Health Information Preferences by Mother Tongue 115Table 33: Health Information Preferences by Institution Type 116Table 34: Health Information Preferences by Academic Discipline 117Table 35: Health Information Preferences by Living Arrangement 118Table 36: Comparison of Local and Provincial Rates 119
Canada’s low-risk alcohol drinking guidelines among post-secondary students ■ vii
Fact Sheet
Heavy alcohol consumption is one of the most challenging issues facing institutions of highereducation; harmful use or misuse can lead to the degradation of the on-campus environmentand affect the quality of education. Recently, the Canadian Centre on Substance Abuse(CCSA) released Canada’s Low-Risk Alcohol Dinking Guidelines (LRADG).
Recommendations within these guidelines state that women should not exceed two alcoholicdrinks per day, 10 per week, and that men should have no more than three alcoholic drinks aday, 15 per week.a For both sexes, an extra beverage is allowed on special occasions.
The objectives of this project were 1) to assess trends in alcohol use amongst post-secondarystudents in the City of Greater Sudbury; 2) to assess their awareness of the LRADG; and 3)to identify prevention strategies from which students could benefit.
Key FindingsA total of 1,829 students completed the survey. The majority of respondents attendedLaurentian University (n=1,518). The mean age was 22.8 years old and 68.5% (n=1,247) ofrespondents were between the ages of 19 and 24 years. Seventy-five percent (n=1,360) of therespondents were female.
Ninety-two percent (n=1,677) of the students reported consuming alcohol in the past 12months. Based on valid cases, forty-seven percent (n=711) of respondents drank in excess ofat least one of the LRADG measures in the past year (Daily recommendations: 28.8%;Weekly recommendations: 9.0%; Binge drank regularly: 41.3%). A greater percentage ofmen, students between the ages of 19 and 24, Caucasians and students living in residenceexceeded daily, weekly, and binging limits.
Fifteen percent (n=278) of students had seen or heard of the LRADG in the past. Thepreferred means to receive information about the LRADG were ‘through the media’ (32.3%;n=576), and ‘electronically’ (31.7%; n=567).
a Canadian Centre on Substance Abuse. Canada's Low-Risk Alcohol Drinking Guidelines. [Online] 2013. [Cited: August 21, 2014.]http://www.ccsa.ca/Resource%20Library/2012-Canada-Low-Risk-Alcohol-Drinking-Guidelines-Brochure-en.pdf.

viii ■ Canada’s low-risk alcohol drinking guidelines among post-secondary students
Conclusions and RecommendationsOur results support the need to encourage the responsible consumption of alcohol in post-secondary institutions in the City of Greater Sudbury. Students, administrators, and healthpromoters/educators all have a responsibility in implementing strategies and initiatives to reduceand prevent alcohol-related harms. The key to success is to create a campus where responsibledrinking behaviours are the social norm, where policies are in place to reduce risks and supportstudents in engaging in healthy behaviours, and health messaging is tailored appropriately forthe target audience. Only then will a culture of moderation be embraced.
Canada’s low-risk alcohol drinking guidelines among post-secondary students ■ix
Executive Summary
BackgroundInappropriate alcohol consumption in the post-secondary setting is one of the mostchallenging issues facing institutions of higher education.1 Canada’s Low-Risk AlcoholDrinking Guidelines (LRADG) are a key component of the National Alcohol Strategyand were developed to help Canadians moderate their alcohol consumption and reducetheir immediate and long-term alcohol-related harms.2,3 Recommendations within theseguidelines state that women should not exceed two alcoholic drinks per day, and no morethan 10 per week, while men should have no more than three drinks a day, 15 per week.3
On special occasions, the LRADG allow for one extra alcoholic beverage (three per dayfor women and four for men), but these exceptions are discouraged for young adultsunder 24 years of age. 2, 4 Excessive alcohol consumption peaks in young adulthood (ages18/19-24 years),5 the age group that makes up the majority of the undergraduate studentpopulation, and that has the highest rates of non-compliance with the LRADG.6
Additionally, a significant proportion of students engage in episodic heavy drinking (alsoreferred to as ‘binge drinking’).7 A binge drinking episode is the consumption of five ormore drinks in one occasion, and ultimately exceeds any of the daily LRADGrecommendations for both sexes. The consequences of exceeding the LRADG areserious and may contribute to the degradation of the on-campus environment and affectthe quality of education.8
Action to mitigate alcohol-related harms is essential, as according to The CanadianCommunity Health Survey 2011/2012, the percentage of individuals in Ontario betweenthe ages of 19 and 24 who exceed the LRADG is alarming (Exceeds Daily: 29.9%;Exceeds Weekly: 9.2%; Binges Regularlyb: 39.1%).9 Rates are said to be as high orhigher in post-secondary settings.5,10 The prevalence of alcohol misuse among youngpeople underscores the importance of an in-depth examination. Harm-reduction andhealth promotion efforts require a concerted examination of the culture of alcohol use oncampus11 as the assessment of alcohol-related behaviours (e.g. student use, knowledge,awareness of harms) can inform a comprehensive strategy that addresses the extent ofmisuse, and the context within which it occurs. Furthermore, an approach that involvesall post-secondary institution members and partners, including students, has the potentialto generate sustained and meaningful change.12
b Once a month or more
x ■ Canada’s low-risk alcohol drinking guidelines among post-secondarystudents
As a preliminary step to addressing issues relating to the consumption of alcohol at post-secondary institutions in the City of Greater Sudbury, our team conducted a campus-wide survey of the student populations of Laurentian University, Cambrian College andCollège Boréal. The goals of our study were a) to assess trends in alcohol use amongpost-secondary students in the City of Greater Sudbury (as per the LRADG); b) to assesstheir awareness of the LRADG ; and c) to identify – via collaborative input – bestpractice prevention and intervention strategies from which students could benefit.Results will inform programs designed to target alcohol consumption behaviours. Thisproject will also serve as a model for engaging community partners and ensuring the useof evidence-informed public health practice at post-secondary institutions.
MethodsThe Campus Alcohol Behaviour Survey – a 50 item questionnaire – was collated basedon questions from pre-existing population health surveys using Gravic’s Remark WebSurvey®. The intent was to use items with pre-established psychometric properties. Allstudentsc (~15,000) enrolled at one of three post-secondary institutions in the City ofGreater Sudbury (Laurentian University, Cambrian College, and Collège Boréal) weregiven access to both English and French versions of the survey via their student emailaccount in the fall of 2013. Participation was voluntary and an incentive was offered.Survey data were analysed in IBM® SPSS® Statistics 21.
ResultsDemographics: A total of 1,829 students completed the survey. The majority ofrespondents attended Laurentian University (n=1,518). The mean age was 22.8 years and68.5% (n=1,247) of respondents were between the ages of 19 and 24 years. Seventy-fivepercent (n=1,360) of respondents were female and 84.4% (n=1,526) were Caucasian.English was identified as the first official language spoken for 65.8% (n=1,197). Twentyone percent of respondents (n=383) lived in residence.
Alcohol Use: Ninety-two percent (n=1,677) of the students reported consuming alcoholin the past 12 months. Collectively, 46.6% (n=711) of respondents (including abstainers)drank alcohol in excess of at least one of the LRADG measures (including bingedrinking at least once a month) in the past year. A greater percentage of men, whencompared to women, exceeded daily (33.8% vs 27.1%), weekly (13.3% vs. 7.5%), bingedrinking (50.7% vs. 38.1%) and combined measures (54.9% vs. 43.8%) limits. A greaterpercentage of students between the ages of 19 and 24 years, when compared to thoseyounger than 19 or older than 24, exceeded daily (30.8% vs 23.2% and 25.1%), weekly(10.0% vs. 6.0% and 7.1%), binge drinking (46.8% vs. 33.7% and 27.0%) and combinedmeasures (50.7% vs. 38.1% and 36.7%) limits. A greater percentage of Caucasians,when compared to non-Caucasians, exceeded daily (30.1% vs. 21.6%), weekly (9.5% vs.
c Includes full-time & part time, undergraduate & graduate, and in-person & distance education students.Students attending the Laurentian University satellite campus in Barrie were also eligible to receive theemail invitation, and some may have participated in the survey.
Canada’s low-risk alcohol drinking guidelines among post-secondary students ■xi
6.0%), binge drinking (43.0% vs. 32.1%) and combined measures (48.6% vs. 35.3%)limits. A greater percentage of students living in residence, when compared to thoseliving off-campus with or without parent/s or guardian/s, exceeded the daily (33.9% vs.21.2% and 31.2%), weekly (11.2% vs. 6.2% and 9.8%), binge drinking (43.2% vs. 38.9%and 42.1%) and combined measures (48.1% vs. 42.7 and 48.4%) limits.
Knowledge: Fifteen percent (n=278) of students had seen or heard of the LRADG.Awareness of the LRADG was higher among women (16.3%; n=222), students olderthan 24 years (20.1%; n = 74), non-Caucasians (18.9%; n=53) and students living inresidence (17.3%; n=66). Awareness of Canada’s LRADG was associated with moremoderate drinking behavioursd. The preferred means to receive information about theLRADG was ‘through the media’ (32.3%; n=576), closely followed by ‘electronically’(31.7%; n=567).
Beliefs: Alcohol consumers who exceeded the LRADG were inclined to adopt beliefsthat are generally associated with at-risk drinking, while moderate and Alcoholabstainers alike largely held opposing beliefs. Students typically favoured lessenforcement from administration and the government, but attitudes towards preventionand education efforts were generally positive. For example, most of the students (85.9%,n=1,447) had a neutral or favourable opinion towards the statement ’there should bemore alcohol education programs on campus’.
Health Information: The majority of students (81.9%, n=1,469) were interested inreceiving health-related information or advice. The percentage of students inclined toreceive this type of material was greater among women, as well as non-Caucasians.There was no association between age and willingness to receive health information. Thepreferred means for all demographic groups to receive general health information waselectronically (35.0%, n=616).
ConclusionsOur results support the need to encourage the responsible consumption of alcohol inpost-secondary institutions in the City of Greater Sudbury. Furthermore, few respondentswere familiar with the LRADG. However, raising awareness about these guidelinescould contribute to a healthier campus environment, and encouragingly, studentsdemonstrated interest in receiving more education regardling alcohol and their health,especially through media and electronic means.
RecommendationsOur results and review of the literature provide a guide for students, administrators andhealth promoters to develop a comprehensive program tailored to the needs of the post-secondary student population:
d i.e. reduced frequency of binge drinking episodes (χ2=11.144, p=0.011), and fewer episodes ofdrunkenness (χ2=8.234, p=0.016).
xii ■ Canada’s low-risk alcohol drinking guidelines among post-secondarystudents
1. Student leaders can develop an awareness and education strategy for students aroundthe risks and harms associated with heavy alcohol consumption. They may alsoinfluence actual and perceived social norms by developing an awareness campaign tode-normalize binge drinking, and by establishing peer-led educational programs thatallow students to engage in an open and trusting discussion with fellow students.
2. Administrators and decision-makers need to enforce all current alcohol laws andregulations. They should also implement harm-reduction measures, such as banningdrinking games and objects that encourage rapid or high volume consumption,develop and enforce policies for institution-sanctioned and student-led events, providestaff training, and create supportive environments where post-secondary students aresafe and encouraged to live healthy lifestyles.
3. Health Promoters and educators should disseminate health promotion messaging viathe media and electronically, offer and implement the use of Screening & BriefIntervention (SBI) tools, deliver LRADG and health promotion messaging to allstudents, as well as further target high-risk students and high-risk alcohol use.
Canada’s low-risk alcohol drinking guidelines among post-secondary students ■ 1
Introduction
Inappropriate alcohol consumption in the post-secondary setting is one of the mostchallenging issues facing institutions of higher education.1 Recently, the Canadian Centre onSubstance Abuse (CCSA) released the Canadian Low-Risk Alcohol Dinking Guidelines(LRADG).2 The LRADG are a key component of the National Alcohol Strategy and weredeveloped to help Canadians moderate their alcohol consumption and reduce their immediateand long-term alcohol-related harm. The LRADG state that women should not exceed twoalcoholic drinks per day, 10 per week, and that men should have no more than three alcoholicdrinks per day, 15 per week.3 On special occasions, the LRADG allow for one extra beverage(three for women and four for men), but these exceptions are strongly discouraged for youngadults under the age of 24.2, 4 Excessive alcohol consumption peaks in young adulthood (ages18/19-24 years),5 the age group that makes up the majority of the undergraduate studentpopulation, and that has the highest rates of non-compliance with the LRADG.6 Additionally,a significant proportion of students engage in episodic heavy drinking (also referred to as‘binge drinking’).7 The consequences of exceeding the LRADG are serious and maycontribute to the degradation of the on-campus environment and affect the quality ofeducation.8
Action to mitigate alcohol-related harms is essential as according to the CanadianCommunity Health Survey 2011/2012 the percentage of persons in Ontario between the agesof 19 and 24 who exceed the LRADG is alarming (exceeds weekly- 9.2%; exceeds daily-29.9%; binges regularlye- 39.1%).9 Rates are said to be as high or higher in post-secondarysettings.5, 10 The sheer prevalence of alcohol misuse amongst these young people underscoresthe importance of an in-depth examination. Harm-reduction and health promotion effortsrequire a concerted examination of the culture of alcohol use on campus;11 the assessment ofalcohol-related behaviours (e.g. student use, awareness of harms) can inform acomprehensive strategy that addresses the extent of misuse, and the context within which itoccurs. Furthermore, an approach that involves all post-secondary institution members andpartners, including students, has the potential to generate sustained and meaningful change.12
As a preliminary step to addressing issues relating to the consumption of alcohol at post-secondary institutions in the City of Greater Sudbury, our team conducted campus-widesurveys of the student populations of Laurentian University, Cambrian College and CollègeBoréal. The goals of our study were a) to assess trends in alcohol use among post-secondary
e Once a month or more

2 ■ Canada’s low-risk alcohol drinking guidelines among post-secondary students
students in the City of Greater Sudbury (as per the LRADG); b) to assess their awareness ofthe LRADG ; and c) to identify – via collaborative input – best practice prevention andintervention strategies from which students could benefit. Results will inform programsdesigned to target alcohol consumption behaviours. This project will also serve as a modelfor engaging community partners and encouraging the use of evidence informed publichealth practice at post-secondary institutions.
BackgroundAlcohol is the most widely used psychoactive drug among Canada’s teens and youngadults.13,14 The National Institute on Alcohol Abuse and Alcoholism (NIAAA) found thatyoung adults who attend post-secondary institutions consume even more alcohol than theirnon-student counterparts.15 The Nova Scotia Department of Health and Wellness11 noted thatalcohol consumption is often perceived to be a part of the transitioning process fromsecondary to post-secondary education, a sort of rite of passage. According to the 2004Canadian Campus Survey (CCS), alcohol was consumed by over 85% of Canadian studentsin the past year.7
Post-secondary students display diverse alcohol consumption patterns. Their degrees of usemay vary from experimental, to intensive. According to Oei and Morawska,16 there are fourtypes of drinkers: normal/social drinkers, binge drinkers, regular heavy drinkers, and problemdrinkers or alcoholics. Binge drinking is a characteristic of post-secondary students.11,17
Binge drinking episodes are frequently defined as the consumption of five or more alcoholicdrinks on one occasion for men, and four or more drinks on one occasion for women.11,18
However, our study refers to the description (previously) adopted by Statistics Canada19 andthe CCS7 that defines binge drinking as having five or more alcoholic drinks on any oneoccasion, irrespective of sex.f Binge drinking ultimately exceeds any of the LRADG dailylimits for both sexes, and is strongly discouraged. Like any form of excessive drinking, bingedrinking may lead to more serious and problematic drinking patterns and alcohol usedisorders.20 Its monthly prevalence among Canadian post-secondary students was nearly 30%in the year prior to the CCS.7
Consequences of Alcohol Use and MisuseAlcohol misuse can lead to a variety of harmful outcomes; these include detrimentalphysical, social, mental, economic and environmental consequences.14,21 An array of acuteand chronic physical effects from hazardous alcohol consumption exists along a continuumof severity, ranging from minor personal injuries to death. There is a growing body ofevidence linking short- and long-term alcohol consumption to more than 60 chronic
f Since the collection of our data, Statistics Canada has reduced women’s measure for binge drinking to four ormore drinks to conform to the World Health Organization and Health Canada guidelines (seehttp://www.statcan.gc.ca/pub/82-625-x/2014001/article/14019-eng.htm).

Canada’s low-risk alcohol drinking guidelines among post-secondary students ■ 3
debilitative conditions12 including stroke and cancer.22,23 According to the World HealthOrganization (WHO), alcohol is responsible for 3.3 million deaths (or 5.9% of all deaths)annually.24
Excessive use also increases the risk of unplanned sexual activity, unprotected sex, sexualand physical assaults, falls, suicides and motor vehicle collisions.11, 25, 22 In 2002 alone, 4,258deaths of Canadians were attributed to the consumption of alcohol.26 Teenagers and youngadults are particularly vulnerable to fatalities due to personal injuries and poisoning that areoften alcohol-related.14 According to Mothers Against Drunk Driving (MADD),27 theleading causes of death among youth 16 to 25 years are motor vehicle collisions, with alcoholand/or drugs being a factor in more than half of accidents.
When individuals of any age engage in harmful drinking patterns, alcohol can interfere withareas of the brain related to executive functioning, either momentarily or permanently.14
However, the LRADG emphasize that youth in their late teens to age 24 years should neverexceed the daily and weekly limits.28 This is due to the fact that the brain is particularlyvulnerable during youth and early adulthood, and alcohol misuse can hinder its developmentand consequently lead to problems in adulthood.29, 30 Evidence also suggests a strongassociation between early initiation of drinking (especially heavy drinking) and later alcohol-related problems.30
Alcohol misuse may also negatively impact a person’s mental health.14 For instance,behaviours such as bingeing can contribute or lead to alcohol dependence, depression,12, 22, 31
and elevated distress.7 These effects undoubtedly contribute to the elevated rates of mentaldistress that today’s post-secondary students’ experience.7
Other consequences commonly experienced by those who consume alcohol excessively arefeelings of guilt and regret, hangovers, memory loss, and further effects that could hinder theperformance of normal everyday activities.7 For students, binge drinking is associated withmissing classes, falling behind in assignments, having lower grades, sleep disturbances, thedeterioration of relationships, and increased contact with the police.8
Binge drinking has several peripheral impacts; other students, university faculty, staff, aswell as the broader geographic community in which schools are located are negativelyaffected by students who excessively consume alcohol. These are also known as second handeffects of drinking.32 Examples include: noise and sleep disturbances, property damage,being insulted or humiliated, being involved in serious arguments, being pushed, hit orassaulted, and the increased presence of litter.7, 8, 11, 32
Factors Linked to Student Alcohol Use and MisuseIndividual FactorsPersonality traits and cognitive processes can help explain one’s drinking patterns.13, 33 Forexample, those with low academic and/or high recreational orientation tend have moreexcessive alcohol drinking habits.34 Similarly, those who have lowered impulse control
4 ■ Canada’s low-risk alcohol drinking guidelines among post-secondary students
and/or are sensation-seeking and/or who seek independence display riskier alcoholbehaviours.35, 36 Furthermore, a person’s motivation helps determine the drinking behavioursthat are adopted; many individuals are motivated to drink in order to amplify positiveaffective states, escape negative ones, express socially inappropriate behaviour, enhancesocial pleasures, or simply to get intoxicated.35 There also appears to be ethnic, cultural andreligious differences.30, 33
In terms of gender, the literature clearly shows that male students report heavier and morefrequent alcohol consumption than female students.14, 37 Gliksman, Adlaf, Demers, andNewton-Taylor34 found that men were more likely than women to drink alcohol at least twiceper week (27.0% vs. 15.1%) and in greater quantities on a weekly basis (8.8 vs. 4.6 drinksper week in the past-year). On the other hand, women are more likely than men to refuse analcoholic drink.38 However, despite the fact that men are more likely to drink excessivelythan women, there are concerns for women’s drinking patterns given that the extent offemale drinking has increased exponentially in recent years39, 40 and they are closing thegender gap.14 It is particularly alarming since women tend to have lower alcoholmetabolizing enzyme activity,41 typically weigh less than men, and relatively speaking,usually have less muscle mass than men do. Thus, even if consuming the same amount ofalcohol, blood alcohol concentration in women tends to be higher than men even if they areof the same weight.42
Social FactorsParents (or guardians) influence student alcohol drinking patterns, especially when studentslive at home.7 Researchers have found that students living off-campus with parents/guardiansdrink alcohol less often and less heavily than students living without them.7, 34 Furthermore,the stronger and more positive the student-parent/guardian relationship, the greater thechance a student will consume alcohol responsibly.35, 43 However, this effect is more likely tooccur when the parents/guardians themselves do not engage in excessive alcoholconsumption.35 Regardless of living arrangement, parental/guardian influence is significantlyreduced once their dependents enter college or university, due in great part to peer influence(commonly referred to as ‘peer pressure’).43
Alcohol consumption norms have an important impact on drinking practices among post-secondary students.13, 43 Indeed, there is a strong tendency for people to conform to grouppatterns and expectations43 and peer influence is undoubtedly one of the most, if not the mostpowerful predictor of alcohol consumption behavior.35, 27, 43 Being without a drink at a socialfunction typically invites comments or offers of alcohol,38 and represents a classic exampleof peer pressure. In addition to overt offers of alcohol, peer pressure may also includeattempts to conform to actual and perceived social norms.13. All of these factors can incite astudent to begin drinking or to adopt riskier alcohol drinking behaviours.35, 38 Moreover,students spend a considerable amount of time off-campus and their social influence is notexclusive to the campus environment. 13, 43

Canada’s low-risk alcohol drinking guidelines among post-secondary students ■ 5
Environmental FactorsAlcohol consumption is also influenced by living arrangements.37 Researchers have foundthat students living on-campus drink alcohol more often and more heavily than studentsliving off-campus.7, 34 Students tend to take advantage of low-priced promotions, happyhours and cover charges for unlimited drinking at bars on campus7 and attendance at suchpromotional events is associated with excessive drinking.39 In the CCS, students whofrequently consumed alcohol found the campus environment conducive to their drinking, andheavy drinkers believed that the alcohol policies on their campus were not enforced.7 This isconsistent with the literature in that alcohol consumption and related harm is positivelyassociated with alcohol availability.44
Prevention of Alcohol Misuse in Post-SecondaryInstitutionsThe literature points to events of transition to independence, such as pursuing post-secondarystudies, as key periods to address the prevalence of alcohol misuse.12, 45, 46 Post- secondaryinstitutions should therefore endeavour to foster a culture of moderation and health. The bestway to achieve this is by adopting a comprehensive health promotion approach as opposed tostand-alone programs,12, 13 since every individual mode of health education has its own scopeof effectiveness.47 Intervention and prevention programs need to reach college/universitystudents on all levels; including the individual level (e.g. to seek to reduce the demand foralcohol and individual harms that can result from heavy drinking) and the environmentallevel (e.g. to focus on reducing the supply and access of alcohol to the students).11 Accordingto the social-ecological model,48 comprehensive approaches have several levels of influence;they act on individual, interpersonal, organizational, community and public health policylevels. Accordingly, a comprehensive strategy could involve, but is not exclusive to,education and awareness, social marketing, skill-building, policies, restricting access toalcohol, environmental supports, and community action, in conjunction with treatment andearly intervention health services. Furthermore, systems to monitor alcohol use should bedeveloped, and all initiatives ought to be evaluated, to ensure the effective progress of theprogram.12, 21
Policies, Restricted Access to Alcohol and EnvironmentalSupportUltimately, to address alcohol consumption behaviours and reduce alcohol-related harms atthe local level, evidence points first and foremost to policy efforts. As noted by Babor andcolleagues,21 in order to reduce harm and promote positive health (individual andcommunity), a comprehensive policy approach must focus on seven key areas: Pricing andtaxation, the regulation of physical availability, modification of the drinking environment,drinking and driving countermeasures, restrictions on marketing, education and persuasion,as well as early intervention and treatment.
6 ■ Canada’s low-risk alcohol drinking guidelines among post-secondary students
Regulating alcohol availability and consumption should be a priority,12 particularly sinceaccording to the CCS,7 “frequent drinkers find the campus environment conducive to theirdrinking, and heavy drinkers believe that the alcohol policies on their campus are notenforced” (p.87). Possible regulations include prohibiting alcohol discounts, ensuring thatnon-alcoholic beverages are always available and less expensive,11 limiting sponsorships byalcoholic beverage producers and retailers, increasing the price or taxes on alcoholicbeverages,13, 45, 49 restricting alcohol industry and event advertisement to students on- and off-campus if possible,12, 13, 45 restricting the number of alcohol outlets in a given area, restrictinghours and days of sale of outlets, and requiring campus bar servers to receive appropriatetraining and comply with such training.21, 50 Given the fact that roughly 90% of first-yearstudents who live in post-secondary residences in Ontario are under the legal drinking age,g,11
institutions should place a particular emphasis on reinforcing the laws prohibiting access andsales to minors, which is now a well-known best practice for reducing underage and riskydrinking among that population.12, 45, 49, 51, 52, 53
All policies must be clear to students 51, 54 and to the rest of the campus community, and mustbe enforced to ensure adherence.12 Policies should include standards of conduct, and iteratethe consequences for breaking campus rules and regulations. Administration should alsomonitor and assess the policies on a regular basis and ideally, provide information on therisks associated with the misuse of alcohol.11, 45
On-campus HousingFindings reported earlier in this document suggest that campus residences should be a maintarget when attempting to prevent students’ alcohol misuse.7 It is suggested, and in somecases attempted, that some residences become completely ‘dry’, or in other words, alcohol-free.32 Many students themselves are in favour of dry residences. When asked, nearly 20% ofstudents express that they either already live in an alcohol-free residence, or that they wouldlike to.7 However, this strategy and the reduction of alcohol misuse is questionable becauseof the self-selection bias that occurs;32 students who voluntarily choose to live in alcohol-freeresidences often do so because they already prefer not to engage in, or be surrounded by suchactivities. Nonetheless, dry residences have the potential to help foster a healthy campusculture, and are certainly a valuable option to offer to students who wish not to suffer fromthe ‘second-hand’ consequences of alcohol misuse.32
Another mean of treating the issue is by implementing and ensuring enforcement of health-promoting policies,53 in addition to the policies mentioned previously. Examples ofresidence-oriented policies include: the prohibition of underage drinking, rules that limitwhen and where alcohol can be consumed, the regulation of the size of alcohol containers,and the prohibition of drinking games or use of drinking objects that encourages rapid orhigh volume consumption of alcohol (e.g. funnels) .7, 11 Campus administrators could alsodesignate ‘event staff’, including Residence Assistants, to monitor residence areas and events
g 19 years

Canada’s low-risk alcohol drinking guidelines among post-secondary students ■ 7
where alcohol is involved. Staff could work with the institution to develop a riskmanagement assessment tool, and have students complete it before any event that mayinvolve alcohol. This helps students to think about the hazards of consuming alcohol and thusmay promote the adoption of less harmful behaviours. 11
Social Marketing StrategiesNumerous studies have shown that alcohol advertising and promotion increases thelikelihood that adolescents will start to use alcohol and to drink more if they are alreadyusing alcohol.55 Conversely, counter-advertising to balance the effects of alcohol advertisingcan decrease the appeal of alcoholic beverages, and social marketing can help raiseawareness about new or changed alcohol policies.12 Media strategies that have been found toincrease the appeal of alcoholic beverages, such as the use of humour,56 should also be usedin counter-advertising. However, these strategies often result in limited positive behaviouralchange, and thus should be adopted coincidentally with a variety of other interventions.45
Education and Support ServicesEducational strategies are also recommended in a comprehensive initiative as theireffectiveness is moderate.12 The most reputable educational methods found in the existingliterature include changing students’ perceived norms and acting against peer influence byproviding personalized normative feedback.12, 13, 21 A best practice in this field consists ofperforming ‘Brief Interventions’.13, 21, 45, 57 Brief interventions are said to be particularlyhelpful for binge drinkers (as opposed to dependent drinkers),58 and thus cater well to thepost-secondary population.21 This evidence-based intervention consists of identifying at-riskdrinkers, motivating them to change, providing feedback to the individuals about personalrisk, explicit advice to change behaviour, and sometimes referral to specialists.59, 60, 61 Theycan range from a brief conversation to many counselling sessions58 and may even becompleted via mobile and online technology.62 These electronic tools present manyadvantages for the campus setting (e.g.: reach, feasibility, cost-effectiveness).63
Post-secondary establishments should also ensure the existence of diversely accessiblecounselling, screening and treatment programs offered by fully trained professionals, andraise awareness about the availability of these support services. Computer-basedinterventions can serve as an alternative for individuals who remain hesitant to pursuepotentially stigmatizing treatment such as face-to-face counselling or those who are reluctantto identify behaviours as problems.64 Nonetheless, post-secondary institutions should make ita priority to prevent the stigmatization sometimes associated with the use of supportservices.13 Promoting equity and diversity as well as establishing anti-stigma practices acrossthe entire campus community would help foster an inclusive and respectful atmosphere.65
Skill-buildingResearchers also recommend a shift toward interventions that enhance and facilitate adaptivequalities in youth, and away from interventions aimed at reducing risk factors and negativebehaviour.66 This means using strength-based practices such as building assets and fostering
8 ■ Canada’s low-risk alcohol drinking guidelines among post-secondary students
resiliency in individuals. Encouraging students’ connectedness to school is one example of astrength-based practice.12 When using this positive approach, individuals are seen as being 'atpromise' instead of 'at risk’ and key strengths are cultivated. In turn, the more protectivefactors a young individual possesses or experiences, the more resilient they are, and the lesslikely they are to engage in the use of illicit substances, including alcohol and bingedrinking.67, 68
Student EngagementInvolving students in the decision-making process and ensuring their active participation andtheir taking ownership of programs aimed at the prevention of alcohol misuse meritsconsideration. In line with the previous paragraph, researchers have suggested that increasingstudent involvement in their campus and community through productive activities andvolunteer services may help to limit overall campus alcohol consumption, thereby reducingassociated harm.8 Furthermore, it has been found that peer-led initiatives are effective,69 andspecifically in reducing alcohol use among youth.70, 71 However, this health educationapproach appears to have seldom been considered for college/university age students.Encouraging post-secondary students to initiate prevention initiatives themselves would notonly bolster their developmental strengths and sense of empowerment, but also maximize theeffectiveness of the initiatives.
Community PartnershipsAs discussed earlier, an effective approach to the prevention of alcohol misuse includes asmany sectors and members as possible. This being said, campus interventions should beenhanced by community initiatives;13 Post-secondary institutions ought to be formingcommunity coalitions11, 12, 13, 72 and implementing community-based interventions.45 Thiscould entail building sustained partnerships with local partners and stakeholders, includingpublic health, to establish municipal policies aimed at reducing alcohol-related harms fromstudent consumption on and off-campus.10, 11, 12, 13, 21 Collaboration with licensedestablishments who cater to students may work especially well in reducing alcoholavailability and accessibility. Last, educating and engaging parents and guardians ininitiatives are also of importance, as they may play a role in moderating their child’s alcohol-related behaviours.35, 73
SummaryThe drug of choice among college and university students is alcohol and there is reason forconcern given the negative consequences of excessive alcohol use. Failure to undertakeinformed, comprehensive, and long-term efforts to encourage responsible alcoholconsumption in post-secondary institutions may not only put students at risk, but negativelyimpact a university’s reputation and can have legal ramifications.74 Fortunately, harmsassociated with alcohol consumption are preventable, and research on comprehensivecampus alcohol misuse prevention programs is highly encouraging.11 Enforcing alcoholcontrol policies, reducing access and availability of alcohol, controlling pricing andmarketing, providing education and raising awareness, skill-building and forming community

Canada’s low-risk alcohol drinking guidelines among post-secondary students ■ 9
partnerships are sensible strategies that may foster a healthy campus culture if usedconcurrently. Therefore, taking a holistic approach provides a realistic and promising avenueto addressing the current alcohol consumption patterns on college and university campuses.
10 ■ Canada’s low-risk alcohol drinking guidelines among post-secondary students
Methods
Survey DevelopmentWe collated a questionnaire containing 50 items, having a completion time of less than 10minutes and that included an opportunity to leave comments. The survey was titled: CampusAlcohol Behaviour Survey. Members of our research team reviewed pre-existing populationhealth surveys, such as the Canadian Community Health Survey (CCHS), the Rapid RiskFactor Surveillance System (RRFSS), and the Ontario Student Drug Use and Health Survey(OSDUHS) to identify relevant questions. Questions from surveys that allowed us to a)assess trends in alcohol use b) evaluate awareness of Canada’s LRADG, and c) identifyprevention and intervention strategies were included in our survey. The intent was to useitems with pre-established psychometric properties that are comparable to nationalpopulation health data sets. Some questions were tailored according to the objectives of thisproject. Additional questions were added where necessary.
Once finalized, the survey questions that were not already available in French were translatedto French by members of the research team. A back-translation was completed by a non-member to validate the accuracy of the original translation, and both the French and Englishversions were uploaded to the web. The project received approval from the Research EthicsBoards of all institutions involved.h The survey was made accessible via the internet usingGravic’s Remark Web Survey.® 75 The web-based version of the questionnaire was hosted onLaurentian University’s (LU) secure server, using the proprietary survey software.Information transmitted via the web-based survey was protected by the security protocols ofthe Information Technology unit at LU. These included hardware and software firewalls toprotect the server, and Hypertext Transfer Protocol Secure (HTTPS) to encrypt web surveydata for the secure transmission of data between the respondent’s computer and the LUserver.
Data CollectionAll studentsi (~15 000) enrolled at one of three post-secondary institutions in the City ofGreater Sudbury were given access to the survey via their student email account.j
h Collège Boréal, Cambrian College, Laurentian University and the Sudbury & District Health Uniti Includes full-time & part time, undergraduate & graduate, and in-person & distance education students

Canada’s low-risk alcohol drinking guidelines among post-secondary students ■ 11
Participation was voluntary. Two e-mails (an initial request to participate, and a remindertwo weeks later) were sent to all students at Laurentian University, Cambrian College, andCollège Boréal in the fall of 2013. An incentive was offered: at the end of the survey, thestudents had the opportunity to enter their email address in a draw for a chance to win one often $100 gift certificates to a bookstore or grocery store of their choice. Email address entrieswere held separately from the survey responses to protect the participants’ anonymity.Notification of the incentive was included in the survey recruitment script to encourageparticipation.
Statistical AnalysesSurvey data were analysed in IBM® SPSS® Statistics 21.76 Descriptive statistics are presentedusing frequency distributions and group comparisons are reported using chi-square analyses.Only group level data were examined. For all analyses, missing values were excluded andcell sizes below five were suppressed.
j Students attending the Laurentian University satellite campus in Barrie were also eligible to receive the emailinvitation, and some may have participated in the survey

12 ■ Canada’s low-risk alcohol drinking guidelines among post-secondary students
Results
Survey FindingsRespondent CharacteristicsA total of 1,829 students completed the Campus Alcohol Behaviour Survey in the fall of 2013(for an estimated response rate of approximately 12%). The majority of respondents attendedLaurentian University (n=1,518), followed by Cambrian College (n=212), and CollègeBoréal (n=86).k The mean age was 22.8 years old (range: 17 to 65 years). A total of 68.5%(n=1,247) of respondents were between the age of 19 and 24 years, and 11.0% (n=200) werebelow the age of 19. Seventy-five percent (n=1,360) of students were female and 84.4%(n=1,526) were Caucasian. English was identified as the first official language spoken for65.8% (n=1,197) of the sample. Twenty one percent (n=383) lived in residence and 28.3%(n=510) were off-campus with their parent(s) or guardian(s). The remainder (50.5%, n=911)lived off-campus without a parent or guardian.
See Table 1
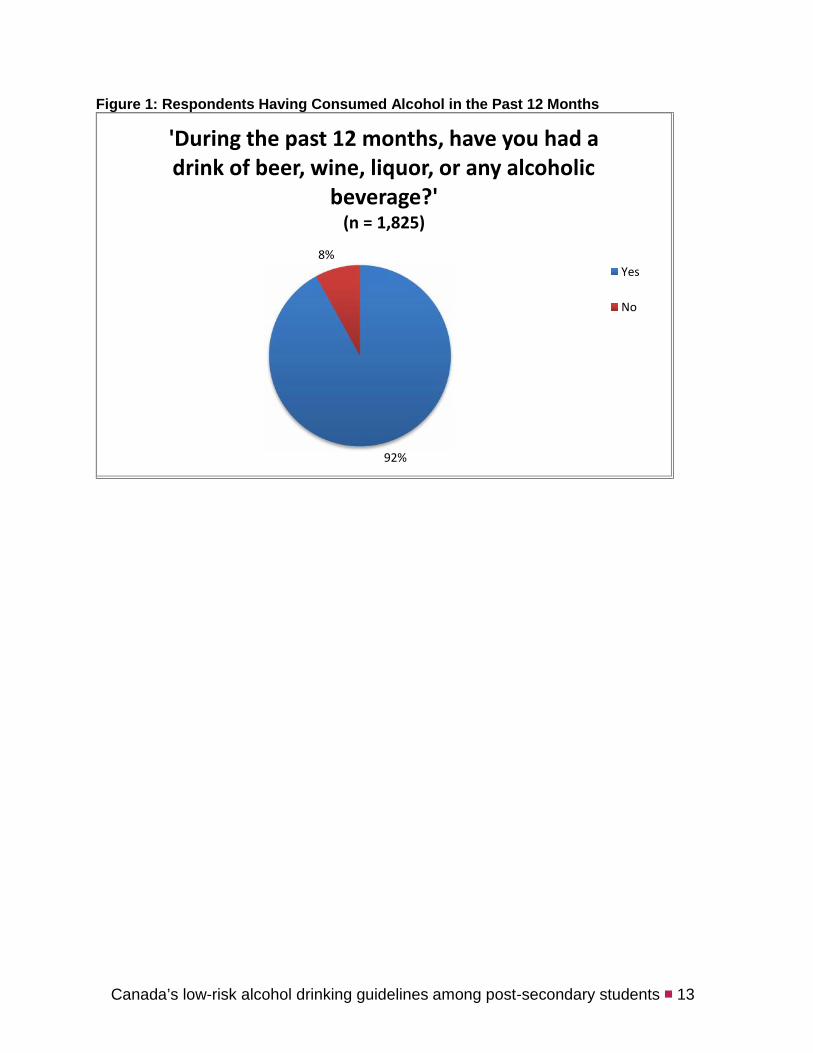
A. Alcohol UseNinety-two percent (n=1,677) (see Figure 1) of the students reported consuming at least onealcoholic drink in the past 12 months. Among alcohol consumers, many (76.9%, n=1,289)drank alcohol at least once a month in the past year, and 53.4% (n=895) declared gettingdrunkl at least monthly.
k Institution was not identified for n=13 respondentsl i.e. that they ‘got intoxicated to the point of impairment of physical and mental faculties’
Canada’s low-risk alcohol drinking guidelines among post-secondary students ■ 13
Figure 1: Respondents Having Consumed Alcohol in the Past 12 Months
92%
8%
'During the past 12 months, have you had adrink of beer, wine, liquor, or any alcoholic
beverage?'(n = 1,825)
Yes
No
14 ■ Canada’s low-risk alcohol drinking guidelines among post-secondary students
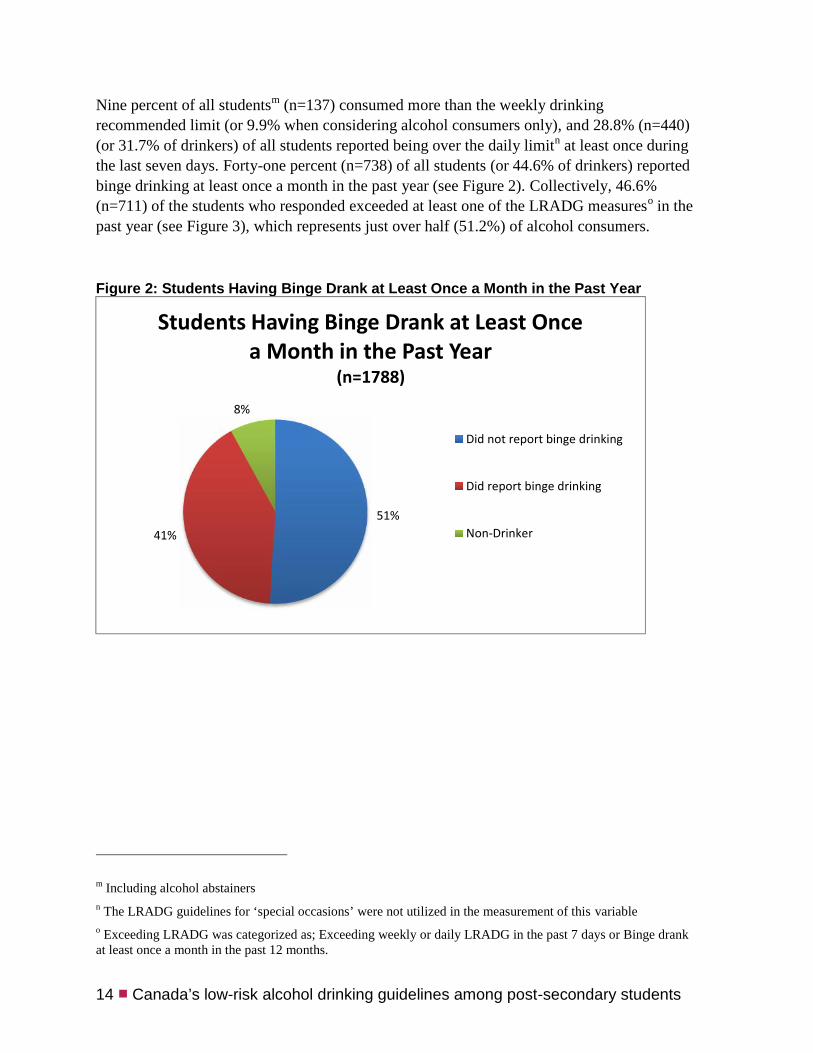
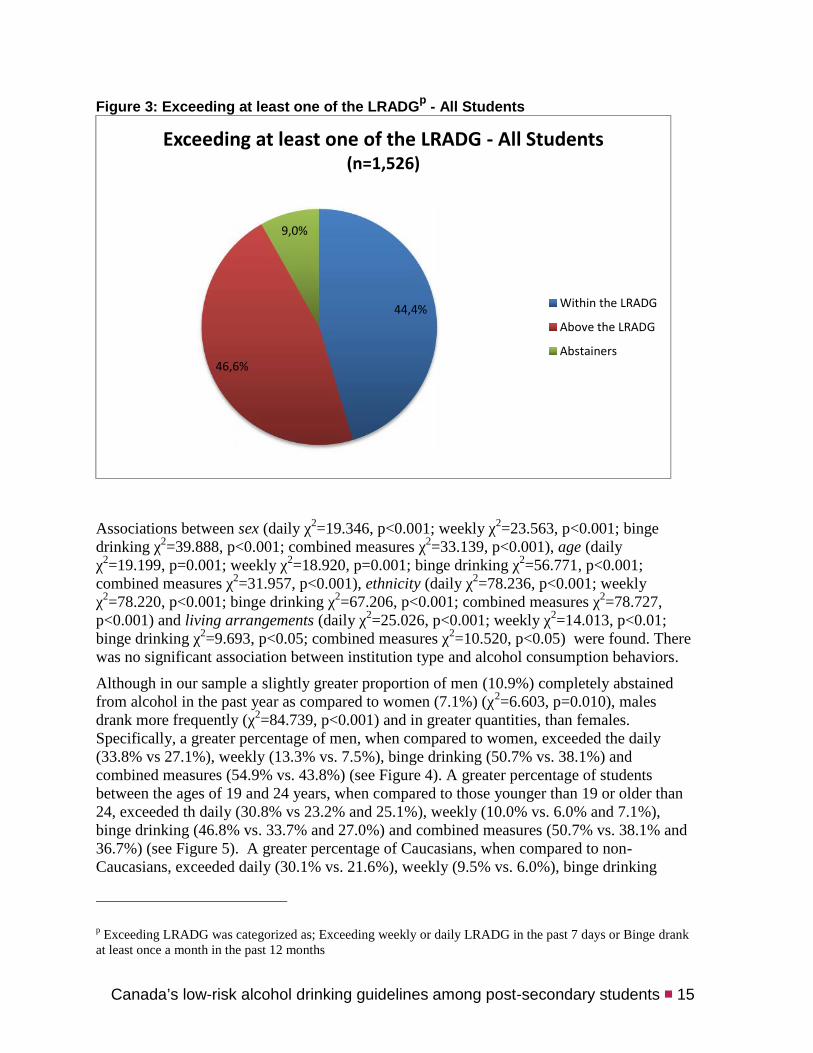
Nine percent of all studentsm (n=137) consumed more than the weekly drinkingrecommended limit (or 9.9% when considering alcohol consumers only), and 28.8% (n=440)(or 31.7% of drinkers) of all students reported being over the daily limitn at least once duringthe last seven days. Forty-one percent (n=738) of all students (or 44.6% of drinkers) reportedbinge drinking at least once a month in the past year (see Figure 2). Collectively, 46.6%(n=711) of the students who responded exceeded at least one of the LRADG measureso in thepast year (see Figure 3), which represents just over half (51.2%) of alcohol consumers.
Figure 2: Students Having Binge Drank at Least Once a Month in the Past Year
m Including alcohol abstainersn The LRADG guidelines for ‘special occasions’ were not utilized in the measurement of this variableo Exceeding LRADG was categorized as; Exceeding weekly or daily LRADG in the past 7 days or Binge drankat least once a month in the past 12 months.
51%41%
8%
Students Having Binge Drank at Least Oncea Month in the Past Year
(n=1788)
Did not report binge drinking
Did report binge drinking
Non-Drinker
Canada’s low-risk alcohol drinking guidelines among post-secondary students ■ 15
Figure 3: Exceeding at least one of the LRADGp - All Students
Associations between sex (daily χ2=19.346, p<0.001; weekly χ2=23.563, p<0.001; bingedrinking χ2=39.888, p<0.001; combined measures χ2=33.139, p<0.001), age (dailyχ2=19.199, p=0.001; weekly χ2=18.920, p=0.001; binge drinking χ2=56.771, p<0.001;combined measures χ2=31.957, p<0.001), ethnicity (daily χ2=78.236, p<0.001; weeklyχ2=78.220, p<0.001; binge drinking χ2=67.206, p<0.001; combined measures χ2=78.727,p<0.001) and living arrangements (daily χ2=25.026, p<0.001; weekly χ2=14.013, p<0.01;binge drinking χ2=9.693, p<0.05; combined measures χ2=10.520, p<0.05) were found. Therewas no significant association between institution type and alcohol consumption behaviors.
Although in our sample a slightly greater proportion of men (10.9%) completely abstainedfrom alcohol in the past year as compared to women (7.1%) (χ2=6.603, p=0.010), malesdrank more frequently (χ2=84.739, p<0.001) and in greater quantities, than females.Specifically, a greater percentage of men, when compared to women, exceeded the daily(33.8% vs 27.1%), weekly (13.3% vs. 7.5%), binge drinking (50.7% vs. 38.1%) andcombined measures (54.9% vs. 43.8%) (see Figure 4). A greater percentage of studentsbetween the ages of 19 and 24 years, when compared to those younger than 19 or older than24, exceeded th daily (30.8% vs 23.2% and 25.1%), weekly (10.0% vs. 6.0% and 7.1%),binge drinking (46.8% vs. 33.7% and 27.0%) and combined measures (50.7% vs. 38.1% and36.7%) (see Figure 5). A greater percentage of Caucasians, when compared to non-Caucasians, exceeded daily (30.1% vs. 21.6%), weekly (9.5% vs. 6.0%), binge drinking
p Exceeding LRADG was categorized as; Exceeding weekly or daily LRADG in the past 7 days or Binge drankat least once a month in the past 12 months
44,4%
46,6%
9,0%
Exceeding at least one of the LRADG - All Students(n=1,526)
Within the LRADG
Above the LRADG
Abstainers

16 ■ Canada’s low-risk alcohol drinking guidelines among post-secondary students
(43.0% vs. 32.1%) and combined measures (48.6% vs. 35.3%). A greater percentage ofstudents living in residence, when compared to those living off-campus with or withoutparent/s or guardian/s, exceeded the daily (33.9% vs. 21.2% and 31.2%), weekly (11.2% vs.6.2% and 9.8%), binge drinking (43.2% vs. 38.9% and 42.1%) and combined measures(48.1% vs. 42.7 and 48.4%) limits.
See Tables 2 – 9
Figure 4: Exceeding the LRADG by Sexq
Numbers do not exactly total 100% as they were rounded to the nearest unit.
q (X2=33.139, p<0.001)
0%10%20%30%40%50%60%70%80%90%
100%
Men Women
Exceeding the LRADG by Sex(n=1,526)
Non-Drinker
Within all limits
Over at least one limit

Canada’s low-risk alcohol drinking guidelines among post-secondary students ■ 17
Figure 5: Exceeding the LRADG by Age Categoryr
Numbers do not exactly total 100% as they were rounded to the nearest unit.
B. Knowledge and Awareness of the LRADG
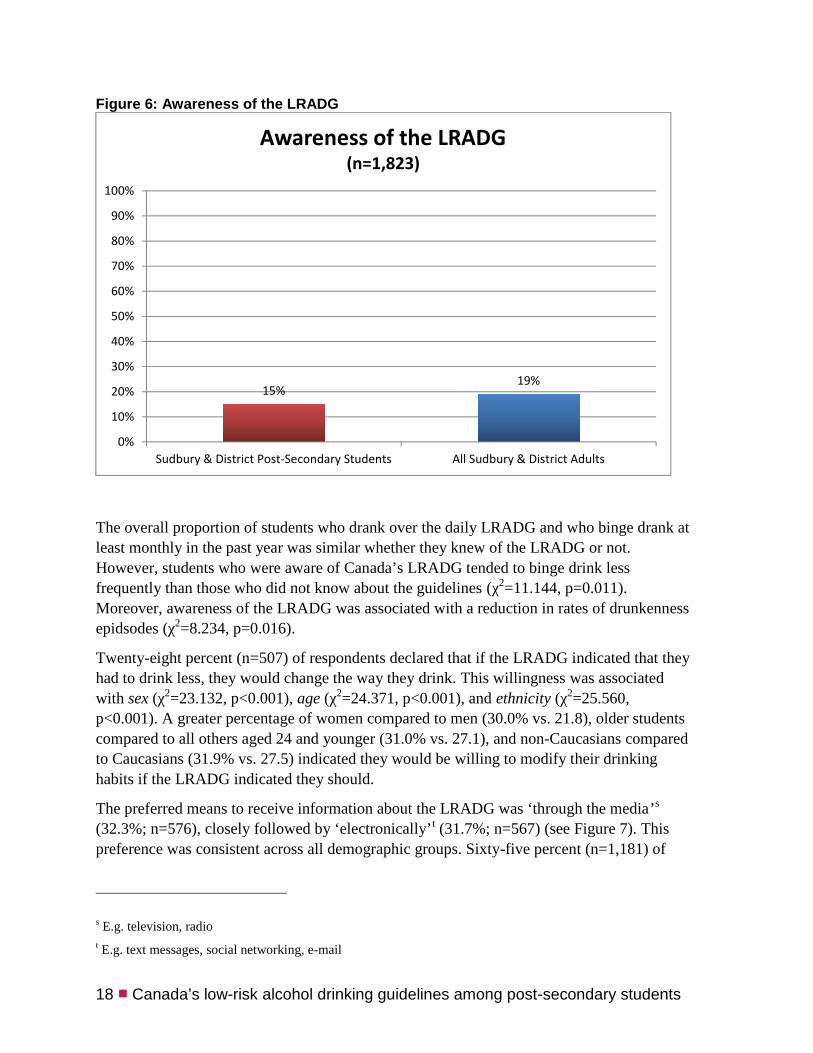
When asked if they had seen or heard of the LRADG, 15.2% (n=278) of students said ‘yes’.Associations between sex (χ2=4.893, p<0.05), age (χ2=9.909, p<0.01), academic discipline(χ2=9.863, p<0.05) and living arrangements (χ2=7.363, p<0.05) were found. In general,awareness of the LRADG was higher among women than men (16.3% vs. 12.0%), studentsolder than 24 years compared to those under 19 years or between 19 and 24 years (20.1% vs.16.6% and 13.5%), and students living in residence compared to those living off-campuswith their parent/s or guardian/s and those living off-campus without them (17.3% vs. 11.6%and 16.3%). There was no association between institution type and awareness of theLRADG.
r (X2=31.957; p<0.001)
0%10%20%30%40%50%60%70%80%90%
100%
<19 19-24 >24
Exceeding the LRADG by Age Category(n=1,519)
Non-Drinker
Within all limits
Over at least one limit
18 ■ Canada’s low-risk alcohol drinking guidelines among post-secondary students
Figure 6: Awareness of the LRADG
The overall proportion of students who drank over the daily LRADG and who binge drank atleast monthly in the past year was similar whether they knew of the LRADG or not.However, students who were aware of Canada’s LRADG tended to binge drink lessfrequently than those who did not know about the guidelines (χ2=11.144, p=0.011).Moreover, awareness of the LRADG was associated with a reduction in rates of drunkennessepidsodes (χ2=8.234, p=0.016).
Twenty-eight percent (n=507) of respondents declared that if the LRADG indicated that theyhad to drink less, they would change the way they drink. This willingness was associatedwith sex (χ2=23.132, p<0.001), age (χ2=24.371, p<0.001), and ethnicity (χ2=25.560,p<0.001). A greater percentage of women compared to men (30.0% vs. 21.8), older studentscompared to all others aged 24 and younger (31.0% vs. 27.1), and non-Caucasians comparedto Caucasians (31.9% vs. 27.5) indicated they would be willing to modify their drinkinghabits if the LRADG indicated they should.
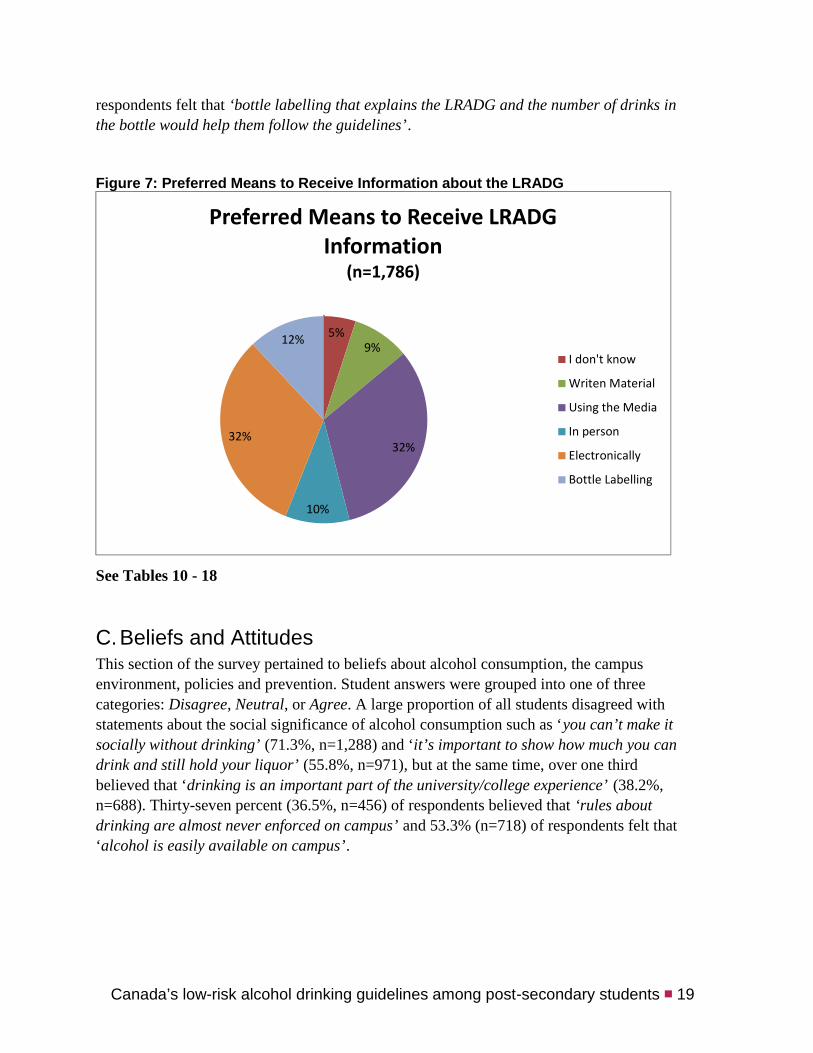
The preferred means to receive information about the LRADG was ‘through the media’s
(32.3%; n=576), closely followed by ‘electronically’t (31.7%; n=567) (see Figure 7). Thispreference was consistent across all demographic groups. Sixty-five percent (n=1,181) of
s E.g. television, radiot E.g. text messages, social networking, e-mail
15%19%
0%
10%
20%
30%
40%
50%
60%
70%
80%
90%
100%
Sudbury & District Post-Secondary Students All Sudbury & District Adults
Awareness of the LRADG(n=1,823)
Canada’s low-risk alcohol drinking guidelines among post-secondary students ■ 19
respondents felt that ‘bottle labelling that explains the LRADG and the number of drinks inthe bottle would help them follow the guidelines’.
Figure 7: Preferred Means to Receive Information about the LRADG
See Tables 10 - 18
C.Beliefs and AttitudesThis section of the survey pertained to beliefs about alcohol consumption, the campusenvironment, policies and prevention. Student answers were grouped into one of threecategories: Disagree, Neutral, or Agree. A large proportion of all students disagreed withstatements about the social significance of alcohol consumption such as ‘you can’t make itsocially without drinking’ (71.3%, n=1,288) and ‘it’s important to show how much you candrink and still hold your liquor’ (55.8%, n=971), but at the same time, over one thirdbelieved that ‘drinking is an important part of the university/college experience’ (38.2%,n=688). Thirty-seven percent (36.5%, n=456) of respondents believed that ‘rules aboutdrinking are almost never enforced on campus’ and 53.3% (n=718) of respondents felt that‘alcohol is easily available on campus’.
5%9%
32%
10%
32%
12%
Preferred Means to Receive LRADGInformation
(n=1,786)
I don't know
Writen Material
Using the Media
In person
Electronically
Bottle Labelling
20 ■ Canada’s low-risk alcohol drinking guidelines among post-secondary students
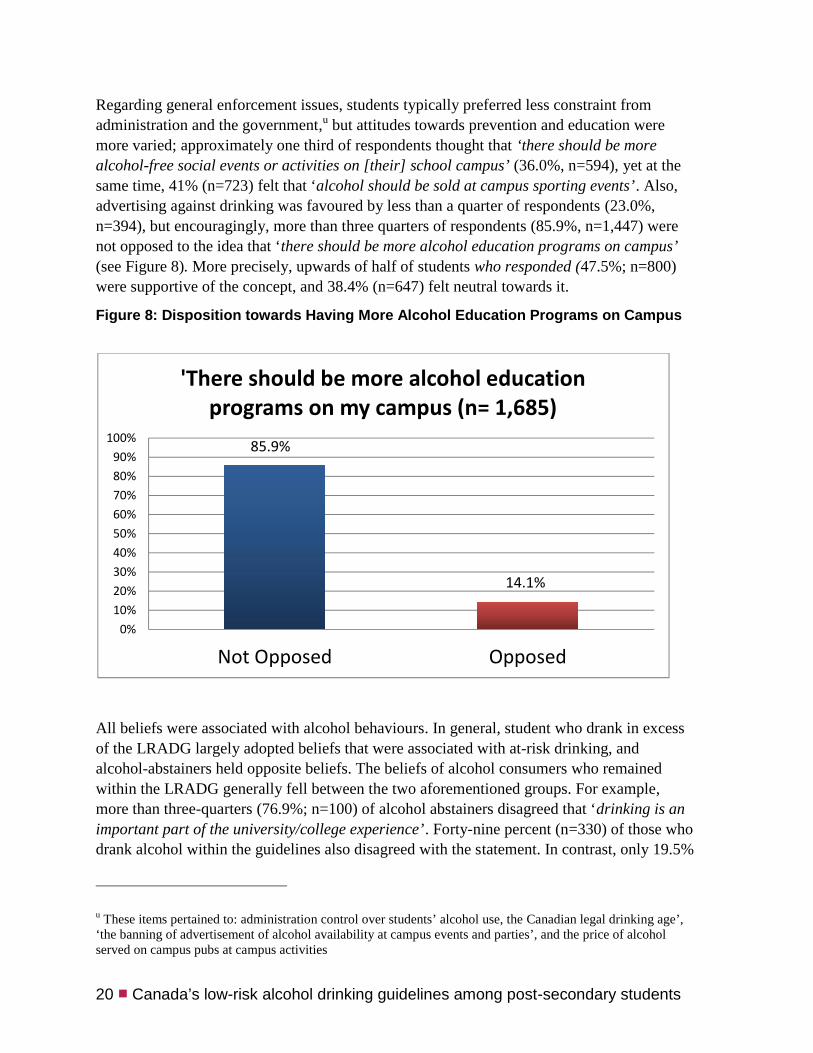
Regarding general enforcement issues, students typically preferred less constraint fromadministration and the government,u but attitudes towards prevention and education weremore varied; approximately one third of respondents thought that ‘there should be morealcohol-free social events or activities on [their] school campus’ (36.0%, n=594), yet at thesame time, 41% (n=723) felt that ‘alcohol should be sold at campus sporting events’. Also,advertising against drinking was favoured by less than a quarter of respondents (23.0%,n=394), but encouragingly, more than three quarters of respondents (85.9%, n=1,447) werenot opposed to the idea that ‘there should be more alcohol education programs on campus’(see Figure 8). More precisely, upwards of half of students who responded (47.5%; n=800)were supportive of the concept, and 38.4% (n=647) felt neutral towards it.
Figure 8: Disposition towards Having More Alcohol Education Programs on Campus
All beliefs were associated with alcohol behaviours. In general, student who drank in excessof the LRADG largely adopted beliefs that were associated with at-risk drinking, andalcohol-abstainers held opposite beliefs. The beliefs of alcohol consumers who remainedwithin the LRADG generally fell between the two aforementioned groups. For example,more than three-quarters (76.9%; n=100) of alcohol abstainers disagreed that ‘drinking is animportant part of the university/college experience’. Forty-nine percent (n=330) of those whodrank alcohol within the guidelines also disagreed with the statement. In contrast, only 19.5%
u These items pertained to: administration control over students’ alcohol use, the Canadian legal drinking age’,‘the banning of advertisement of alcohol availability at campus events and parties’, and the price of alcoholserved on campus pubs at campus activities
0%10%20%30%40%50%60%70%80%90%
100%
Not Opposed Opposed
'There should be more alcohol educationprograms on my campus (n= 1,685)
85.9%
14.1%

Canada’s low-risk alcohol drinking guidelines among post-secondary students ■ 21
(n=137) of those who drank in excess of the LRADG felt the same (χ2=254.502, p<0.001).This pattern is consistent throughout most of the attitudinal survey items.
Generally, women, students over the age of 24 years, and students who were not Caucasian,each endorsed beliefs that are associated with responsible alcohol use more frequently thantheir counterparts.
See Tables 19 - 27
D.General Health InformationThe majority of students (81.9%, n=1,469) were interested in receiving general health-relatedinformation or advice. Willingness to receive health information was associated with sex(χ2=28.367, p<0.001) and ethnicity (χ2=13.918, p=0.003). The percentage of students inclinedto receive this type of material was greater among women, as well as non-Caucasians. Therewas no association between willingness to receive health information and age. Many (59.8%,n=1,076) students reported looking for information for their own health at least once amonth, especially women (χ2=16.223, p=0.003), those who were older (χ2=23.162, p=0.003),attending university (χ2=28.404, p<0.001), and/or individuals studying in the field of healthsciences (χ2=42.995, p<0.001). The preferred means for all demographic groups to receivegeneral health information was electronically (35.0%, n=616) (see Figure 9).
See Tables 28 - 35
Figure 9: Preferred Means to Receive General Health Information
Numbers do not exactly total 100% as they were rounded to the nearest unit.
6%
14%
21%
17%
35%
8%
Preferred Means to Receive General HealthInformation
(n=1,758)
I don't know
Written Material
Using the Media
In person
Electronically
Bottle Labeling

22 ■ Canada’s low-risk alcohol drinking guidelines among post-secondary students
Comparison to Population Data
Our survey results concerning alcohol consumption behaviours were comparable to the2011/12 CCHS data for the Sudbury & District Health Unit service area and Ontariopopulations, pointing to a high level of reliability and validity.v Nevertheless, there appears tobe a somewhat higher prevalence of exceeding the LRADG among our post-secondarystudents, even when controlling for age. Rates for the general Sudbury population wereconsistently slightly lower, and provincial rates were invariably the lowest of all threesamples. This trend could be the result heavier drinking patterns among post-secondarystudents,10 and notably at post-secondary institutions in the City of Greater Sudbury.
Our results show that a greater percentage of students enrolled at a Sudbury college oruniversity (91.9%) had consumed at least one alcoholic beverage in the past year comparedto the national average reported in the CCS findings (85.7%).7 However, in their 2012 report,the Nova Scotia Department of Health and Wellness reported that over 90% of Canadianuniversity students used alcohol.11 Differences in alcohol-related behaviour by sex, age,ethnicity and living arrangements were all consistent with the current body of research.Interestingly, among the student population, we found that a slightly greater proportion ofmen completely abstained from alcohol compared to women in the past year. Yet, amongalcohol users, males drank more frequently than females, and also consumed alcohol ingreater quantities. The same phenomenon is reported with data from the CCS. Our surveyitems concerning beliefs and attitudes had previously been used in the CCS7 and our datawere, for the most part, reflective of the CCS results.
When asked if they had seen or heard of the LRADG, 15% of students indicated ‘yes’, ascompared to 19% of adults reported by the Sudbury & District Health Unit.w,77 In bothsamples, the level of awareness of the LRADG increased with age.
See Table 36
Further consideration should also be given to the fact that 75% of respondents were female inthis study. According to the literature, males usually exceed the LRDG at a higher rate thanfemales. Hence, the percentage of students exceeding the guidelines may actually be higherthan our current findings. We must also consider that the questionnaire was based on self-
v CCHS data presented in this document only involves individuals >18 years, however our sample includessome students aged 17 years (n=13).w 19+ years old

Canada’s low-risk alcohol drinking guidelines among post-secondary students ■ 23
reported data, and could be biased by social desirability of respondents. Additionally, we areunaware of the demographics and drinking patterns of non-respondents, as compared to therespondents of the questionnaire. Specifically, caution should be interpreted given thenumber of non-responses (i.e., approximately 300 missing or excluded responses) to thequestion from which the LRADG variables was derived. Hence, the number of students thatare exceeding the guidelines may be slightly higher, or lower, than what has been reported.
24 ■ Canada’s low-risk alcohol drinking guidelines among post-secondary students
Recommendations
According to our review of the literature and survey results, we have identified interventionsthat are tailored to the needs of post-secondary students within the City of Greater Sudbury.Overall, college and university students displayed similar alcohol consumption behaviourpatterns, and thus the following recommendations can be applied to both types of institutions.
Alcohol misuse is the product of multiple levels of influence, and any endeavour to addressthis issue needs to tackle as many dimensions as possible. A comprehensive approach aimedat reducing alcohol-related harms and the promotion of healthy and safe campus can begin bydeveloping and implementing as many of the recommendations noted below. These weredesigned and categorized for: students, administrators and decision-makers, and healthpromoters and educators.
StudentsStudents themselves can reduce the demand for alcohol by individuals. This can beaccomplished by ensuring that students have opportunities to clarify and evaluate theirpersonal beliefs and values, while emphasizing responsible decision-making about alcohol asit relates to their academic goals. Specifically, students need to be provided opportunities tolearn and share basic refusal skills and measures to deal with peer intoxication and alcoholpoisoning, respectively.
Students who are in a leadership position, such as residence supervisors, floor proctors, andmembers of student councils within their post-secondary community have a significant rolein shifting a student-body culture of alcohol misuse to one that fosters a healthy community,and that ensures moderate alcohol use. Student leaders can participate actively, andcollaborate with other students, as well as community partners specific to initiatives, policiesand innovative strategies to reduce the harms associated with alcohol misuse. These positiveinitiatives allow students to develop strengths, skills and knowledge with regards to theimplications of alcohol use, while providing them with a sense of empowerment.
Student leaders can:
increase awareness and education by developing a strategy to start a conversationamong students on the risks and harms associated with heavy and binge drinking.For example, we recommend providing information sessions on ‘mocktails’ thatdemonstrate the tastefulness and social aspect of enjoying a non-alcoholic beverage.
Canada’s low-risk alcohol drinking guidelines among post-secondary students ■ 25
influence actual and perceived norms by developing a social awareness campaign tode-normalize heavy and binge drinking: the effects of alcohol misuse can be addressedand promoted as “uncool” or “socially unacceptable”. Shift the focus away from heavydrinking to the true purpose of all events that may involve alcohol, while encouragingevents and spaces that are not centered on alcohol.
establish peer-led education and programs that allow students to engage in an open andtrusting discussion with fellow students, giving them an opportunity to share theirexperiences; students listen to their peers.
Since awareness of the LRADG seems to correlate with safer drinking, and many studentssaid they would drink less if the LRADG indicated they should, student leaders ought to haveknowledge of, and frame all of their messages around, the LRADG.
Administrators and Decision-MakersPost-secondary institutions need to recognize the importance of community collaboration toaddress alcohol misuse on-campus, and off-campus wherever possible. The followingrecommendations require administration and decision-maker buy-in and support in order tocreate healthy campuses for post-secondary students.
Administrators and decision-makers need to:
enforce all laws and regulations as outlined by the Liquor Licence Act (LLA) andAlcohol and Gaming Commission of Ontario (AGCO). In addition, consider reviewingcampus alcohol policies and ensuring adequate enforcement. Consider regulationsrestricting hours and locations that alcohol can be sold and consumed, as well as policiesthat discourage drinking games and objects that encourage rapid or high volumeconsumption.
implement prevention and harm-reduction measures specific to campus bars, such asoffering free non-alcoholic beverages and lower-priced ‘lite’ alcohol products, maintainingminimum pricing on regular alcoholic drinks, ban price discounts or promotions (e.g.: no‘happy hours) - and if there is no bar on campus, do not permit one to be instituted.
develop and enforce policies for institution-sanctioned and student-led events, such asimplementing a ticket system for alcohol service, prohibiting ‘bring your own booze’events, checking bags at the door for alcohol, ensuring Party Alcohol Liabilityx is in place,ensuring safe passage home (e.g. hire a taxi service, initiate a ‘Operation Red Nose’y-likeservice). These policies should cover both student and staff events.
x https://www.palcanada.com/en/party-alcohol-liabilityy http://operationnezrouge.com/en

26 ■ Canada’s low-risk alcohol drinking guidelines among post-secondary students
provide employee training which includes a requirement that event staff in post-secondary institutions become ‘Safer Bars’z ‘trained, in addition to the current requirementof ‘Smart Serve’aa trained.
create supportive environments where post-secondary students are safe andencouraged to live healthy lifestyles, especially to avoid alcohol or use it in moderation,through:
Residence restrictions: have alcohol-free floors. For floors where alcohol ispermitted, discourage activities and events where alcohol use is the focus, such asdrinking games. Consider banning alcohol use in public spaces. Ensure all campusalcohol policies are enforced by staff, volunteers and student leaders.
Staff training and emergency preparedness: All employees should be aware of theLRADG and of the impact of language around alcohol use (re-enforce a culture ofmoderation). Residence and Security staff should be trained in recognizing andintervening with students who are intoxicated and/or have alcohol poisoning. It ishighly recommended that they know the BACCUS maneuverbb and be CPR/First Aidcertified.
Policy development for alcohol advertising: limit sponsorship by the alcoholindustry and restrict advertising content. Administration ought to review alladvertising that pertains to alcohol and assess for content.
Educators and Health PromotersPersonal and collective initiatives are required for the uptake of health information andadoption of healthy values and behaviours by students. The following recommendationsprovide direction for health promoters and educators to encourage students in post-secondaryinstitutions to adhere to moderate alcohol consumption.
Health Promoters and Educators need to:
deliver LRADG and health promotion messaging to all students, as the heavy drinkingphenomenon affects a broad spectrum of individuals. We recommend utilizing humourwhen advertising these messages and counter-advertising against messaging that promotesthe misuse of alcohol. We suggest putting up materials that reinforce low-risk drinking inbathroom stalls. We also advise that information about safer drinking and campus policiesaround alcohol use be included in pre-admission packages. Furthermore, given the large
z http://www.camh.ca/en/education/about/camh_publications/Pages/safer_bars_program.aspxaa https://www.smartserve.ca/bb https://www.drinkwise.ca/english/education/the-bacchus-maneuver.html
Canada’s low-risk alcohol drinking guidelines among post-secondary students ■ 27
presence of female students in post-secondary institutions at a pre-conception age,messaging around alcohol consumption and pregnancy is of merit.
further target high-risk students, and high-risk alcohol use behaviours. Although anyhealth promotion initiatives should reach all students, those below the age of 24,cc who aremales or who live in residence should receive special attention from health promotioninitiatives. Health promoters can work closely with student leaders to reach these high-riskgroups and the rest of students.
disseminate health promotion messaging via the media and electronically (whereappropriate) as per students’ preference. Most students demonstrated more enthusiasmabout receiving information regarding general health than about the LRADG; accordingly,they might be more receptive to information on the latter if it is included under theumbrella of general-health education material. Furthermore, health educators should becareful not to disseminate overwhelming volumes of information.
offer Screening & Brief Intervention (SBI) tools: SBI have proved helpful to rectifybeliefs associated with alcohol misuse and are a best practice in the field. Electronicresources being preferred by post-secondary students, short computerized screenings withpertinent personalized normative feedback and referral could be explored as an optionsince research indicates that they are suitable alternatives to face-to-face SBI sessions. Wespecifically recommend the eCHECKUP TO GO.dd However, in-person counselling healthservices and SBI must first and foremost be made easily available to students by trainedprofessionals.
cc Although our results show that students 19-24 years displayed the most harmful alcohol behaviours, werecommend targeting younger students alike as a preventative measure.dd http://www.echeckuptogo.com/can/

28 ■ Canada’s low-risk alcohol drinking guidelines among post-secondary students
Conclusion
Our results support the need to encourage the responsible consumption of alcohol in post-secondary institutions in the City of Greater Sudbury. According to the literature and ourown study, daily excess of LRADG limits, particularly the practice of binge drinking,appears to be the most pressing challenge facing post-secondary institutions in Canada. It isimportant to address this issue in order to minimize the consequences for students as well asfor staff, faculty, and the functioning and reputation of our academic establishments. Bybetter understanding the attitudes, beliefs, and alcohol consumption behaviours of students,post-secondary institutions can better collaborate with community partners and public health,in order to implement a wide range of dynamic and complementary approaches to tacklealcohol misuse. The key to success is to create a campus where responsible alcohol use is thesocial norm, where policies are in place to reduce risks as well as support students inengaging in healthy behaviours, and where meaningful connections are made with peers,faculty, staff, administration and the local community. Only then will a culture of moderationbe embraced
Canada’s low-risk alcohol drinking guidelines among post-secondary students ■ 29
Endnotes
1. Hingson, R., Zha, W., & Weitzman, E. (2009)
2. Canadian Centre on Substance Abuse (2013)
3. Canadian Centre on Substance Abuse (2014)
4. Centre for Addiction and Mental Health (2011)
5. Thomas, G. (2012)
6. Sudbury & District Health Unit (2013)
7. Adlaf, E., Demers, A., & and Gliksman, L. (2005)
8. Wechsler, H., & Nelson, T. (2008)
9. Statistics Canada (2014)
10. Alberta Alcohol and Drug Abuse Commission (2005)
11. Nova Scotia Department of Health and Wellness (2012)
12. Ministry of Health Promotion (2010)
13. Centre for Addictions Research of BC (2008)
14. Public Health Agency of Canada (2011)
15. National Institute on Alcohol Abuse and Alcoholism (2003)
16. Oei, T., & Morawska, A. (2004)
17. Wechsler, H., & Austin, S. (1998)
18. Centre for Addiction and Mental Health (2008)
19. Statistics Canada (2010)
20. National Institute on Alcohol Abuse and Alcoholism (2014)
21. Babor, T., Caetano, R., Casswell, S., Edwards, G., Giesbrecht, N., Graham, K., . . . Rossow, I. (2010)
30 ■ Canada’s low-risk alcohol drinking guidelines among post-secondary students
22. Roerecke, R., Haydon, E., & Giesbrecht, N. (2007)
23. Cancer Care Ontario (2014)
24. World Health Organization (2014a)
25. National Advisory Council on Alcohol Abuse and Alcoholism (2002)
26. Rehm, J., Baliunas, D., Brochu, S., Fischer, B., Gnam, W., Patra, J., . . . Taylor, B. (2006)
27. Mothers Against Drunk Driving (MADD) (2014)
28. Butt, P. et al. (2011)
29. Hiller-Sturmhöfel, S., & Swartzwelder, H. (2004/2005)
30. National Institute on Alcohol Abuse and Alcoholism (2006)
31. Gutjahr, E., Gmel, G., & Rehm, J. (2001)
32. Wechsler, H., Lee, J., Nelson, T., & Lee, H. (2001)
33. Ham, L., & Hope, D. (2003)
34. Gliksman, L., Adlaf, E., Demers, A., & Newton-Taylor, B. (2003)
35. Berkowitz, A., & Perkins, W. (1986)
36. Nair, N., Newton, N., Teesson, M., Slade, T., Barrett, E., Champion, K., & Conrod, P. (2013)
37. Martin, C., & Hoffman, M. (1993)
38. Borsari, B., & Carey, K. (2001)
39. Erenberg, D., & Hacker, G. (1997)
40. Ontario Agency for Health Protection and Promotion (2013)
41. Seitz, H., Egerer, G., Simanowski, U., Waldher, R., Eckey, R., Agarwal, D., . . . von Wartburg, J.(1993)
42. National Institute of Health (2013)
44. Chaloupka, F., & Wechsler, H. (1996)
45. Stockwell, T., Gruenewald, P., Toumbourou, J., & Loxley, W. (2005)
46. Loxley, W., Toumbourou, J., Stockwell, T., Haines, B., Scott, K., Godfrey, C., . . . Williams, J. (2004)
47. Saha, A., Poddar, E., & Mankad, M. (2005)
Canada’s low-risk alcohol drinking guidelines among post-secondary students ■ 31
48. Sallis, J., & Owen, N. (2002)
49. Ontario Recreation Facilities Association (2007)
50. Martell Consulting Services Ltd (2014)
51. Mitic, W. (2003)
52. Nova Scotia Department of Health (2002)
53. Queen's University (2012)
54. Toomey, T., & Wagenaar, A. (2002)
55. Anderson, P., de Bruijn, A., Angus, K., Gordon, R., & Hastings, G. (2009)
56. Chen, M.-J., Grube, J., Bersamin, M., Watters, E., & Keefe, D. (2005)
57. Dimeff, L., Baer, J., Kivlahan, D., & Marlatt, G. (1999)
58. National Institute on Alcohol Abuse and Alcoholism (2005)
59. American Public Health Association and Education Development Center, Inc. (2008)
60. World Health Organization (2014b)
61. College of Family Physicians of Canada (2012)
62. White, A., Kavanagh, D., Stallman, H., Klein, B., Kay-Lambkin, F., Proudfoot, J., . . . Young, R.(2010)
63. Health Promotion, Chronic Disease & Injury Prevention Department (2013)
64. Elliott, J., Carey, K., & Bolles, J. (2008)
65. Ontario Ministry of Health and Long-Term Care (2011)
66. Saewyc, E., & Stewart, D. (2008)
67. Hammond, W. (2011)
68. Search Institute (2004)
69. Mellanby, A., Rees, J., & Tripp, J. (2000)
70. Black, D., Tobler, N., & Sciacca, J. (1998)
71. Perry, C., Grand, M., Ernberg, G., Florenzano, R., Langdon, M., Waahlberg, R., . . . Fisher, K. e.(1989)
32 ■ Canada’s low-risk alcohol drinking guidelines among post-secondary students
72. Larimer, M., Kilmer, J., & Lee, C. (2005)
73. Wood, M., Read, J., Mitchell, R., & Brand, N. (2004)
74. DeJong, W. (1997)
75. Gravic, Inc. (2013)
76. IBM Corporation (2012)
77. Sudbury & District Health Unit (2010)
Canada’s low-risk alcohol drinking guidelines among post-secondary students ■ 33
References
Adlaf, E., Demers, A., & Gliksman, L. (2005). Canadian Campus Survey 2004. Toronto (ON):Centre for Addiction and Mental Health.
Alberta Alcohol and Drug Abuse Commission. (2005). Preventing heavy episodic drinking amongyouth and young adults: A literature review. Edmonton: Alberta Health Services.
American Public Health Association and Education Development Center, Inc. (2008). AlcoholScreening and Brief Intervention: A guide for public health practitioners. National HighwayTraffic Safety Administration, U.S. Department of Transportation.
Anderson, P., de Bruijn, A., Angus, K., Gordon, R., & Hastings, G. (2009). Impact of alcoholadvertising and media exposure on adolescent alcohol use: A systematic review of longitudinalstudies. Alcohol and Alcoholism , 44 (3), pp. 229-243.
Babor, T., Caetano, R., Casswell, S., Edwards, G., Giesbrecht, N., Graham, K., et al. (2010).Alcohol: No Ordinary Commodity: Research and Public Policy (Second Edition ed.). Oxford, NewYork, United States: Oxford University Press.
Berkowitz, A., & Perkins, W. (1986). Problem drinking among college students: A review ofrecent research. Journal of American College Health , 35 (;21-28).
Black, D., Tobler, N., & Sciacca, J. (1998). Peer helping/involvement: an efficacious way to meetthe challenge of reducing alcohol, tobacco, and other drug use among youth? Journal of SchoolHealth , 68 (3), pp. 87-93.
Borsari, B., & Carey, K. (2001). Peer influences on college drinking: A review of the research.Journal of Substance Abuse , 13 (4; 391-424).
Butt, P., Beirness, D., Gliksman, L., Paradis, C., & Stockwell, T. (2011). Alcohol and health inCanada: A summary of evidence and guidelines for low-risk drinking. (C. C. Abuse, Ed.) Ottawa(ON), Canada: National Alcohol Strategy Advisory Committee (of Canada).
Canadian Centre on Substance Abuse. (2013). Canada's Low-Risk Alcohol Drinking Guidelines.Retrieved August 13, 2014, from http://www.ccsa.ca/Resource%20Library/2012-Canada-Low-Risk-Alcohol-Drinking-Guidelines-Brochure-en.pdf

34 ■ Canada’s low-risk alcohol drinking guidelines among post-secondary students
Canadian Centre on Substance Abuse. (2014). Drinking Guidelines. Retrieved August 19, 2014,from Canadian Centre on Substance Abuse: http://www.ccsa.ca/Eng/topics/alcohol/drinking-guidelines/Pages/default.aspx
Cancer Care Ontario. (2014). Cancer Risk Factors in Ontario. Toronto (ON): Queen's Printer forOntario. or Cancer Care Ontario. (2014, July 9). Ontario Cancer Facts. (Government of Ontario)Retrieved August 13, 2014, from Cancer Care Ontario:https://www.cancercare.on.ca/cms/one.aspx?pageId=8651
Centre for Addiction and Mental Health. (2011). Canada's Low-Risk Alcohol Drinking Guidelines.(Canadian Centre on Substance Abuse) Retrieved August 13, 2014, from Centre for Addictionand Mental Health:http://www.camh.ca/en/hospital/health_information/a_z_mental_health_and_addiction_information/alcohol/Pages/low_risk_drinking_guidelines.aspx
Centre for Addiction and Mental Health. (2008). Partying and getting drunk. Retrieved August13, 2014, from Centre for Addiction and Mental Health:http://www.camh.ca/en/hospital/health_information/a_z_mental_health_and_addiction_information/alcohol/Pages/binge_drinking.aspx
Centre for Addictions Research of BC. (2008). Alcohol on Campus: Programs and Policies.Retrieved August 13, 2014, from University of Victoria Centre for Addictions Research of BC:http://www.carbc.ca/Portals/0/propertyagent/558/files/24/alcoholoncampus.pdf
Chaloupka, F., & Wechsler, H. (1996). Binge drinking in college: The impact of price, availability,and alcohol control policies. Comtemporary Economic Policy , 14, pp. 112-124.
Chen, M.-J., Grube, J., Bersamin, M., Watters, E., & Keefe, D. (2005). Alcohol advertising: Whatmakes it attractive to youth? Journal of Health Communications , 10, pp. 553-565.
College of Family Physicians of Canada. (2012). Alcohol Screening, Brief Intervention & Referral.Retrieved August 8, 2014, from http://www.sbir-diba.ca/
DeJong, W. (1997). Setting and Improving Policies for Reducing Alcohol and Other Drug Problmeson Campus: A guide for administrators. Newton, MA: The Higher Education Centre for Alcoholand Other Drug Use Prevention Education Development Centre, Inc.
Dimeff, L., Baer, J., Kivlahan, D., & Marlatt, G. (1999). Brief Alcohol Screening and Interventionfor College Students (BASICS): A Harm Reduction Approach. New York: Guilford Press.
Elliott, J., Carey, K., & Bolles, J. (2008). Computer-based interventions for college drinking: Aqualitative review. Addictive Behaviors , 33 (8), pp. 994-1005.
Erenberg, D., & Hacker, G. (1997). High-risk bar promotions that target college students: Acommunity action guide. Center for Science in the Public Interest.
Canada’s low-risk alcohol drinking guidelines among post-secondary students ■ 35
Gliksman, L., Adlaf, E., Demers, A., & Newton-Taylor, B. (2003). Heavy drinking on Canadiancampuses. Canadian Journal of Public Health , 94 (1), pp. 17-21.
Gravic, I. (2013).
Gutjahr, E., Gmel, G., & Rehm, J. (2001). Relation between average alcohol consumption anddisease: An overview. European addiction research , 7 (3), pp. 117-127.
Ham, L., & Hope, D. (2003). College students and problematic drinking: a review of theliterature. Clinical psychology review , 23 (5), pp. 719-759.
Hammond, W. (2011, October 28). Resiliency - A Paradigm Shift From 'At Risk' to 'At Potential'.Resiliency Initiatives .
Health Promotion, Chronic Disease & Injury Prevention Department. (2013). Effectiveness ofapproaches to communicate alcohol-related health messaging: Review and implications forOntario's public health practitioners. Public Health Ontario.
Hiller-Sturmhöfel, S., & Swartzwelder, H. (2004/2005). Alcohol’s effects on the adolescent brain:What can be learned from animal models. 28 (4), pp. 213–221.
Hingson, R., Zha, W., & Weitzman, E. (2009). Magnitude of and trends in alcohol-relatedmortality and morbidity among U.S. college students ages 18-24. Journal of Studies on Alcoholand Drugs , 16, pp. 12-20.
IBM Corporation. (2012). SPSS Statistics 21. United Sates.
Larimer, M., Kilmer, J., & Lee, C. (2005). College student drug prevention: A review ofindividually oriented prevention. Journal of Drug Issues , 5 (2), pp. 431-456.
Loxley, W., Toumbourou, J., Stockwell, T., Haines, B., Scott, K., Godfrey, C., et al. (2004). ThePrevention of Substance Use, Risk and Harm in Australia: A Review of the Evidence. Cranberra(Australia): The National Drug Research Centre and the Centre for Adolescent Health.
Martell Consulting Services Ltd. (2014). Student Safety in Nova Scotia. Students Nova Scotia,Halifax, Nova Scotia.
Martin, C., & Hoffman, M. (1993). Alcohol expectancies, living environment, peer influence, andgender: A model of college-student drinking. Journal of College Student Development , pp. 206-211.
Mellanby, A., Rees, J., & Tripp, J. (2000). Peer-led and adult-led health education: A criticalreview of available comparative research. Health Education Research , 15 (2), pp. 533-545.
Ministry of Health Promotion. (2010). Prevention of Substance Misuse: Guidance Document.Retrieved August 13, 2014, from Ontario Ministry of Health and Long-Term Care:

36 ■ Canada’s low-risk alcohol drinking guidelines among post-secondary students
http://www.mhp.gov.on.ca/en/healthy-communities/public-health/guidance-docs/PreventionOfSubstanceMisuse.PDF
Mitic, W. (2003). Alcohol and university student drinking - Not a class act. Canadian Journal ofPublic Health , 94 (1), pp. 13-14.
Mothers Against Drunk Driving (MADD). (2014). Youth Services - Statistics & Links. (MADDCanada) Retrieved August 13, 2014, from madd:http://www.madd.ca/madd2/en/services/youth_services_statistics.html
Nair, N., Newton, N., Teesson, M., Slade, T., Barrett, E., Champion, K., & Conrod, P. (2013,October 11). Associations between personality traits and alcohol misuse: A longitudinal study onan Australian adolescent population. Australian National Health and Medical Research Council.
National Advisory Council on Alcohol Abuse and Alcoholism. (2002). A Call to Action: Changingthe Culture of Drinking at U.S. Colleges. Retrieved August 13, 2014, from National Institute ofHealth: http://www.collegedrinkingprevention.gov/media/taskforcereport.pdf
National Institute of Health. (2013). Women and Alcohol. Retrieved August 13, 2014, fromNational Institute on Alcohol Abuse and Alcoholism:http://pubs.niaaa.nih.gov/publications/womensfact/womensfact.htm
National Institute on Alcohol Abuse and Alcoholism. (2003). Alcohol Use Among Adolescents andYoung Adults. (National Institute for Health) Retrieved November 29, 2013, from NationalInstitute on Alcohol Abuse and Alcoholism: http://pubs.niaaa.nih.gov/publications/arh27-1/79-86.htm
National Institute on Alcohol Abuse and Alcoholism. (2005). Brief Interventions. (NationalInstitute of Health) Retrieved August 13, 2014, from National Institute on Alcohol Abuse andAlcoholism: http://pubs.niaaa.nih.gov/publications/AA66/AA66.htm
National Institute on Alcohol Abuse and Alcoholism. (2014.). What is 'at-risk' or 'heavy' drinking?Retrieved August 2014, from Rethinking Drinking: Alcohol and your health:http://rethinkingdrinking.niaaa.nih.gov/isyourdrinkingpatternrisky/whatsatriskorheavydrinking.asp
National Institute on Alcohol Abuse and Alcoholism. (2006). Young Adult Drinking. (U.S.Department of Health & Human Services) Retrieved August 13, 2014, from National Institute onAlcohol Abuse and Alcoholism: http://pubs.niaaa.nih.gov/publications/aa68/aa68.htm
Nova Scotia Department of Health and Wellness. (2012). Reducing alcohol harms amonguniversity students: A summary of best practices. Halifax (NS): Province of Nova Scotia.
Canada’s low-risk alcohol drinking guidelines among post-secondary students ■ 37
Nova Scotia Department of Health. (2002). When Drugs Come to School : A Resource Manual forStudent Substance Use and School-Based Policy Development. Nova Scotia Department ofHealth.
Oei, T., & Morawska, A. (2004). A cognitive model of binge drinking: The influence of alcoholexpectancies and drinking refusal self-efficacy. Addictive Behaviours , 29 (1), pp. 159-179.
Ontario Agency for Health Protection and Promotion. (2013). Knowledge to Action: Best Adviceon Women and Alcohol. Toronto (ON): Queen's Printer for Ontario.
Ontario Ministry of Health and Long-Term Care. (2011). Open Minds, Healthy Minds: Ontario'sComprehensive Mental Health and Addictions Strategy. Queen's Printer for Ontario 2011.Retrieved fromhttp://www.health.gov.on.ca/en/common/ministry/publications/reports/mental_health2011/mentalhealth_rep2011.pdf
Ontario Recreation Facilities Association. (2007). Municipal alcohol policy guide. Ottawa (ON):Recreation Facilities Association.
Perry, C., Grand, M., Ernberg, G., Florenzano, R., Langdon, M., Waahlberg, R., et al. (1989). WHOcollaborative study on alcohol education and young people:Outcomes of a four country pilotstudy. Substance Use and Misuse , 24 (2), pp. 1145-1171.
Public Health Agency of Canada. (2011). The Chief Public Health Officer's Report on the State ofPublic Health in Canada, 2011. (Government of Canada) Retrieved August 13, 2014, from PublicHealth Agency of Canada: http://www.phac-aspc.gc.ca/cphorsphc-respcacsp/2011/cphorsphc-respcacsp-06-eng.php
Queen's University. (2012). Queen's University Alcohol Policy.
Rehm, J., Baliunas, D., Brochu, S., Fischer, B., Gnam, W., Patra, J., et al. (2006). The Costs ofSubstance Abuse in Canada 2002. Canadian Centre on Substance Abuse.
Roerecke, R., Haydon, E., & Giesbrecht, N. (2007). Alcohol and chronic disease: An Ontarioperspective. (A. P. Network, Ed.) Toronto (ON): Ontario Public Health Association.
Saewyc, E., & Stewart, D. (2008). Evidence for Healthy Child and Youth DevelopmentInterventions for Core Public Health Functions. Vancouver, BC: McCreary Centre Society.
Saha, A., Poddar, E., & Mankad, M. (2005). Effectiveness of different methods of healtheducation: A comparative assessment in a scientific conference. BMC Public Health , 5 (88), pp.1-7.
Sallis, J., & Owen, N. (2002). Ecological Models of Health Behavior. In K. Glanz, B. K. Rimer, & F.M. Lewis, Health Behavior and Health Education: Theory, Research and Practice. (3rd Ed.) (pp.pp.462-484). San Francisco, CA: John-Willies & Sons.
38 ■ Canada’s low-risk alcohol drinking guidelines among post-secondary students
Search Institute. (2004). Tapping the Power of Community - Building Assets to StrengthenSubstance Abuse Prevention. Insights & Evidence: Promoting Healthy Children, Youth andCommunities , 2 (1), pp. 1-14.
Seitz, H., Egerer, G., Simanowski, U., Waldherr, R., Eckey, R., Agarwal, D., et al. (1993). Humangastric alcohol dehydrogenase activity: effect of age, sex, and alcoholism. International Journalof Gastroenterology and Hepatology , 34 (10), pp. 1433-1437.
Statistics Canada. (2010). Heavy Drinking. Retrieved August 13, 2014, from Statistics Canada:http://www.statcan.gc.ca/pub/82-229-x/2009001/deter/hdx-eng.htm
Statistics Canada. (2014). Canadian Community Health Survey 2011/12. Internal Data, Ministryof Health and Long-Term Care Share File, Sudbury & District Health Unit.
Statistics Canada. (2014). Heavy drinking, 2013. (Government of Canada) Retrieved August 13,2014, from Statistics Canada: http://www.statcan.gc.ca/pub/82-625-x/2014001/article/14019-eng.htm
Stockwell, T., Gruenewald, P., Toumbourou, J., & Loxley, W. (2005). Preventing HarmfulSubstance Use: The Evidence Base for Policy and Practice. Hoboken (NJ): John Wiley & Sons, Ltd.
Sudbury & District Health Unit. (2010). Awareness of the Low-Risk Alcohol Drinking Guidelines.Surveillance Report - For Internal Use Only, Sudbury (ON).
Sudbury & District Health Unit. (2013). Combined data from the Canadian Community HealthSurvey (CCHS) 2007/08 & 2009/10. (S. Canada, Ed.) Ministry of Health and Long-Term Care.
Thomas, G. (2012). Levels and Patterns of Alcohol Use in Canada. Ottawa (ON): Canadian Centreon Substance Abuse.
Toomey, T., & Wagenaar, A. (2002). Environmental policies to reduce college drinking: Otionsand research findings. Journal of Studies on Alcohol. Supplement. , 14, pp. 193-205.
Wechsler, H., & Nelson, T. (2008). What we have learned from the Harvard School of PublicHealth College Alcohol Study: focusing attention on college student alcohol consumption andthe environmental conditions that promote it. Journal of Studies on Alcohol and Drugs , 69 (4),pp. 481-490.
Wechsler, H., Lee, J., Nelson, T., & Lee, H. (2001). Drinking levels, alcohol problems andsecondhand effects in substance-free college residences: results of a national study. Journal ofStudies on Alcohol and Drugs , 62 (1), pp. 23-31.
Wechsler, H., & Austin, S. (1998). Binge drinking: The five/four measure. Journal of Studies onAlcohol , 59 (1), pp. 122-124.
Canada’s low-risk alcohol drinking guidelines among post-secondary students ■ 39
White, A., Kavanagh, D., Stallman, H., Klein, B., Kay-Lambkin, F., Proudfoot, J., et al. (2010).Online alcohol interventions: A systematic review. Journal of Medical Internet Research , 12 (5).
Wood, M., Read, J., Mitchell, R., & Brand, N. (2004). Do parents still matter? Parent and peerinfluences on alcohol involvement among recent high school graduates. Psychology of AddictiveBehaviors , 18 (1), pp. 19-30.
World Health Organization. (2014a). Alcohol. Retrieved August 13, 2014, from World HealthOrganization: http://www.who.int/mediacentre/factsheets/fs349/en/.
World Health Organization (2014b). Screening and brief intervention for alcohol problems inprimary health care. World Health Organization. [Online] [Cited: August 13, 2014.]http://www.who.int/substance_abuse/activities/sbi/en/.
40 ■ Canada’s low-risk alcohol drinking guidelines among post-secondary students
Appendix
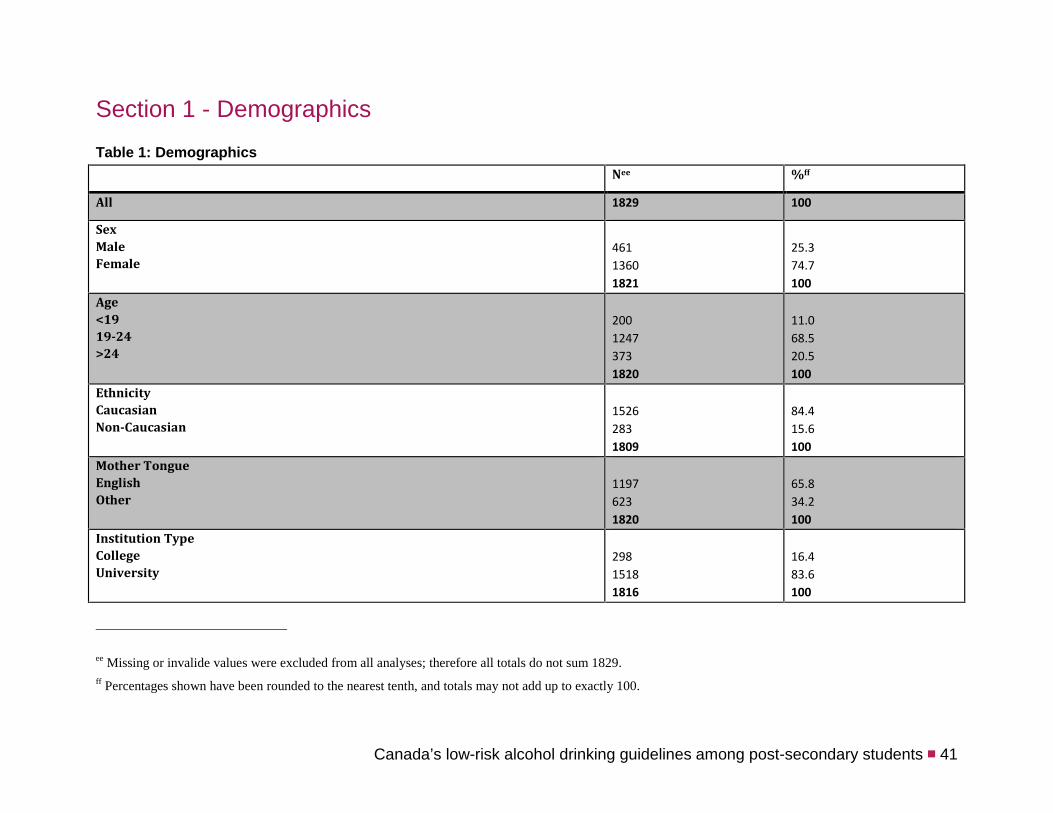
Canada’s low-risk alcohol drinking guidelines among post-secondary students ■ 41
Section 1 - DemographicsTable 1: Demographics
Nee %ff
All 1829 100
SexMaleFemale
46113601821
25.374.7100
Age<1919-24>24
20012473731820
11.068.520.5100
EthnicityCaucasianNon-Caucasian
15262831809
84.415.6100
Mother TongueEnglishOther
11976231820
65.834.2100
Institution TypeCollegeUniversity
29815181816
16.483.6100
ee Missing or invalide values were excluded from all analyses; therefore all totals do not sum 1829.ff Percentages shown have been rounded to the nearest tenth, and totals may not add up to exactly 100.
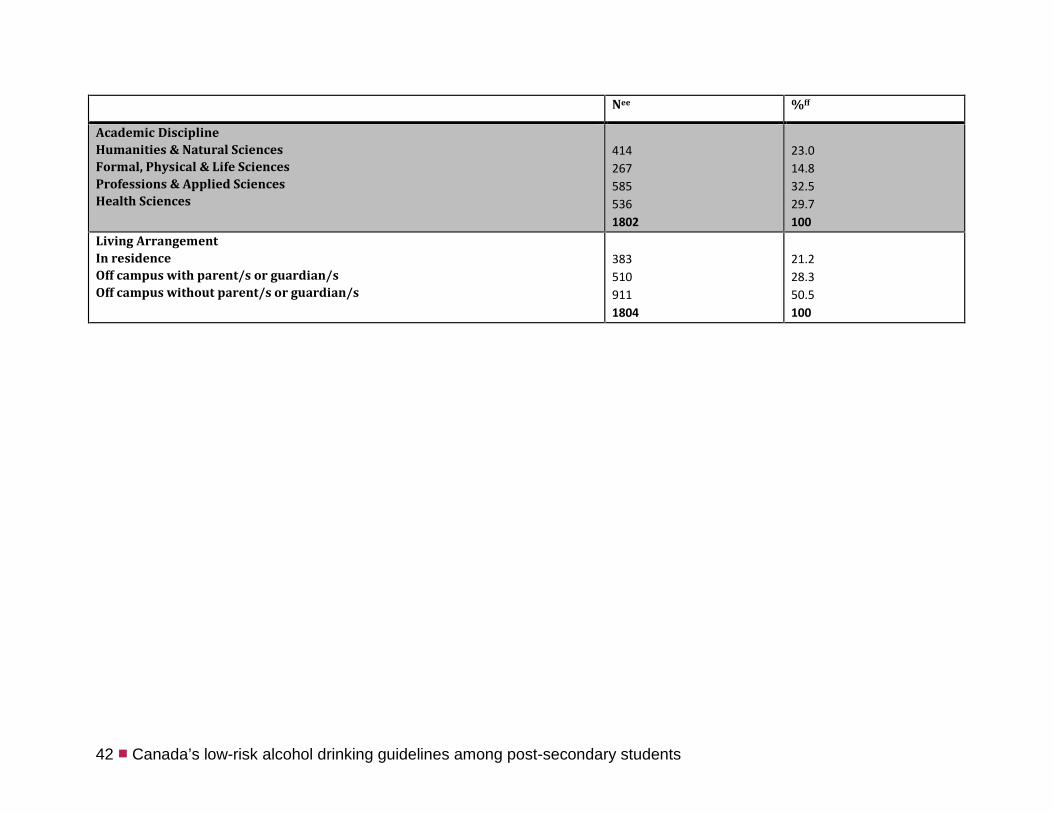
42 ■ Canada’s low-risk alcohol drinking guidelines among post-secondary students
Nee %ff
Academic DisciplineHumanities & Natural SciencesFormal, Physical & Life SciencesProfessions & Applied SciencesHealth Sciences
4142675855361802
23.014.832.529.7100
Living ArrangementIn residenceOff campus with parent/s or guardian/sOff campus without parent/s or guardian/s
3835109111804
21.228.350.5100
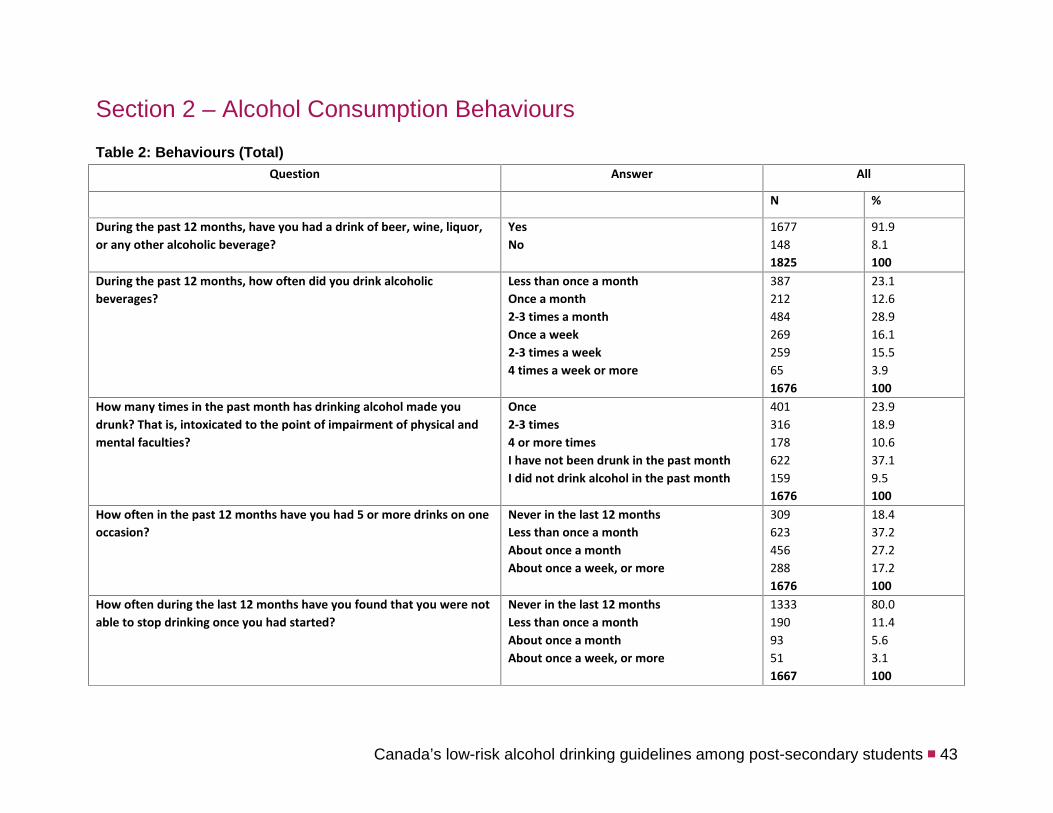
Canada’s low-risk alcohol drinking guidelines among post-secondary students ■ 43
Section 2 – Alcohol Consumption BehavioursTable 2: Behaviours (Total)
Question Answer All
N %
During the past 12 months, have you had a drink of beer, wine, liquor,or any other alcoholic beverage?
YesNo
16771481825
91.98.1100
During the past 12 months, how often did you drink alcoholicbeverages?
Less than once a monthOnce a month2-3 times a monthOnce a week2-3 times a week4 times a week or more
387212484269259651676
23.112.628.916.115.53.9100
How many times in the past month has drinking alcohol made youdrunk? That is, intoxicated to the point of impairment of physical andmental faculties?
Once2-3 times4 or more timesI have not been drunk in the past monthI did not drink alcohol in the past month
4013161786221591676
23.918.910.637.19.5100
How often in the past 12 months have you had 5 or more drinks on oneoccasion?
Never in the last 12 monthsLess than once a monthAbout once a monthAbout once a week, or more
3096234562881676
18.437.227.217.2100
How often during the last 12 months have you found that you were notable to stop drinking once you had started?
Never in the last 12 monthsLess than once a monthAbout once a monthAbout once a week, or more
133319093511667
80.011.45.63.1100

44 ■ Canada’s low-risk alcohol drinking guidelines among post-secondary students
Question Answer All
N %
How often during the last 12 months have you not done things youwere supposed to because of drinking (e.g.: you missed a class)?
Never in the last 12 monthsLess than once a monthAbout once a monthAbout once a week, or more
120634287381673
72.120.45.22.3100
How often during the last 12 months have you had a feeling of guilt orremorse after drinking?
Never in the last 12 monthsLess than once a monthAbout once a monthAbout once a week, or more
106347298411674
63.528.25.92.4100
How often in the last 12 months have you been unable to rememberwhat happened the night before because you had been drinking?
Never in the last 12 monthsLess than once a monthAbout once a monthAbout once a week, or more
1080447115321674
64.526.76.91.9100
Have you or someone else been injured as a result of your drinking? Yes, in the last 12 monthsYes, but not in the last 12 monthsNo
18217712751634
11.178.010.8100
Has a relative, friend, doctor or other health care worker beenconcerned about your drinking or suggested you cut down?
Yes, in the last 12 monthsYes, but not in the last 12 monthsNo
837315181674
5.090.74.4100
99.2% of respondents have never been in a treatment program during the last year because of their alcohol use. 0.6% of respondents reported being in atreatment program during the last 12 months because of their alcohol use, and 0.2% prior to the last year.
On average during the past 12 months, how many hours of sleep do youget per night?
Less than 6 hoursBetween 6 and 8 hours
2291203
12.666.3

Canada’s low-risk alcohol drinking guidelines among post-secondary students ■ 45
Question Answer All
N %
More than 8 hours 3821814
21.1100
Behaviours as per the LRADGgg
LRADG weekly limitsAmong drinkers
Among all
Within the LRADG weekly limitsOver the LRADG weekly limits
12511371388
90.19.9100
Alcohol abstainerWithin the LRADG weekly limitsOver the LRADG weekly limits
13812511371526
9.082.09.0100
LRADG daily limits (3/2) hh
Among drinkers
Among all
Within the LRADG daily limitsOver the LRADG limits
9484401388
68.331.7100
Alcohol abstainerWithin the LRADG daily limitsOver the LRADG limits
1389484401526
9.062.128.8100
Binge drinkingAmong drinkers
All students
Binged less than 1x/month in the past yearBinged 1x/month or more in the past year
9117381649
55.244.6100
Alcohol abstainerBinged less than 1x/month in the past year
139911
7.851.0
gg Based on valid cases for analyses and excludes women who reported being pregnant or breastfeed in the last 12 months. Individuals who did not indicate being male or femalewere excluded from LRADG Derived Variables.
hh From late teens to age 24, youth should never have more than 2 drinks a day (for girls) or 3 drinks a day (for boys). From: http://www.ccsa.ca/Resource%20Library/2012-Canada-Low-Risk-Alcohol-Drinking-Guidelines-Brochure-en.pdf
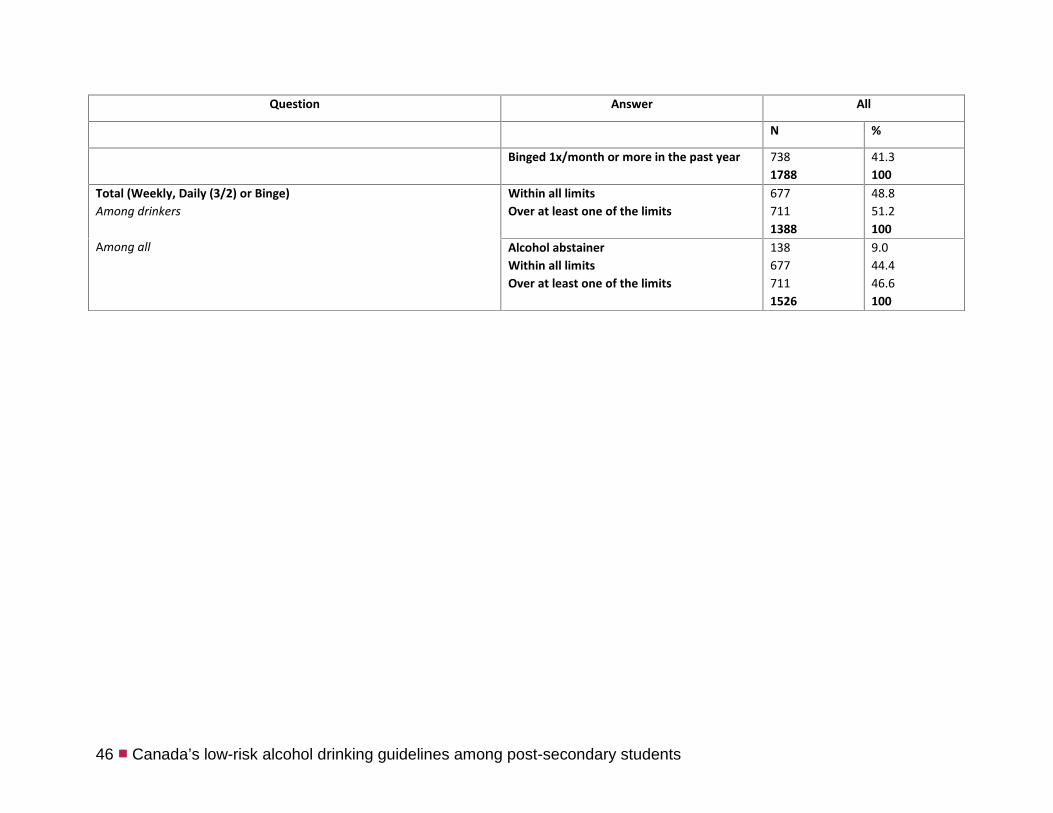
46 ■ Canada’s low-risk alcohol drinking guidelines among post-secondary students
Question Answer All
N %
Binged 1x/month or more in the past year 7381788
41.3100
Total (Weekly, Daily (3/2) or Binge)Among drinkers
Among all
Within all limitsOver at least one of the limits
6777111388
48.851.2100
Alcohol abstainerWithin all limitsOver at least one of the limits
1386777111526
9.044.446.6100
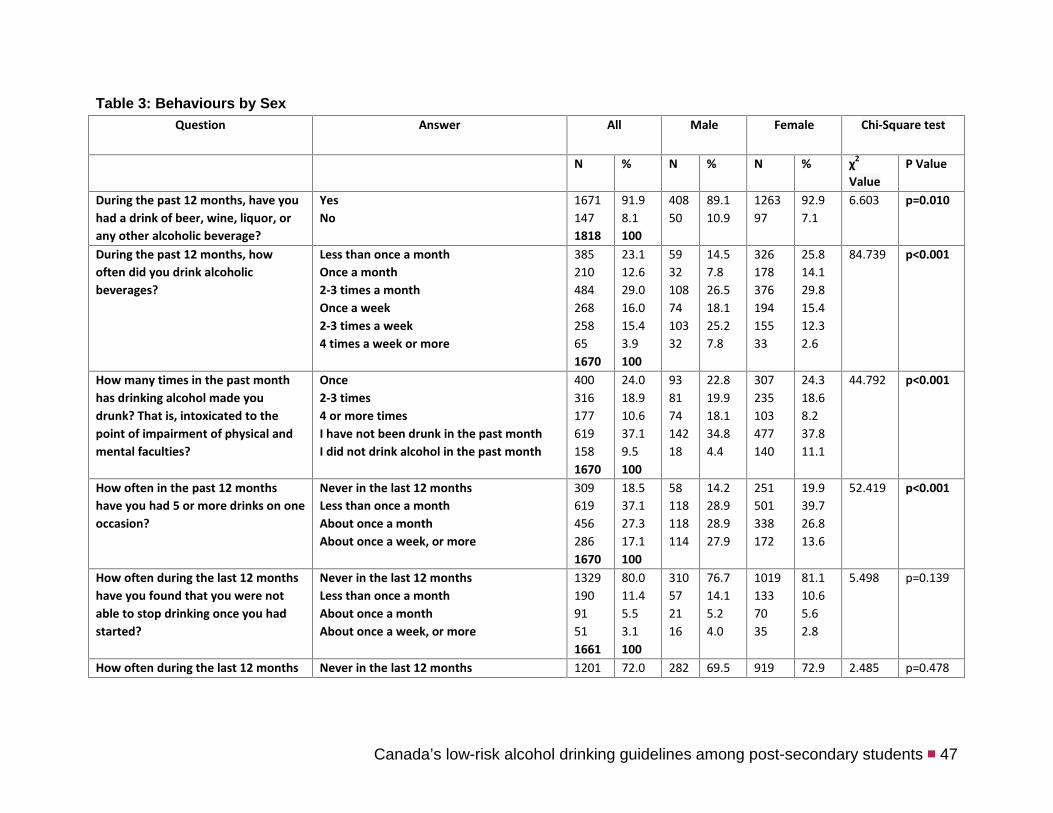
Canada’s low-risk alcohol drinking guidelines among post-secondary students ■ 47
Table 3: Behaviours by SexQuestion Answer All Male Female Chi-Square test
N % N % N % χ2
ValueP Value
During the past 12 months, have youhad a drink of beer, wine, liquor, orany other alcoholic beverage?
YesNo
16711471818
91.98.1100
40850
89.110.9
126397
92.97.1
6.603 p=0.010
During the past 12 months, howoften did you drink alcoholicbeverages?
Less than once a monthOnce a month2-3 times a monthOnce a week2-3 times a week4 times a week or more
385210484268258651670
23.112.629.016.015.43.9100
59321087410332
14.57.826.518.125.27.8
32617837619415533
25.814.129.815.412.32.6
84.739 p<0.001
How many times in the past monthhas drinking alcohol made youdrunk? That is, intoxicated to thepoint of impairment of physical andmental faculties?
Once2-3 times4 or more timesI have not been drunk in the past monthI did not drink alcohol in the past month
4003161776191581670
24.018.910.637.19.5100
93817414218
22.819.918.134.84.4
307235103477140
24.318.68.237.811.1
44.792 p<0.001
How often in the past 12 monthshave you had 5 or more drinks on oneoccasion?
Never in the last 12 monthsLess than once a monthAbout once a monthAbout once a week, or more
3096194562861670
18.537.127.317.1100
58118118114
14.228.928.927.9
251501338172
19.939.726.813.6
52.419 p<0.001
How often during the last 12 monthshave you found that you were notable to stop drinking once you hadstarted?
Never in the last 12 monthsLess than once a monthAbout once a monthAbout once a week, or more
132919091511661
80.011.45.53.1100
310572116
76.714.15.24.0
10191337035
81.110.65.62.8
5.498 p=0.139
How often during the last 12 months Never in the last 12 months 1201 72.0 282 69.5 919 72.9 2.485 p=0.478

48 ■ Canada’s low-risk alcohol drinking guidelines among post-secondary students
Question Answer All Male Female Chi-Square test
N % N % N % χ2
ValueP Value
have you not done things you weresupposed to because of drinking (e.g.:you missed a class)?
Less than once a monthAbout once a monthAbout once a week, or more
34286381667
20.55.22.3100
93238
22.95.72.0
2496330
19.75.02.4
How often during the last 12 monthshave you had a feeling of guilt orremorse after drinking?
Never in the last 12 monthsLess than once a monthAbout once a monthAbout once a week, or more
105947197411668
63.528.25.82.5100
2531152513
62.328.36.23.2
8063567228
63.928.25.72.2
1.434 p=0.698
How often in the last 12 months haveyou been unable to remember whathappened the night before becauseyou had been drinking?
Never in the last 12 monthsLess than once a monthAbout once a monthAbout once a week, or more
1076446115311668
64.526.76.91.9100
2431153712
59.728.39.12.9
8333317819
66.126.26.21.5
9.597 p=0.022
Have you or someone else beeninjured as a result of your drinking?
Yes, in the last 12 monthsNoYes, but not in the last 12 months
18112701771628
11.178.010.9100
4630742
11.677.710.6
135963135
10.978.110.9
0.164 p=0.921
Has a relative, friend, doctor or otherhealth care worker been concernedabout your drinking or suggested youcut down?
Yes, in the last 12 monthsYes, but not in the last 12 monthsNo
817315141668
4.94.490.8100
3515358
8.63.787.7
46581156
3.74.691.7
16.559 p<0.001
On average during the past 12months, how many hours of sleep doyou get per night?
Less than 6 hoursBetween 6 and 8 hoursMore than 8 hours
22711993811807
12.666.421.1100
6829393
15.064.520.5
159906288
11.867.021.3
3.221 p=0.200

Canada’s low-risk alcohol drinking guidelines among post-secondary students ■ 49
Question Answer All Male Female Chi-Square test
N % N % N % χ2
ValueP Value
Behaviours as per the LRADGLRADG weekly limits:Among drinkers
Among all
Within the LRADG weekly limitsOver the LRADG weekly limits
12511371388
90.19.9100
28852
84.715.3
96385
91.98.1
14.891 p<0.001
Alcohol abstainerWithin the LRADG weekly limitsOver the LRADG weekly limits
13812511371526
9.082.09.0100
5028852
12.873.813.3
8896385
7.784.87.5
23.563 p<0.001
LRADG daily limits (3/2)Among drinkers
Among all
Within the LRADG daily limitsOver the LRADG daily limits
9484401388
68.331.7100
208132
61.238.8
740308
70.629.4
10.553 p=0.001
Alcohol abstainerWithin the LRADG daily limitsOver the LRADG daily limits
1389484401526
9.062.128.8100
50208132
12.853.333.8
88740308
7.765.127.1
19.346 p<0.001
Binge drinkingAmong drinkers
Among all
Binged less than 1x/month in the past yearBinged 1x/month or more in the past year
9077361643
55.244.8100
176232
43.156.9
731504
59.240.8
31.959 p<0.001
Alcohol abstainerBinged less than 1x/month in the past yearBinged 1x/month or more in the past year
1389077361781
7.750.941.3100
50176232
10.938.450.7
88731504
6.755.338.1
39.888 p<0.001
Total (Weekly, Daily (3/2) or Binge)Among drinkers
Among all
Within all limitsOver at least one of the limits
6777111388
48.851.2100
126214
37.162.9
551497
52.647.4
24.741 p<0.001
Alcohol abstainerWithin all limitsOver at least one of the limits
138677711
9.044.446.6
50126214
12.832.354.9
88551497
7.748.543.8
33.139 p<0.001
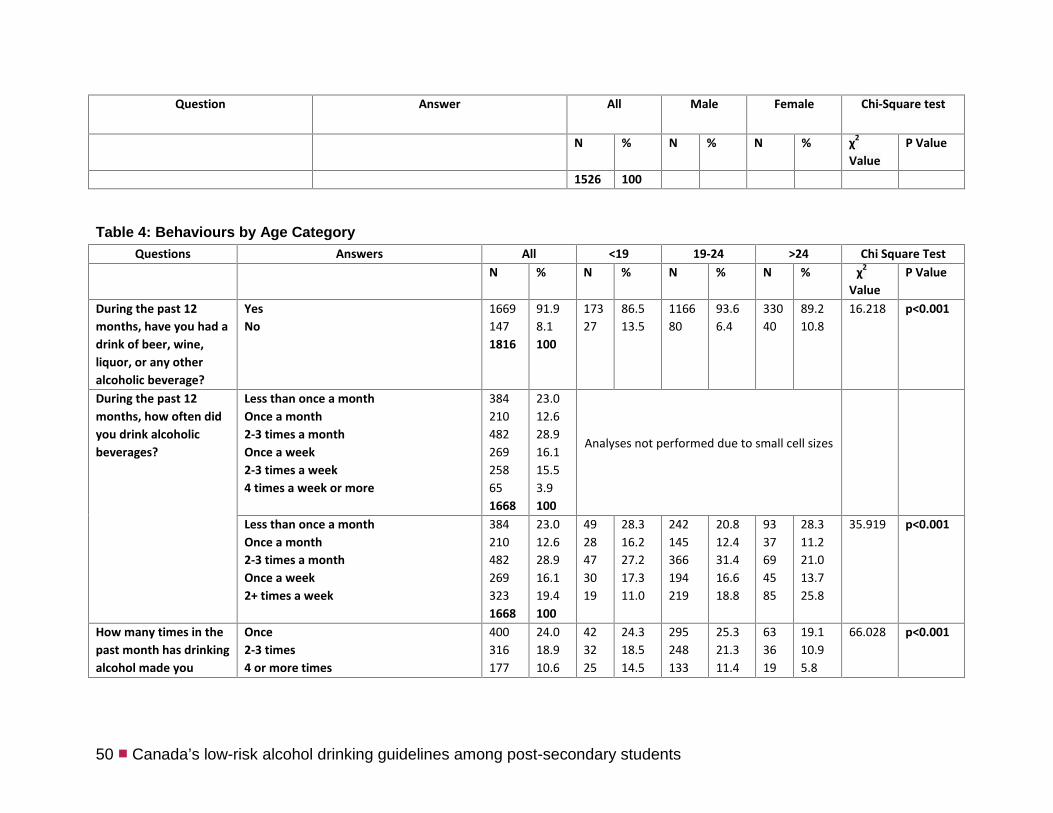
50 ■ Canada’s low-risk alcohol drinking guidelines among post-secondary students
Question Answer All Male Female Chi-Square test
N % N % N % χ2
ValueP Value
1526 100
Table 4: Behaviours by Age CategoryQuestions Answers All <19 19-24 >24 Chi Square Test
N % N % N % N % χ2
ValueP Value
During the past 12months, have you had adrink of beer, wine,liquor, or any otheralcoholic beverage?
YesNo
16691471816
91.98.1100
17327
86.513.5
116680
93.66.4
33040
89.210.8
16.218 p<0.001
During the past 12months, how often didyou drink alcoholicbeverages?
Less than once a monthOnce a month2-3 times a monthOnce a week2-3 times a week4 times a week or more
384210482269258651668
23.012.628.916.115.53.9100
Analyses not performed due to small cell sizes
Less than once a monthOnce a month2-3 times a monthOnce a week2+ times a week
3842104822693231668
23.012.628.916.119.4100
4928473019
28.316.227.217.311.0
242145366194219
20.812.431.416.618.8
9337694585
28.311.221.013.725.8
35.919 p<0.001
How many times in thepast month has drinkingalcohol made you
Once2-3 times4 or more times
400316177
24.018.910.6
423225
24.318.514.5
295248133
25.321.311.4
633619
19.110.95.8
66.028 p<0.001
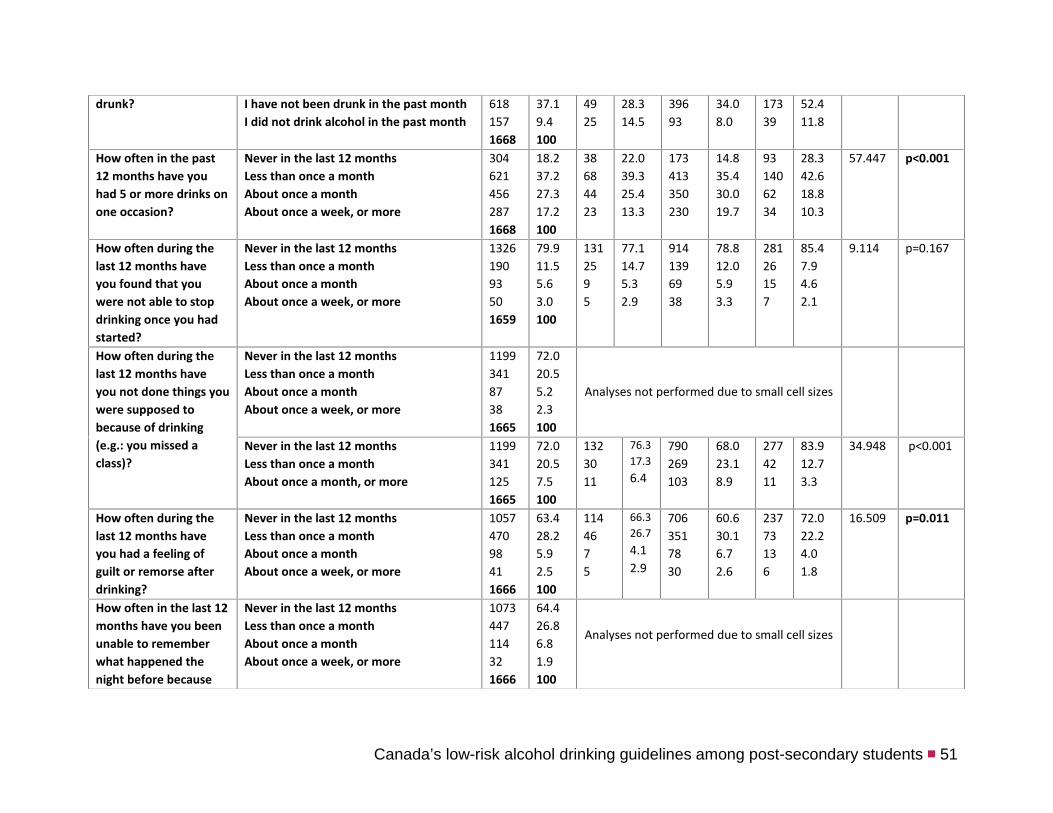
Canada’s low-risk alcohol drinking guidelines among post-secondary students ■ 51
drunk? I have not been drunk in the past monthI did not drink alcohol in the past month
6181571668
37.19.4100
4925
28.314.5
39693
34.08.0
17339
52.411.8
How often in the past12 months have youhad 5 or more drinks onone occasion?
Never in the last 12 monthsLess than once a monthAbout once a monthAbout once a week, or more
3046214562871668
18.237.227.317.2100
38684423
22.039.325.413.3
173413350230
14.835.430.019.7
931406234
28.342.618.810.3
57.447 p<0.001
How often during thelast 12 months haveyou found that youwere not able to stopdrinking once you hadstarted?
Never in the last 12 monthsLess than once a monthAbout once a monthAbout once a week, or more
132619093501659
79.911.55.63.0100
1312595
77.114.75.32.9
9141396938
78.812.05.93.3
28126157
85.47.94.62.1
9.114 p=0.167
How often during thelast 12 months haveyou not done things youwere supposed tobecause of drinking(e.g.: you missed aclass)?
Never in the last 12 monthsLess than once a monthAbout once a monthAbout once a week, or more
119934187381665
72.020.55.22.3100
Analyses not performed due to small cell sizes
Never in the last 12 monthsLess than once a monthAbout once a month, or more
11993411251665
72.020.57.5100
1323011
76.317.36.4
790269103
68.023.18.9
2774211
83.912.73.3
34.948 p<0.001
How often during thelast 12 months haveyou had a feeling ofguilt or remorse afterdrinking?
Never in the last 12 monthsLess than once a monthAbout once a monthAbout once a week, or more
105747098411666
63.428.25.92.5100
1144675
66.326.74.12.9
7063517830
60.630.16.72.6
23773136
72.022.24.01.8
16.509 p=0.011
How often in the last 12months have you beenunable to rememberwhat happened thenight before because
Never in the last 12 monthsLess than once a monthAbout once a monthAbout once a week, or more
1073447114321666
64.426.86.81.9100
Analyses not performed due to small cell sizes
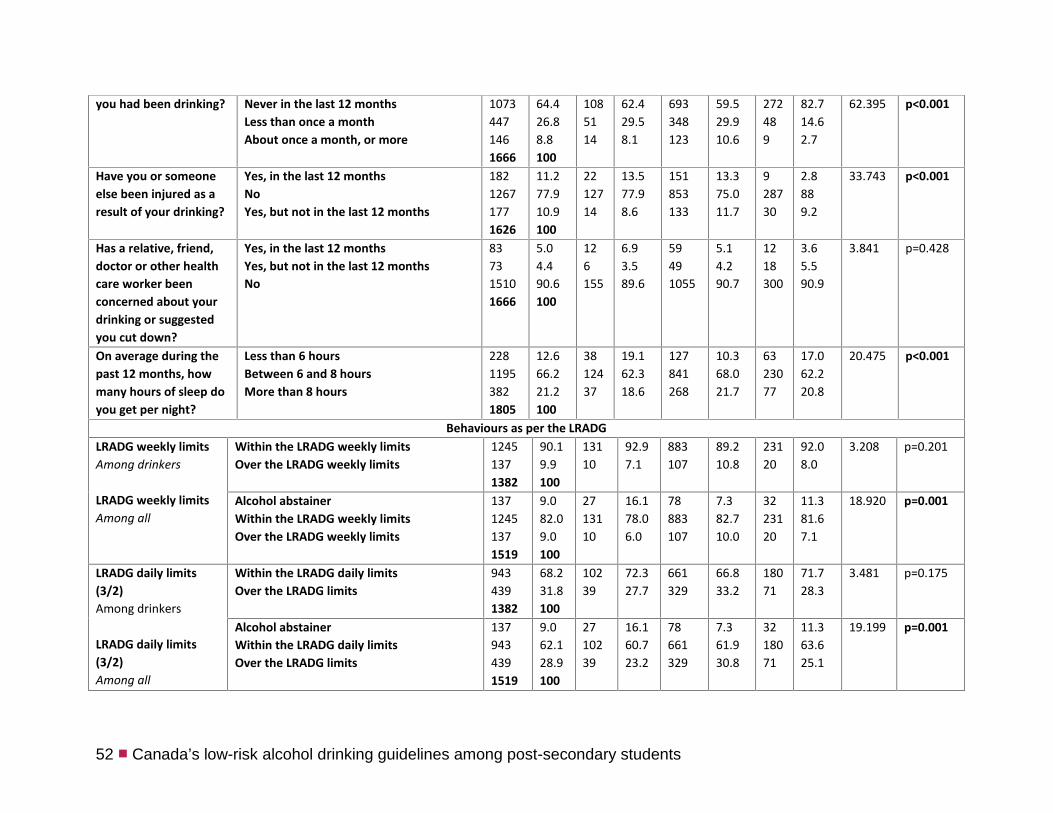
52 ■ Canada’s low-risk alcohol drinking guidelines among post-secondary students
you had been drinking? Never in the last 12 monthsLess than once a monthAbout once a month, or more
10734471461666
64.426.88.8100
1085114
62.429.58.1
693348123
59.529.910.6
272489
82.714.62.7
62.395 p<0.001
Have you or someoneelse been injured as aresult of your drinking?
Yes, in the last 12 monthsNoYes, but not in the last 12 months
18212671771626
11.277.910.9100
2212714
13.577.98.6
151853133
13.375.011.7
928730
2.8889.2
33.743 p<0.001
Has a relative, friend,doctor or other healthcare worker beenconcerned about yourdrinking or suggestedyou cut down?
Yes, in the last 12 monthsYes, but not in the last 12 monthsNo
837315101666
5.04.490.6100
126155
6.93.589.6
59491055
5.14.290.7
1218300
3.65.590.9
3.841 p=0.428
On average during thepast 12 months, howmany hours of sleep doyou get per night?
Less than 6 hoursBetween 6 and 8 hoursMore than 8 hours
22811953821805
12.666.221.2100
3812437
19.162.318.6
127841268
10.368.021.7
6323077
17.062.220.8
20.475 p<0.001
Behaviours as per the LRADGLRADG weekly limitsAmong drinkers
LRADG weekly limitsAmong all
Within the LRADG weekly limitsOver the LRADG weekly limits
12451371382
90.19.9100
13110
92.97.1
883107
89.210.8
23120
92.08.0
3.208 p=0.201
Alcohol abstainerWithin the LRADG weekly limitsOver the LRADG weekly limits
13712451371519
9.082.09.0100
2713110
16.178.06.0
78883107
7.382.710.0
3223120
11.381.67.1
18.920 p=0.001
LRADG daily limits(3/2)Among drinkers
LRADG daily limits(3/2)Among all
Within the LRADG daily limitsOver the LRADG limits
9434391382
68.231.8100
10239
72.327.7
661329
66.833.2
18071
71.728.3
3.481 p=0.175
Alcohol abstainerWithin the LRADG daily limitsOver the LRADG limits
1379434391519
9.062.128.9100
2710239
16.160.723.2
78661329
7.361.930.8
3218071
11.363.625.1
19.199 p=0.001
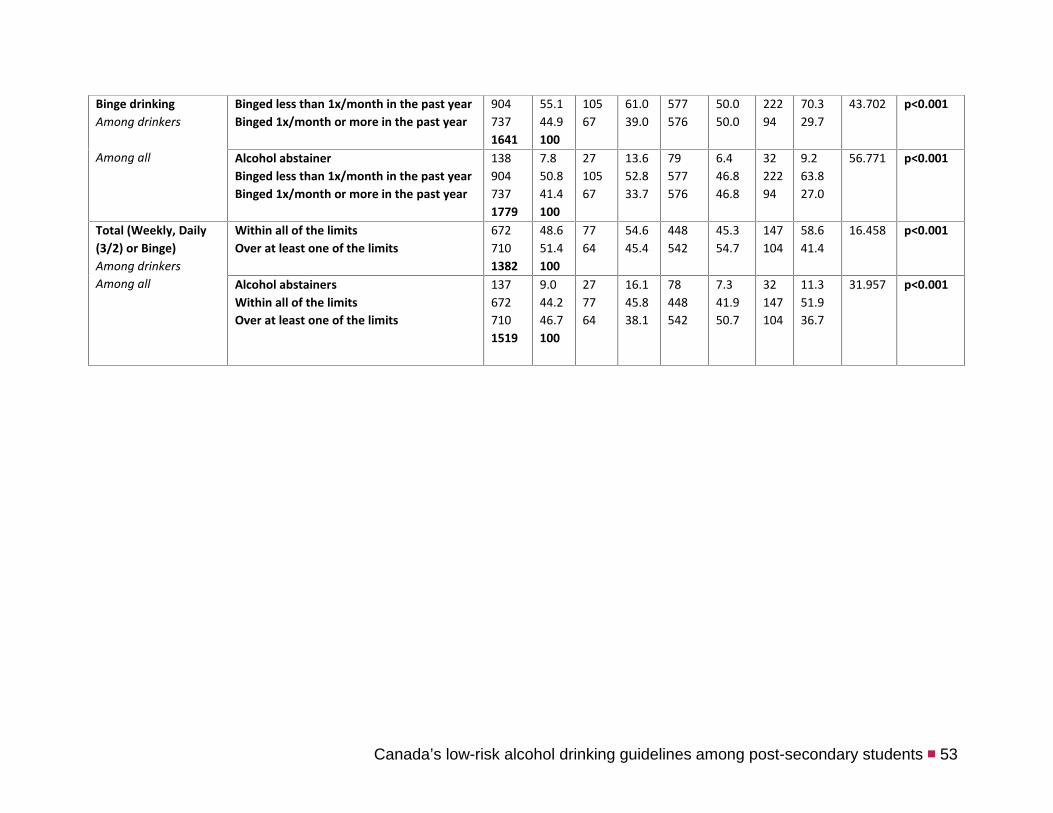
Canada’s low-risk alcohol drinking guidelines among post-secondary students ■ 53
Binge drinkingAmong drinkers
Among all
Binged less than 1x/month in the past yearBinged 1x/month or more in the past year
9047371641
55.144.9100
10567
61.039.0
577576
50.050.0
22294
70.329.7
43.702 p<0.001
Alcohol abstainerBinged less than 1x/month in the past yearBinged 1x/month or more in the past year
1389047371779
7.850.841.4100
2710567
13.652.833.7
79577576
6.446.846.8
3222294
9.263.827.0
56.771 p<0.001
Total (Weekly, Daily(3/2) or Binge)Among drinkersAmong all
Within all of the limitsOver at least one of the limits
6727101382
48.651.4100
7764
54.645.4
448542
45.354.7
147104
58.641.4
16.458 p<0.001
Alcohol abstainersWithin all of the limitsOver at least one of the limits
1376727101519
9.044.246.7100
277764
16.145.838.1
78448542
7.341.950.7
32147104
11.351.936.7
31.957 p<0.001
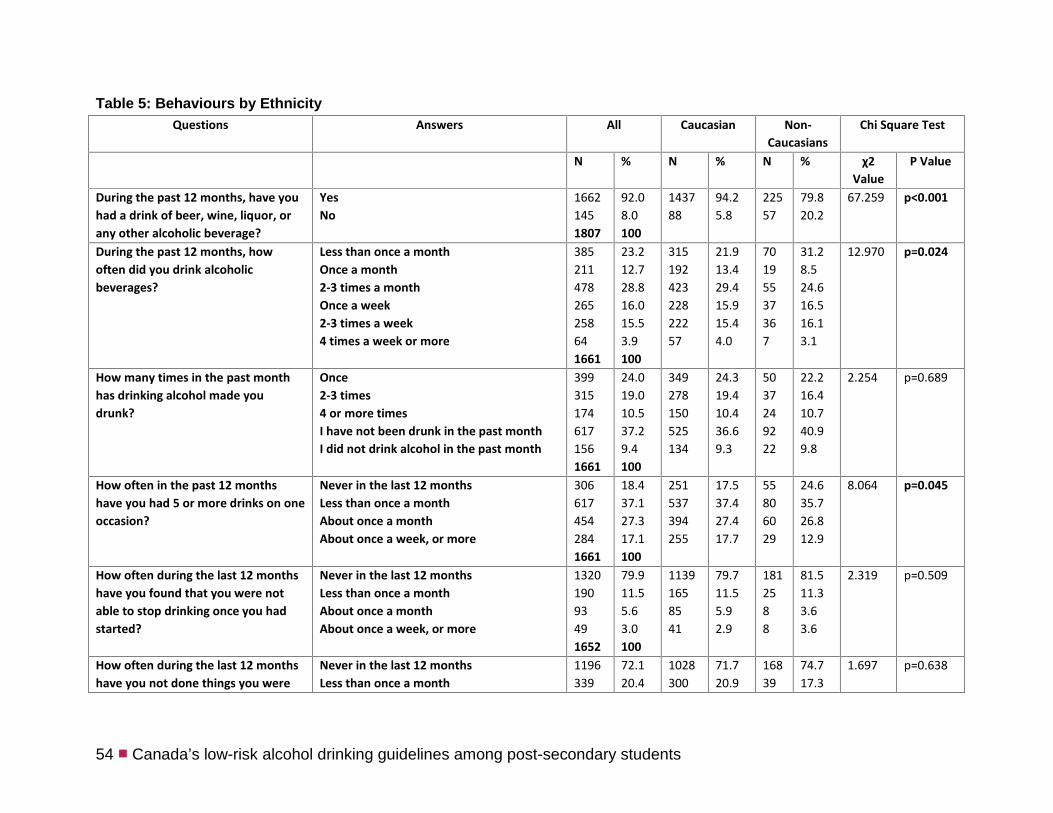
54 ■ Canada’s low-risk alcohol drinking guidelines among post-secondary students
Table 5: Behaviours by EthnicityQuestions Answers All Caucasian Non-
CaucasiansChi Square Test
N % N % N % χ2Value
P Value
During the past 12 months, have youhad a drink of beer, wine, liquor, orany other alcoholic beverage?
YesNo
16621451807
92.08.0100
143788
94.25.8
22557
79.820.2
67.259 p<0.001
During the past 12 months, howoften did you drink alcoholicbeverages?
Less than once a monthOnce a month2-3 times a monthOnce a week2-3 times a week4 times a week or more
385211478265258641661
23.212.728.816.015.53.9100
31519242322822257
21.913.429.415.915.44.0
70195537367
31.28.524.616.516.13.1
12.970 p=0.024
How many times in the past monthhas drinking alcohol made youdrunk?
Once2-3 times4 or more timesI have not been drunk in the past monthI did not drink alcohol in the past month
3993151746171561661
24.019.010.537.29.4100
349278150525134
24.319.410.436.69.3
5037249222
22.216.410.740.99.8
2.254 p=0.689
How often in the past 12 monthshave you had 5 or more drinks on oneoccasion?
Never in the last 12 monthsLess than once a monthAbout once a monthAbout once a week, or more
3066174542841661
18.437.127.317.1100
251537394255
17.537.427.417.7
55806029
24.635.726.812.9
8.064 p=0.045
How often during the last 12 monthshave you found that you were notable to stop drinking once you hadstarted?
Never in the last 12 monthsLess than once a monthAbout once a monthAbout once a week, or more
132019093491652
79.911.55.63.0100
11391658541
79.711.55.92.9
1812588
81.511.33.63.6
2.319 p=0.509
How often during the last 12 monthshave you not done things you were
Never in the last 12 monthsLess than once a month
1196339
72.120.4
1028300
71.720.9
16839
74.717.3
1.697 p=0.638

Canada’s low-risk alcohol drinking guidelines among post-secondary students ■ 55
Questions Answers All Caucasian Non-Caucasians
Chi Square Test
N % N % N % χ2Value
P Value
supposed to because of drinking (e.g.:you missed a class)?
About once a monthAbout once a week, or more
86371659
5.22.2100
7431
5.22.2
126
5.32.7
How often during the last 12 monthshave you had a feeling of guilt orremorse after drinking?
Never in the last 12 monthsLess than once a monthAbout once a monthAbout once a week, or more
105446898401660
63.528.25.92.4100
9233968730
64.327.66.12.1
131721110
58.532.14.94.5
7.426 p=0.059
How often in the last 12 months haveyou been unable to remember whathappened the night before becauseyou had been drinking?
Never in the last 12 monthsLess than once a monthAbout once a monthAbout once a week, or more
1069445114311659
64.426.86.91.9100
9123989926
63.627.76.91.8
15747155
64.426.86.91.9
4.773 p=0.189
Have you or someone else beeninjured as a result of your drinking?
Yes, in the last 12 monthsYes, but not in the last 12 monthsNo
18117512641620
11.210.878.0100
1641491086
11.710.777.6
1726178
7.711.880.5
3.202 p=0.202
Has a relative, friend, doctor or otherhealth care worker been concernedabout your drinking or suggested youcut down?
Yes, in the last 12 monthsYes, but not in the last 12 monthsNo
827315051660
4.94.490.7100
69631303
4.84.490.8
1310202
5.84.489.8
0.394 p=0.821
On average during the past 12months, how many hours of sleep doyou get per night?
Less than 6 hoursBetween 6 and 8 hoursMore than 8 hours
22511933781796
12.566.421.0100
1751007333
11.666.522.0
5018645
17.866.216.0
11.384 p=0.003
Behaviours as per the LRADGLRADG weekly limitsAmong drinkers
Within the LRADG weekly limitsOver the LRADG weekly limits
12411361377
90.19.9100
1090123
89.910.1
15113
92.17.9
0.795 p=0.373
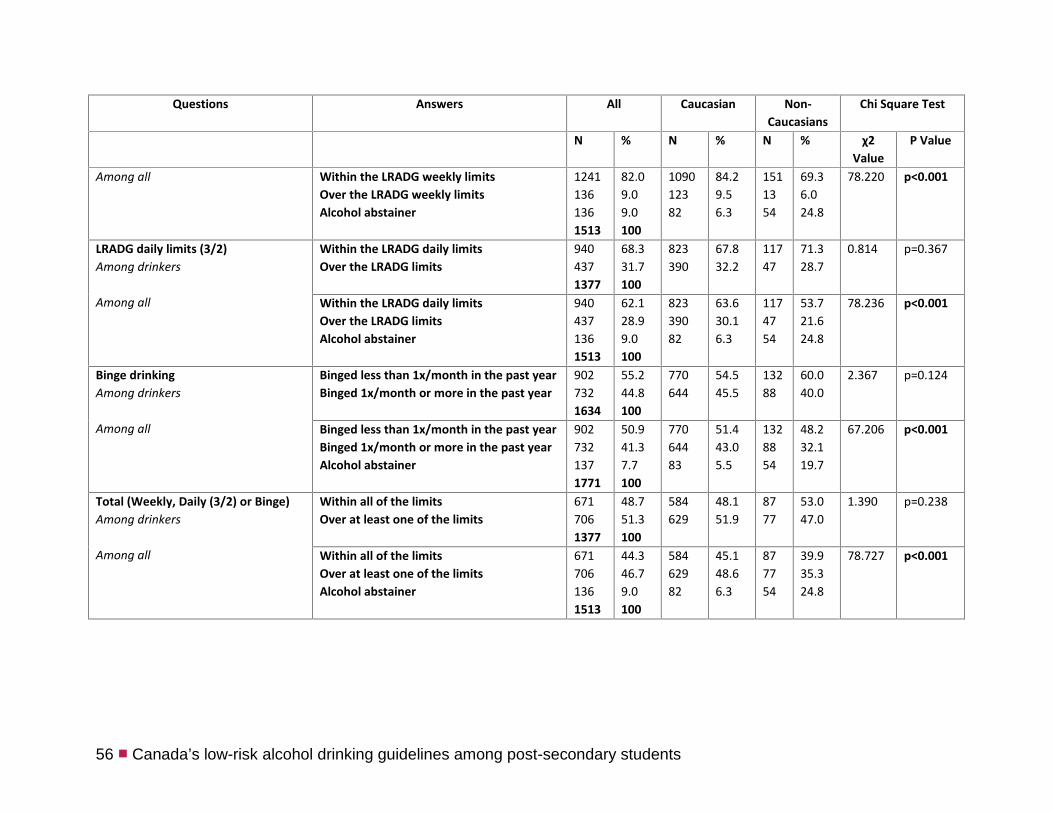
56 ■ Canada’s low-risk alcohol drinking guidelines among post-secondary students
Questions Answers All Caucasian Non-Caucasians
Chi Square Test
N % N % N % χ2Value
P Value
Among all Within the LRADG weekly limitsOver the LRADG weekly limitsAlcohol abstainer
12411361361513
82.09.09.0100
109012382
84.29.56.3
1511354
69.36.024.8
78.220 p<0.001
LRADG daily limits (3/2)Among drinkers
Among all
Within the LRADG daily limitsOver the LRADG limits
9404371377
68.331.7100
823390
67.832.2
11747
71.328.7
0.814 p=0.367
Within the LRADG daily limitsOver the LRADG limitsAlcohol abstainer
9404371361513
62.128.99.0100
82339082
63.630.16.3
1174754
53.721.624.8
78.236 p<0.001
Binge drinkingAmong drinkers
Among all
Binged less than 1x/month in the past yearBinged 1x/month or more in the past year
9027321634
55.244.8100
770644
54.545.5
13288
60.040.0
2.367 p=0.124
Binged less than 1x/month in the past yearBinged 1x/month or more in the past yearAlcohol abstainer
9027321371771
50.941.37.7100
77064483
51.443.05.5
1328854
48.232.119.7
67.206 p<0.001
Total (Weekly, Daily (3/2) or Binge)Among drinkers
Among all
Within all of the limitsOver at least one of the limits
6717061377
48.751.3100
584629
48.151.9
8777
53.047.0
1.390 p=0.238
Within all of the limitsOver at least one of the limitsAlcohol abstainer
6717061361513
44.346.79.0100
58462982
45.148.66.3
877754
39.935.324.8
78.727 p<0.001

Canada’s low-risk alcohol drinking guidelines among post-secondary students ■ 57
Table 6: Behaviours by Mother TongueAll English Other Chi Square Test
N % N % N % χ2Value
P Value
During the past 12 months, have youhad a drink of beer, wine, liquor, orany other alcoholic beverage?
YesNo
16711481819
91.98.1100
109898
91.88.2
57350
92.08.0
0.016 p=0.901
During the past 12 months, howoften did you drink alcoholicbeverages?
Less than once a monthOnce a month2-3 times a monthOnce a week2-3 times a week4 times a week or more
384212484268258641670
23.012.729.016.015.43.8100
23714030918817548
21.612.828.217.116.04.4
14772175808316
25.712.630.514.014.52.8
8.781 p=0.118
How many times in the past monthhas drinking alcohol made youdrunk?
Once2-3 times4 or more timesI have not been drunk in the past monthI did not drink alcohol in the past month
4013161776171591670
24.018.910.636.99.5100
25921613039895
23.619.711.836.28.7
1421004721964
24.817.58.238.311.2
8.815 p=0.066
How often in the past 12 monthshave you had 5 or more drinks on oneoccasion?
Never in the last 12 monthsLess than once a monthAbout once a monthAbout once a week, or more
3066224552871670
18.337.227.217.2100
191417288201
17.438.026.318.3
11520516786
20.135.829.115.0
5.518 p=0.138
How often during the last 12 monthshave you found that you were notable to stop drinking once you hadstarted?
Never in the last 12 monthsLess than once a monthAbout once a monthAbout once a week, or more
132918993501661
80.011.45.63.0100
8811126236
80.810.35.73.3
448773114
78.613.55.42.5
4.603 p=0.203
How often during the last 12 monthshave you not done things you were
Never in the last 12 monthsLess than once a month
1202340
72.120.4
764239
69.621.8
438101
76.817.7
11.754 p=0.008
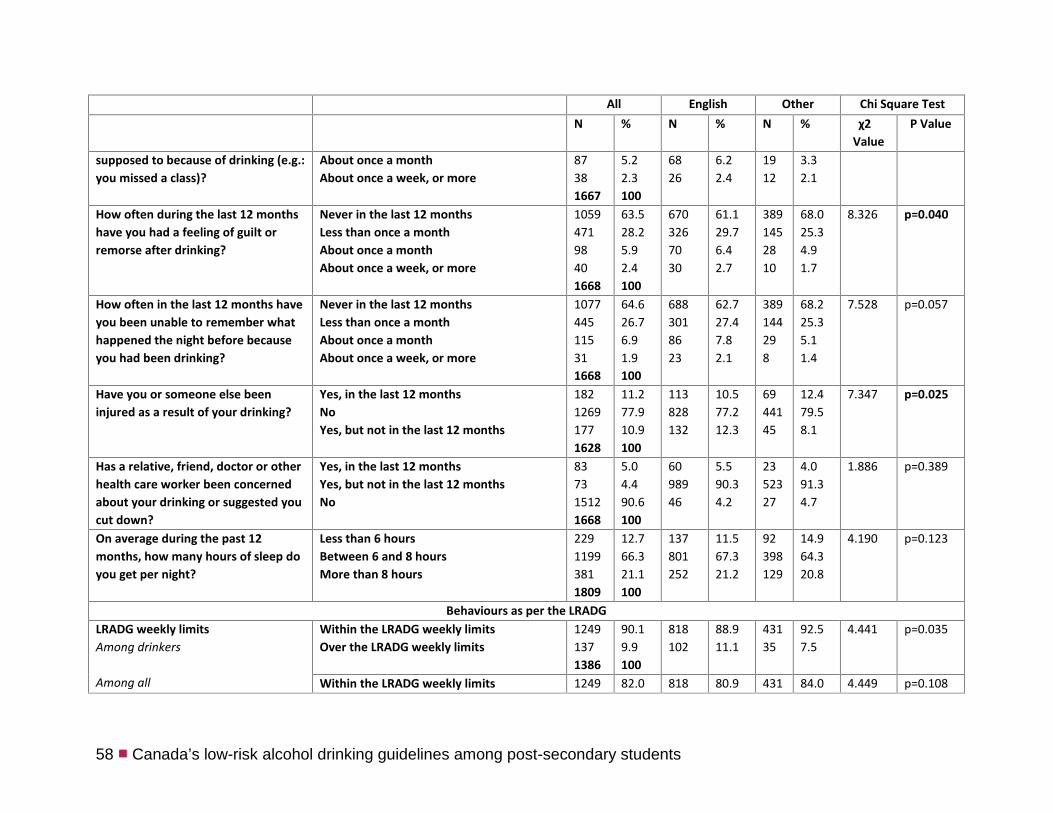
58 ■ Canada’s low-risk alcohol drinking guidelines among post-secondary students
All English Other Chi Square TestN % N % N % χ2
ValueP Value
supposed to because of drinking (e.g.:you missed a class)?
About once a monthAbout once a week, or more
87381667
5.22.3100
6826
6.22.4
1912
3.32.1
How often during the last 12 monthshave you had a feeling of guilt orremorse after drinking?
Never in the last 12 monthsLess than once a monthAbout once a monthAbout once a week, or more
105947198401668
63.528.25.92.4100
6703267030
61.129.76.42.7
3891452810
68.025.34.91.7
8.326 p=0.040
How often in the last 12 months haveyou been unable to remember whathappened the night before becauseyou had been drinking?
Never in the last 12 monthsLess than once a monthAbout once a monthAbout once a week, or more
1077445115311668
64.626.76.91.9100
6883018623
62.727.47.82.1
389144298
68.225.35.11.4
7.528 p=0.057
Have you or someone else beeninjured as a result of your drinking?
Yes, in the last 12 monthsNoYes, but not in the last 12 months
18212691771628
11.277.910.9100
113828132
10.577.212.3
6944145
12.479.58.1
7.347 p=0.025
Has a relative, friend, doctor or otherhealth care worker been concernedabout your drinking or suggested youcut down?
Yes, in the last 12 monthsYes, but not in the last 12 monthsNo
837315121668
5.04.490.6100
6098946
5.590.34.2
2352327
4.091.34.7
1.886 p=0.389
On average during the past 12months, how many hours of sleep doyou get per night?
Less than 6 hoursBetween 6 and 8 hoursMore than 8 hours
22911993811809
12.766.321.1100
137801252
11.567.321.2
92398129
14.964.320.8
4.190 p=0.123
Behaviours as per the LRADGLRADG weekly limitsAmong drinkers
Among all
Within the LRADG weekly limitsOver the LRADG weekly limits
12491371386
90.19.9100
818102
88.911.1
43135
92.57.5
4.441 p=0.035
Within the LRADG weekly limits 1249 82.0 818 80.9 431 84.0 4.449 p=0.108
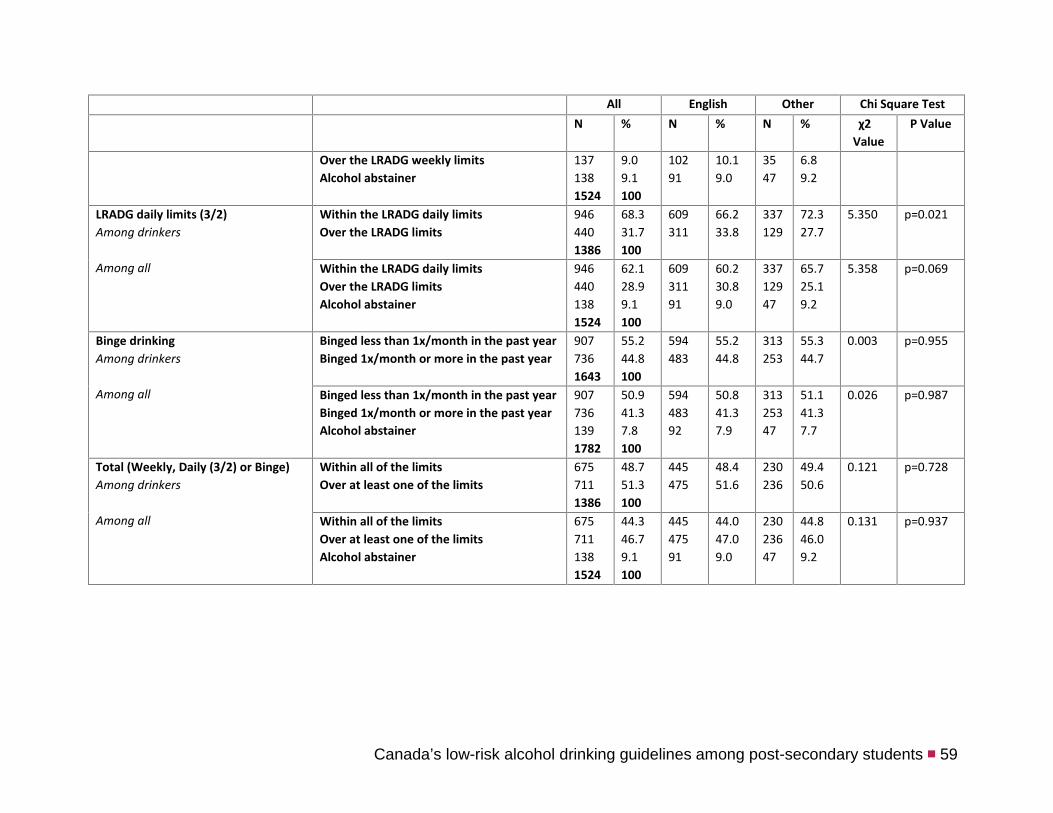
Canada’s low-risk alcohol drinking guidelines among post-secondary students ■ 59
All English Other Chi Square TestN % N % N % χ2
ValueP Value
Over the LRADG weekly limitsAlcohol abstainer
1371381524
9.09.1100
10291
10.19.0
3547
6.89.2
LRADG daily limits (3/2)Among drinkers
Among all
Within the LRADG daily limitsOver the LRADG limits
9464401386
68.331.7100
609311
66.233.8
337129
72.327.7
5.350 p=0.021
Within the LRADG daily limitsOver the LRADG limitsAlcohol abstainer
9464401381524
62.128.99.1100
60931191
60.230.89.0
33712947
65.725.19.2
5.358 p=0.069
Binge drinkingAmong drinkers
Among all
Binged less than 1x/month in the past yearBinged 1x/month or more in the past year
9077361643
55.244.8100
594483
55.244.8
313253
55.344.7
0.003 p=0.955
Binged less than 1x/month in the past yearBinged 1x/month or more in the past yearAlcohol abstainer
9077361391782
50.941.37.8100
59448392
50.841.37.9
31325347
51.141.37.7
0.026 p=0.987
Total (Weekly, Daily (3/2) or Binge)Among drinkers
Among all
Within all of the limitsOver at least one of the limits
6757111386
48.751.3100
445475
48.451.6
230236
49.450.6
0.121 p=0.728
Within all of the limitsOver at least one of the limitsAlcohol abstainer
6757111381524
44.346.79.1100
44547591
44.047.09.0
23023647
44.846.09.2
0.131 p=0.937
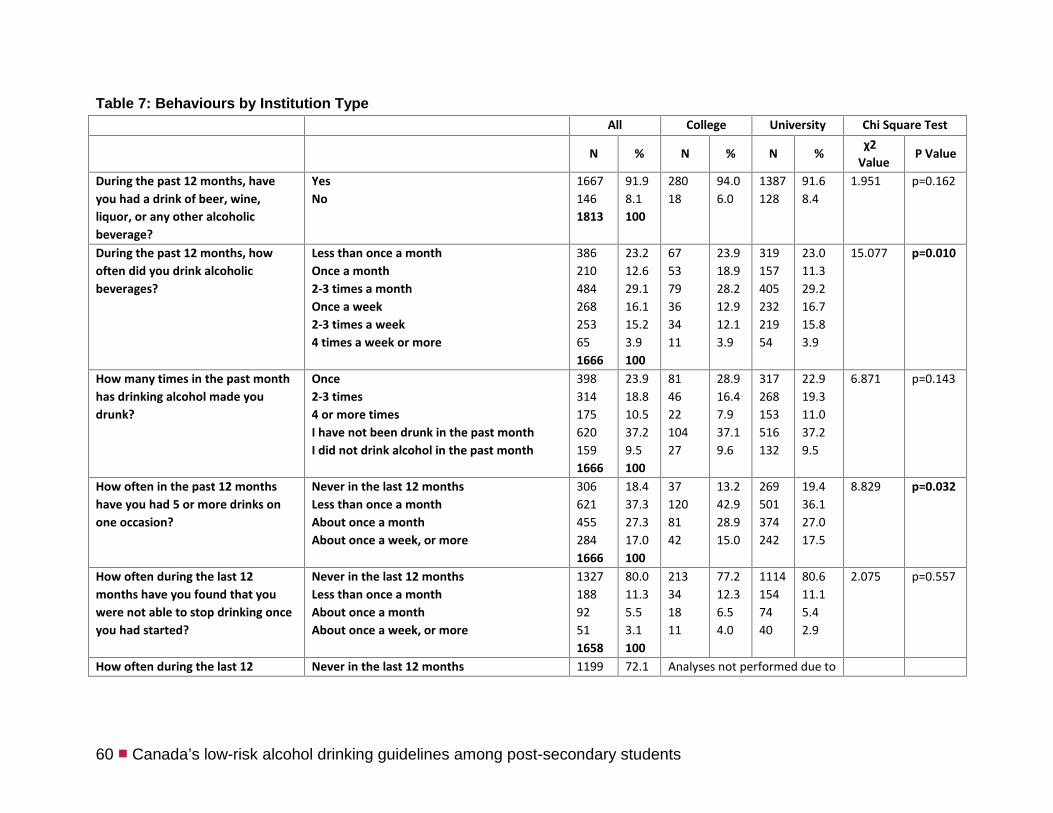
60 ■ Canada’s low-risk alcohol drinking guidelines among post-secondary students
Table 7: Behaviours by Institution TypeAll College University Chi Square Test
N % N % N %χ2
ValueP Value
During the past 12 months, haveyou had a drink of beer, wine,liquor, or any other alcoholicbeverage?
YesNo
16671461813
91.98.1100
28018
94.06.0
1387128
91.68.4
1.951 p=0.162
During the past 12 months, howoften did you drink alcoholicbeverages?
Less than once a monthOnce a month2-3 times a monthOnce a week2-3 times a week4 times a week or more
386210484268253651666
23.212.629.116.115.23.9100
675379363411
23.918.928.212.912.13.9
31915740523221954
23.011.329.216.715.83.9
15.077 p=0.010
How many times in the past monthhas drinking alcohol made youdrunk?
Once2-3 times4 or more timesI have not been drunk in the past monthI did not drink alcohol in the past month
3983141756201591666
23.918.810.537.29.5100
81462210427
28.916.47.937.19.6
317268153516132
22.919.311.037.29.5
6.871 p=0.143
How often in the past 12 monthshave you had 5 or more drinks onone occasion?
Never in the last 12 monthsLess than once a monthAbout once a monthAbout once a week, or more
3066214552841666
18.437.327.317.0100
371208142
13.242.928.915.0
269501374242
19.436.127.017.5
8.829 p=0.032
How often during the last 12months have you found that youwere not able to stop drinking onceyou had started?
Never in the last 12 monthsLess than once a monthAbout once a monthAbout once a week, or more
132718892511658
80.011.35.53.1100
213341811
77.212.36.54.0
11141547440
80.611.15.42.9
2.075 p=0.557
How often during the last 12 Never in the last 12 months 1199 72.1 Analyses not performed due to

Canada’s low-risk alcohol drinking guidelines among post-secondary students ■ 61
All College University Chi Square Test
N % N % N %χ2
ValueP Value
months have you not done thingsyou were supposed to because ofdrinking (e.g.: you missed a class)?
Less than once a monthAbout once a monthAbout once a week, or more
34086381663
20.45.22.3100
small cell sizes
Never in the last 12 monthsLess than once a monthAbout once a month, or more
11993401241663
72.120.47.5100
2134521
76.316.17.5
986295103
71.221.37.4
3.895 p=0.143
How often during the last 12months have you had a feeling ofguilt or remorse after drinking?
Never in the last 12 monthsLess than once a monthAbout once a monthAbout once a week, or more
105846997401664
63.628.25.82.4100
19664135
70.523.04.71.8
8624058435
62.229.26.12.5
6.942 p=0.074
How often in the last 12 monthshave you been unable to rememberwhat happened the night beforebecause you had been drinking?
Never in the last 12 monthsLess than once a monthAbout once a monthAbout once a week, or more
1076444113311664
64.726.76.81.9100
Analyses not performed due tosmall cell sizes
Never in the last 12 monthsLess than once a monthAbout once a month, or more
10764441441664
64.726.78.7100
1867024
66.425.08.6
890374120
64.327.08.7
0.522 p=0.770
Have you or someone else beeninjured as a result of your drinking?
Yes, in the last 12 monthsNoYes, but not in the last 12 months
18112681751624
11.178.110.8100
2720442
9.974.715.4
1541064133
11.478.89.8
7.405 p=0.025
Has a relative, friend, doctor orother health care worker beenconcerned about your drinking orsuggested you cut down?
Yes, in the last 12 monthsYes, but not in the last 12 monthsNo
827115111664
4.94.390.8100
914257
3.25.091.8
73571254
5.34.190.6
2.466 p=0.291
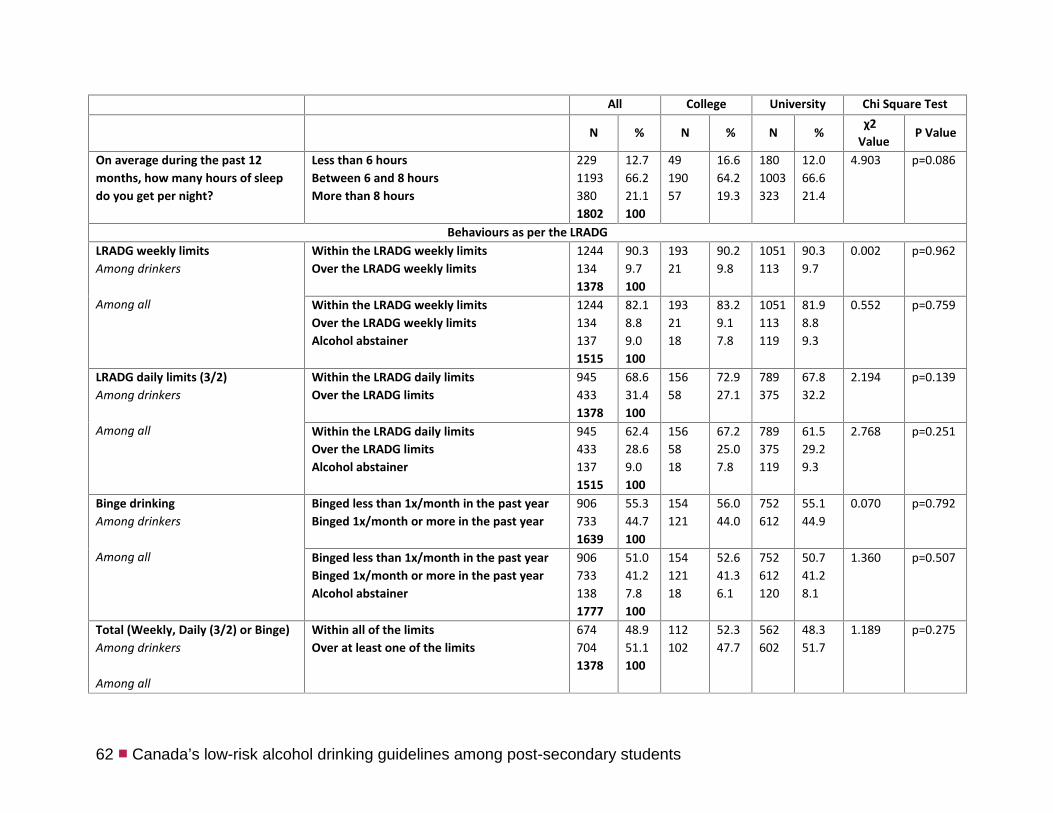
62 ■ Canada’s low-risk alcohol drinking guidelines among post-secondary students
All College University Chi Square Test
N % N % N %χ2
ValueP Value
On average during the past 12months, how many hours of sleepdo you get per night?
Less than 6 hoursBetween 6 and 8 hoursMore than 8 hours
22911933801802
12.766.221.1100
4919057
16.664.219.3
1801003323
12.066.621.4
4.903 p=0.086
Behaviours as per the LRADGLRADG weekly limitsAmong drinkers
Among all
Within the LRADG weekly limitsOver the LRADG weekly limits
12441341378
90.39.7100
19321
90.29.8
1051113
90.39.7
0.002 p=0.962
Within the LRADG weekly limitsOver the LRADG weekly limitsAlcohol abstainer
12441341371515
82.18.89.0100
1932118
83.29.17.8
1051113119
81.98.89.3
0.552 p=0.759
LRADG daily limits (3/2)Among drinkers
Among all
Within the LRADG daily limitsOver the LRADG limits
9454331378
68.631.4100
15658
72.927.1
789375
67.832.2
2.194 p=0.139
Within the LRADG daily limitsOver the LRADG limitsAlcohol abstainer
9454331371515
62.428.69.0100
1565818
67.225.07.8
789375119
61.529.29.3
2.768 p=0.251
Binge drinkingAmong drinkers
Among all
Binged less than 1x/month in the past yearBinged 1x/month or more in the past year
9067331639
55.344.7100
154121
56.044.0
752612
55.144.9
0.070 p=0.792
Binged less than 1x/month in the past yearBinged 1x/month or more in the past yearAlcohol abstainer
9067331381777
51.041.27.8100
15412118
52.641.36.1
752612120
50.741.28.1
1.360 p=0.507
Total (Weekly, Daily (3/2) or Binge)Among drinkers
Among all
Within all of the limitsOver at least one of the limits
6747041378
48.951.1100
112102
52.347.7
562602
48.351.7
1.189 p=0.275
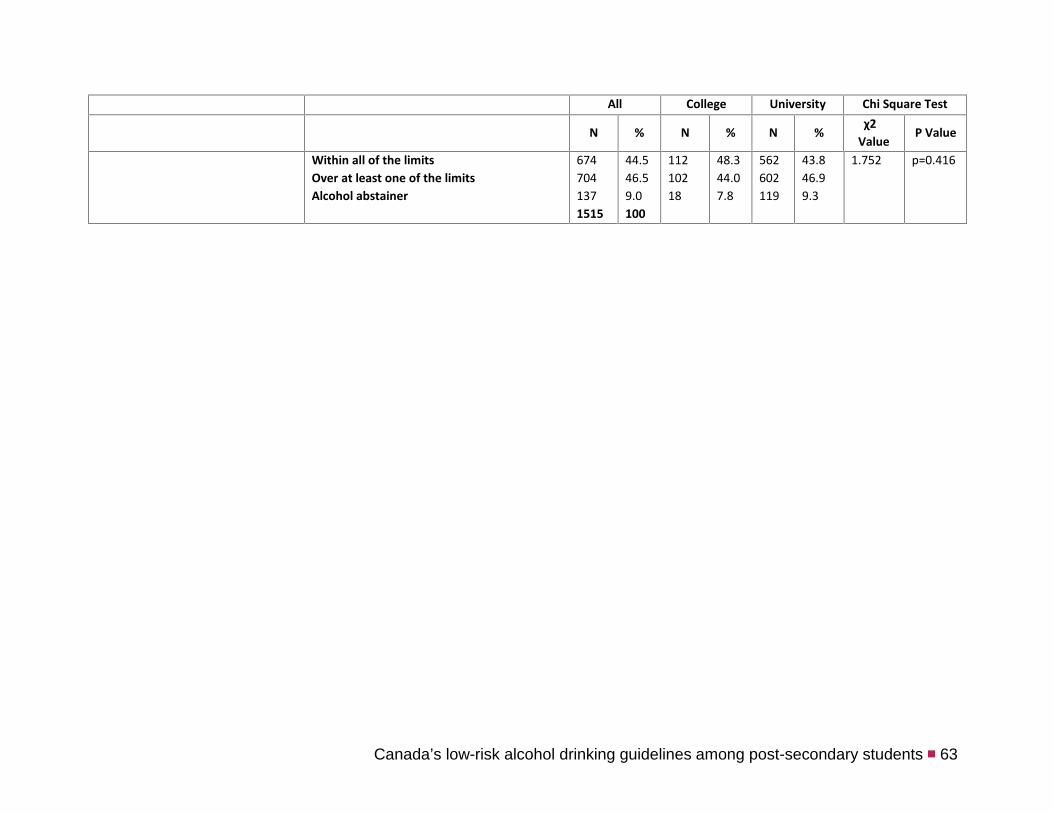
Canada’s low-risk alcohol drinking guidelines among post-secondary students ■ 63
All College University Chi Square Test
N % N % N %χ2
ValueP Value
Within all of the limitsOver at least one of the limitsAlcohol abstainer
6747041371515
44.546.59.0100
11210218
48.344.07.8
562602119
43.846.99.3
1.752 p=0.416
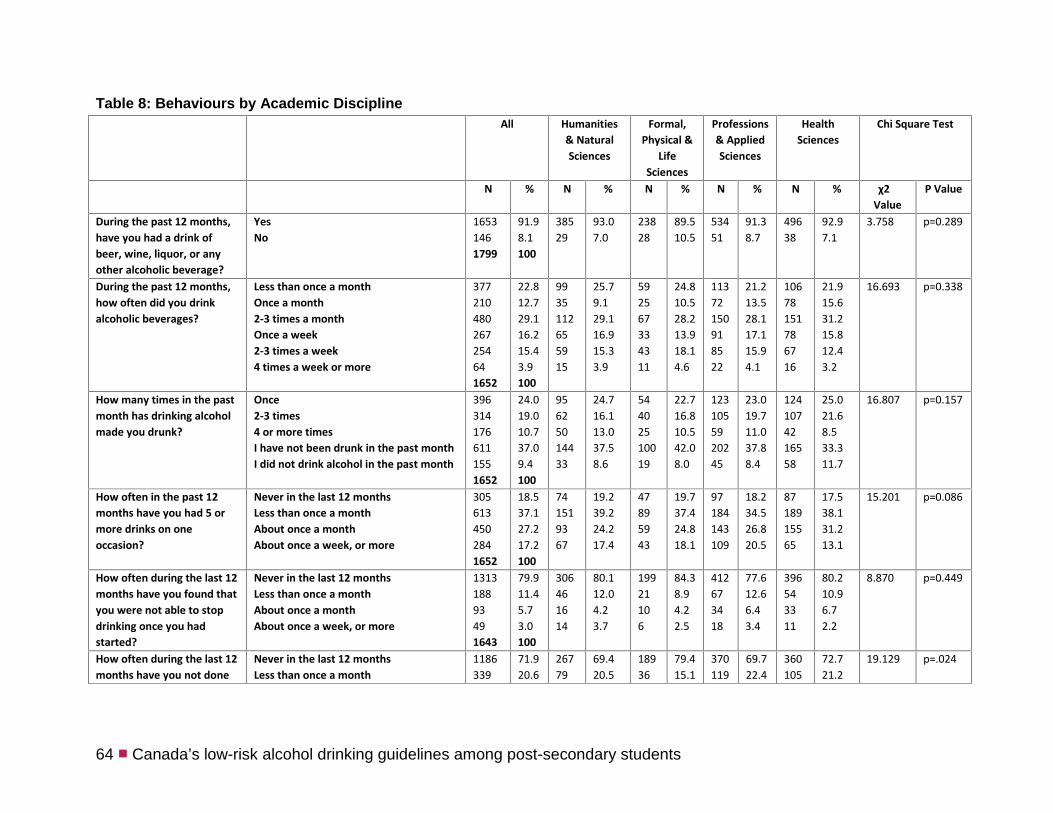
64 ■ Canada’s low-risk alcohol drinking guidelines among post-secondary students
Table 8: Behaviours by Academic DisciplineAll Humanities
& NaturalSciences
Formal,Physical &
LifeSciences
Professions& AppliedSciences
HealthSciences
Chi Square Test
N % N % N % N % N % χ2Value
P Value
During the past 12 months,have you had a drink ofbeer, wine, liquor, or anyother alcoholic beverage?
YesNo
16531461799
91.98.1100
38529
93.07.0
23828
89.510.5
53451
91.38.7
49638
92.97.1
3.758 p=0.289
During the past 12 months,how often did you drinkalcoholic beverages?
Less than once a monthOnce a month2-3 times a monthOnce a week2-3 times a week4 times a week or more
377210480267254641652
22.812.729.116.215.43.9100
9935112655915
25.79.129.116.915.33.9
592567334311
24.810.528.213.918.14.6
11372150918522
21.213.528.117.115.94.1
10678151786716
21.915.631.215.812.43.2
16.693 p=0.338
How many times in the pastmonth has drinking alcoholmade you drunk?
Once2-3 times4 or more timesI have not been drunk in the past monthI did not drink alcohol in the past month
3963141766111551652
24.019.010.737.09.4100
95625014433
24.716.113.037.58.6
54402510019
22.716.810.542.08.0
1231055920245
23.019.711.037.88.4
1241074216558
25.021.68.533.311.7
16.807 p=0.157
How often in the past 12months have you had 5 ormore drinks on oneoccasion?
Never in the last 12 monthsLess than once a monthAbout once a monthAbout once a week, or more
3056134502841652
18.537.127.217.2100
741519367
19.239.224.217.4
47895943
19.737.424.818.1
97184143109
18.234.526.820.5
8718915565
17.538.131.213.1
15.201 p=0.086
How often during the last 12months have you found thatyou were not able to stopdrinking once you hadstarted?
Never in the last 12 monthsLess than once a monthAbout once a monthAbout once a week, or more
131318893491643
79.911.45.73.0100
306461614
80.112.04.23.7
19921106
84.38.94.22.5
412673418
77.612.66.43.4
396543311
80.210.96.72.2
8.870 p=0.449
How often during the last 12months have you not done
Never in the last 12 monthsLess than once a month
1186339
71.920.6
26779
69.420.5
18936
79.415.1
370119
69.722.4
360105
72.721.2
19.129 p=.024
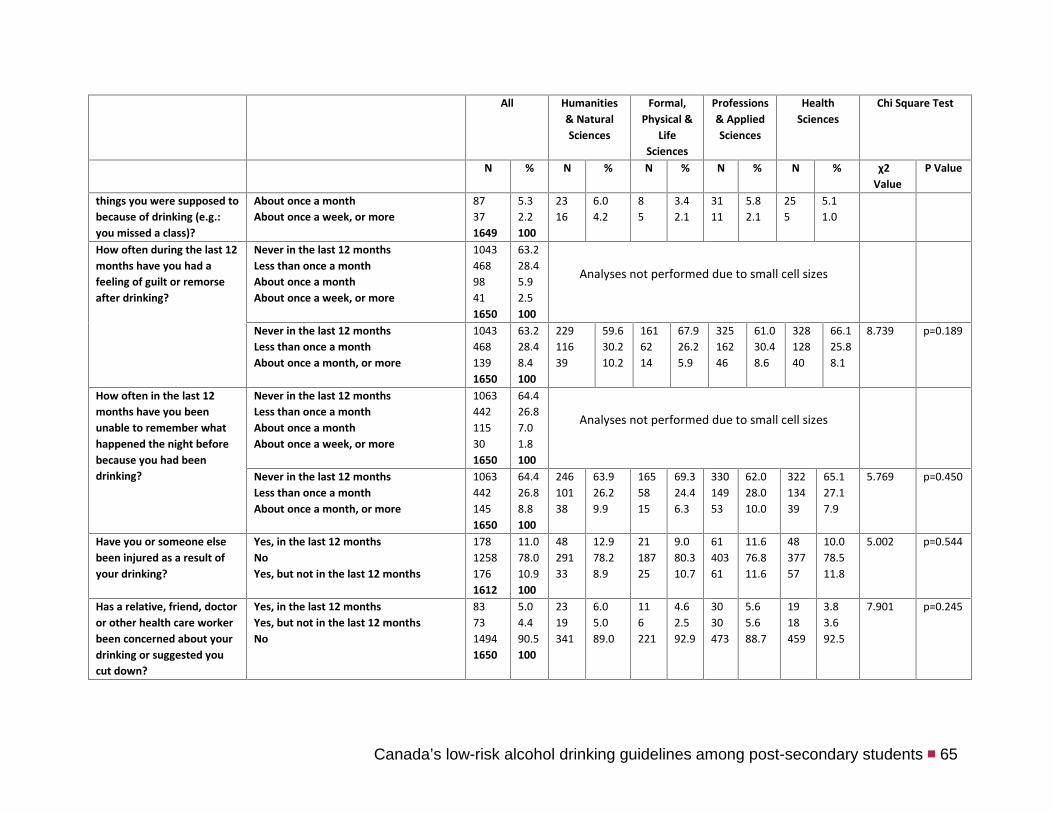
Canada’s low-risk alcohol drinking guidelines among post-secondary students ■ 65
All Humanities& NaturalSciences
Formal,Physical &
LifeSciences
Professions& AppliedSciences
HealthSciences
Chi Square Test
N % N % N % N % N % χ2Value
P Value
things you were supposed tobecause of drinking (e.g.:you missed a class)?
About once a monthAbout once a week, or more
87371649
5.32.2100
2316
6.04.2
85
3.42.1
3111
5.82.1
255
5.11.0
How often during the last 12months have you had afeeling of guilt or remorseafter drinking?
Never in the last 12 monthsLess than once a monthAbout once a monthAbout once a week, or more
104346898411650
63.228.45.92.5100
Analyses not performed due to small cell sizes
Never in the last 12 monthsLess than once a monthAbout once a month, or more
10434681391650
63.228.48.4100
22911639
59.630.210.2
1616214
67.926.25.9
32516246
61.030.48.6
32812840
66.125.88.1
8.739 p=0.189
How often in the last 12months have you beenunable to remember whathappened the night beforebecause you had beendrinking?
Never in the last 12 monthsLess than once a monthAbout once a monthAbout once a week, or more
1063442115301650
64.426.87.01.8100
Analyses not performed due to small cell sizes
Never in the last 12 monthsLess than once a monthAbout once a month, or more
10634421451650
64.426.88.8100
24610138
63.926.29.9
1655815
69.324.46.3
33014953
62.028.010.0
32213439
65.127.17.9
5.769 p=0.450
Have you or someone elsebeen injured as a result ofyour drinking?
Yes, in the last 12 monthsNoYes, but not in the last 12 months
17812581761612
11.078.010.9100
4829133
12.978.28.9
2118725
9.080.310.7
6140361
11.676.811.6
4837757
10.078.511.8
5.002 p=0.544
Has a relative, friend, doctoror other health care workerbeen concerned about yourdrinking or suggested youcut down?
Yes, in the last 12 monthsYes, but not in the last 12 monthsNo
837314941650
5.04.490.5100
2319341
6.05.089.0
116221
4.62.592.9
3030473
5.65.688.7
1918459
3.83.692.5
7.901 p=0.245
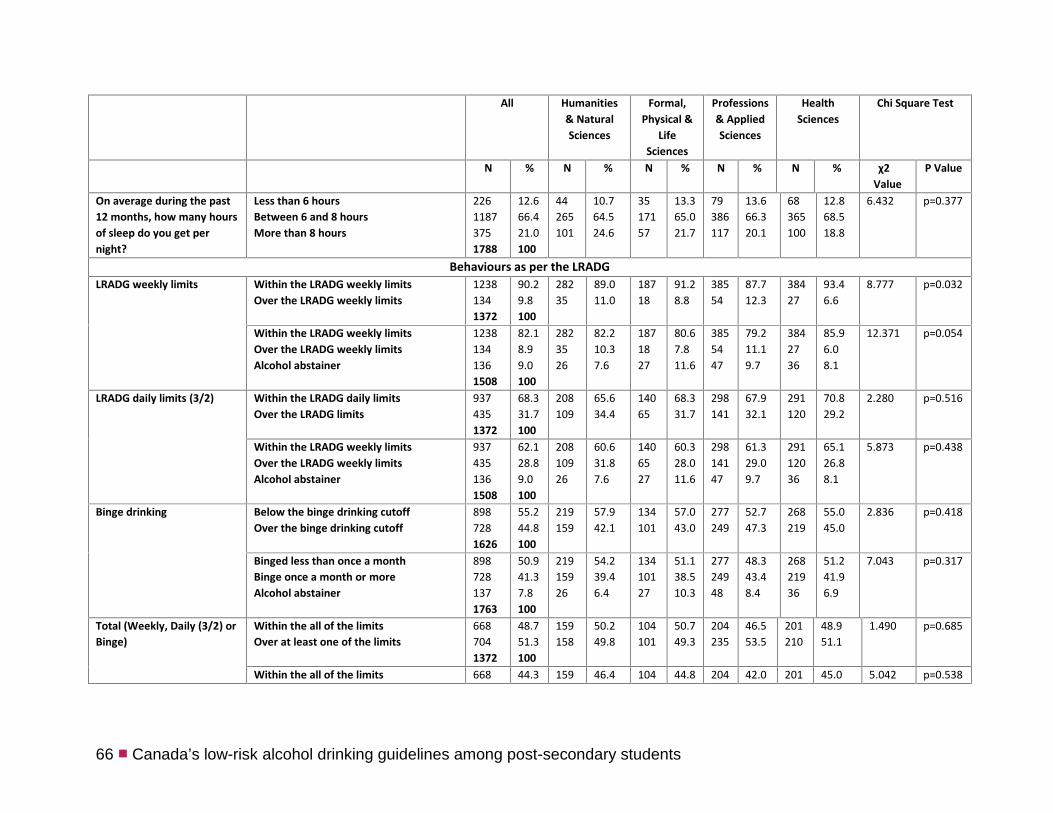
66 ■ Canada’s low-risk alcohol drinking guidelines among post-secondary students
All Humanities& NaturalSciences
Formal,Physical &
LifeSciences
Professions& AppliedSciences
HealthSciences
Chi Square Test
N % N % N % N % N % χ2Value
P Value
On average during the past12 months, how many hoursof sleep do you get pernight?
Less than 6 hoursBetween 6 and 8 hoursMore than 8 hours
22611873751788
12.666.421.0100
44265101
10.764.524.6
3517157
13.365.021.7
79386117
13.666.320.1
68365100
12.868.518.8
6.432 p=0.377
Behaviours as per the LRADGLRADG weekly limits Within the LRADG weekly limits
Over the LRADG weekly limits12381341372
90.29.8100
28235
89.011.0
18718
91.28.8
38554
87.712.3
38427
93.46.6
8.777 p=0.032
Within the LRADG weekly limitsOver the LRADG weekly limitsAlcohol abstainer
12381341361508
82.18.99.0100
2823526
82.210.37.6
1871827
80.67.811.6
3855447
79.211.19.7
3842736
85.96.08.1
12.371 p=0.054
LRADG daily limits (3/2) Within the LRADG daily limitsOver the LRADG limits
9374351372
68.331.7100
208109
65.634.4
14065
68.331.7
298141
67.932.1
291120
70.829.2
2.280 p=0.516
Within the LRADG weekly limitsOver the LRADG weekly limitsAlcohol abstainer
9374351361508
62.128.89.0100
20810926
60.631.87.6
1406527
60.328.011.6
29814147
61.329.09.7
29112036
65.126.88.1
5.873 p=0.438
Binge drinking Below the binge drinking cutoffOver the binge drinking cutoff
8987281626
55.244.8100
219159
57.942.1
134101
57.043.0
277249
52.747.3
268219
55.045.0
2.836 p=0.418
Binged less than once a monthBinge once a month or moreAlcohol abstainer
8987281371763
50.941.37.8100
21915926
54.239.46.4
13410127
51.138.510.3
27724948
48.343.48.4
26821936
51.241.96.9
7.043 p=0.317
Total (Weekly, Daily (3/2) orBinge)
Within the all of the limitsOver at least one of the limits
6687041372
48.751.3100
159158
50.249.8
104101
50.749.3
204235
46.553.5
201210
48.951.1
1.490 p=0.685
Within the all of the limits 668 44.3 159 46.4 104 44.8 204 42.0 201 45.0 5.042 p=0.538
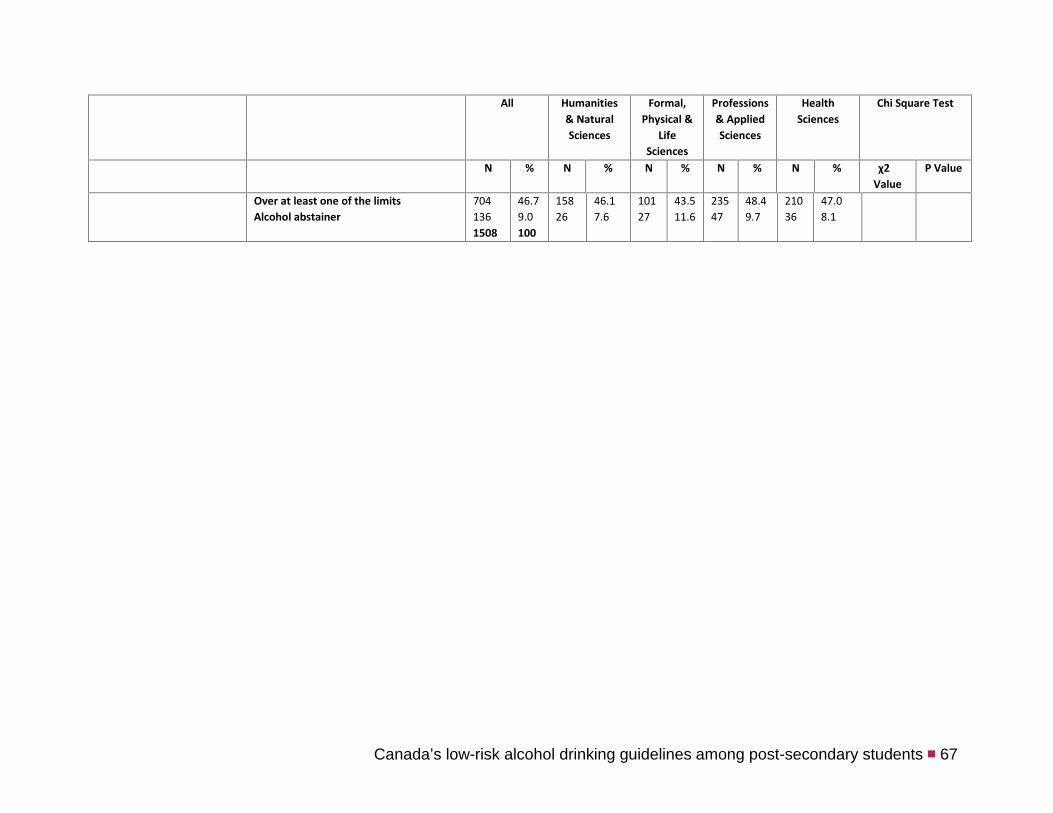
Canada’s low-risk alcohol drinking guidelines among post-secondary students ■ 67
All Humanities& NaturalSciences
Formal,Physical &
LifeSciences
Professions& AppliedSciences
HealthSciences
Chi Square Test
N % N % N % N % N % χ2Value
P Value
Over at least one of the limitsAlcohol abstainer
7041361508
46.79.0100
15826
46.17.6
10127
43.511.6
23547
48.49.7
21036
47.08.1
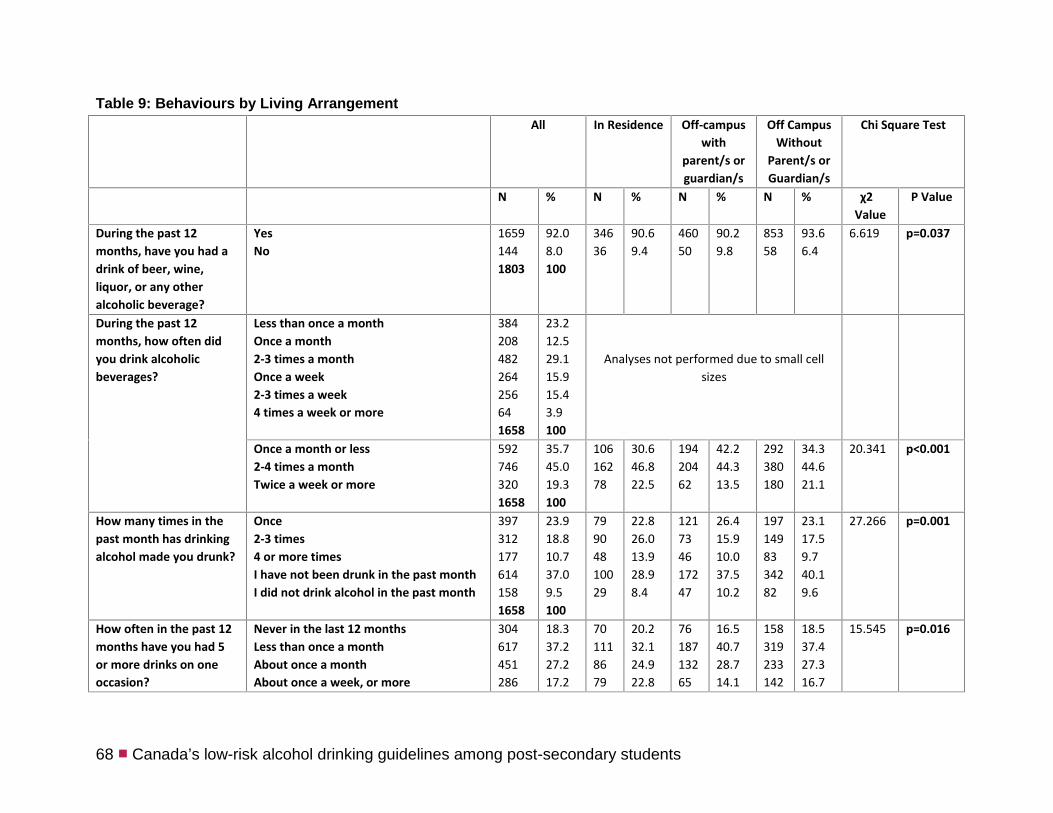
68 ■ Canada’s low-risk alcohol drinking guidelines among post-secondary students
Table 9: Behaviours by Living ArrangementAll In Residence Off-campus
withparent/s orguardian/s
Off CampusWithout
Parent/s orGuardian/s
Chi Square Test
N % N % N % N % χ2Value
P Value
During the past 12months, have you had adrink of beer, wine,liquor, or any otheralcoholic beverage?
YesNo
16591441803
92.08.0100
34636
90.69.4
46050
90.29.8
85358
93.66.4
6.619 p=0.037
During the past 12months, how often didyou drink alcoholicbeverages?
Less than once a monthOnce a month2-3 times a monthOnce a week2-3 times a week4 times a week or more
384208482264256641658
23.212.529.115.915.43.9100
Analyses not performed due to small cellsizes
Once a month or less2-4 times a monthTwice a week or more
5927463201658
35.745.019.3100
10616278
30.646.822.5
19420462
42.244.313.5
292380180
34.344.621.1
20.341 p<0.001
How many times in thepast month has drinkingalcohol made you drunk?
Once2-3 times4 or more timesI have not been drunk in the past monthI did not drink alcohol in the past month
3973121776141581658
23.918.810.737.09.5100
79904810029
22.826.013.928.98.4
121734617247
26.415.910.037.510.2
1971498334282
23.117.59.740.19.6
27.266 p=0.001
How often in the past 12months have you had 5or more drinks on oneoccasion?
Never in the last 12 monthsLess than once a monthAbout once a monthAbout once a week, or more
304617451286
18.337.227.217.2
701118679
20.232.124.922.8
7618713265
16.540.728.714.1
158319233142
18.537.427.316.7
15.545 p=0.016

Canada’s low-risk alcohol drinking guidelines among post-secondary students ■ 69
All In Residence Off-campuswith
parent/s orguardian/s
Off CampusWithout
Parent/s orGuardian/s
Chi Square Test
N % N % N % N % χ2Value
P Value
1658 100How often during the last12 months have youfound that you were notable to stop drinking onceyou had started?
Never in the last 12 monthsLess than once a monthAbout once a monthAbout once a week, or more
131818892511649
79.911.45.63.1100
272361816
79.510.55.34.7
364572015
79.812.54.43.3
682955420
80.111.36.32.3
7.242 p=0.299
How often during the last12 months have you notdone things you weresupposed to because ofdrinking (e.g.: you misseda class)?
Never in the last 12 monthsLess than once a monthAbout once a monthAbout once a week, or more
119233987381656
72.020.55.32.3100
225852610
65.024.67.52.9
350851310
76.418.62.82.2
6171694818
72.419.85.62.1
16.788 p=0.010
How often during the last12 months have you hada feeling of guilt orremorse after drinking?
Never in the last 12 monthsLess than once a monthAbout once a monthAbout once a week, or more
105346696411656
63.528.15.82.5100
2021072314
58.430.96.64.0
3021173011
65.725.46.52.4
5492424316
64.628.55.11.9
10.416 p=0.108
How often in the last 12months have you beenunable to rememberwhat happened the nightbefore because you hadbeen drinking?
Never in the last 12 monthsLess than once a monthAbout once a monthAbout once a week, or more
1067442115321656
64.426.76.91.9100
1971033412
56.929.89.83.5
308118248
67.225.85.21.7
5622215712
66.025.96.71.4
17.096 p=0.009
Have you or someoneelse been injured as aresult of your drinking?
Yes, in the last 12 monthsNoYes, but not in the last 12 months
18212581761616
11.377.810.9100
4924342
14.772.812.6
4834750
10.878.011.2
8566884
10.279.810.0
7.453 p=0.114
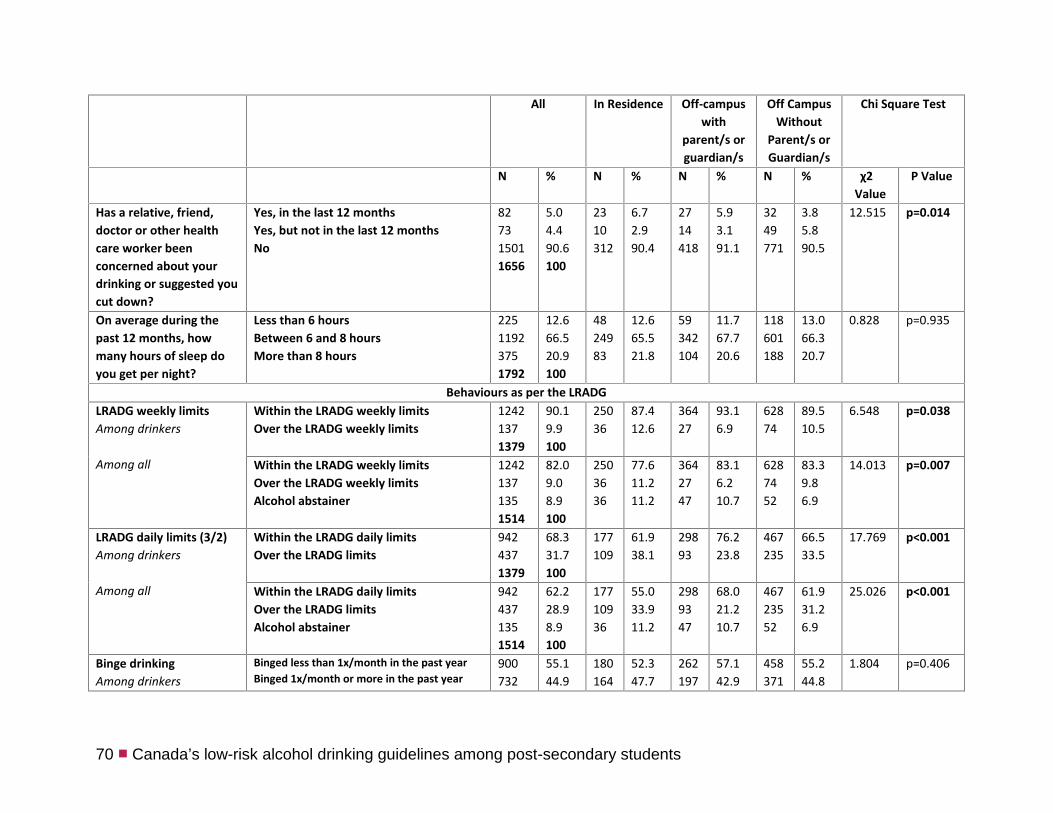
70 ■ Canada’s low-risk alcohol drinking guidelines among post-secondary students
All In Residence Off-campuswith
parent/s orguardian/s
Off CampusWithout
Parent/s orGuardian/s
Chi Square Test
N % N % N % N % χ2Value
P Value
Has a relative, friend,doctor or other healthcare worker beenconcerned about yourdrinking or suggested youcut down?
Yes, in the last 12 monthsYes, but not in the last 12 monthsNo
827315011656
5.04.490.6100
2310312
6.72.990.4
2714418
5.93.191.1
3249771
3.85.890.5
12.515 p=0.014
On average during thepast 12 months, howmany hours of sleep doyou get per night?
Less than 6 hoursBetween 6 and 8 hoursMore than 8 hours
22511923751792
12.666.520.9100
4824983
12.665.521.8
59342104
11.767.720.6
118601188
13.066.320.7
0.828 p=0.935
Behaviours as per the LRADGLRADG weekly limitsAmong drinkers
Among all
Within the LRADG weekly limitsOver the LRADG weekly limits
12421371379
90.19.9100
25036
87.412.6
36427
93.16.9
62874
89.510.5
6.548 p=0.038
Within the LRADG weekly limitsOver the LRADG weekly limitsAlcohol abstainer
12421371351514
82.09.08.9100
2503636
77.611.211.2
3642747
83.16.210.7
6287452
83.39.86.9
14.013 p=0.007
LRADG daily limits (3/2)Among drinkers
Among all
Within the LRADG daily limitsOver the LRADG limits
9424371379
68.331.7100
177109
61.938.1
29893
76.223.8
467235
66.533.5
17.769 p<0.001
Within the LRADG daily limitsOver the LRADG limitsAlcohol abstainer
9424371351514
62.228.98.9100
17710936
55.033.911.2
2989347
68.021.210.7
46723552
61.931.26.9
25.026 p<0.001
Binge drinkingAmong drinkers
Binged less than 1x/month in the past yearBinged 1x/month or more in the past year
900732
55.144.9
180164
52.347.7
262197
57.142.9
458371
55.244.8
1.804 p=0.406
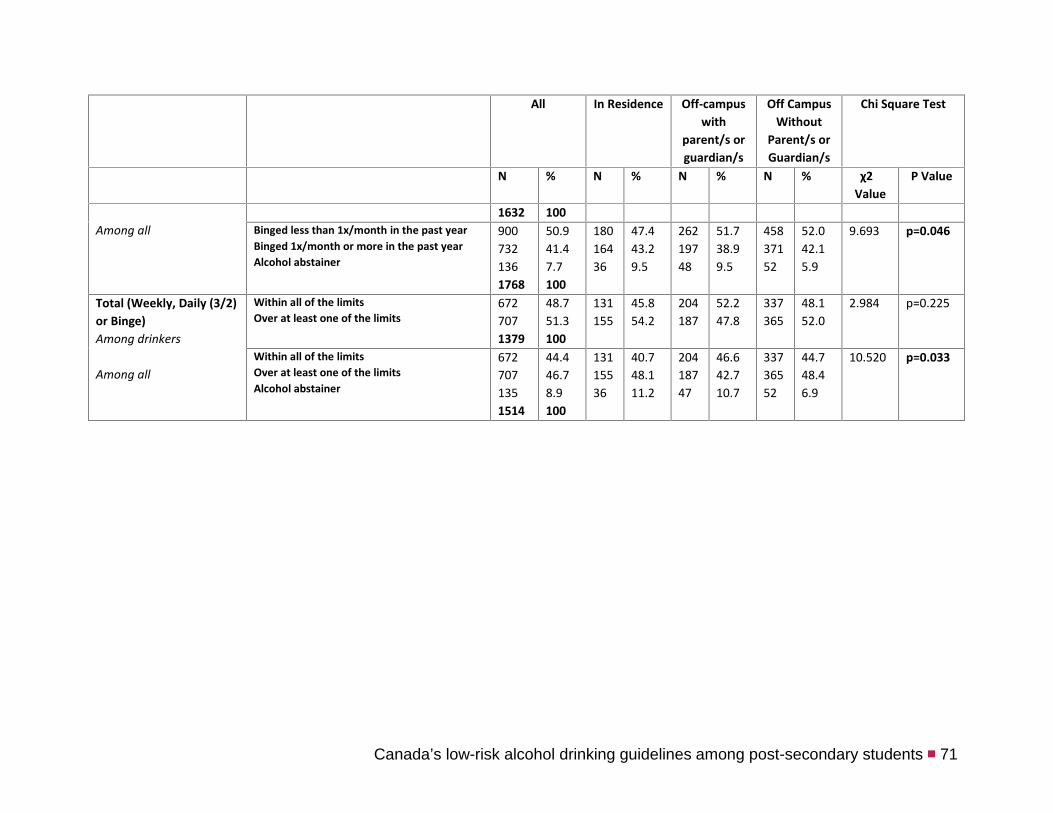
Canada’s low-risk alcohol drinking guidelines among post-secondary students ■ 71
All In Residence Off-campuswith
parent/s orguardian/s
Off CampusWithout
Parent/s orGuardian/s
Chi Square Test
N % N % N % N % χ2Value
P Value
Among all1632 100
Binged less than 1x/month in the past yearBinged 1x/month or more in the past yearAlcohol abstainer
9007321361768
50.941.47.7100
18016436
47.443.29.5
26219748
51.738.99.5
45837152
52.042.15.9
9.693 p=0.046
Total (Weekly, Daily (3/2)or Binge)Among drinkers
Among all
Within all of the limitsOver at least one of the limits
6727071379
48.751.3100
131155
45.854.2
204187
52.247.8
337365
48.152.0
2.984 p=0.225
Within all of the limitsOver at least one of the limitsAlcohol abstainer
6727071351514
44.446.78.9100
13115536
40.748.111.2
20418747
46.642.710.7
33736552
44.748.46.9
10.520 p=0.033

72 ■ Canada’s low-risk alcohol drinking guidelines among post-secondary students
Section 3 – Awareness and knowledge surrounding the LRADGTable 10: Knowledge (Total)Question Answer All
N %Have you seen or heard about Ontario’s ‘Low-Risk Alcohol DrinkingGuidelines”?
YesNoii
27815451823
15.284.8100
Low-risk does not mean no-risk. The LRADG are meant to help peopleavoid the health, safety and social problems associated with alcoholuse. If the Low-Risk Alcohol Drinking Guidelines indicated that you hadto drink less, would you change the amount you drink?
I don’t knowYesNoI don’t drink
4335076682071815
23.927.936.811.4100
In general, what is the maximum number of drinks per DAY you thinkcould be considered low-risk for a person of your sex that is of legaldrinking age?
012345+
15564959821866981784
8.736.433.512.23.75.5100
How could we BEST get information to you about the LRADG? I don’t knowWritten materialUsing the mediaIn personElectronicallyBottle labelling
851605761815672171786
4.89.032.310.131.712.2100
Would it help you to follow the LRADG if bottles of alcohol had a labelexplaining the LRADG and the number of drinks in the bottle? (e.g.: on a
I don’t knowYes
2161181
11.965.0
ii Answers ‘I don’t know’ and ‘No’ have been combined to form variable: ‘No’.
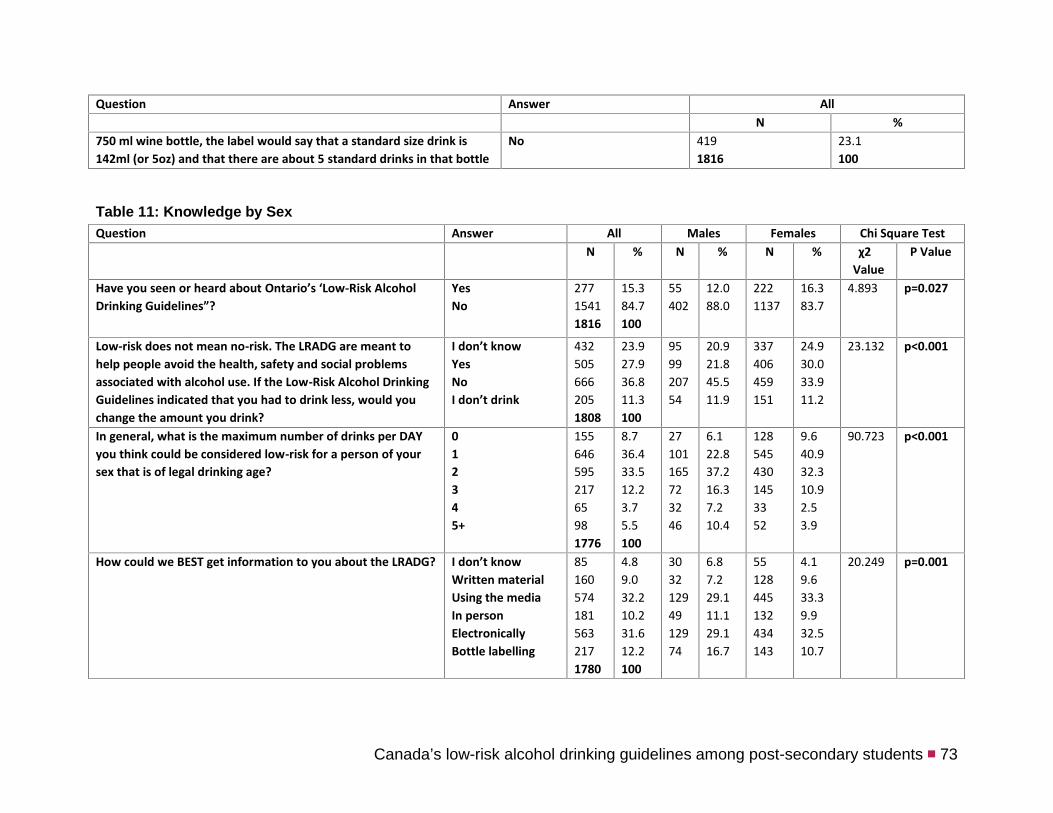
Canada’s low-risk alcohol drinking guidelines among post-secondary students ■ 73
Question Answer AllN %
750 ml wine bottle, the label would say that a standard size drink is142ml (or 5oz) and that there are about 5 standard drinks in that bottle
No 4191816
23.1100
Table 11: Knowledge by SexQuestion Answer All Males Females Chi Square Test
N % N % N % χ2Value
P Value
Have you seen or heard about Ontario’s ‘Low-Risk AlcoholDrinking Guidelines”?
YesNo
27715411816
15.384.7100
55402
12.088.0
2221137
16.383.7
4.893 p=0.027
Low-risk does not mean no-risk. The LRADG are meant tohelp people avoid the health, safety and social problemsassociated with alcohol use. If the Low-Risk Alcohol DrinkingGuidelines indicated that you had to drink less, would youchange the amount you drink?
I don’t knowYesNoI don’t drink
4325056662051808
23.927.936.811.3100
959920754
20.921.845.511.9
337406459151
24.930.033.911.2
23.132 p<0.001
In general, what is the maximum number of drinks per DAYyou think could be considered low-risk for a person of yoursex that is of legal drinking age?
012345+
15564659521765981776
8.736.433.512.23.75.5100
27101165723246
6.122.837.216.37.210.4
1285454301453352
9.640.932.310.92.53.9
90.723 p<0.001
How could we BEST get information to you about the LRADG? I don’t knowWritten materialUsing the mediaIn personElectronicallyBottle labelling
851605741815632171780
4.89.032.210.231.612.2100
30321294912974
6.87.229.111.129.116.7
55128445132434143
4.19.633.39.932.510.7
20.249 p=0.001
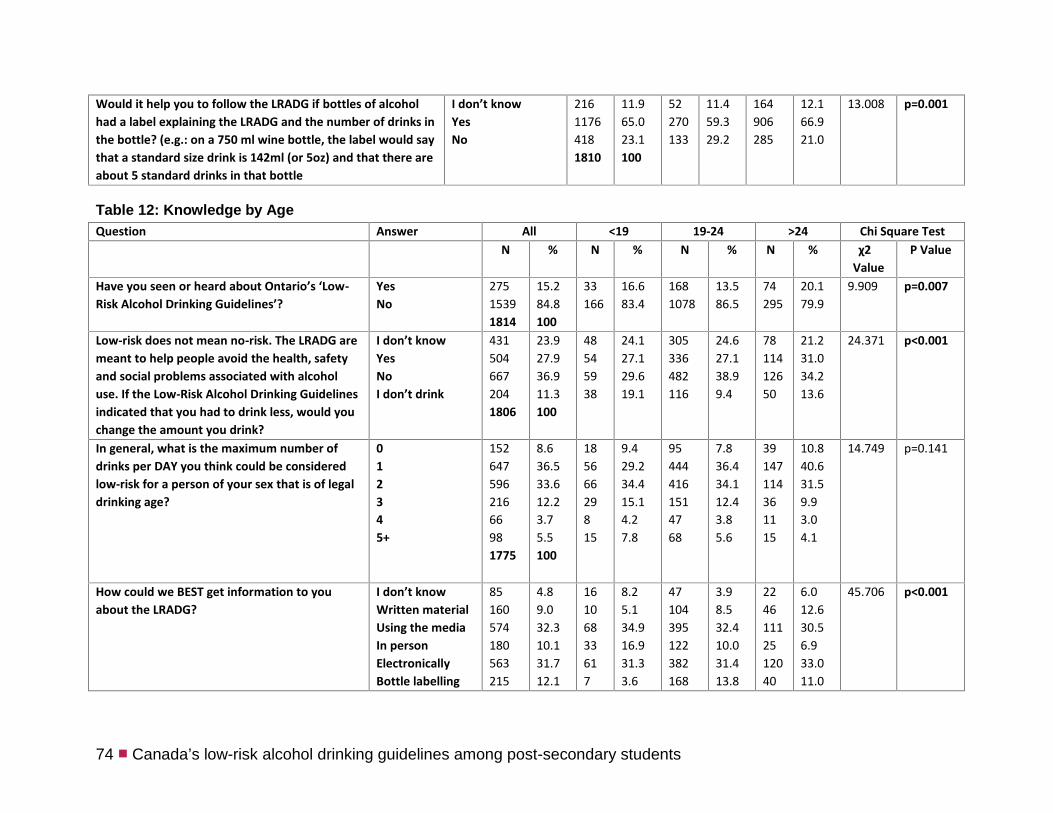
74 ■ Canada’s low-risk alcohol drinking guidelines among post-secondary students
Would it help you to follow the LRADG if bottles of alcoholhad a label explaining the LRADG and the number of drinks inthe bottle? (e.g.: on a 750 ml wine bottle, the label would saythat a standard size drink is 142ml (or 5oz) and that there areabout 5 standard drinks in that bottle
I don’t knowYesNo
21611764181810
11.965.023.1100
52270133
11.459.329.2
164906285
12.166.921.0
13.008 p=0.001
Table 12: Knowledge by AgeQuestion Answer All <19 19-24 >24 Chi Square Test
N % N % N % N % χ2Value
P Value
Have you seen or heard about Ontario’s ‘Low-Risk Alcohol Drinking Guidelines’?
YesNo
27515391814
15.284.8100
33166
16.683.4
1681078
13.586.5
74295
20.179.9
9.909 p=0.007
Low-risk does not mean no-risk. The LRADG aremeant to help people avoid the health, safetyand social problems associated with alcoholuse. If the Low-Risk Alcohol Drinking Guidelinesindicated that you had to drink less, would youchange the amount you drink?
I don’t knowYesNoI don’t drink
4315046672041806
23.927.936.911.3100
48545938
24.127.129.619.1
305336482116
24.627.138.99.4
7811412650
21.231.034.213.6
24.371 p<0.001
In general, what is the maximum number ofdrinks per DAY you think could be consideredlow-risk for a person of your sex that is of legaldrinking age?
012345+
15264759621666981775
8.636.533.612.23.75.5100
18566629815
9.429.234.415.14.27.8
954444161514768
7.836.434.112.43.85.6
39147114361115
10.840.631.59.93.04.1
14.749 p=0.141
How could we BEST get information to youabout the LRADG?
I don’t knowWritten materialUsing the mediaIn personElectronicallyBottle labelling
85160574180563215
4.89.032.310.131.712.1
16106833617
8.25.134.916.931.33.6
47104395122382168
3.98.532.410.031.413.8
22461112512040
6.012.630.56.933.011.0
45.706 p<0.001

Canada’s low-risk alcohol drinking guidelines among post-secondary students ■ 75
Question Answer All <19 19-24 >24 Chi Square TestN % N % N % N % χ2
ValueP Value
1777 100
Would it help you to follow the LRADG if bottlesof alcohol had a label explaining the LRADG andthe number of drinks in the bottle? (e.g.: on a750 ml wine bottle, the label would say that astandard size drink is 142ml (or 5oz) and thatthere are about 5 standard drinks in that bottle
I don’t knowYesNo
21411754181807
11.865.023.1100
3311551
16.657.825.6
134831275
10.867.022.2
4722992
12.862.225.0
9.549 p=0.049
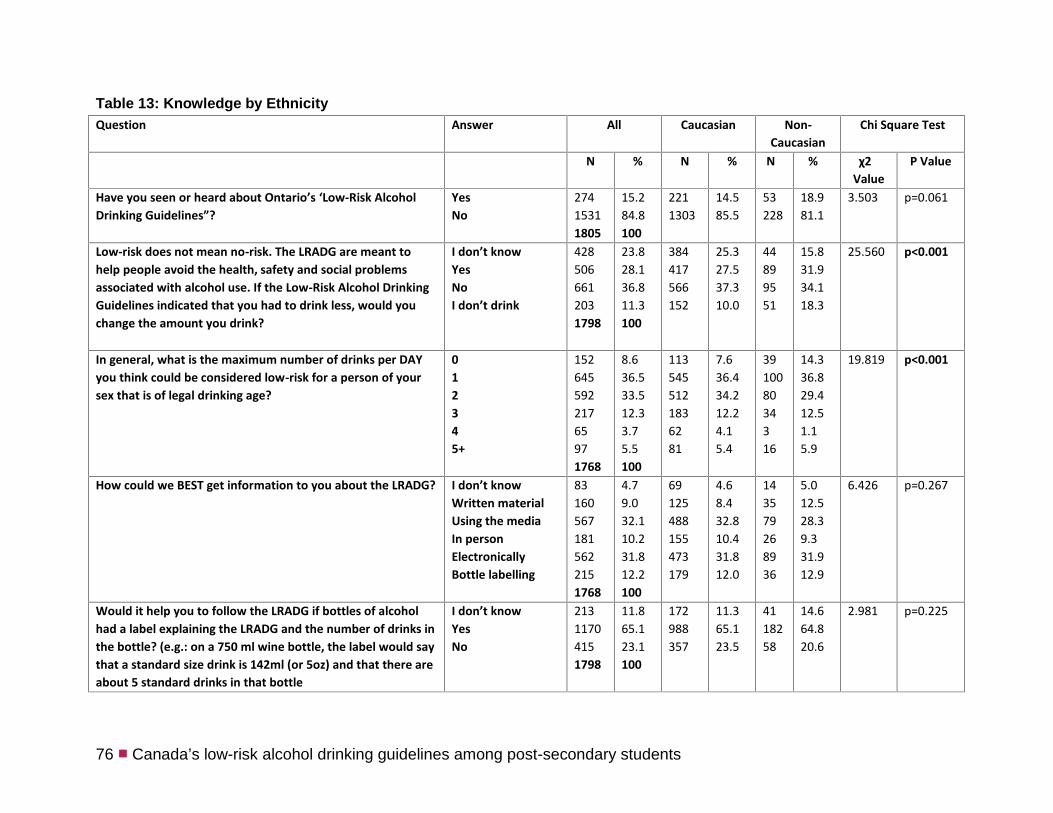
76 ■ Canada’s low-risk alcohol drinking guidelines among post-secondary students
Table 13: Knowledge by EthnicityQuestion Answer All Caucasian Non-
CaucasianChi Square Test
N % N % N % χ2Value
P Value
Have you seen or heard about Ontario’s ‘Low-Risk AlcoholDrinking Guidelines”?
YesNo
27415311805
15.284.8100
2211303
14.585.5
53228
18.981.1
3.503 p=0.061
Low-risk does not mean no-risk. The LRADG are meant tohelp people avoid the health, safety and social problemsassociated with alcohol use. If the Low-Risk Alcohol DrinkingGuidelines indicated that you had to drink less, would youchange the amount you drink?
I don’t knowYesNoI don’t drink
4285066612031798
23.828.136.811.3100
384417566152
25.327.537.310.0
44899551
15.831.934.118.3
25.560 p<0.001
In general, what is the maximum number of drinks per DAYyou think could be considered low-risk for a person of yoursex that is of legal drinking age?
012345+
15264559221765971768
8.636.533.512.33.75.5100
1135455121836281
7.636.434.212.24.15.4
391008034316
14.336.829.412.51.15.9
19.819 p<0.001
How could we BEST get information to you about the LRADG? I don’t knowWritten materialUsing the mediaIn personElectronicallyBottle labelling
831605671815622151768
4.79.032.110.231.812.2100
69125488155473179
4.68.432.810.431.812.0
143579268936
5.012.528.39.331.912.9
6.426 p=0.267
Would it help you to follow the LRADG if bottles of alcoholhad a label explaining the LRADG and the number of drinks inthe bottle? (e.g.: on a 750 ml wine bottle, the label would saythat a standard size drink is 142ml (or 5oz) and that there areabout 5 standard drinks in that bottle
I don’t knowYesNo
21311704151798
11.865.123.1100
172988357
11.365.123.5
4118258
14.664.820.6
2.981 p=0.225
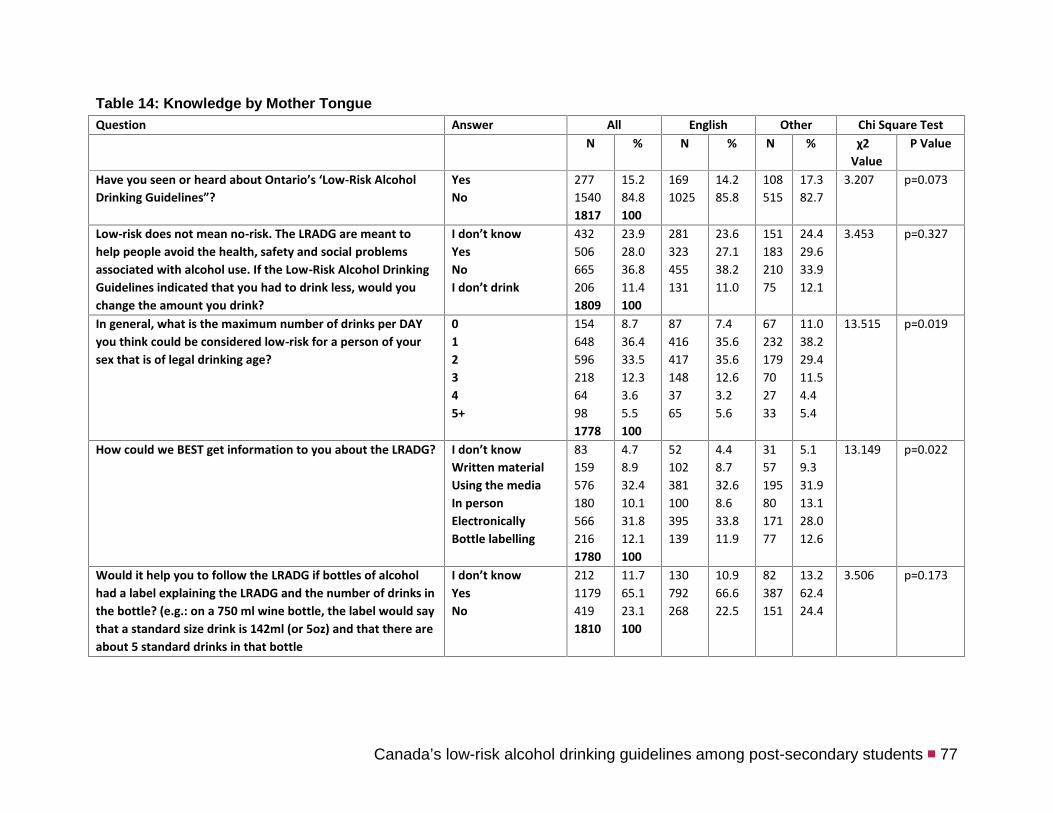
Canada’s low-risk alcohol drinking guidelines among post-secondary students ■ 77
Table 14: Knowledge by Mother TongueQuestion Answer All English Other Chi Square Test
N % N % N % χ2Value
P Value
Have you seen or heard about Ontario’s ‘Low-Risk AlcoholDrinking Guidelines”?
YesNo
27715401817
15.284.8100
1691025
14.285.8
108515
17.382.7
3.207 p=0.073
Low-risk does not mean no-risk. The LRADG are meant tohelp people avoid the health, safety and social problemsassociated with alcohol use. If the Low-Risk Alcohol DrinkingGuidelines indicated that you had to drink less, would youchange the amount you drink?
I don’t knowYesNoI don’t drink
4325066652061809
23.928.036.811.4100
281323455131
23.627.138.211.0
15118321075
24.429.633.912.1
3.453 p=0.327
In general, what is the maximum number of drinks per DAYyou think could be considered low-risk for a person of yoursex that is of legal drinking age?
012345+
15464859621864981778
8.736.433.512.33.65.5100
874164171483765
7.435.635.612.63.25.6
67232179702733
11.038.229.411.54.45.4
13.515 p=0.019
How could we BEST get information to you about the LRADG? I don’t knowWritten materialUsing the mediaIn personElectronicallyBottle labelling
831595761805662161780
4.78.932.410.131.812.1100
52102381100395139
4.48.732.68.633.811.9
31571958017177
5.19.331.913.128.012.6
13.149 p=0.022
Would it help you to follow the LRADG if bottles of alcoholhad a label explaining the LRADG and the number of drinks inthe bottle? (e.g.: on a 750 ml wine bottle, the label would saythat a standard size drink is 142ml (or 5oz) and that there areabout 5 standard drinks in that bottle
I don’t knowYesNo
21211794191810
11.765.123.1100
130792268
10.966.622.5
82387151
13.262.424.4
3.506 p=0.173
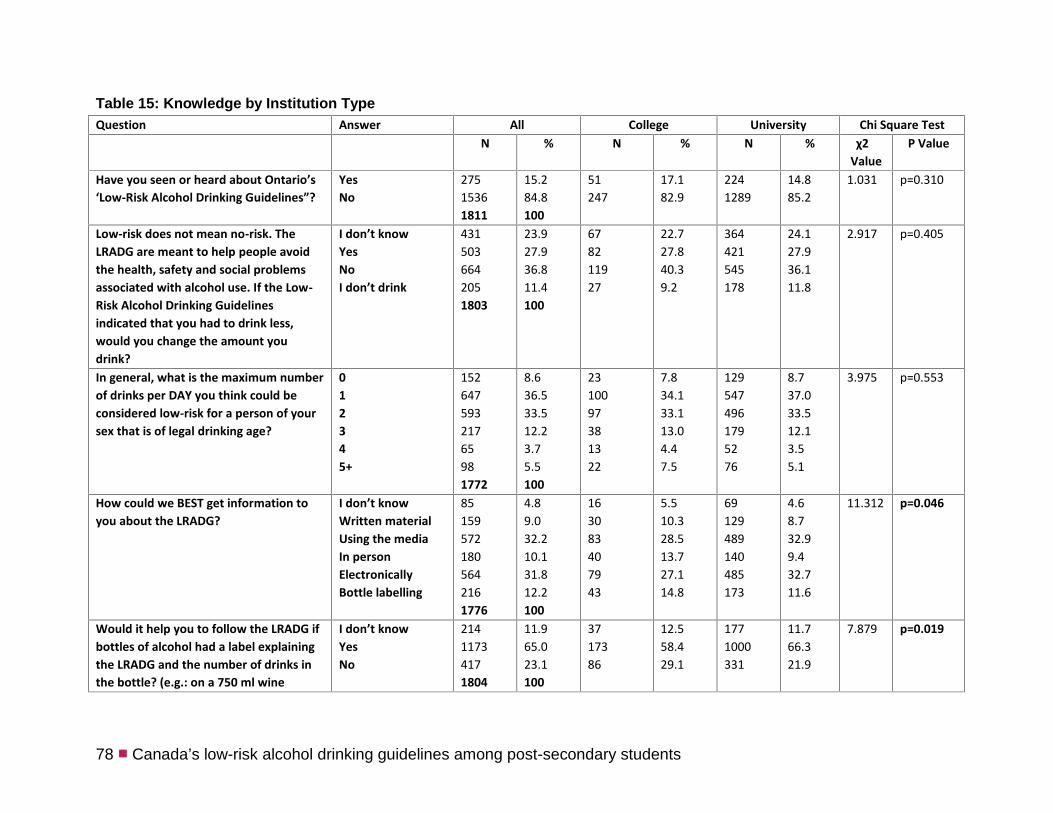
78 ■ Canada’s low-risk alcohol drinking guidelines among post-secondary students
Table 15: Knowledge by Institution TypeQuestion Answer All College University Chi Square Test
N % N % N % χ2Value
P Value
Have you seen or heard about Ontario’s‘Low-Risk Alcohol Drinking Guidelines”?
YesNo
27515361811
15.284.8100
51247
17.182.9
2241289
14.885.2
1.031 p=0.310
Low-risk does not mean no-risk. TheLRADG are meant to help people avoidthe health, safety and social problemsassociated with alcohol use. If the Low-Risk Alcohol Drinking Guidelinesindicated that you had to drink less,would you change the amount youdrink?
I don’t knowYesNoI don’t drink
4315036642051803
23.927.936.811.4100
678211927
22.727.840.39.2
364421545178
24.127.936.111.8
2.917 p=0.405
In general, what is the maximum numberof drinks per DAY you think could beconsidered low-risk for a person of yoursex that is of legal drinking age?
012345+
15264759321765981772
8.636.533.512.23.75.5100
2310097381322
7.834.133.113.04.47.5
1295474961795276
8.737.033.512.13.55.1
3.975 p=0.553
How could we BEST get information toyou about the LRADG?
I don’t knowWritten materialUsing the mediaIn personElectronicallyBottle labelling
851595721805642161776
4.89.032.210.131.812.2100
163083407943
5.510.328.513.727.114.8
69129489140485173
4.68.732.99.432.711.6
11.312 p=0.046
Would it help you to follow the LRADG ifbottles of alcohol had a label explainingthe LRADG and the number of drinks inthe bottle? (e.g.: on a 750 ml wine
I don’t knowYesNo
21411734171804
11.965.023.1100
3717386
12.558.429.1
1771000331
11.766.321.9
7.879 p=0.019
Canada’s low-risk alcohol drinking guidelines among post-secondary students ■ 79
Question Answer All College University Chi Square TestN % N % N % χ2
ValueP Value
bottle, the label would say that astandard size drink is 142ml (or 5oz) andthat there are about 5 standard drinks inthat bottle

80 ■ Canada’s low-risk alcohol drinking guidelines among post-secondary students
Table 16: Knowledge by Academic DisciplineQuestion Answer All Humanities
& NaturalSciences
Formal,Physical &
LifeSciences
Professions& Applied
Science
HealthSciences
Chi Square Test
N % N % N % N % N % χ2Value
P Value
Have you seen or heard aboutOntario’s ‘Low-Risk AlcoholDrinking Guidelines”?
YesNo
27215251797
15.184.9
69344
16.783.3
30236
11.388.7
76509
13.087.0
97436
18.281.8
9.863 p=0.020
Low-risk does not mean no-risk.The LRADG are meant to helppeople avoid the health, safetyand social problems associatedwith alcohol use. If the Low-RiskAlcohol Drinking Guidelinesindicated that you had to drinkless, would you change theamount you drink?
I don’t knowYesNoI don’t drink
4285016562051790
23.928.036.611.5100
10312014840
25.129.236.09.7
59659941
22.324.637.515.5
12217721667
21.030.437.111.5
14413919357
27.026.136.210.7
13.289 p=0.150
In general, what is the maximumnumber of drinks per DAY youthink could be considered low-riskfor a person of your sex that is oflegal drinking age?
012345+
15564259021364951759
8.836.533.512.13.65.4100
34137144521522
8.433.935.612.93.75.4
31968127918
11.836.630.910.33.46.9
51201180782337
8.935.331.613.74.06.5
39208185561718
7.539.835.410.73.33.4
18.082 p=0.258
How could we BEST getinformation to you about theLRADG?
I don’t knowWritten materialUsing the mediaIn personElectronicallyBottle labelling
81157570179559214
4.68.932.410.231.812.2
19271364013844
4.76.633.39.833.811.8
112579288329
4.39.831.011.032.511.4
29591655319173
5.110.428.99.333.512.8
22461905814764
4.28.736.111.027.912.1
14.077 p=0.520
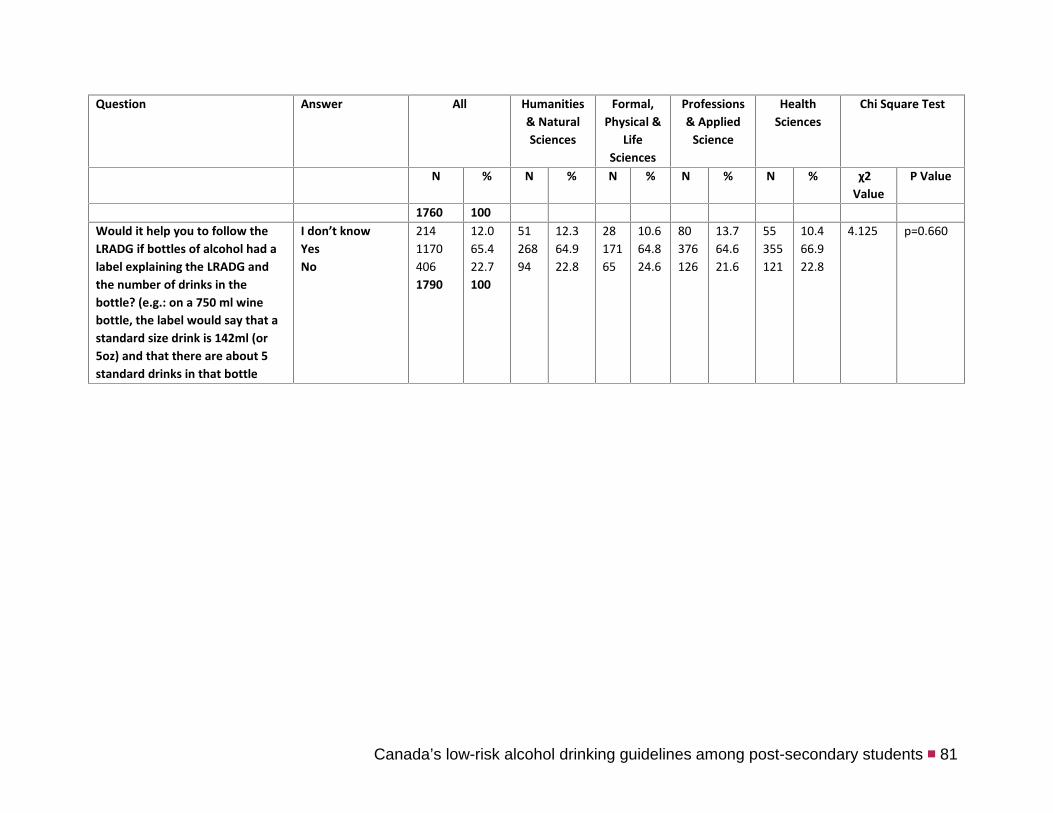
Canada’s low-risk alcohol drinking guidelines among post-secondary students ■ 81
Question Answer All Humanities& NaturalSciences
Formal,Physical &
LifeSciences
Professions& Applied
Science
HealthSciences
Chi Square Test
N % N % N % N % N % χ2Value
P Value
1760 100Would it help you to follow theLRADG if bottles of alcohol had alabel explaining the LRADG andthe number of drinks in thebottle? (e.g.: on a 750 ml winebottle, the label would say that astandard size drink is 142ml (or5oz) and that there are about 5standard drinks in that bottle
I don’t knowYesNo
21411704061790
12.065.422.7100
5126894
12.364.922.8
2817165
10.664.824.6
80376126
13.764.621.6
55355121
10.466.922.8
4.125 p=0.660
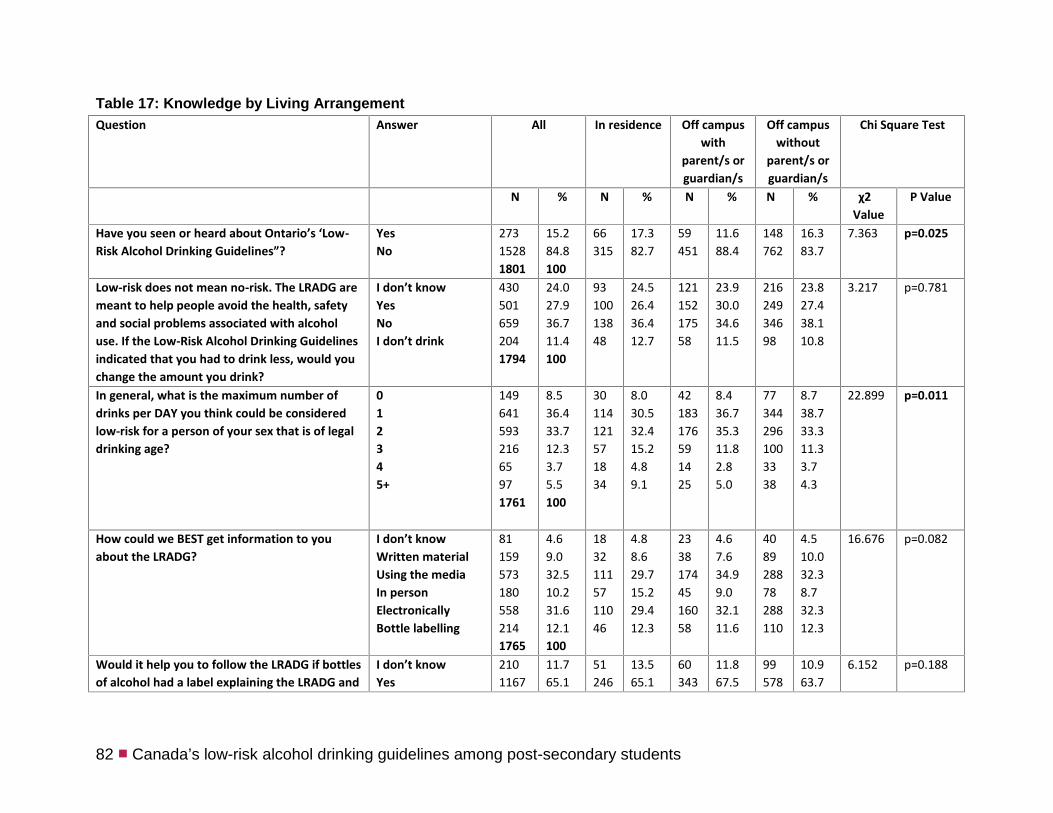
82 ■ Canada’s low-risk alcohol drinking guidelines among post-secondary students
Table 17: Knowledge by Living ArrangementQuestion Answer All In residence Off campus
withparent/s orguardian/s
Off campuswithout
parent/s orguardian/s
Chi Square Test
N % N % N % N % χ2Value
P Value
Have you seen or heard about Ontario’s ‘Low-Risk Alcohol Drinking Guidelines”?
YesNo
27315281801
15.284.8100
66315
17.382.7
59451
11.688.4
148762
16.383.7
7.363 p=0.025
Low-risk does not mean no-risk. The LRADG aremeant to help people avoid the health, safetyand social problems associated with alcoholuse. If the Low-Risk Alcohol Drinking Guidelinesindicated that you had to drink less, would youchange the amount you drink?
I don’t knowYesNoI don’t drink
4305016592041794
24.027.936.711.4100
9310013848
24.526.436.412.7
12115217558
23.930.034.611.5
21624934698
23.827.438.110.8
3.217 p=0.781
In general, what is the maximum number ofdrinks per DAY you think could be consideredlow-risk for a person of your sex that is of legaldrinking age?
012345+
14964159321665971761
8.536.433.712.33.75.5100
30114121571834
8.030.532.415.24.89.1
42183176591425
8.436.735.311.82.85.0
773442961003338
8.738.733.311.33.74.3
22.899 p=0.011
How could we BEST get information to youabout the LRADG?
I don’t knowWritten materialUsing the mediaIn personElectronicallyBottle labelling
811595731805582141765
4.69.032.510.231.612.1100
18321115711046
4.88.629.715.229.412.3
23381744516058
4.67.634.99.032.111.6
408928878288110
4.510.032.38.732.312.3
16.676 p=0.082
Would it help you to follow the LRADG if bottlesof alcohol had a label explaining the LRADG and
I don’t knowYes
2101167
11.765.1
51246
13.565.1
60343
11.867.5
99578
10.963.7
6.152 p=0.188

Canada’s low-risk alcohol drinking guidelines among post-secondary students ■ 83
Question Answer All In residence Off campuswith
parent/s orguardian/s
Off campuswithout
parent/s orguardian/s
Chi Square Test
N % N % N % N % χ2Value
P Value
the number of drinks in the bottle? (e.g.: on a750 ml wine bottle, the label would say that astandard size drink is 142ml (or 5oz) and thatthere are about 5 standard drinks in that bottle
No 4171794
23.2100
81 21.4 105 20.7 231 25.4
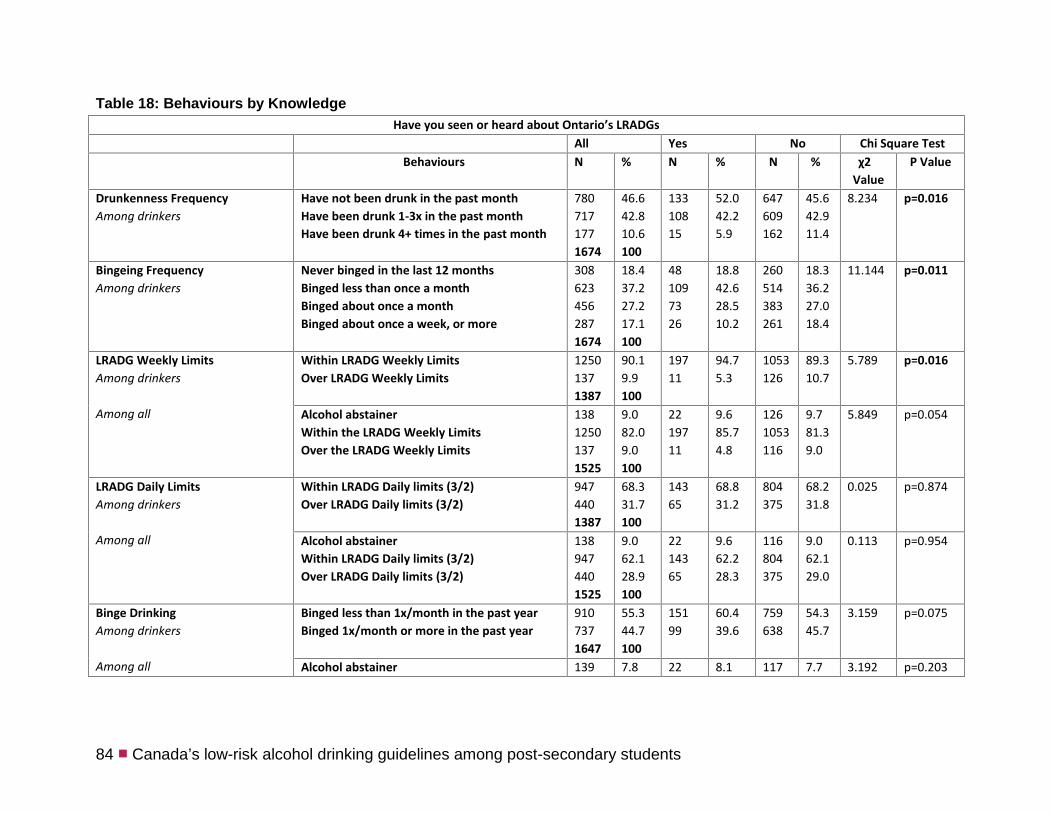
84 ■ Canada’s low-risk alcohol drinking guidelines among post-secondary students
Table 18: Behaviours by KnowledgeHave you seen or heard about Ontario’s LRADGs
All Yes No Chi Square TestBehaviours N % N % N % χ2
ValueP Value
Drunkenness FrequencyAmong drinkers
Have not been drunk in the past monthHave been drunk 1-3x in the past monthHave been drunk 4+ times in the past month
7807171771674
46.642.810.6100
13310815
52.042.25.9
647609162
45.642.911.4
8.234 p=0.016
Bingeing FrequencyAmong drinkers
Never binged in the last 12 monthsBinged less than once a monthBinged about once a monthBinged about once a week, or more
3086234562871674
18.437.227.217.1100
481097326
18.842.628.510.2
260514383261
18.336.227.018.4
11.144 p=0.011
LRADG Weekly LimitsAmong drinkers
Among all
Within LRADG Weekly LimitsOver LRADG Weekly Limits
12501371387
90.19.9100
19711
94.75.3
1053126
89.310.7
5.789 p=0.016
Alcohol abstainerWithin the LRADG Weekly LimitsOver the LRADG Weekly Limits
13812501371525
9.082.09.0100
2219711
9.685.74.8
1261053116
9.781.39.0
5.849 p=0.054
LRADG Daily LimitsAmong drinkers
Among all
Within LRADG Daily limits (3/2)Over LRADG Daily limits (3/2)
9474401387
68.331.7100
14365
68.831.2
804375
68.231.8
0.025 p=0.874
Alcohol abstainerWithin LRADG Daily limits (3/2)Over LRADG Daily limits (3/2)
1389474401525
9.062.128.9100
2214365
9.662.228.3
116804375
9.062.129.0
0.113 p=0.954
Binge DrinkingAmong drinkers
Among all
Binged less than 1x/month in the past yearBinged 1x/month or more in the past year
9107371647
55.344.7100
15199
60.439.6
759638
54.345.7
3.159 p=0.075
Alcohol abstainer 139 7.8 22 8.1 117 7.7 3.192 p=0.203
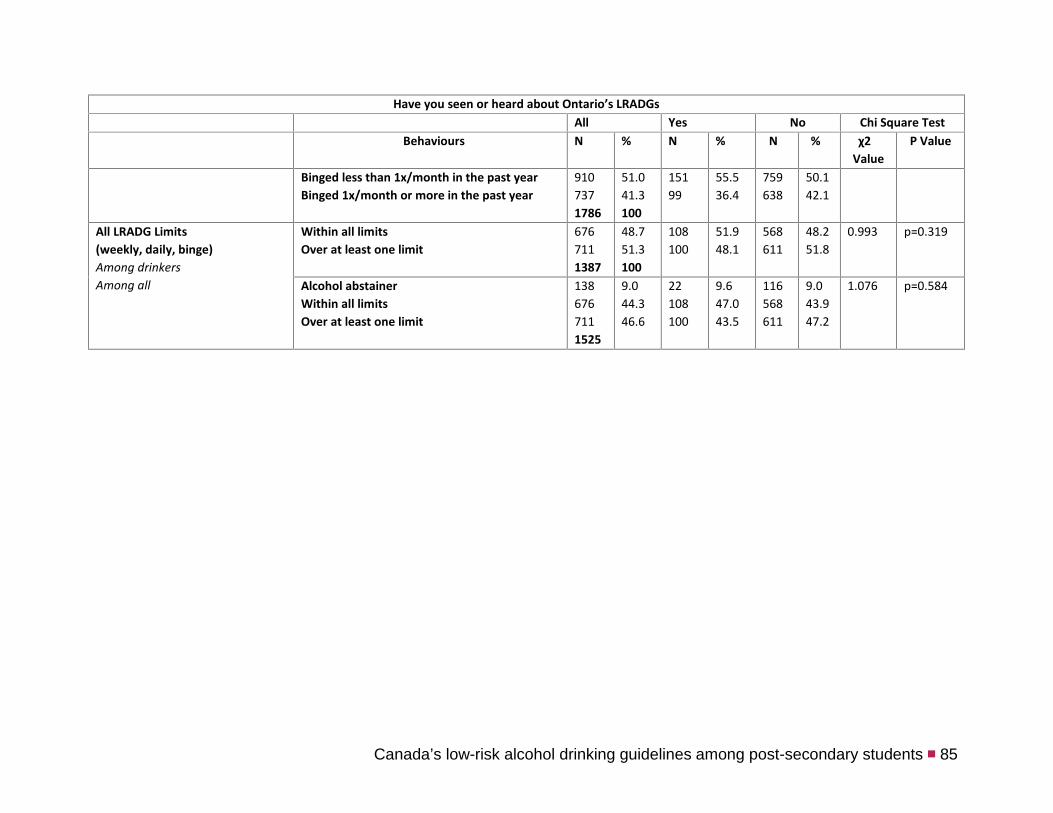
Canada’s low-risk alcohol drinking guidelines among post-secondary students ■ 85
Have you seen or heard about Ontario’s LRADGsAll Yes No Chi Square Test
Behaviours N % N % N % χ2Value
P Value
Binged less than 1x/month in the past yearBinged 1x/month or more in the past year
9107371786
51.041.3100
15199
55.536.4
759638
50.142.1
All LRADG Limits(weekly, daily, binge)Among drinkersAmong all
Within all limitsOver at least one limit
6767111387
48.751.3100
108100
51.948.1
568611
48.251.8
0.993 p=0.319
Alcohol abstainerWithin all limitsOver at least one limit
1386767111525
9.044.346.6
22108100
9.647.043.5
116568611
9.043.947.2
1.076 p=0.584

86 ■ Canada’s low-risk alcohol drinking guidelines among post-secondary students
Section 4 - BeliefsTable 19: Beliefs (Total)
All CCSjj
Questions Answers N % %kk
Students at my institution admire drinkers DisagreeNeutralAgree
3065117661583
19.332.348.4100
46468100
It’s important to show how much you can drink and stillhold your liquor (i.e. to be able to drink considerableamounts of alcohol with little signs or symptoms ofintoxication
DisagreeNeutralAgree
9713334361740
55.819.125.1100
592417100
You can’t make it socially without drinking DisagreeNeutralAgree
12882302881806
71.312.715.9100
691516100
Drinking is an important part of university/collegeexperience
DisagreeNeutralAgree
6674446881799
37.124.738.2100
442234100
Rules about drinking are almost never enforced on campus DisagreeNeutralAgree
5052884561249
40.423.136.5100
29521899
Alcohol is easily available on campus DisagreeNeutralAgree
346284718
25.721.153.3
192457
jj Adlaf, E; Demers, A; Gliksman (2005)7
kk CCS percentages have been rounded to the nearest unit, and totals may not add up to exactly 100
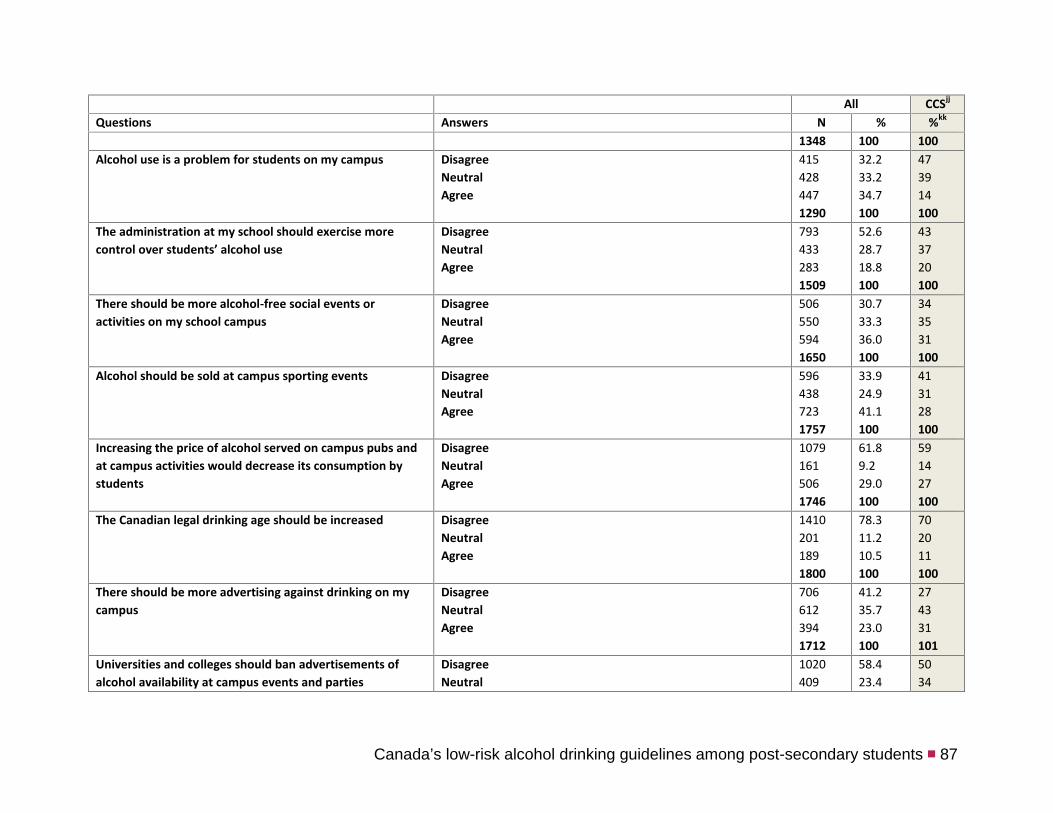
Canada’s low-risk alcohol drinking guidelines among post-secondary students ■ 87
All CCSjj
Questions Answers N % %kk
1348 100 100Alcohol use is a problem for students on my campus Disagree
NeutralAgree
4154284471290
32.233.234.7100
473914100
The administration at my school should exercise morecontrol over students’ alcohol use
DisagreeNeutralAgree
7934332831509
52.628.718.8100
433720100
There should be more alcohol-free social events oractivities on my school campus
DisagreeNeutralAgree
5065505941650
30.733.336.0100
343531100
Alcohol should be sold at campus sporting events DisagreeNeutralAgree
5964387231757
33.924.941.1100
413128100
Increasing the price of alcohol served on campus pubs andat campus activities would decrease its consumption bystudents
DisagreeNeutralAgree
10791615061746
61.89.229.0100
591427100
The Canadian legal drinking age should be increased DisagreeNeutralAgree
14102011891800
78.311.210.5100
702011100
There should be more advertising against drinking on mycampus
DisagreeNeutralAgree
7066123941712
41.235.723.0100
274331101
Universities and colleges should ban advertisements ofalcohol availability at campus events and parties
DisagreeNeutral
1020409
58.423.4
5034

88 ■ Canada’s low-risk alcohol drinking guidelines among post-secondary students
All CCSjj
Questions Answers N % %kk
Agree 3171746
18.2100
16100
There should be more alcohol education programs on mycampus
DisagreeNeutralAgree
2386478001685
14.138.447.5100
125137100

Canada’s low-risk alcohol drinking guidelines among post-secondary students ■ 89
Table 20: Beliefs by SexAll Males Females Chi Square Test
Questions Answers N % N % N % χ2Value
P Value
Students at my institution admire drinkers DisagreeNeutralAgree
3055097641578
19.332.348.4100
69143194
17.035.247.8
236366570
20.131.248.6
3.075 p=0.215
It’s important to show how much you can drink and still holdyour liquor (i.e. to be able to drink considerable amounts ofalcohol with little signs or symptoms of intoxication
DisagreeNeutralAgree
9683324331733
55.919.225.0100
22395123
50.621.527.9
745237310
57.718.324.0
6.718 p=0.035
You can’t make it socially without drinking DisagreeNeutralAgree
12832302861799
71.312.815.9100
2967980
65.117.417.6
987151206
73.411.215.3
14.419 p=0.001
Drinking is an important part of university/college experience DisagreeNeutralAgree
6624436871792
36.924.738.3100
15897196
35.021.543.5
504346491
37.625.836.6
7.236 p=0.027
Rules about drinking are almost never enforced on campus DisagreeNeutralAgree
5042864551245
40.523.036.5100
14272119
42.621.635.7
362214336
39.723.536.8
0.967 p=0.078
Alcohol is easily available on campus DisagreeNeutralAgree
3452847151344
25.721.153.2100
8182205
22.022.355.7
264202510
27.020.752.3
3.560 p=0.169
Alcohol use is a problem for students on my campus DisagreeNeutralAgree
4154274431285
32.333.234.5100
133103102
39.330.530.2
282324341
29.834.236.0
10.570 p=0.005
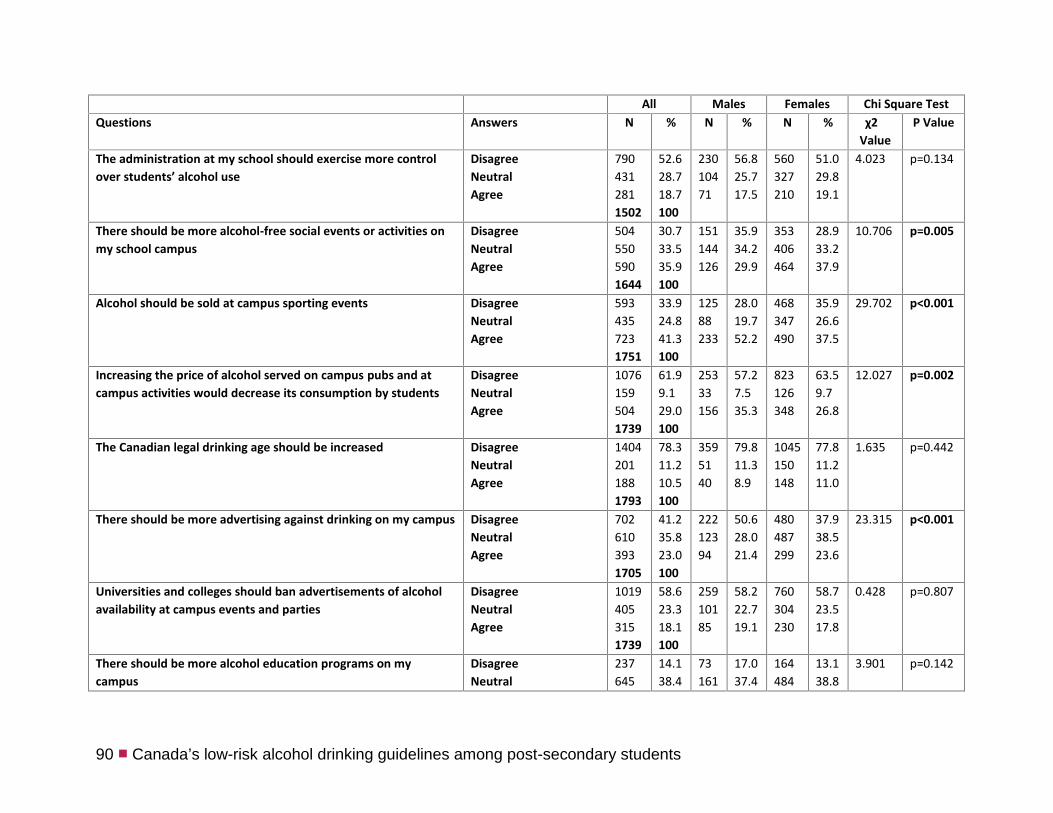
90 ■ Canada’s low-risk alcohol drinking guidelines among post-secondary students
All Males Females Chi Square TestQuestions Answers N % N % N % χ2
ValueP Value
The administration at my school should exercise more controlover students’ alcohol use
DisagreeNeutralAgree
7904312811502
52.628.718.7100
23010471
56.825.717.5
560327210
51.029.819.1
4.023 p=0.134
There should be more alcohol-free social events or activities onmy school campus
DisagreeNeutralAgree
5045505901644
30.733.535.9100
151144126
35.934.229.9
353406464
28.933.237.9
10.706 p=0.005
Alcohol should be sold at campus sporting events DisagreeNeutralAgree
5934357231751
33.924.841.3100
12588233
28.019.752.2
468347490
35.926.637.5
29.702 p<0.001
Increasing the price of alcohol served on campus pubs and atcampus activities would decrease its consumption by students
DisagreeNeutralAgree
10761595041739
61.99.129.0100
25333156
57.27.535.3
823126348
63.59.726.8
12.027 p=0.002
The Canadian legal drinking age should be increased DisagreeNeutralAgree
14042011881793
78.311.210.5100
3595140
79.811.38.9
1045150148
77.811.211.0
1.635 p=0.442
There should be more advertising against drinking on my campus DisagreeNeutralAgree
7026103931705
41.235.823.0100
22212394
50.628.021.4
480487299
37.938.523.6
23.315 p<0.001
Universities and colleges should ban advertisements of alcoholavailability at campus events and parties
DisagreeNeutralAgree
10194053151739
58.623.318.1100
25910185
58.222.719.1
760304230
58.723.517.8
0.428 p=0.807
There should be more alcohol education programs on mycampus
DisagreeNeutral
237645
14.138.4
73161
17.037.4
164484
13.138.8
3.901 p=0.142
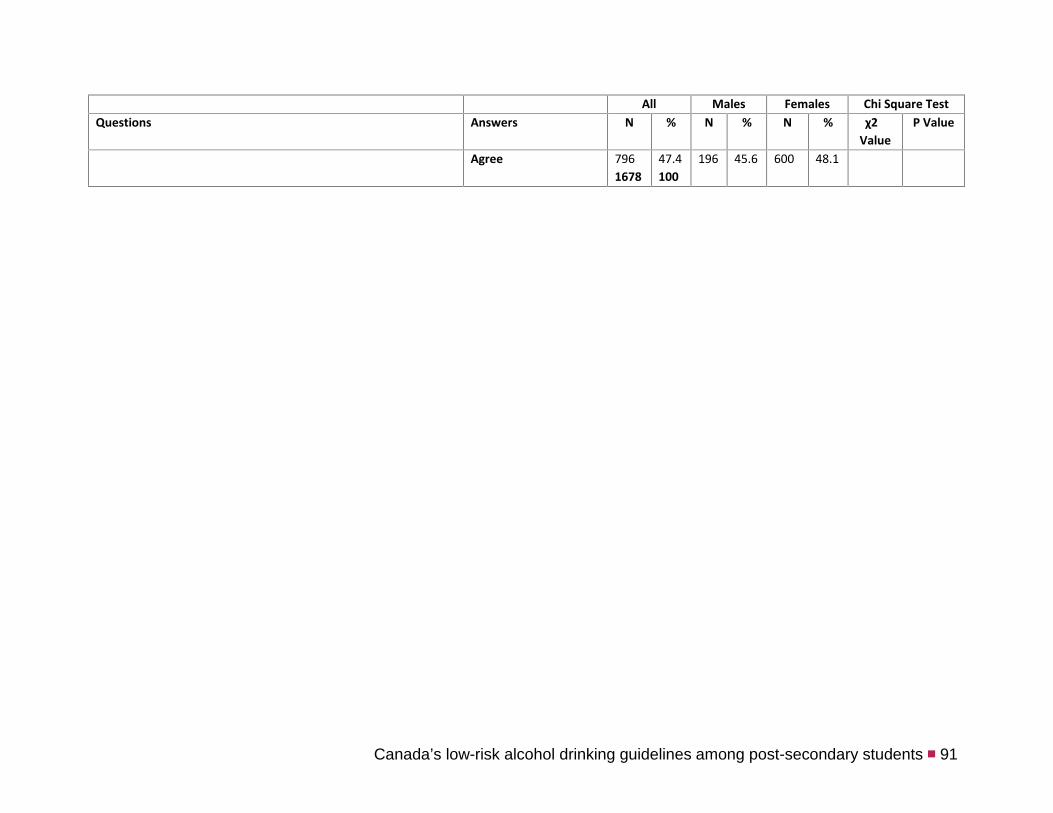
Canada’s low-risk alcohol drinking guidelines among post-secondary students ■ 91
All Males Females Chi Square TestQuestions Answers N % N % N % χ2
ValueP Value
Agree 7961678
47.4100
196 45.6 600 48.1

92 ■ Canada’s low-risk alcohol drinking guidelines among post-secondary students
Table 21: Beliefs by AgeAll <19 19-24 >24 Chi Square Test
Questions Answers N % N % N % N % χ2Value
P Value
Students at my institution admire drinkers DisagreeNeutralAgree
3055087641577
19.332.248.4100
356582
19.235.745.1
195357579
17.231.651.2
7586103
28.432.639.0
21.696 p<0.001
It’s important to show how much you can drink and stillhold your liquor (i.e. to be able to drink considerableamounts of alcohol with little signs or symptoms ofintoxication
DisagreeNeutralAgree
9653314361732
55.719.125.2100
925050
47.926.026.0
641231331
53.319.227.5
2325055
68.814.816.3
35.018 p<0.001
You can’t make it socially without drinking DisagreeNeutralAgree
12802302881798
71.212.816.0100
1482032
74.010.016.0
853170211
69.113.817.1
2794045
76.611.012.4
9.499 p=0.050
Drinking is an important part of university/collegeexperience
DisagreeNeutralAgree
6624406881790
37.024.638.4100
783883
39.219.141.7
420321495
34.026.040.0
16481110
46.222.831.0
21.800 p<0.001
Rules about drinking are almost never enforced on campus DisagreeNeutralAgree
5032844561243
40.522.836.7100
743952
44.823.631.5
368192328
41.421.636.9
615376
32.127.940.0
8.808 p=0.066
Alcohol is easily available on campus DisagreeNeutralAgree
3432807181341
25.620.953.5100
454175
28.025.546.6
260184519
27.019.153.9
3855124
17.525.357.1
13.782 p=0.008
Alcohol use is a problem for students on my campus DisagreeNeutralAgree
4134254461284
32.233.134.7100
615653
35.932.931.2
300303332
32.132.435.5
526661
29.136.934.1
2.981 p=0.561
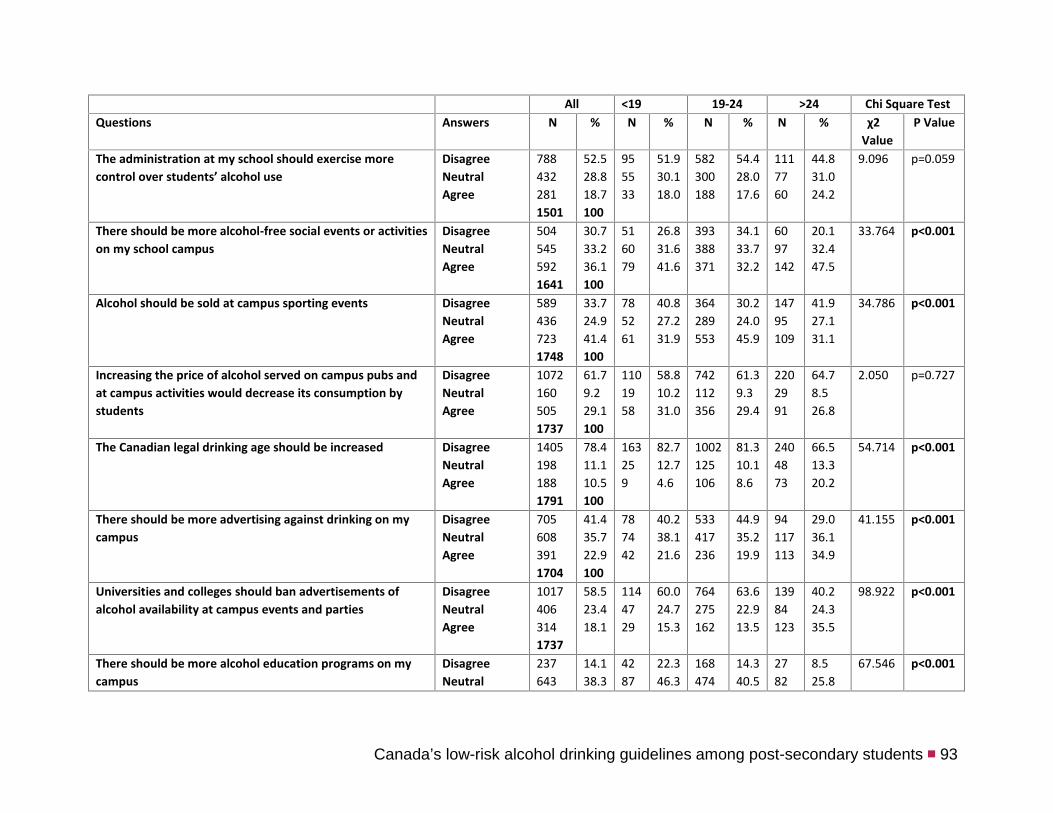
Canada’s low-risk alcohol drinking guidelines among post-secondary students ■ 93
All <19 19-24 >24 Chi Square TestQuestions Answers N % N % N % N % χ2
ValueP Value
The administration at my school should exercise morecontrol over students’ alcohol use
DisagreeNeutralAgree
7884322811501
52.528.818.7100
955533
51.930.118.0
582300188
54.428.017.6
1117760
44.831.024.2
9.096 p=0.059
There should be more alcohol-free social events or activitieson my school campus
DisagreeNeutralAgree
5045455921641
30.733.236.1100
516079
26.831.641.6
393388371
34.133.732.2
6097142
20.132.447.5
33.764 p<0.001
Alcohol should be sold at campus sporting events DisagreeNeutralAgree
5894367231748
33.724.941.4100
785261
40.827.231.9
364289553
30.224.045.9
14795109
41.927.131.1
34.786 p<0.001
Increasing the price of alcohol served on campus pubs andat campus activities would decrease its consumption bystudents
DisagreeNeutralAgree
10721605051737
61.79.229.1100
1101958
58.810.231.0
742112356
61.39.329.4
2202991
64.78.526.8
2.050 p=0.727
The Canadian legal drinking age should be increased DisagreeNeutralAgree
14051981881791
78.411.110.5100
163259
82.712.74.6
1002125106
81.310.18.6
2404873
66.513.320.2
54.714 p<0.001
There should be more advertising against drinking on mycampus
DisagreeNeutralAgree
7056083911704
41.435.722.9100
787442
40.238.121.6
533417236
44.935.219.9
94117113
29.036.134.9
41.155 p<0.001
Universities and colleges should ban advertisements ofalcohol availability at campus events and parties
DisagreeNeutralAgree
10174063141737
58.523.418.1
1144729
60.024.715.3
764275162
63.622.913.5
13984123
40.224.335.5
98.922 p<0.001
There should be more alcohol education programs on mycampus
DisagreeNeutral
237643
14.138.3
4287
22.346.3
168474
14.340.5
2782
8.525.8
67.546 p<0.001
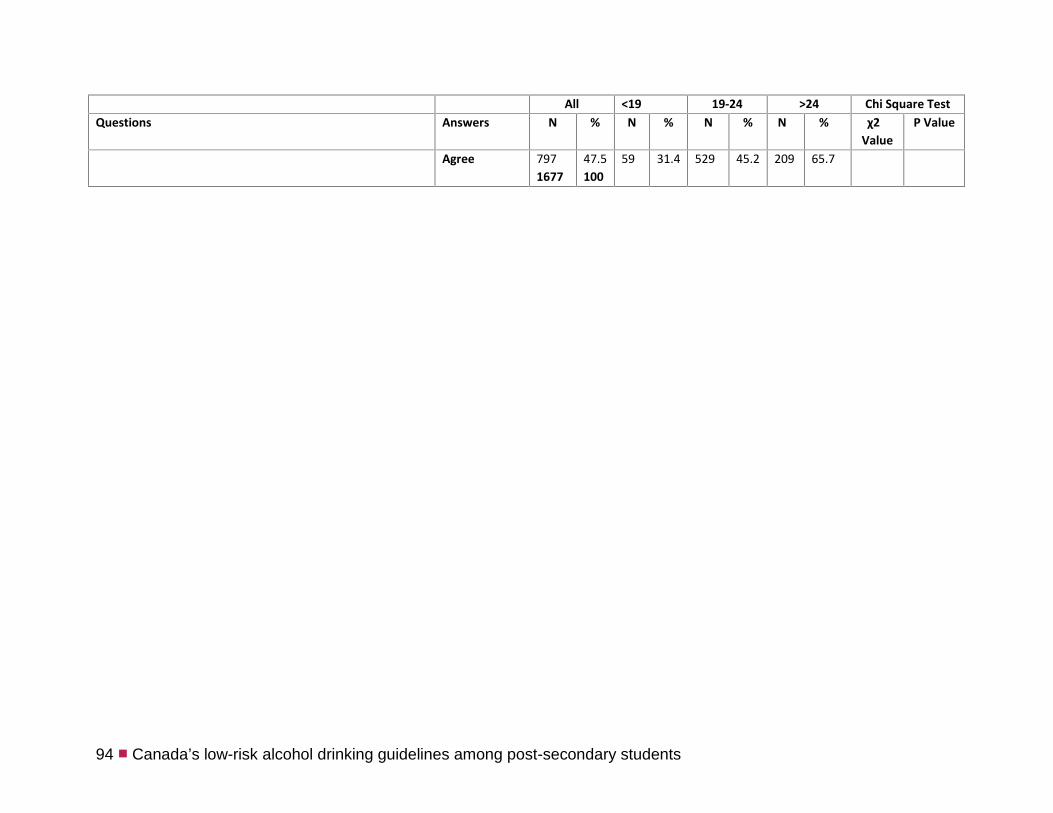
94 ■ Canada’s low-risk alcohol drinking guidelines among post-secondary students
All <19 19-24 >24 Chi Square TestQuestions Answers N % N % N % N % χ2
ValueP Value
Agree 7971677
47.5100
59 31.4 529 45.2 209 65.7

Canada’s low-risk alcohol drinking guidelines among post-secondary students ■ 95
Table 22: Beliefs by EthnicityAll Caucasian Non-
CaucasianChi Square Test
Questions Answers N % N % N % χ2Value
P Value
Students at my institution admire drinkers DisagreeNeutralAgree
3015067621568
19.232.248.6100
242439651
18.233.048.9
5966111
25.028.047.0
6.565 p=0.038
It’s important to show how much you can drink and still hold yourliquor (i.e. to be able to drink considerable amounts of alcohol withlittle signs or symptoms of intoxication
DisagreeNeutralAgree
9633274341724
55.919.025.2100
792292376
54.220.025.8
1713558
64.813.322.0
11.065 p=0.004
You can’t make it socially without drinking DisagreeNeutralAgree
12792272841790
71.512.715.9100
1079196236
71.413.015.6
2003148
71.711.117.2
1.018 p=0.601
Drinking is an important part of university/college experience DisagreeNeutralAgree
6554426861782
36.824.838.4100
523383599
34.825.439.8
1325986
47.721.331.0
16.883 p<0.001
Rules about drinking are almost never enforced on campus DisagreeNeutralAgree
5002854531238
40.423.036.6100
426242372
41.023.335.8
744381
37.421.740.9
1.905 p=0.386
Alcohol is easily available on campus DisagreeNeutralAgree
3412827141337
25.521.153.4100
286238599
25.720.653.7
5544115
25.720.653.7
0.43 p=0.979
Alcohol use is a problem for students on my campus DisagreeNeutralAgree
412422442
32.333.134.6
353372367
32.334.133.6
595075
32.127.240.8
4.591 p=0.101

96 ■ Canada’s low-risk alcohol drinking guidelines among post-secondary students
All Caucasian Non-Caucasian
Chi Square Test
Questions Answers N % N % N % χ2Value
P Value
1276 100The administration at my school should exercise more control overstudents’ alcohol use
DisagreeNeutralAgree
7884302791497
52.628.718.6100
689368202
54.729.216.0
996277
41.626.132.4
35.823 p<0.001
There should be more alcohol-free social events or activities on myschool campus
DisagreeNeutralAgree
5045465861636
30.833.435.8100
440463477
31.933.634.6
6483109
25.032.442.6
7.275 p=0.026
Alcohol should be sold at campus sporting events DisagreeNeutralAgree
5894347161739
33.925.041.2100
454373630
31.625.442.9
1256186
46.022.431.6
21.883 p<0.001
Increasing the price of alcohol served on campus pubs and at campusactivities would decrease its consumption by students
DisagreeNeutralAgree
10711605021733
61.89.229.0100
927128409
63.38.727.9
1443293
53.511.934.6
9.423 p=0.009
The Canadian legal drinking age should be increased DisagreeNeutralAgree
13981991861783
78.411.210.4100
1237151123
81.910.08.1
1614863
59.217.623.2
77.073 p<0.001
There should be more advertising against drinking on my campus DisagreeNeutralAgree
7026043901696
41.435.623.0100
614528288
42.936.920.1
8876102
33.128.638.3
41.983 p<0.001
Universities and colleges should ban advertisements of alcoholavailability at campus events and parties
DisagreeNeutralAgree
10134053141732
58.523.418.1100
878344240
60.123.516.4
1356174
50.022.627.4
19.213 p<0.001

Canada’s low-risk alcohol drinking guidelines among post-secondary students ■ 97
All Caucasian Non-Caucasian
Chi Square Test
Questions Answers N % N % N % χ2Value
P Value
There should be more alcohol education programs on my campus DisagreeNeutralAgree
2376417901668
14.238.447.4100
196564645
14.040.145.9
4177145
15.629.355.1
11.205 p=0.004

98 ■ Canada’s low-risk alcohol drinking guidelines among post-secondary students
Table 23: Beliefs by Mother TongueAll English Other Chi Square Test
Questions Answers N % N % N % χ2Value
P Value
Students at my institution admire drinkers DisagreeNeutralAgree
3035097661578
19.232.348.5100
186329530
17.831.550.7
117180236
22.033.844.3
6.758 p=0.034
It’s important to show how much you can drink and still hold yourliquor (i.e. to be able to drink considerable amounts of alcoholwith little signs or symptoms of intoxication
DisagreeNeutralAgree
9703314351736
55.919.125.1100
646218282
56.419.024.6
324113153
54.919.225.9
0.424 p=0.809
You can’t make it socially without drinking DisagreeNeutralAgree
12852292861800
71.412.715.9100
842156191
70.813.116.1
4437395
72.511.915.5
0.665 p=0.717
Drinking is an important part of university/college experience DisagreeNeutralAgree
6644436861793
37.024.738.3100
427285466
36.224.239.6
237158220
38.525.735.8
2.452 p=0.293
Rules about drinking are almost never enforced on campus DisagreeNeutralAgree
5042884541246
40.423.136.4100
343176320
40.921.038.1
161112134
39.627.532.9
7.239 p=0.027
Alcohol is easily available on campus DisagreeNeutralAgree
3442847171345
25.621.153.3100
228181506
24.919.855.3
116103211
27.024.049.1
5.027 p=0.081
Alcohol use is a problem for students on my campus DisagreeNeutralAgree
4134284471288
32.133.234.7100
283271318
32.531.136.5
130157129
31.237.731.0
6.307 p=0.043
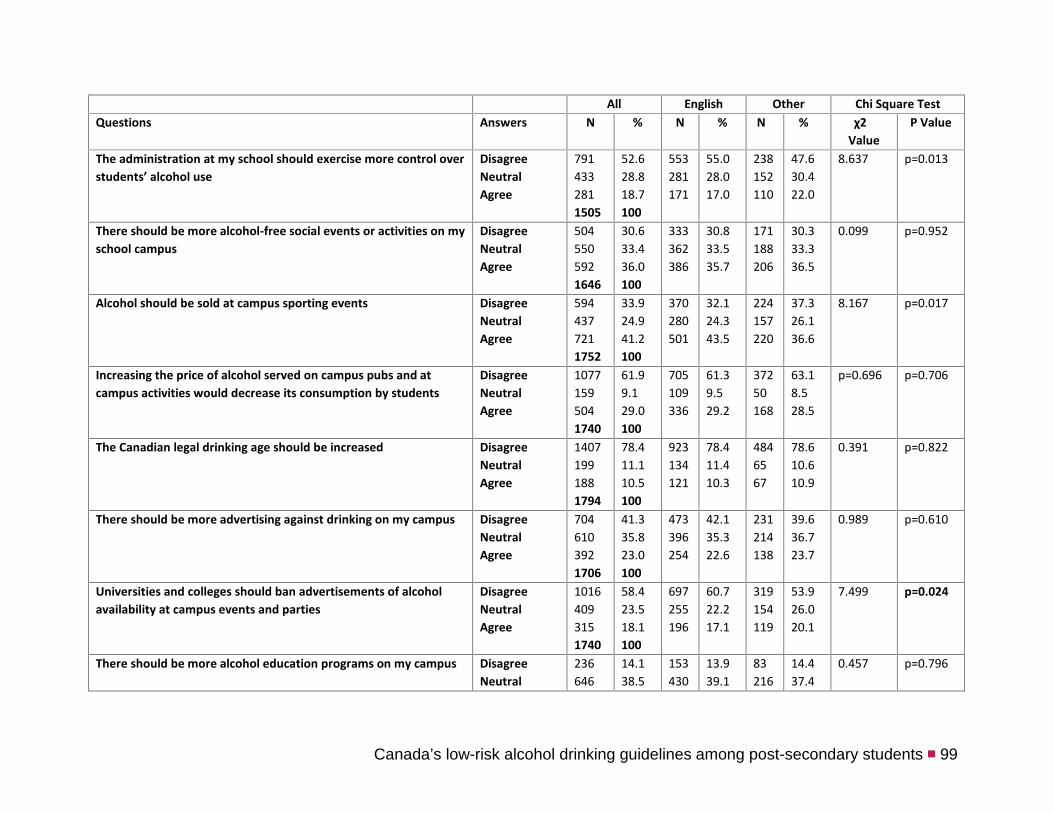
Canada’s low-risk alcohol drinking guidelines among post-secondary students ■ 99
All English Other Chi Square TestQuestions Answers N % N % N % χ2
ValueP Value
The administration at my school should exercise more control overstudents’ alcohol use
DisagreeNeutralAgree
7914332811505
52.628.818.7100
553281171
55.028.017.0
238152110
47.630.422.0
8.637 p=0.013
There should be more alcohol-free social events or activities on myschool campus
DisagreeNeutralAgree
5045505921646
30.633.436.0100
333362386
30.833.535.7
171188206
30.333.336.5
0.099 p=0.952
Alcohol should be sold at campus sporting events DisagreeNeutralAgree
5944377211752
33.924.941.2100
370280501
32.124.343.5
224157220
37.326.136.6
8.167 p=0.017
Increasing the price of alcohol served on campus pubs and atcampus activities would decrease its consumption by students
DisagreeNeutralAgree
10771595041740
61.99.129.0100
705109336
61.39.529.2
37250168
63.18.528.5
p=0.696 p=0.706
The Canadian legal drinking age should be increased DisagreeNeutralAgree
14071991881794
78.411.110.5100
923134121
78.411.410.3
4846567
78.610.610.9
0.391 p=0.822
There should be more advertising against drinking on my campus DisagreeNeutralAgree
7046103921706
41.335.823.0100
473396254
42.135.322.6
231214138
39.636.723.7
0.989 p=0.610
Universities and colleges should ban advertisements of alcoholavailability at campus events and parties
DisagreeNeutralAgree
10164093151740
58.423.518.1100
697255196
60.722.217.1
319154119
53.926.020.1
7.499 p=0.024
There should be more alcohol education programs on my campus DisagreeNeutral
236646
14.138.5
153430
13.939.1
83216
14.437.4
0.457 p=0.796

100 ■ Canada’s low-risk alcohol drinking guidelines among post-secondary students
All English Other Chi Square TestQuestions Answers N % N % N % χ2
ValueP Value
Agree 7971679
47.5100
518 47.0 279 48.3
Table 24: Beliefs by Institution TypeAll College University Chi Square Test
Questions Answers N % N % N % χ2Value
P Value
Students at my institution admire drinkers DisagreeNeutralAgree
3045097611574
19.332.348.3100
4887122
18.733.947.5
256422639
19.432.048.5
0.331 p=0.847
It’s important to show how much you can drink and still hold yourliquor (i.e. to be able to drink considerable amounts of alcoholwith little signs or symptoms of intoxication
DisagreeNeutralAgree
9633314341728
55.719.225.1100
1634872
57.617.025.4
800283362
55.419.625.1
1.077 p=0.584
You can’t make it socially without drinking DisagreeNeutralAgree
12812282851794
71.412.715.9100
2252741
76.89.214.0
1056201244
70.413.416.3
5.577 p=0.062
Drinking is an important part of university/college experience DisagreeNeutralAgree
6654416811787
37.224.738.1100
1237498
41.725.133.2
542367583
36.324.639.1
4.146 p=0.126
Rules about drinking are almost never enforced on campus DisagreeNeutralAgree
5012854521238
40.523.036.5100
934765
45.422.931.7
408238387
39.523.037.5
3.009 p=0.222
Alcohol is easily available on campus Disagree 344 25.7 42 17.8 302 27.4 12.875 p=0.002
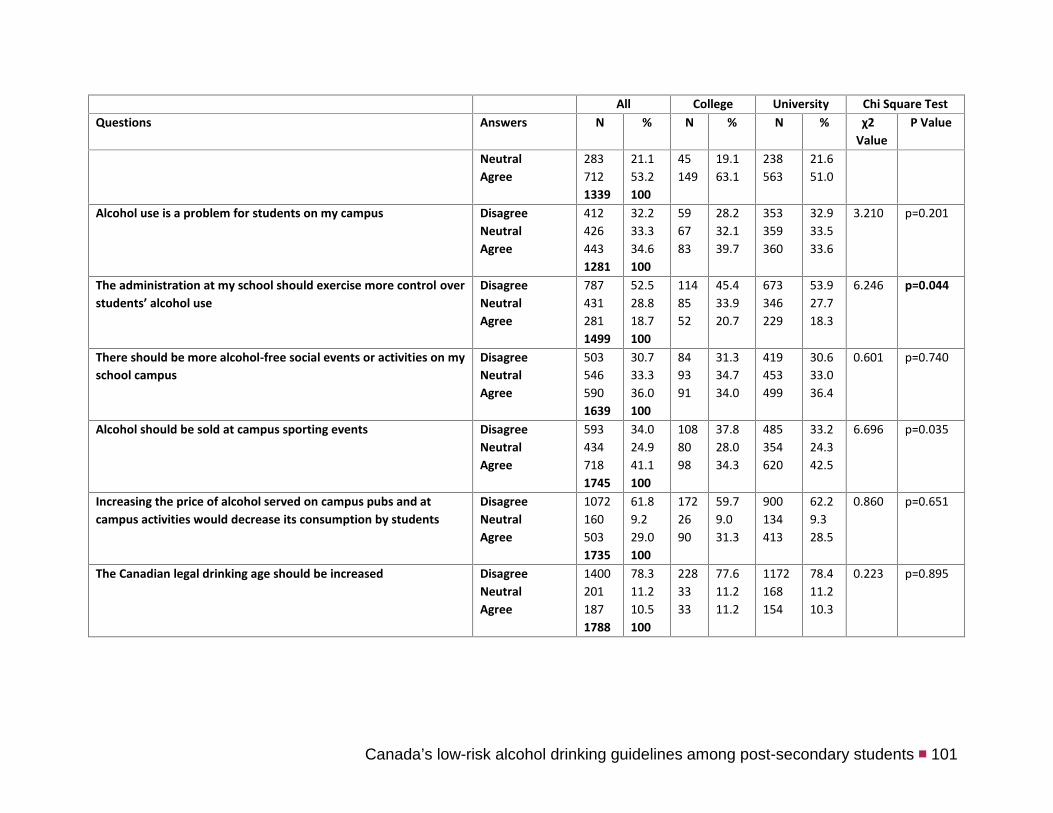
Canada’s low-risk alcohol drinking guidelines among post-secondary students ■ 101
All College University Chi Square TestQuestions Answers N % N % N % χ2
ValueP Value
NeutralAgree
2837121339
21.153.2100
45149
19.163.1
238563
21.651.0
Alcohol use is a problem for students on my campus DisagreeNeutralAgree
4124264431281
32.233.334.6100
596783
28.232.139.7
353359360
32.933.533.6
3.210 p=0.201
The administration at my school should exercise more control overstudents’ alcohol use
DisagreeNeutralAgree
7874312811499
52.528.818.7100
1148552
45.433.920.7
673346229
53.927.718.3
6.246 p=0.044
There should be more alcohol-free social events or activities on myschool campus
DisagreeNeutralAgree
5035465901639
30.733.336.0100
849391
31.334.734.0
419453499
30.633.036.4
0.601 p=0.740
Alcohol should be sold at campus sporting events DisagreeNeutralAgree
5934347181745
34.024.941.1100
1088098
37.828.034.3
485354620
33.224.342.5
6.696 p=0.035
Increasing the price of alcohol served on campus pubs and atcampus activities would decrease its consumption by students
DisagreeNeutralAgree
10721605031735
61.89.229.0100
1722690
59.79.031.3
900134413
62.29.328.5
0.860 p=0.651
The Canadian legal drinking age should be increased DisagreeNeutralAgree
14002011871788
78.311.210.5100
2283333
77.611.211.2
1172168154
78.411.210.3
0.223 p=0.895
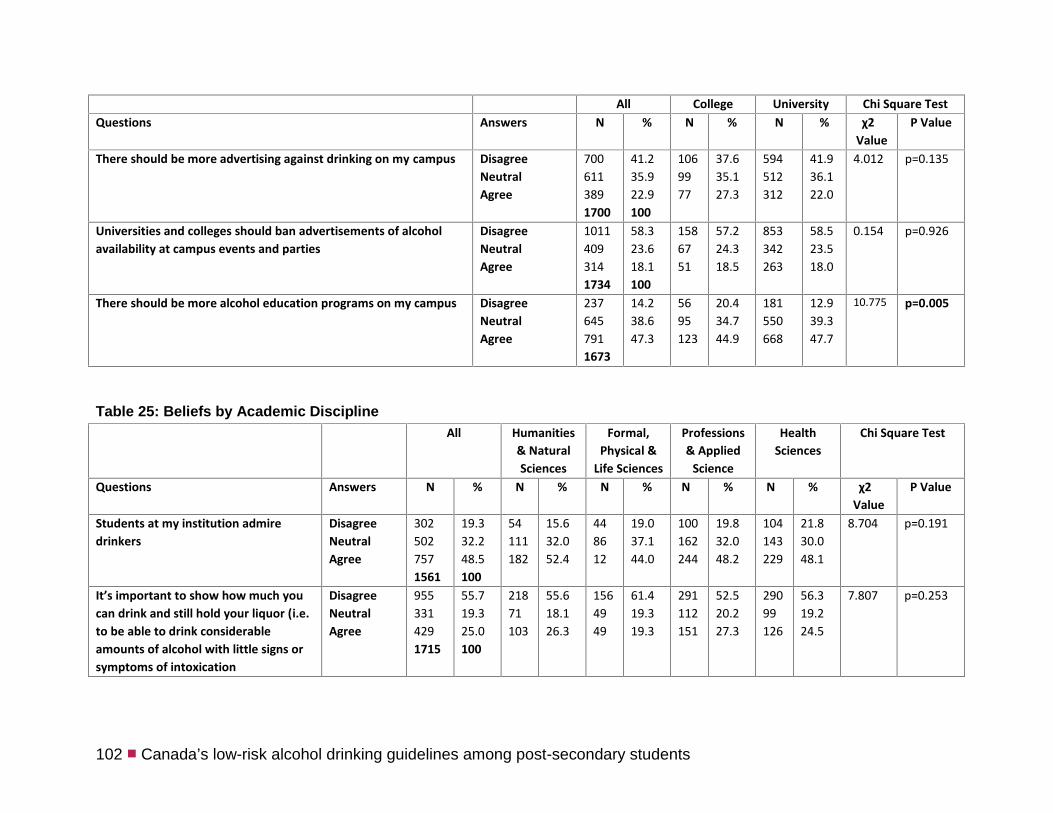
102 ■ Canada’s low-risk alcohol drinking guidelines among post-secondary students
All College University Chi Square TestQuestions Answers N % N % N % χ2
ValueP Value
There should be more advertising against drinking on my campus DisagreeNeutralAgree
7006113891700
41.235.922.9100
1069977
37.635.127.3
594512312
41.936.122.0
4.012 p=0.135
Universities and colleges should ban advertisements of alcoholavailability at campus events and parties
DisagreeNeutralAgree
10114093141734
58.323.618.1100
1586751
57.224.318.5
853342263
58.523.518.0
0.154 p=0.926
There should be more alcohol education programs on my campus DisagreeNeutralAgree
2376457911673
14.238.647.3
5695123
20.434.744.9
181550668
12.939.347.7
10.775 p=0.005
Table 25: Beliefs by Academic DisciplineAll Humanities
& NaturalSciences
Formal,Physical &
Life Sciences
Professions& Applied
Science
HealthSciences
Chi Square Test
Questions Answers N % N % N % N % N % χ2Value
P Value
Students at my institution admiredrinkers
DisagreeNeutralAgree
3025027571561
19.332.248.5100
54111182
15.632.052.4
448612
19.037.144.0
100162244
19.832.048.2
104143229
21.830.048.1
8.704 p=0.191
It’s important to show how much youcan drink and still hold your liquor (i.e.to be able to drink considerableamounts of alcohol with little signs orsymptoms of intoxication
DisagreeNeutralAgree
9553314291715
55.719.325.0100
21871103
55.618.126.3
1564949
61.419.319.3
291112151
52.520.227.3
29099126
56.319.224.5
7.807 p=0.253
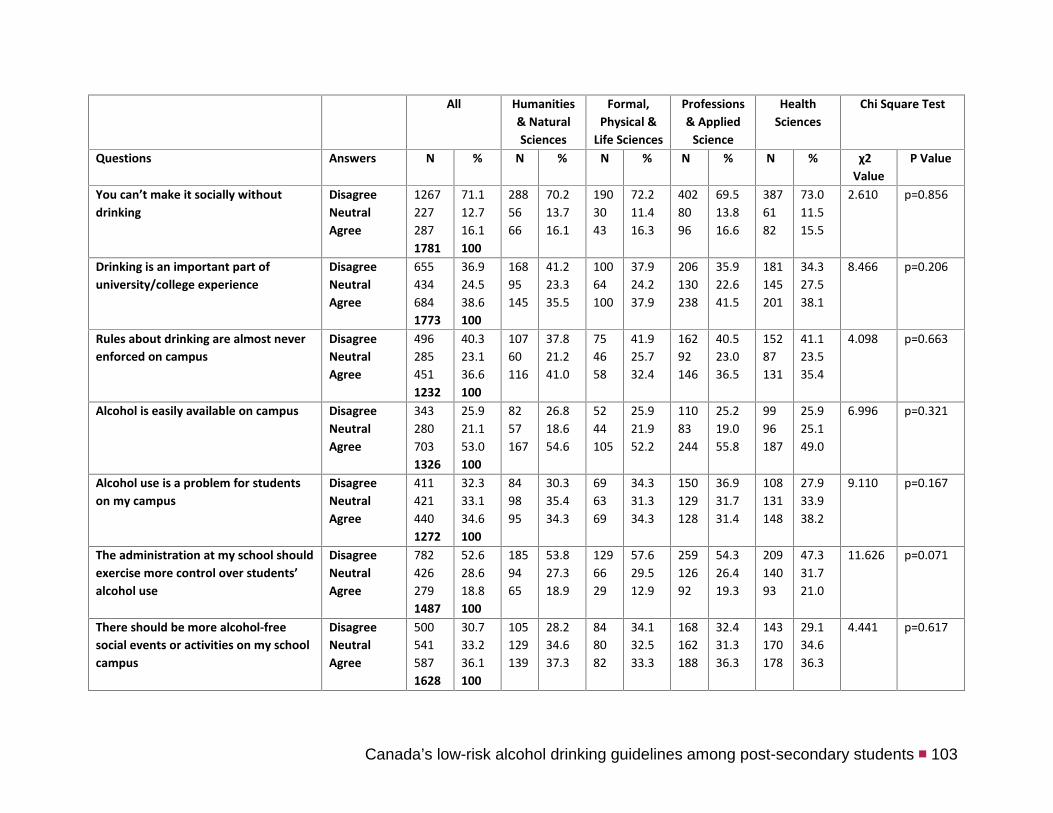
Canada’s low-risk alcohol drinking guidelines among post-secondary students ■ 103
All Humanities& NaturalSciences
Formal,Physical &
Life Sciences
Professions& Applied
Science
HealthSciences
Chi Square Test
Questions Answers N % N % N % N % N % χ2Value
P Value
You can’t make it socially withoutdrinking
DisagreeNeutralAgree
12672272871781
71.112.716.1100
2885666
70.213.716.1
1903043
72.211.416.3
4028096
69.513.816.6
3876182
73.011.515.5
2.610 p=0.856
Drinking is an important part ofuniversity/college experience
DisagreeNeutralAgree
6554346841773
36.924.538.6100
16895145
41.223.335.5
10064100
37.924.237.9
206130238
35.922.641.5
181145201
34.327.538.1
8.466 p=0.206
Rules about drinking are almost neverenforced on campus
DisagreeNeutralAgree
4962854511232
40.323.136.6100
10760116
37.821.241.0
754658
41.925.732.4
16292146
40.523.036.5
15287131
41.123.535.4
4.098 p=0.663
Alcohol is easily available on campus DisagreeNeutralAgree
3432807031326
25.921.153.0100
8257167
26.818.654.6
5244105
25.921.952.2
11083244
25.219.055.8
9996187
25.925.149.0
6.996 p=0.321
Alcohol use is a problem for studentson my campus
DisagreeNeutralAgree
4114214401272
32.333.134.6100
849895
30.335.434.3
696369
34.331.334.3
150129128
36.931.731.4
108131148
27.933.938.2
9.110 p=0.167
The administration at my school shouldexercise more control over students’alcohol use
DisagreeNeutralAgree
7824262791487
52.628.618.8100
1859465
53.827.318.9
1296629
57.629.512.9
25912692
54.326.419.3
20914093
47.331.721.0
11.626 p=0.071
There should be more alcohol-freesocial events or activities on my schoolcampus
DisagreeNeutralAgree
5005415871628
30.733.236.1100
105129139
28.234.637.3
848082
34.132.533.3
168162188
32.431.336.3
143170178
29.134.636.3
4.441 p=0.617

104 ■ Canada’s low-risk alcohol drinking guidelines among post-secondary students
All Humanities& NaturalSciences
Formal,Physical &
Life Sciences
Professions& Applied
Science
HealthSciences
Chi Square Test
Questions Answers N % N % N % N % N % χ2Value
P Value
Alcohol should be sold at campussporting events
DisagreeNeutralAgree
5854347141733
33.825.041.2100
13788163
35.322.742.0
8467113
31.825.442.8
192135240
33.923.842.3
172144198
33.528.038.5
4.917 p=0.554
Increasing the price of alcohol servedon campus pubs and at campusactivities would decrease itsconsumption by students
DisagreeNeutralAgree
10621595021723
61.69.229.1100
24734116
62.28.629.2
1691575
65.35.829.0
32954175
59.09.731.4
31756136
62.311.026.7
8.588 p=0.198
The Canadian legal drinking age shouldbe increased
DisagreeNeutralAgree
13901991861775
78.311.210.5100
3293742
80.69.110.3
2182816
83.210.76.1
4306480
74.911.113.9
4137048
77.813.29.0
17.921 p=0.006
There should be more advertisingagainst drinking on my campus
DisagreeNeutralAgree
7006023871689
41.435.622.9100
15413991
40.136.223.7
1199243
46.936.216.9
230183134
42.033.524.5
197188119
39.137.323.6
8.641 p=0.195
Universities and colleges should banadvertisements of alcohol availabilityat campus events and parties
DisagreeNeutralAgree
10093993141722
58.623.218.2100
2269274
57.723.518.9
1536542
58.825.016.2
34012099
60.821.517.7
29012299
56.823.919.4
3.186 p=0.785
There should be more alcoholeducation programs on my campus
DisagreeNeutralAgree
2346377921663
14.138.347.6100
36148203
9.338.252.5
3911595
15.746.238.2
83189257
15.735.748.6
76185237
15.337.147.6
20.006 p=0.003
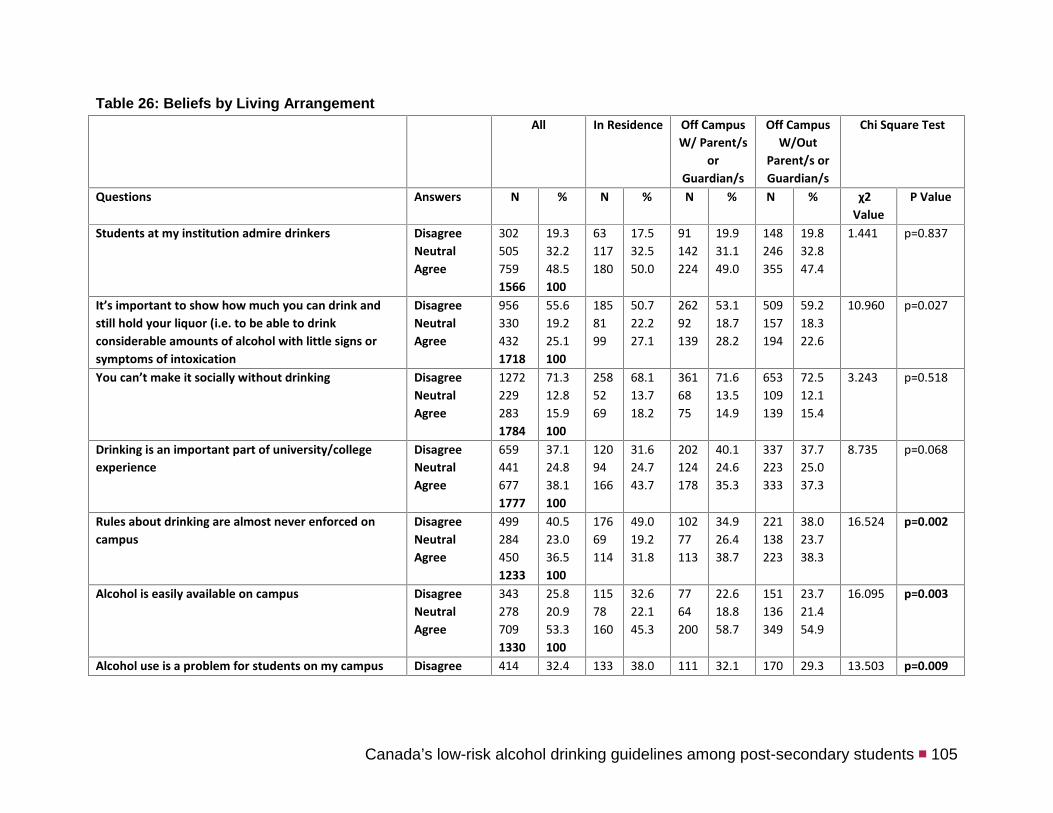
Canada’s low-risk alcohol drinking guidelines among post-secondary students ■ 105
Table 26: Beliefs by Living ArrangementAll In Residence Off Campus
W/ Parent/sor
Guardian/s
Off CampusW/Out
Parent/s orGuardian/s
Chi Square Test
Questions Answers N % N % N % N % χ2Value
P Value
Students at my institution admire drinkers DisagreeNeutralAgree
3025057591566
19.332.248.5100
63117180
17.532.550.0
91142224
19.931.149.0
148246355
19.832.847.4
1.441 p=0.837
It’s important to show how much you can drink andstill hold your liquor (i.e. to be able to drinkconsiderable amounts of alcohol with little signs orsymptoms of intoxication
DisagreeNeutralAgree
9563304321718
55.619.225.1100
1858199
50.722.227.1
26292139
53.118.728.2
509157194
59.218.322.6
10.960 p=0.027
You can’t make it socially without drinking DisagreeNeutralAgree
12722292831784
71.312.815.9100
2585269
68.113.718.2
3616875
71.613.514.9
653109139
72.512.115.4
3.243 p=0.518
Drinking is an important part of university/collegeexperience
DisagreeNeutralAgree
6594416771777
37.124.838.1100
12094166
31.624.743.7
202124178
40.124.635.3
337223333
37.725.037.3
8.735 p=0.068
Rules about drinking are almost never enforced oncampus
DisagreeNeutralAgree
4992844501233
40.523.036.5100
17669114
49.019.231.8
10277113
34.926.438.7
221138223
38.023.738.3
16.524 p=0.002
Alcohol is easily available on campus DisagreeNeutralAgree
3432787091330
25.820.953.3100
11578160
32.622.145.3
7764200
22.618.858.7
151136349
23.721.454.9
16.095 p=0.003
Alcohol use is a problem for students on my campus Disagree 414 32.4 133 38.0 111 32.1 170 29.3 13.503 p=0.009
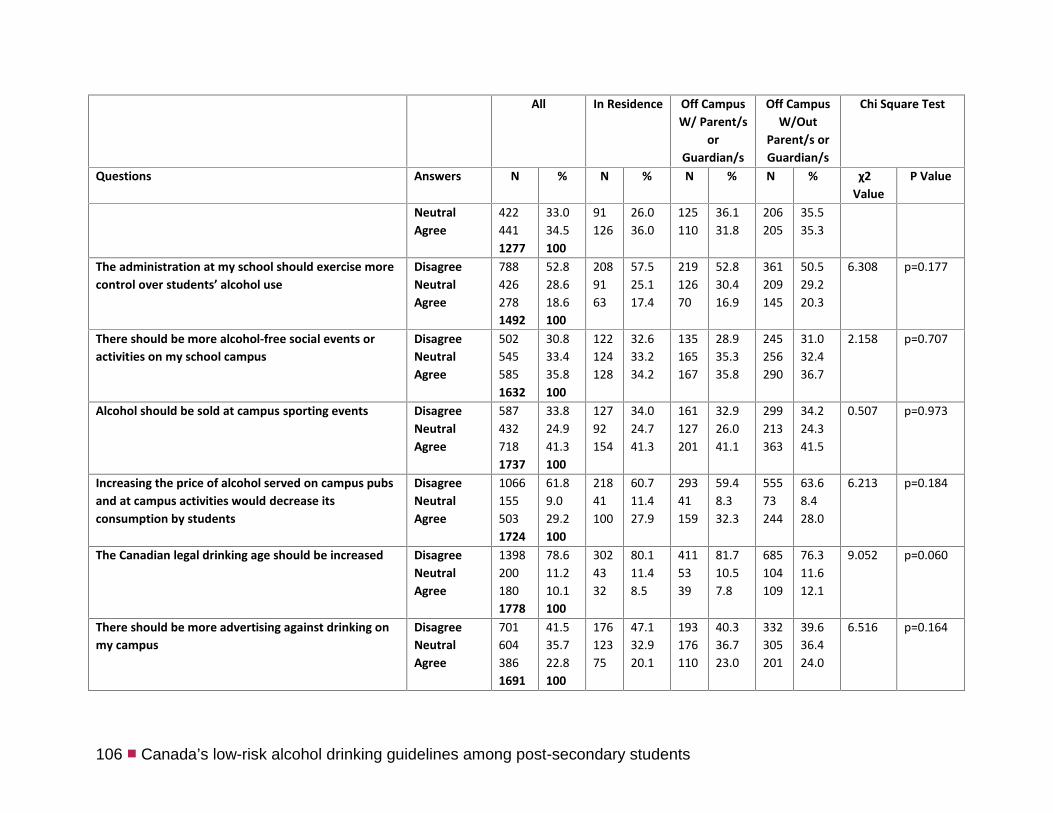
106 ■ Canada’s low-risk alcohol drinking guidelines among post-secondary students
All In Residence Off CampusW/ Parent/s
orGuardian/s
Off CampusW/Out
Parent/s orGuardian/s
Chi Square Test
Questions Answers N % N % N % N % χ2Value
P Value
NeutralAgree
4224411277
33.034.5100
91126
26.036.0
125110
36.131.8
206205
35.535.3
The administration at my school should exercise morecontrol over students’ alcohol use
DisagreeNeutralAgree
7884262781492
52.828.618.6100
2089163
57.525.117.4
21912670
52.830.416.9
361209145
50.529.220.3
6.308 p=0.177
There should be more alcohol-free social events oractivities on my school campus
DisagreeNeutralAgree
5025455851632
30.833.435.8100
122124128
32.633.234.2
135165167
28.935.335.8
245256290
31.032.436.7
2.158 p=0.707
Alcohol should be sold at campus sporting events DisagreeNeutralAgree
5874327181737
33.824.941.3100
12792154
34.024.741.3
161127201
32.926.041.1
299213363
34.224.341.5
0.507 p=0.973
Increasing the price of alcohol served on campus pubsand at campus activities would decrease itsconsumption by students
DisagreeNeutralAgree
10661555031724
61.89.029.2100
21841100
60.711.427.9
29341159
59.48.332.3
55573244
63.68.428.0
6.213 p=0.184
The Canadian legal drinking age should be increased DisagreeNeutralAgree
13982001801778
78.611.210.1100
3024332
80.111.48.5
4115339
81.710.57.8
685104109
76.311.612.1
9.052 p=0.060
There should be more advertising against drinking onmy campus
DisagreeNeutralAgree
7016043861691
41.535.722.8100
17612375
47.132.920.1
193176110
40.336.723.0
332305201
39.636.424.0
6.516 p=0.164

Canada’s low-risk alcohol drinking guidelines among post-secondary students ■ 107
All In Residence Off CampusW/ Parent/s
orGuardian/s
Off CampusW/Out
Parent/s orGuardian/s
Chi Square Test
Questions Answers N % N % N % N % χ2Value
P Value
Universities and colleges should ban advertisements ofalcohol availability at campus events and parties
DisagreeNeutralAgree
10124033091724
58.723.417.9100
2278657
61.423.215.4
29911869
61.524.314.2
486199183
56.022.921.1
12.343 p=0.015
There should be more alcohol education programs onmy campus
DisagreeNeutralAgree
2386417861665
14.338.547.2100
63149160
16.940.143.0
75192202
16.040.943.1
100300424
12.136.451.5
13.580 p=0.009
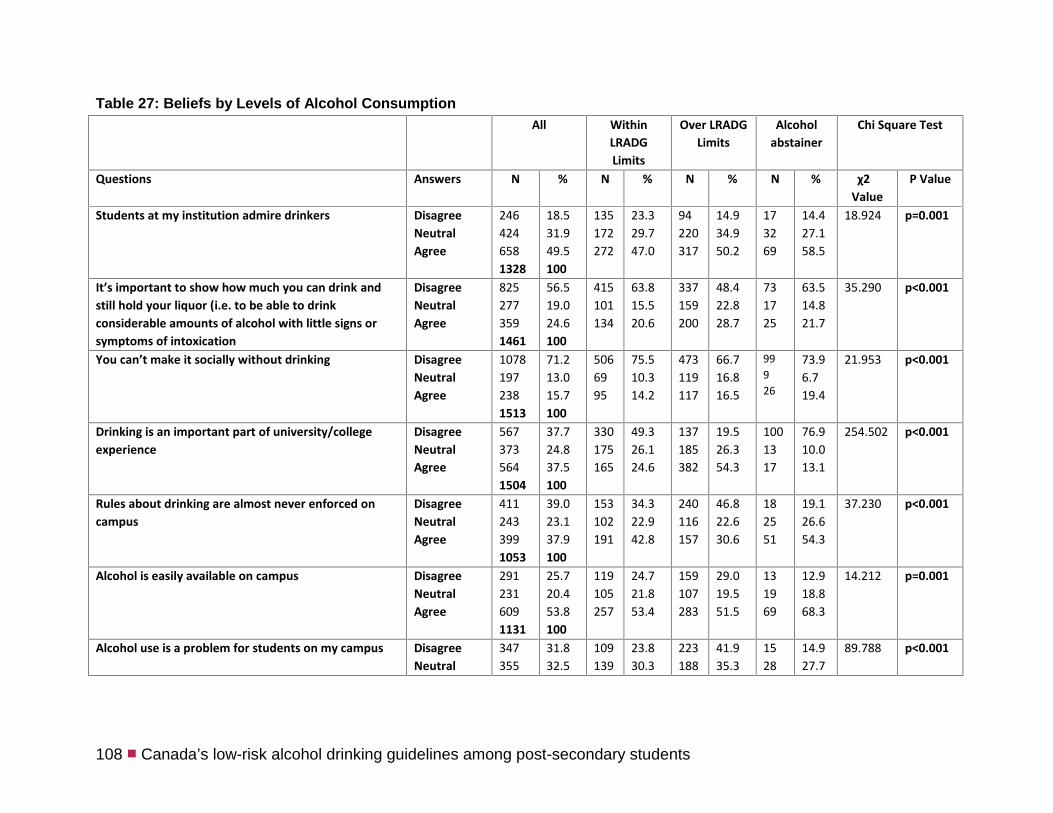
108 ■ Canada’s low-risk alcohol drinking guidelines among post-secondary students
Table 27: Beliefs by Levels of Alcohol ConsumptionAll Within
LRADGLimits
Over LRADGLimits
Alcoholabstainer
Chi Square Test
Questions Answers N % N % N % N % χ2Value
P Value
Students at my institution admire drinkers DisagreeNeutralAgree
2464246581328
18.531.949.5100
135172272
23.329.747.0
94220317
14.934.950.2
173269
14.427.158.5
18.924 p=0.001
It’s important to show how much you can drink andstill hold your liquor (i.e. to be able to drinkconsiderable amounts of alcohol with little signs orsymptoms of intoxication
DisagreeNeutralAgree
8252773591461
56.519.024.6100
415101134
63.815.520.6
337159200
48.422.828.7
731725
63.514.821.7
35.290 p<0.001
You can’t make it socially without drinking DisagreeNeutralAgree
10781972381513
71.213.015.7100
5066995
75.510.314.2
473119117
66.716.816.5
99926
73.96.719.4
21.953 p<0.001
Drinking is an important part of university/collegeexperience
DisagreeNeutralAgree
5673735641504
37.724.837.5100
330175165
49.326.124.6
137185382
19.526.354.3
1001317
76.910.013.1
254.502 p<0.001
Rules about drinking are almost never enforced oncampus
DisagreeNeutralAgree
4112433991053
39.023.137.9100
153102191
34.322.942.8
240116157
46.822.630.6
182551
19.126.654.3
37.230 p<0.001
Alcohol is easily available on campus DisagreeNeutralAgree
2912316091131
25.720.453.8100
119105257
24.721.853.4
159107283
29.019.551.5
131969
12.918.868.3
14.212 p=0.001
Alcohol use is a problem for students on my campus DisagreeNeutral
347355
31.832.5
109139
23.830.3
223188
41.935.3
1528
14.927.7
89.788 p<0.001
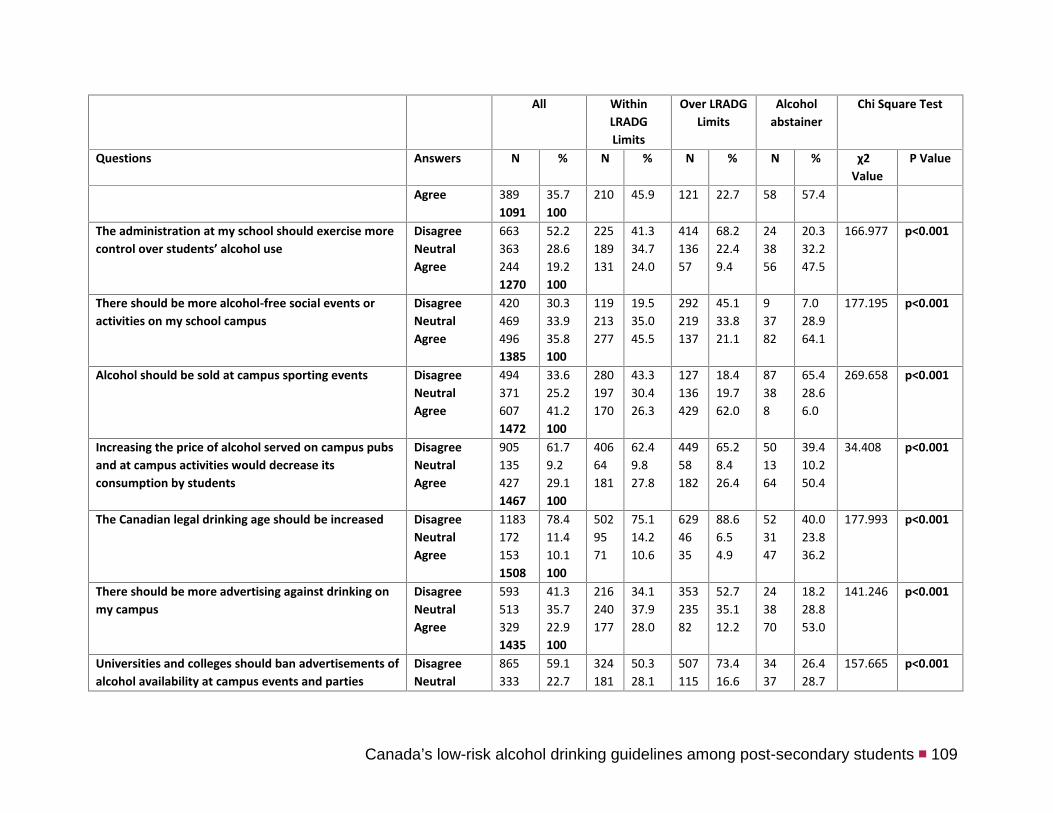
Canada’s low-risk alcohol drinking guidelines among post-secondary students ■ 109
All WithinLRADGLimits
Over LRADGLimits
Alcoholabstainer
Chi Square Test
Questions Answers N % N % N % N % χ2Value
P Value
Agree 3891091
35.7100
210 45.9 121 22.7 58 57.4
The administration at my school should exercise morecontrol over students’ alcohol use
DisagreeNeutralAgree
6633632441270
52.228.619.2100
225189131
41.334.724.0
41413657
68.222.49.4
243856
20.332.247.5
166.977 p<0.001
There should be more alcohol-free social events oractivities on my school campus
DisagreeNeutralAgree
4204694961385
30.333.935.8100
119213277
19.535.045.5
292219137
45.133.821.1
93782
7.028.964.1
177.195 p<0.001
Alcohol should be sold at campus sporting events DisagreeNeutralAgree
4943716071472
33.625.241.2100
280197170
43.330.426.3
127136429
18.419.762.0
87388
65.428.66.0
269.658 p<0.001
Increasing the price of alcohol served on campus pubsand at campus activities would decrease itsconsumption by students
DisagreeNeutralAgree
9051354271467
61.79.229.1100
40664181
62.49.827.8
44958182
65.28.426.4
501364
39.410.250.4
34.408 p<0.001
The Canadian legal drinking age should be increased DisagreeNeutralAgree
11831721531508
78.411.410.1100
5029571
75.114.210.6
6294635
88.66.54.9
523147
40.023.836.2
177.993 p<0.001
There should be more advertising against drinking onmy campus
DisagreeNeutralAgree
5935133291435
41.335.722.9100
216240177
34.137.928.0
35323582
52.735.112.2
243870
18.228.853.0
141.246 p<0.001
Universities and colleges should ban advertisements ofalcohol availability at campus events and parties
DisagreeNeutral
865333
59.122.7
324181
50.328.1
507115
73.416.6
3437
26.428.7
157.665 p<0.001

110 ■ Canada’s low-risk alcohol drinking guidelines among post-secondary students
All WithinLRADGLimits
Over LRADGLimits
Alcoholabstainer
Chi Square Test
Questions Answers N % N % N % N % χ2Value
P Value
Agree 2661464
18.2100
139 21.6 69 10.0 58 45.0
There should be more alcohol education programs onmy campus
DisagreeNeutralAgree
1945526721418
13.738.947.4100
69230323
11.137.051.9
115288266
17.243.039.8
103483
7.926.865.4
40.112 p<0.001

Canada’s low-risk alcohol drinking guidelines among post-secondary students ■ 111
Section 5 - Health Information PreferencesTable 28: Health Information Preferences (Total)
AllQuestions Answers N %
Thinking about your own health, how muchwould you like to receive health-relatedinformation or advice?
Not at allA littleSomeA lot
3256646032021794
18.137.033.611.3100
By which means would you like to receivegeneral information and advice?
I don’t knowBy written materialUsing the mediaIn personElectronicallyThrough bottle labeling
1072403652976161331758
6.113.720.816.935.07.6100
Still thinking specifically about your ownhealth, about how often do you look for health-related information from any source?
Once a weekOnce a monthEvery few monthsTwice a year or lessNever
5665104001961271799
31.528.322.210.97.1100

112 ■ Canada’s low-risk alcohol drinking guidelines among post-secondary students
Table 29: Health Information Preferences by SexAll Males Females Chi Square Test
Questions Answers N % N % N % χ2Value
P Value
Thinking about your own health, how much would you like toreceive health-related information or advice?
Not at allA littleSomeA lot
3256625992021788
18.237.033.511.3100
11317912437
24.939.527.48.2
212483475165
15.936.235.612.4
28.367 p<0.001
By which means would you like to receive general informationand advice?
I don’t knowBy written materialUsing the mediaIn personElectronicallyThrough bottle labelling
1072393632966141321752
6.113.620.816.935.07.5100
3556768013847
8.113.017.618.531.910.9
7218328821647685
5.513.921.816.436.16.4
17.711 p=0.003
Still thinking specifically about your own health, about howoften do you look for health-related information from anysource?
Once a weekOnce a monthEvery few monthsTwice a year or lessNever
5655074001951271794
31.528.322.310.97.1100
1241211036047
27.326.622.613.210.3
44138629713580
32.928.822.210.16.0
16.223 p=0.003

Canada’s low-risk alcohol drinking guidelines among post-secondary students ■ 113
Table 30: Health Information Preferences by AgeAll <19 19-24 >24 Chi Square Test
Questions Answers N % N % N % N % χ2Value
P Value
Thinking about your own health, how muchwould you like to receive health-relatedinformation or advice?
Not at allA littleSomeA lot
3246615982021785
18.237.033.511.3100
30766625
15.238.633.512.7
230453408134
18.837.033.310.9
6413212443
17.636.434.211.8
2.050 p=0.915
By which means would you like to receive generalinformation and advice?
I don’t knowBy written materialUsing the mediaIn personElectronicallyThrough bottle labelling
1072383642946131331749
6.113.620.816.835.07.6100
202143406011
10.310.822.120.530.85.6
68167262203392106
5.713.921.916.932.78.8
1950595116116
5.314.016.614.345.24.5
35.612 p<0.001
Still thinking specifically about your own health,about how often do you look for health-relatedinformation from any source?
Once a weekOnce a monthEvery few monthsTwice a year or lessNever
5665063961951271790
31.628.322.110.97.1100
5248432726
26.524.521.913.813.3
38234928013086
31.128.422.810.67.0
132109733815
36.029.719.910.44.1
23.162 p=0.003

114 ■ Canada’s low-risk alcohol drinking guidelines among post-secondary students
Table 31: Health Information Preferences by EthnicityAll Caucasian Non-
CaucasianChi Square Test
Questions Answers N % N % N % χ2Value
P Value
Thinking about your own health, how muchwould you like to receive health-relatedinformation or advice?
Not at allA littleSomeA lot
3226625922011777
18.137.333.311.3100
275572498152
18.438.233.310.2
47909449
16.832.133.617.5
13.918 p=0.003
By which means would you like to receive generalinformation and advice?
I don’t knowBy written materialUsing the mediaIn personElectronicallyThrough bottle labelling
1072393592966091311741
6.113.720.617.035.07.5100
94198311259496115
6.413.421.117.633.77.8
1341483711316
4.915.317.913.842.26.0
10.156 p=0.071
Still thinking specifically about your own health,about how often do you look for health-relatedinformation from any source?
Once a weekOnce a monthEvery few monthsTwice a year or lessNever
5605083961941251783
31.428.522.210.97.0100
469420347167100
31.227.923.111.16.7
9188492725
32.531.417.59.68.9
6.660 p=0.155

Canada’s low-risk alcohol drinking guidelines among post-secondary students ■ 115
Table 32: Health Information Preferences by Mother TongueAll English Other Chi Square Test
Questions Answers N % N % N % χ2Value
P Value
Thinking about your own health, how much would you liketo receive health-related information or advice?
Not at allA littleSomeA lot
3236626012021788
18.137.033.611.3100
212449387128
18.038.232.910.9
11121321474
18.134.835.012.1
2.269 p=0.518
By which means would you like to receive generalinformation and advice?
I don’t knowBy written materialUsing the mediaIn personElectronicallyThrough bottle labelling
1062393652966151321753
6.013.620.816.935.17.5100
5715824119941481
5.013.721.017.336.07.0
49811249720151
8.113.420.616.133.38.5
8.829 p=0.116
Still thinking specifically about your own health, about howoften do you look for health-related information from anysource?
Once a weekOnce a monthEvery few monthsTwice a year or lessNever
5665093991941261794
31.528.422.210.87.0100
37535526112468
31.730.022.110.55.7
1911541387058
31.325.222.611.59.5
11.749 p=0.019

116 ■ Canada’s low-risk alcohol drinking guidelines among post-secondary students
Table 33: Health Information Preferences by Institution TypeAll College University Chi Square Test
Questions Answers N % N % N % χ2Value
P Value
Thinking about your own health, how much would you liketo receive health-related information or advice?
Not at allA littleSomeA lot
3236586002011782
18.136.933.711.3100
611039927
21.035.534.19.3
262555501174
17.637.233.611.7
3.016 p=0.389
By which means would you like to receive generalinformation and advice?
I don’t knowBy written materialUsing the mediaIn personElectronicallyThrough bottle labelling
1072373622956151321748
6.113.620.716.935.27.6100
1540614210324
5.314.021.414.736.18.4
92197301253512108
6.313.520.617.335.07.4
1.899 p=0.863
Still thinking specifically about your own health, about howoften do you look for health-related information from anysource?
Once a weekOnce a monthEvery few monthsTwice a year or lessNever
5635063971951261787
31.528.322.210.97.1100
6871724634
23.424.424.715.811.7
49543532514992
33.129.121.710.06.1
28.404 p<0.001

Canada’s low-risk alcohol drinking guidelines among post-secondary students ■ 117
Table 34: Health Information Preferences by Academic DisciplineAll Humanities
& NaturalSciences
Formal,Physical &
Life Sciences
Professions& Applied
Science
HealthSciences
Chi Square Test
Questions Answers N % N % N % N % N % χ2Value
P Value
Thinking about your ownhealth, how much would youlike to receive health-relatedinformation or advice?
Not at allA littleSomeA lot
3186555971981768
18.037.033.811.2100
7413615644
18.033.238.010.7
541107722
20.541.829.38.4
10621019265
18.536.633.511.3
8419917267
16.138.133.012.8
12.680 p=0.178
By which means would youlike to receive generalinformation and advice?
I don’t knowBy written materialUsing the mediaIn personElectronicallyThrough bottle labelling
1042353612956071321734
6.013.620.817.035.07.6100
2654836414928
6.413.420.515.836.96.9
143354507922
5.613.121.419.831.38.7
3187999720244
5.515.517.717.336.17.9
33611258417738
6.411.824.116.234.27.3
12.999 p=0.602
Still thinking specifically aboutyour own health, about howoften do you look for health-related information from anysource?
Once a weekOnce a monthEvery few monthsTwice a year or lessNever
5635083931891201773
31.828.722.210.76.8100
1141201035122
27.829.325.112.45.4
7974662617
30.228.225.29.96.5
1551791236556
26.831.021.311.29.7
2151351014725
41.125.819.39.04.8
42.995 p<0.001
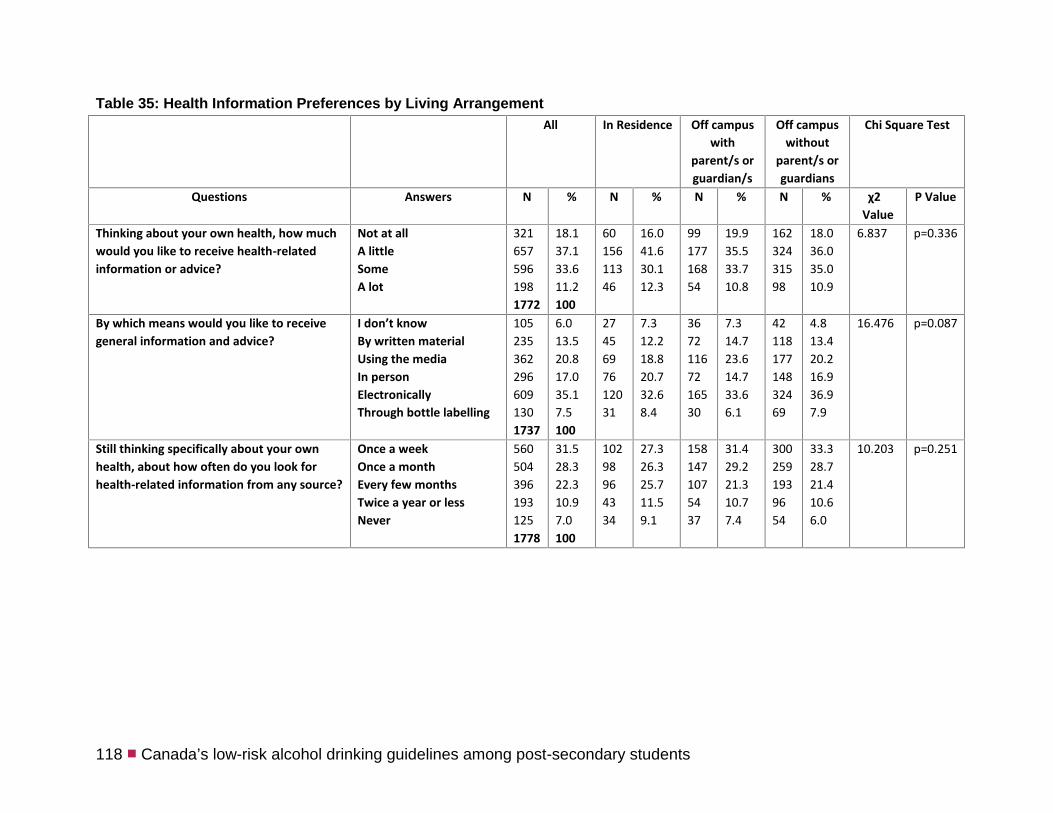
118 ■ Canada’s low-risk alcohol drinking guidelines among post-secondary students
Table 35: Health Information Preferences by Living ArrangementAll In Residence Off campus
withparent/s orguardian/s
Off campuswithout
parent/s orguardians
Chi Square Test
Questions Answers N % N % N % N % χ2Value
P Value
Thinking about your own health, how muchwould you like to receive health-relatedinformation or advice?
Not at allA littleSomeA lot
3216575961981772
18.137.133.611.2100
6015611346
16.041.630.112.3
9917716854
19.935.533.710.8
16232431598
18.036.035.010.9
6.837 p=0.336
By which means would you like to receivegeneral information and advice?
I don’t knowBy written materialUsing the mediaIn personElectronicallyThrough bottle labelling
1052353622966091301737
6.013.520.817.035.17.5100
2745697612031
7.312.218.820.732.68.4
36721167216530
7.314.723.614.733.66.1
4211817714832469
4.813.420.216.936.97.9
16.476 p=0.087
Still thinking specifically about your ownhealth, about how often do you look forhealth-related information from any source?
Once a weekOnce a monthEvery few monthsTwice a year or lessNever
5605043961931251778
31.528.322.310.97.0100
10298964334
27.326.325.711.59.1
1581471075437
31.429.221.310.77.4
3002591939654
33.328.721.410.66.0
10.203 p=0.251
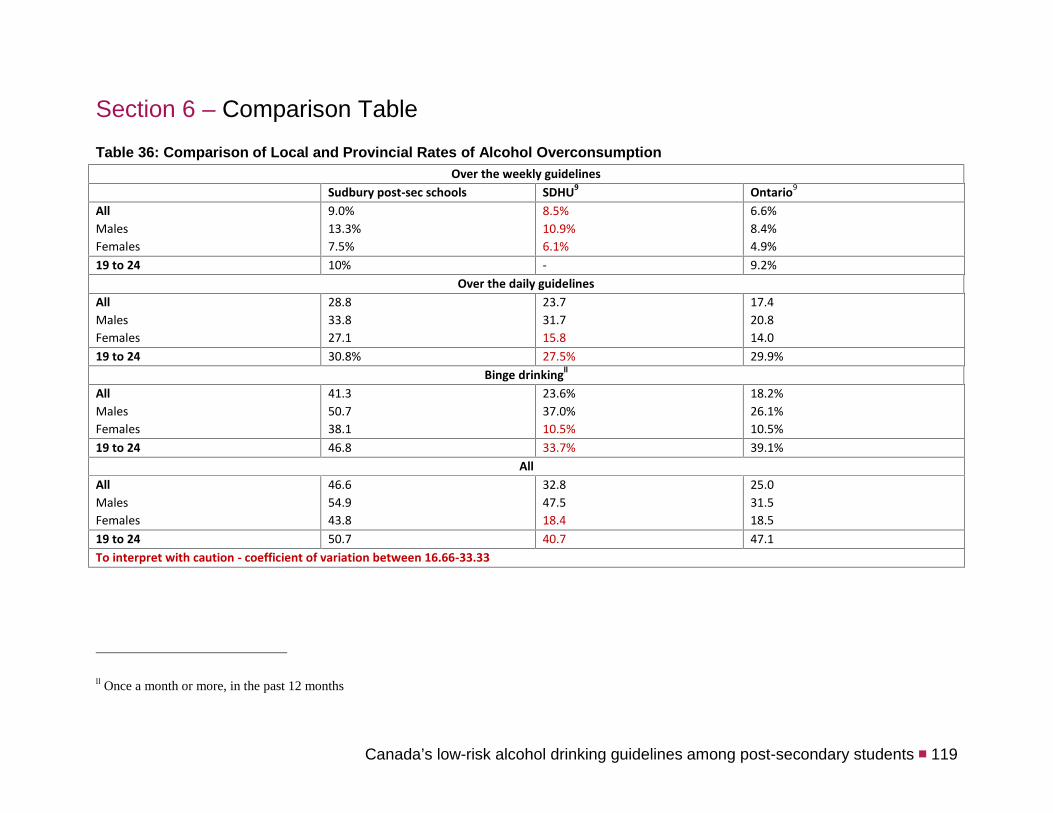
Canada’s low-risk alcohol drinking guidelines among post-secondary students ■ 119
Section 6 – Comparison TableTable 36: Comparison of Local and Provincial Rates of Alcohol Overconsumption
Over the weekly guidelinesSudbury post-sec schools SDHU9 Ontario9
AllMalesFemales
9.0%13.3%7.5%
8.5%10.9%6.1%
6.6%8.4%4.9%
19 to 24 10% - 9.2%Over the daily guidelines
AllMalesFemales
28.833.827.1
23.731.715.8
17.420.814.0
19 to 24 30.8% 27.5% 29.9%Binge drinkingll
AllMalesFemales
41.350.738.1
23.6%37.0%10.5%
18.2%26.1%10.5%
19 to 24 46.8 33.7% 39.1%All
AllMalesFemales
46.654.943.8
32.847.518.4
25.031.518.5
19 to 24 50.7 40.7 47.1To interpret with caution - coefficient of variation between 16.66-33.33
ll Once a month or more, in the past 12 months

Disclaimer
Information contained in this material is research gathered from the Collège Boréal, Cambrian College andLaurentian University populations and presented by the authors of this report. The Administration of each ofthese schools had no role in the design and conduct of the study; management, analyses, or interpretationof the data; preparation, review, or approval of the report.
All rights reserved. The material contained within is protected by national and international copyright laws.No part of this material may be reproduced, translated, or stored in a retrieval system without the priorwritten permission from the principal investigators.