canada–european union comprehensive economic and trade ... · in june2007, canada and the...
TRANSCRIPT
Note to readers: The letters k, M and B are used in texts and tables to refer to thousands, millions and billions respectively.ImportaNt: This document is based on public information and may under no circumstances be used or construed as a commitment by Desjardins Group. While the information provided has been determined on the basis of data obtained from sources that are deemed to be reliable, Desjardins Group in no way warrants that the information is accurate or complete. The document is provided solely for information purposes and does not constitute an offer or solicitation for purchase or sale. Desjardins Group takes no responsibility for the consequences of any decision whatsoever made on the basis of the data contained herein and does not hereby undertake to provide any advice, notably in the area of investment services. The data on prices or margins are provided for information purposes and may be modified at any time, based on such factors as market conditions. The past performances and projections expressed herein are no guarantee of future performance. The opinions and forecasts contained herein are, unless otherwise indicated, those of the document’s authors and do not represent the opinions of any other person or the official position of Desjardins Group. Copyright © 2015, Desjardins Group. All rights reserved.
François Dupuis Benoit P. Durocher 514-281-2336 or 1 866 866-7000, ext. 2336Vice-President and Chief Economist Senior Economist E-mail: [email protected]
In recent years, Canada has entered into numerous free trade agreements with its trading partners. No fewer than 5 agreements have come into effect since 2011, including the agreement with South Korea that started January 1, 2015. In all, Canada currently has 11 free trade agreements with various countries, the largest of which is the North American Free Trade Agreement (NAFTA), in effect since January 1994.
This list should grow in the coming years, as ten additional agreements are currently being negotiated, including the Trans-Pacific Partnership involving Canada, the United States, Mexico, Australia, Brunei, Chile, Japan, Malaysia, New Zealand, Peru, Singapore and Vietnam. This Economic Viewpoint will focus on the recent agreement concluded with the European Union, the Comprehensive Economic and Trade Agreement (CETA).
In June 2007, Canada and the European Union decided to carry out a joint study to determine the costs and benefits of a free trade agreement between the two zones. Published in October 2008, the study found, among other things, that liberalizing trade would generate gains of €11.7B for the European Union’s economy (+0.08% of GDP) and €8.2B for Canada (+0.77% of GDP).1 Given this positive finding,
the parties initiated formal negotiations in 2009. The negotiations took longer than anticipated, however, and it was only in October 2013 that Canadian Prime Minister, Stephen Harper, and European Commission President, José Manuel Barroso, announced an agreement in principle between the two parties. It was September 2014, before the full text of the agreement was released. The ratification process is now underway in both zones, with no date yet set regarding the official effective date of the agreement.
A wiDe-reAChinG trADe AGreeMentThe CETA between Canada and the European Union is intended to be a broad agreement, which covers the trade in both goods and services, along with investment, labour mobility, access to public contracts, the environment, intellectual property rights, and so forth. It is a highly complex accord, so it is difficult to provide a detailed analysis of these aspects in the context of this Economic Viewpoint. Nonetheless, here are the broad strokes of the agreement, to provide a general idea of its primary orientations.
elimination of customs duties on the trade in goodsThe date that CETA goes into effect—not yet established—about 98% of all of the European Union’s tariff lines will be exempt from duty for products originating from Canada (graph 1 on page 2). A tariff line is a specific product coded “HS” in the international coding system. Currently, tariff lines may indicate that a product is exempt from duty, or that a percentage tariff (ad valorem tariff) or lump sum
April 22, 2015
Canada–european Union Comprehensive Economic and Trade AgreementAn overview of the agreement, trade and advantages
Recently, Canada and the European Union concluded a free trade agreement that is currently in the process of being ratified. This Economic Viewpoint summarizes the terms of the accord, which is a broad agreement that goes beyond the trade in goods to cover trade in services, investment, labour mobility, access to public contracts, the environment, intellectual property rights, regulations, etc. By analyzing the volume of trade between Canada and the European Union and factoring in the size of the current customs duties, we identified the products that will benefit the most from eliminating customs duties. All in all, implementing a free trade agreement with the European Union will generate many benefits for Canada’s economy, and feature its own share of challenges.
1 As the negotiations took longer than expected, the results of the estimates done more than six years ago are becoming obsolete and must be taken with a big grain of salt.

2
Economic Viewpoint April 22, 2015 www.desjardins.com/economics
tariff (non-ad valorem tariff) may apply. When CETA goes into effect, nearly all non-agricultural tariff lines and almost 94% of tariff lines on agricultural products will be exempt from duty in the European Union. For certain more sensitive products, a 3- to 8-year transition period has been established to gradually eliminate the tariffs. The main products affected by gradual elimination are automobiles, some fish and seafood products, and some agricultural products. After the phasing-out period, nearly 99% of all tariff lines will have been eliminated in the European Union, 100% of non-agricultural tariff lines and 95% of tariff lines on agricultural products. Canadian agricultural products that will still be subject to customs duty include certain live animals, some beef, pork, poultry and horse meat products, some hams, shoulders and parts, eggs and some egg-based products. Some fruit and vegetables remain subject to specific duties stemming from the input price system.2
Conversely, the day CETA goes into effect, 98.4% of Canadian tariff lines will be eliminated on products from the European Union. A 3- to 8-year transition period has also been established to gradually eliminate tariffs on certain sensitive products, such as ships, automobiles and some agricultural products. In the end, 98.8% of tariff lines will be exempted from customs duties in Canada, i.e. all tariff lines for non-agricultural products and 92.9% of tariff lines for agricultural products. The European agricultural products that will remain subject to tariffs in Canada are principally poultry and dairy products, eggs and egg-based preparations, as well as some ready-meals.3
The trade in alcoholic beverages will also be among the exceptions to the liberalization of trade between Canada and the European Union. Instead, the current Canada–European Community Wine and Spirits Agreement will be incorporated into CETA, with some minor changes.
Canada and the European Union have also agreed to reduce the technical obstacles to trade between the two zones. Integration measures are contemplated for technical, compliance, marking and labelling regulations, particularly in the motor vehicle sector.
trade in servicesIn both Canada and Europe, the service industry plays a dominant role in the economy. Compared with the trade in goods, the trade in services between the two zones is fairly limited, attesting to substantial growth potential. CETA contains provisions to promote the trade in services between Canada and the European Union. Each party will give the other’s service providers and services treatment that is no less favourable than the treatment that party accords, in similar situations, to its own services and service providers (national treatment clause). Each party will also accord treatment similar to what it accords a third-party state (most-favoured nation clause). Lastly, each party pledges not to adopt or maintain measures intended to limit the number of service providers, restrict the total value of the trade in services between the two zones, or limit the total number of transactions (market access clause).
CETA contains individual clauses to provide a more specific framework for financial services, telecommunications, international maritime transport services, and electronic commerce. In general, these clauses strive to stipulate the application of the accord or limit its scope by excluding certain sectors or operations that the parties deem more sensitive or strategic. Among other things, Canada and the European Union agree that electronic deliveries must not be subject to customs duties, fees or other charges.
Labour mobilityThe CETA between Canada and the European Union will also include several measures to facilitate the mobility of business people and some categories of workers between the two zones. The agreement’s provisions will allow certain qualified professionals and business people to work in both Canada and European Union member nations. This will make it possible to support businesses and professionals in monitoring their investments and following up on customers, particularly in terms of after-sales service. The eligible length of stay is a maximum of 3 years (with the option of an 18-month extension) for people transferred
CETA: Comprehensive Economic and Trade Agreement, EU: European UnionSources: Ministère de l’Économie, de l’Innovation et des Exportations du Québec and Desjardins, Economic Studies
Graph 1 – Elimination of customs duties stipulated in CETAas a percentage of tariff lines
Canada EU
Agricultural productsUpon CETA implementation 92.0% 93.6%
Eight years following implementation 92.9% 95.0%
SeafoodUpon CETA implementation 100.0% 95.5%
Eight years following implementation 100.0% 100.0%
Industrial productsUpon CETA implementation 99.6% 99.3%
Eight years following implementation 100.0% 100.0%
All productsUpon CETA implementation 98.4% 98.0%
Eight years following implementation 98.8% 99.0%
2 The complete list of HS codes for Canadian products that will remain subject to duty in the European Union is available on request.3 The complete list of HS codes for European products that will remain subject to duty in the Canada is available on request.
3
Economic Viewpoint April 22, 2015 www.desjardins.com/economics
within a company (specialists and executives), a maximum of 1 year for interns who are university graduates and transferred within a company, as well as investors, and a maximum of 90 days every 6 months for business people visiting for investment purposes.
The agreement also stipulates a process of mutual recognition of professional qualifications. Professional credentials are of course a way to guarantee the quality of services provided for citizens and businesses. However, the existence of different professional requirements in different countries does create obstacles to the trade in services between Canada and nations that belong to the European Union. Some of the differences can be explained by specific needs, but others result in involuntarily excluding foreign professionals. In the context of CETA, the regulatory bodies of the two territorial jurisdictions could determine that the credentials are equivalent, opening the door to mutual recognition that would allow their professionals to work in both zones. That being said, CETA acknowledges that each party will retain the right to regulate its own labour market and will promote the maintenance of national protection and standards in the area of labour.
Direct investmentCETA will also contain measures to govern direct investment by Canadian and European Union businesses in the other’s territory. This should ensure fair and equitable treatment for investors and investments in both zones. Among other things, the agreement includes an obligation not to treat foreign investors less favourably than national businesses, to guarantee foreign investors access to the national market, to prohibit nationality restrictions on members of boards of directors, to prohibit the imposition of conditions on investment (such as a percentage of national content) and to prevent the expropriation of foreign assets without compensation.
This aspect of CETA could foster a great number of investments in Canada. Some European companies could decide to make direct investments in Canada so as to secure free access to the United States or other parts of the world that already have free trade agreements with Canada. Conversely, non-European businesses could invest in Canada to gain free access to European Union markets.
Access to public contractsThe agreement should give Canadian and European businesses free access to high-value public contracts in both Canada and European Union nations. Public contracts involve the procurement of goods and services in the framework of public administrations’ current
expenditures and government investments. The minimum value of contracts subject to CETA will be 13,000 special drawing rights4 for the purchase of goods and services, and 5 million special drawing rights for the construction of public infrastructure. For contracts valued at less than the minimum criteria, the various governments may continue to give preference to local businesses. Governments can also continue to impose technical considerations and environmental and social criteria. Some strategic contracts will also be excluded from the agreement. CETA also stipulates that Canada and European Union nations can continue to designate and maintain government corporations and monopolies and give special rights and privileges to certain corporations.
regulationsCanada and the European Union have also agreed to work together in a number of ways with regard to regulations and compliance of some products. Items the two parties will look at include the compatibility of their regulations on the same or related issues so as to increase convergence between the two zones. Mutual recognition and acceptance of evaluation results from various compliance evaluation organizations are also called for (for electrical and electronic equipment, toys, radiocommunication and telecommunication terminal systems, etc.).
With CETA, both parties are also confirming their intention to continue their efforts in the area of sanitary measures to protect public and animal health. Among other things, Canada and the European Union are reaffirming the rights and obligations that derive from the World Trade Organization’s (WTO) agreement on sanitary and phytosanitary measures (SPS).
CETA also includes a chapter on the principles and standards governing intellectual property rights. This includes copyright, trademarks, geographical indications (used to identify an agricultural product, foodstuff, or regional product), patents, and protection of data on pharmaceutical products and plant varieties. For example, CETA will provide more assistance to pharmaceutical companies by protecting data with an 8-year period of market exclusivity, a potential 2-year extension of patent protection (now twenty years), and a right of appeal under the regulation on patented drugs. Moreover, the agreement contains a protocol intended to increase cooperation between Canada and European Union member nations on mutual recognition
4 A special drawing right is an international unit of value created by the International Monetary Fund (IMF); it corresponded to approximately C$1.56 in 2013.

4
Economic Viewpoint April 22, 2015 www.desjardins.com/economics
of certificates of compliance with good manufacturing practices in the pharmaceutical industry, for the purpose of ensuring the compliance of medicinal products and quality standards for drugs.
More broadly, in one chapter of CETA, both parties acknowledge the importance of free and undistorted competition in their trade relations. They therefore pledge to take appropriate measures to prohibit anti-competitive behaviour.
For subsidies and government support, if Canada or the European Union believes it is being affected by an action by its trade partner, it can notify the partner of its concerns and request that consultations be held on the matter. With regard to agricultural and fishery products, Canada and the European Union want to further enhance the WTO’s multilateral regulations and develop a global, multilateral solution for fishing subsidies.
environmentCETA acknowledges the right of Canada and European Union member nations to establish their own environmental priorities and levels of environmental protection in their territories. Both zones agree not to ease or reduce the current levels of protection. Moreover, Canada and the European Union plan to cooperate on climate change, on the management and use of forest resources, and fishery and aquaculture products. Both parties also plan to cooperate on the environment by means of technical and information exchanges, research projects, studies, conferences and workshops.
the eUroPeAn Union is A MAjor MArketFor Canadian and Quebec businesses, the agreement with the European Union is a unique opportunity to gain free access to one of the world’s largest markets, and increase the geographic diversification of their operations. The European Union contains 28 member nations, including the United Kingdom, France and Italy (graph 2). The European Union’s total population stood at 507.4 million on January 1, 2014. In comparison, the population of the United States was 317.8 million in 2014, while Canada’s was just 35.7 million. The European Union’s economy produced US$17,958B in 2013, slightly more than the United States, at US$16,768B. Canadian output was US$1,827B in 2013.
A snAPshot oF trADeAlthough the size of the European Union’s economy is similar to that of the United States, the relative importance of Canadian trade with the two zones is not. Due to geographic proximity, industrial integration between the two countries, and the fact that a free trade agreement has been in place
for many years, just over 70% of Canada’s exports5 of goods and services go to the United States. In contrast, nearly 53% of Canada’s imports of goods and services come from the United States (graph 3). Nonetheless, the European Union is Canada’s second-largest trading partner. About 8% of Canadian goods and services exports go to the European Union (for a value of about $48B in 2013), while the European Union accounts for nearly 12% of imports coming into Canada (for a value of about $72B in 2013).
Note: The dates in parentheses are the dates the nation joined the European Union.Sources: Eurostat and Desjardins, Economic Studies
Graph 2 – The 28 European Union member nations
1. Austria (1995)
2. Belgium (1952)
3. Bulgaria (2007)
4. Croatia (2013)
5. Cyprus (2004)
6. Czech Rep. (2004)
7. Denmark (1973)
8. Estonia (2004)
9. Finland (1995)
10. France (1952)
11. Germany (1952)
12. Greece (1981)
13. Hungary (2004)
14. Ireland (1973)
15. Italy (1952)
16. Latvia (2004)
17. Lithuania (2004)
18. Luxembourg (1952)
19. Malta (2004)
20. Netherlands (1952)
21. Poland (2004)
22. Portugal (1986)
23. Romania (2007)
24. Slovakia (2004)
25. Slovenia (2004)
26. Spain (1986)
27. Sweden (1995)
28. U.K. (1973)
5 According to the results for 2013.
Graph 3 – The European Union ranks second in Canada’s trade
0
50
100
150
200
250
300
350
400
U.S. EU China Japan Mexico Other0
50
100
150
200
250
300
350
400
Canadian exports in 2013 by destinationIn C$B In C$B
EU: European UnionSources: Industry Canada and Desjardins, Economic Studies
0
50
100
150
200
250
300
U.S. EU China Japan Mexico Other
0
50
100
150
200
250
300
Goods Services
Canadian imports in 2013 by origin

5
Economic Viewpoint April 22, 2015 www.desjardins.com/economics
Conversely, Canada only accounts for a tiny part of the European Union’s international trade, with a weight of about 2% in both European exports and imports.
In Canada’s trade, goods account for a much larger proportion than services. Table 1 on page 9 depicts the relative weight of each European Union member nation in the trade in goods with Canada. It shows that the United Kingdom is the preferred destination for Canadian exports to the European Union, with a relative weight of 40% (graph 4), followed by Italy (10.8%), the Netherlands (9.9%), Belgium (9.1%), France (8.5%) and Germany (8.1%). The historic ties between Canada and the Commonwealth are responsible for the United Kingdom’s dominance in Canadian exports to Europe. For imports, the geographic distribution is a little more uniform (graph 5). Germany (27.6%) is in the lead, followed by the United Kingdom (15.9%), Italy (11.1%), France (10.2%) and the Netherlands (6.4%).
Quebec and Ontario are heavily involved in trade with the European Union. In total, the two provinces account for nearly 56% of Canadian production but about 70% of Canadian exports to the European Union come from
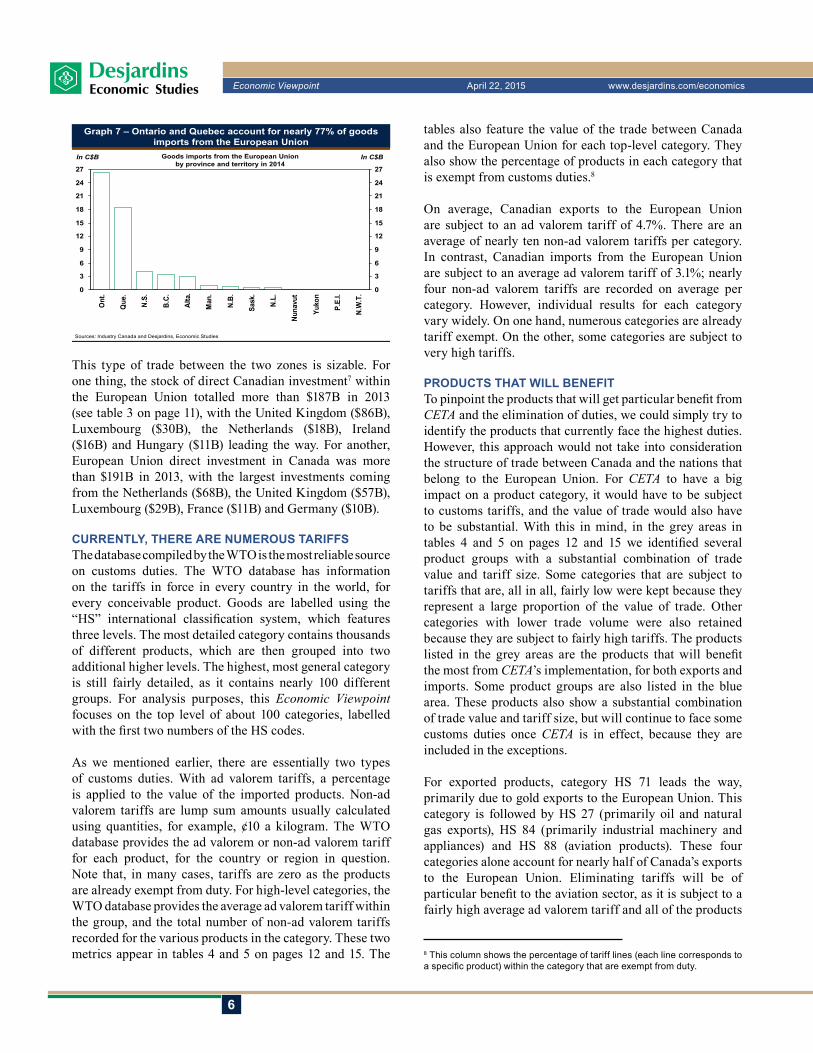
Ontario and Quebec (graph 6). For imports from the European Union, nearly 77% go to Ontario or Quebec (graph 7).
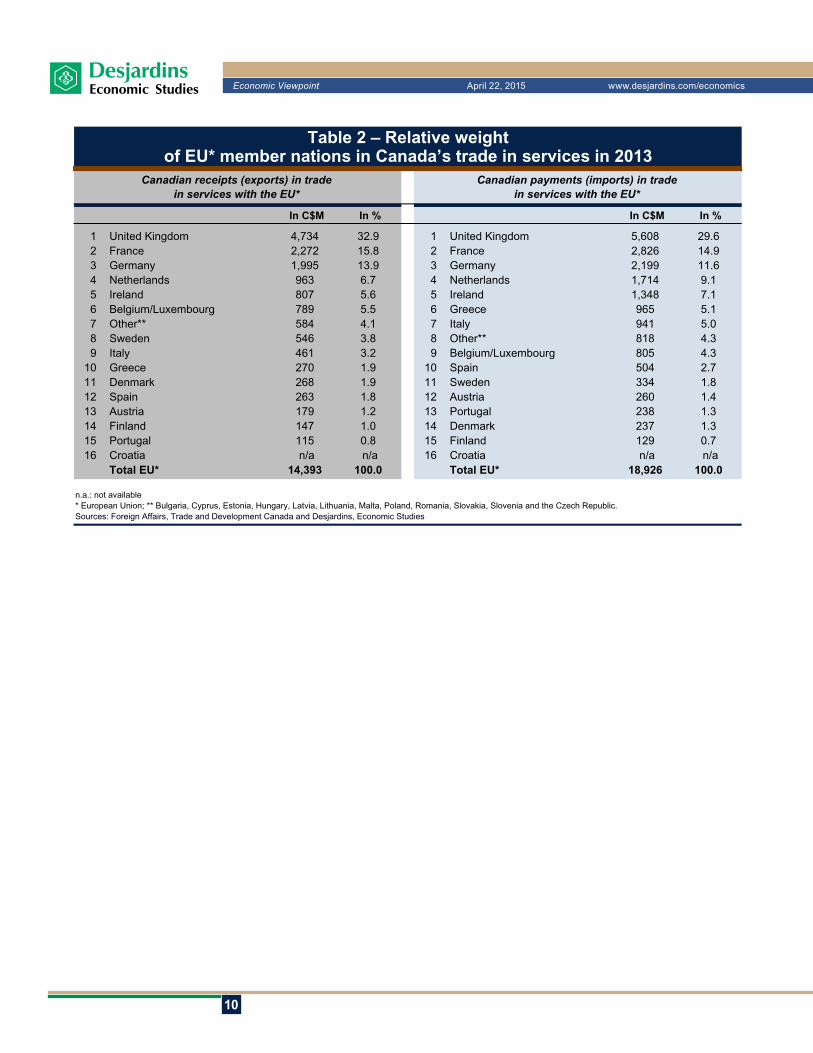
In terms of the trade in services between Canada and the European Union, the United Kingdom dominates with nearly 30% of the trade, in terms of both receipts (exports) and payments (imports). France is second with nearly 15% of trade, followed by Germany, the Netherlands and Ireland (see table 2 on page 10). Nearly half of the trade in services between the two zones comes from commercial services, with $8.1B in receipts in 20126 and $8.8B in payments. Travel, transportation and government services follow (graph 8 on page 6).
As mentioned earlier, the CETA with the European Union is a fairly broad agreement that goes beyond just trade in goods and services. It also contains provisions to facilitate the flow of investment between Canada and the European Union.
Graph 5 – Germany and the United Kingdom are heavyweightsin Canada’s goods imports
0
2
4
6
8
10
12
14
16
Ger
man
y
U.K
.
Italy
Fran
ce
Net
herl
ands
Spa
in
Bel
gium
Sw
eden
Aus
tria
Pol
and
Oth
er
0
2
4
6
8
10
12
14
16
Canadian goods imports from the European Union in 2014In C$B In C$B
Sources: Industry Canada and Desjardins, Economic Studies
Graph 6 – Ontario and Quebec account for nearly 70% of goods exports to the European Union
0
2
4
6
8
10
12
14
16
18
Ont
.
Que
.
N.L
.
B.C
.
N.W
.T.
Alta
.
Sas
k.
Man
.
N.S
.
N.B
.
P.E
.I.
Nun
avut
Yuk
on
0
2
4
6
8
10
12
14
16
18
Goods exports to the European Unionby province and territory in 2014
In C$B In C$B
Sources: Industry Canada and Desjardins, Economic Studies
Graph 7 – Ontario and Quebec account for nearly 77% of goods imports from the European Union
0
3
6
9
12
15
18
21
24
27O
nt.
Que
.
N.S
.
B.C
.
Alta
.
Man
.
N.B
.
Sas
k.
N.L
.
Nun
avut
Yuk
on
P.E
.I.
N.W
.T. 0
3
6
9
12
15
18
21
24
27
Goods imports from the European Unionby province and territory in 2014
In C$B In C$B
Sources: Industry Canada and Desjardins, Economic Studies
Graph 4 – The United Kingdom is the preferred destinationfor Canadian goods exports
0
2
4
6
8
10
12
14
16
U.K
.
Italy
Net
herl
ands
Bel
gium
Fran
ce
Ger
man
y
Spa
in
Mal
ta
Finl
and
Irel
and
Oth
er
0
2
4
6
8
10
12
14
16Canadian goods exports to the European Union in 2014
In C$B In C$B
Sources: Industry Canada and Desjardins, Economic Studies
6 The category data for the trade in services is only available for 2012.7 Direct investments essentially comprise mergers and acquisitions (acquisitions or net sales of new interests) and reinvested earnings.
6
Economic Viewpoint April 22, 2015 www.desjardins.com/economics
This type of trade between the two zones is sizable. For one thing, the stock of direct Canadian investment7 within the European Union totalled more than $187B in 2013 (see table 3 on page 11), with the United Kingdom ($86B), Luxembourg ($30B), the Netherlands ($18B), Ireland ($16B) and Hungary ($11B) leading the way. For another, European Union direct investment in Canada was more than $191B in 2013, with the largest investments coming from the Netherlands ($68B), the United Kingdom ($57B), Luxembourg ($29B), France ($11B) and Germany ($10B).
CUrrentLy, there Are nUMeroUs tAriFFsThe database compiled by the WTO is the most reliable source on customs duties. The WTO database has information on the tariffs in force in every country in the world, for every conceivable product. Goods are labelled using the “HS” international classification system, which features three levels. The most detailed category contains thousands of different products, which are then grouped into two additional higher levels. The highest, most general category is still fairly detailed, as it contains nearly 100 different groups. For analysis purposes, this Economic Viewpoint focuses on the top level of about 100 categories, labelled with the first two numbers of the HS codes.
As we mentioned earlier, there are essentially two types of customs duties. With ad valorem tariffs, a percentage is applied to the value of the imported products. Non-ad valorem tariffs are lump sum amounts usually calculated using quantities, for example, ¢10 a kilogram. The WTO database provides the ad valorem or non-ad valorem tariff for each product, for the country or region in question. Note that, in many cases, tariffs are zero as the products are already exempt from duty. For high-level categories, the WTO database provides the average ad valorem tariff within the group, and the total number of non-ad valorem tariffs recorded for the various products in the category. These two metrics appear in tables 4 and 5 on pages 12 and 15. The
tables also feature the value of the trade between Canada and the European Union for each top-level category. They also show the percentage of products in each category that is exempt from customs duties.8
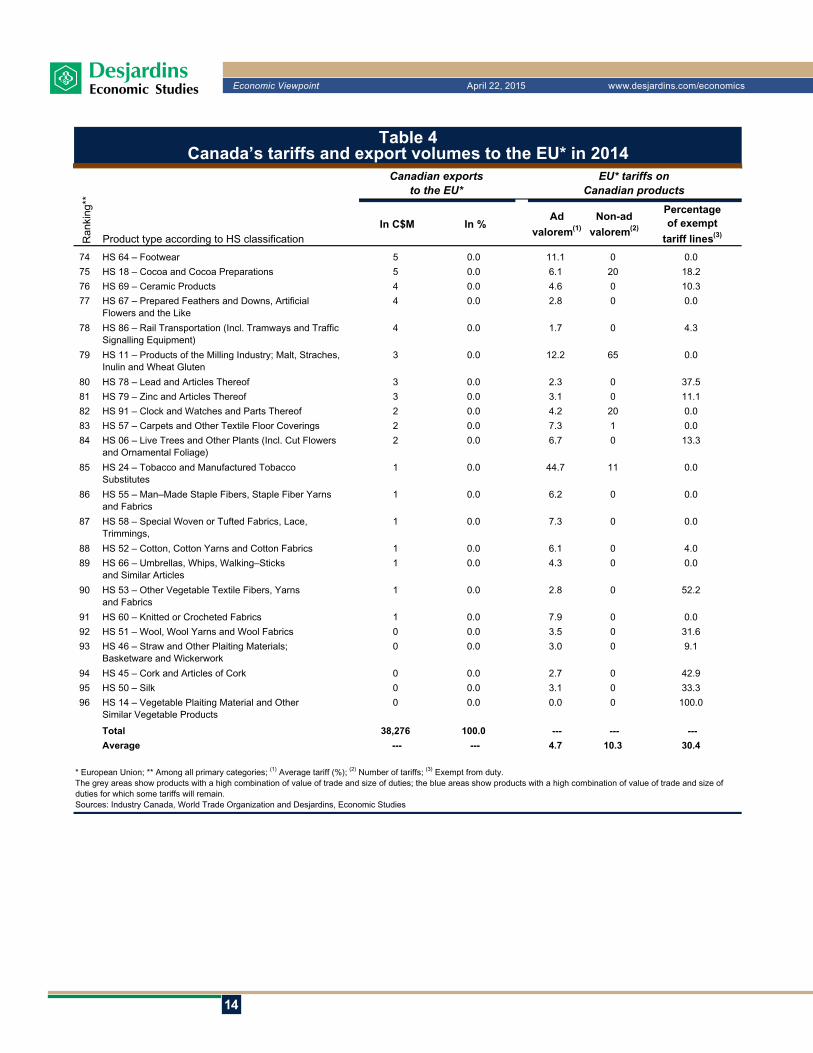
On average, Canadian exports to the European Union are subject to an ad valorem tariff of 4.7%. There are an average of nearly ten non-ad valorem tariffs per category. In contrast, Canadian imports from the European Union are subject to an average ad valorem tariff of 3.1%; nearly four non-ad valorem tariffs are recorded on average per category. However, individual results for each category vary widely. On one hand, numerous categories are already tariff exempt. On the other, some categories are subject to very high tariffs.
ProDUCts thAt wiLL BeneFitTo pinpoint the products that will get particular benefit from CETA and the elimination of duties, we could simply try to identify the products that currently face the highest duties. However, this approach would not take into consideration the structure of trade between Canada and the nations that belong to the European Union. For CETA to have a big impact on a product category, it would have to be subject to customs tariffs, and the value of trade would also have to be substantial. With this in mind, in the grey areas in tables 4 and 5 on pages 12 and 15 we identified several product groups with a substantial combination of trade value and tariff size. Some categories that are subject to tariffs that are, all in all, fairly low were kept because they represent a large proportion of the value of trade. Other categories with lower trade volume were also retained because they are subject to fairly high tariffs. The products listed in the grey areas are the products that will benefit the most from CETA’s implementation, for both exports and imports. Some product groups are also listed in the blue area. These products also show a substantial combination of trade value and tariff size, but will continue to face some customs duties once CETA is in effect, because they are included in the exceptions.
For exported products, category HS 71 leads the way, primarily due to gold exports to the European Union. This category is followed by HS 27 (primarily oil and natural gas exports), HS 84 (primarily industrial machinery and appliances) and HS 88 (aviation products). These four categories alone account for nearly half of Canada’s exports to the European Union. Eliminating tariffs will be of particular benefit to the aviation sector, as it is subject to a fairly high average ad valorem tariff and all of the products
Graph 7 – Ontario and Quebec account for nearly 77% of goods imports from the European Union
0
3
6
9
12
15
18
21
24
27
Ont
.
Que
.
N.S
.
B.C
.
Alta
.
Man
.
N.B
.
Sas
k.
N.L
.
Nun
avut
Yuk
on
P.E
.I.
N.W
.T. 0
3
6
9
12
15
18
21
24
27
Goods imports from the European Unionby province and territory in 2014
In C$B In C$B
Sources: Industry Canada and Desjardins, Economic Studies
8 This column shows the percentage of tariff lines (each line corresponds to a specific product) within the category that are exempt from duty.
7
Economic Viewpoint April 22, 2015 www.desjardins.com/economics
in this category are subject to some kind of tariff. As for the sector with high growth potential, category HS 03 (fish and crustaceans) is currently subject to very high ad valorem tariffs on average and only 7% of products are exempt from duty. Similarly, HS 76 (aluminum), HS 39 (plastics and plastic articles) and HS 87 (vehicles) also have good potential.
For Canadian imports from European Union member nations, there is more dispersion among the various categories, so the list of product categories that could get a lot from tariff elimination is slightly larger. It includes HS 84 (primarily industrial machinery and mechanical appliances), HS 87 (vehicles), HS 27 (primarily oil and natural gas imports), HS 85 (electrical and electronic machinery and appliances), and HS 90 (medical instruments).
For example, the average ad valorem tariff on vehicles imported from the European Union is 3.6% and more than half of the products in this category are subject to duty. The gradual elimination9 of tariffs on this category should therefore result in lower prices for motor vehicles imported from Europe, something that will make fans of German, Italian and British cars happy.
Although import volumes are lower at this point, numerous products seem to have attractive growth potential once tariffs are removed. For example, category HS 62 (apparel and clothing accessories) is currently subject to very high ad valorem tariffs; over 90% of products carry customs duties. Category HS 64 (footwear) is in a similar situation.
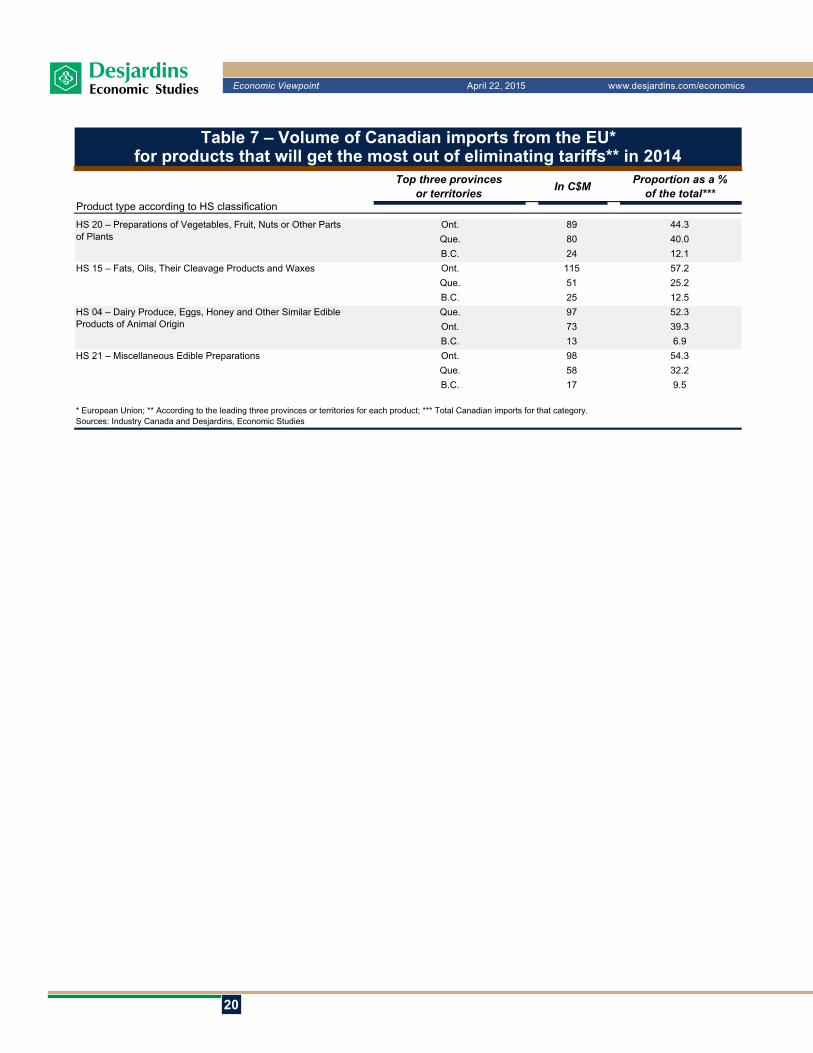
BUsiness oPPortUnities For every ProvinCeThe CETA between Canada and the European Union will create benefits nationwide. For clarification purposes, tables 6 and 7 on pages 18 and 19 show the volume of trade between Canada and the European Union for every product category identified as one that could get particular benefit from removing tariffs.10 The three provinces or territories with the highest volume of trade were selected for each of these categories, which means that Ontario and Quebec often top the list for such trade. Not surprising, given that the two provinces alone account for nearly 70% of trade with the European Union.
That being said, some results are worthy of mention. The Northwest Territories are front and centre in terms of Canadian precious metal exports. Newfoundland and
Labrador exports a lot of oil and natural gas to Europe. Saskatchewan is especially active in exporting grains and vegetables. The Atlantic provinces are very present in the seafood trade. For Quebec, the focus is primarily on exports of aviation products, as the province accounts for more than 85% of Canada’s exports to the European Union in this category. The province is also in very good position in terms of aluminum exports. Note, however, that the presence of port infrastructures, substantial gateways for certain product types, can skew the data somewhat for some provinces. For example, Quebec shows a high level of exports of automotive products to the European Union. However, there is reason to think that the fact that vehicles and parts manufactured in Ontario are shipped via the Port of Montreal inflates this result.
As for imports, the relative importance of the target product categories within the provinces is more of a reflection of each region’s economic weight. There is also some skewing. For example, Nova Scotia leads the way for imports of motor vehicles. Obviously, this isn’t because Nova Scotians have a strong taste for European cars—it is due to the Port of Halifax. Some results also reflect provinces’ industrial structure. For example, Quebec imports a lot of aviation products because of the inputs the industry uses. The same applies to Ontario’s imports of automotive products.
For CAnADA’s eConoMy, the BeneFits wiLL Be extensiveWill CETA be a good thing for Canada? As Canada is in a deficit position in the trade in goods and services with the European Union (the value of imports is higher than the value of exports), some could think that Canadians will automatically lose if trade between the two zones is liberalized. However, the reality is a lot more complicated. Both economies will benefit from the business opportunities generated by lifting nearly all of the restrictions on the trade in goods and services and investment. Canadian exporters will have free access to European markets, giving them greater growth potential. Moreover, eliminating customs duties on numerous imported products will lower consumer prices on such goods, making households happy. Thus, the variety of benefits yielded by liberalizing trade have prompted many countries to enter into numerous trade agreements in the last few years. Each such agreement had to be ratified by a country with a trade deficit.
According to the joint 2008 study by Canada and the European Union, the spin-offs from implementing CETA would add an average of 0.77% a year to Canada’s GDP. However, this estimate was calculated in 2008, at a time when the Canadian economy had greater growth potential. If this assessment were to be done today, the upside
9 A 6- to 8-year phasing-out period is stipulated for the gradual elimination of tariffs on numerous products in this category.10 These categories correspond to the grey and blue areas in tables 4 and 5 on pages 12 and 15.

8
Economic Viewpoint April 22, 2015 www.desjardins.com/economics
impact on Canadian GDP would likely be a little smaller. However, the forecast GDP gain is much smaller for the European Union, which is very surprising, given Canada’s deficit position. The gap is due to the fact that the European Union has a much bigger weight in Canada’s international trade than Canada does in the European Union’s total trade.
CETA should also make Canada more attractive on the global economic scene. Given free access to European markets, along with the agreement already in force with the United States and Mexico, a variety of foreign businesses could opt to set up shop in Canada. This would help Canada take its place in the global production chain. Note that the structure of global trade is becoming more and more integrated, creating value chains within multinationals and also within most businesses, which are outsourcing a growing share of their output.
CETA should also allow Canada to increase its exports to the European Union, creating better geographic diversification for Canada’s exports. Currently, Canadian exports are heavily focused on the United States, which means that Canada is highly dependent on the U.S. growth cycle. Increasing the European Union’s weight in Canada’s international trade would reduce this country’s exposure to its primary trade partner.
That being said, CETA’s benefits will not be uniformly distributed across the country. Companies that export goods that will benefit the most from eliminating tariffs within the European Union will get the most out of liberalizing trade. Conversely, companies that produce goods in import categories that are the most favoured by the disappearance of Canadian customs duties will face stronger competition. The heightened competition could prompt some Canadian companies to seek efficiency gains by improving productivity and reducing their cost structure. In the end, this would not be a bad thing for the Canadian economy as a whole. Moreover, the federal and provincial governments could contemplate instituting programs to help the most vulnerable firms deal with the competition from Europe.
The distortion between sectors that will be favoured by the elimination of tariffs in Europe and those that will face greater competition here at home raises some concern, however. Potentially, we could see greater industrial specialization within Canada’s economy; on one hand, the advantaged sectors could become more important in total output while, on the other, industries facing greater competition could lose some ground. Sectoral rebalancing within Canada’s economy is not necessarily negative. However, it could make Canada’s economy more fragile by reducing its industrial diversity. In this context, transition
measures that the various tiers of government could put forward could make it easier to adapt.
For consumers, the benefits of the CETA between Canada and the European Union are fairly clear. As mentioned, eliminating tariffs on imported European products would result in reduced consumer prices on numerous goods. Also, an almost total liberalization of trade should make it possible for numerous new European products to reach Canadian soil, increasing the array of goods available for consumption.
Our analysis of the CETA between Canada and the European Union has put a lot of emphasis on the trade in goods. However, this is a broad accord, which also covers the trade in services, direct investment, access to public contracts and enhanced mobility for specialized labour. The benefits of greater flexibility in this type of trade between Canada and the European Union are much more difficult to appraise. That being said, greater trade flexibility between the two zones will create business opportunities for Canadian firms and lead to better efficiency in both Canada and Europe.
Lastly, even though free access to European Union markets could benefit many Canadian firms, as noted in this Economic Viewpoint, the fact remains that most countries in the European Union are economically mature, meaning that most European Union nations have more limited potential for economic growth. Under these conditions, it could be hard for some Canadian businesses to carve out a place in these markets. Over the medium and long run, it would be best for the federal government to enter into additional free trade agreements with a focus on countries and zones with high growth potential, such as emerging nations in Asia and South America. The negotiations now underway with India, and negotiations in the framework of the Trans-Pacific Partnership (which includes the United States, Mexico, Peru, Chile, Japan, Malaysia, Singapore, Brunei, Vietnam, Australia and New Zealand) seem especially promising.
Benoit P. DurocherSenior Economist

9
Economic Viewpoint April 22, 2015 www.desjardins.com/economics
Annex
In C$M In % In C$M In %
1 United Kingdom 15,226 39.3 1 Germany 15,968 27.62 Italy 4,171 10.8 2 United Kingdom 9,173 15.93 Netherlands 3,845 9.9 3 Italy 6,418 11.14 Belgium 3,524 9.1 4 France 5,919 10.25 France 3,313 8.5 5 Netherlands 3,673 6.46 Germany 3,138 8.1 6 Spain 2,202 3.87 Spain 1,127 2.9 7 Belgium 2,066 3.68 Malta 836 2.2 8 Sweden 1,825 3.29 Finland 599 1.5 9 Austria 1,684 2.9
10 Ireland 507 1.3 10 Poland 1,594 2.811 Sweden 392 1.0 11 Ireland 1,496 2.612 Poland 346 0.9 12 Finland 1,404 2.413 Austria 272 0.7 13 Denmark 1,078 1.914 Denmark 266 0.7 14 Hungary 549 1.015 Portugal 226 0.6 15 Czech Republic 499 0.916 Czech Republic 130 0.3 16 Portugal 477 0.817 Greece 117 0.3 17 Romania 423 0.718 Romania 108 0.3 18 Slovakia 316 0.519 Bulgaria 97 0.3 19 Lithuania 231 0.420 Luxembourg 93 0.2 20 Greece 186 0.321 Hungary 91 0.2 21 Luxembourg 164 0.322 Cyprus 88 0.2 22 Slovenia 126 0.223 Lithuania 76 0.2 23 Bulgaria 121 0.224 Slovenia 63 0.2 24 Estonia 96 0.225 Slovakia 34 0.1 25 Croatia 55 0.126 Estonia 33 0.1 26 Malta 46 0.127 Latvia 31 0.1 27 Latvia 33 0.128 Croatia 23 0.1 28 Cyprus 3 0.0
Total EU* 38,747 100.0 Total EU* 57,821 100.0
Relative weightin Canadian imports from the EU*
* European Union.Sources: Industry Canada and Desjardins, Economic Studies
Table 1 – Relative weightof EU* member nations in Canada’s trade in goods in 2014
Relative weightin Canadian exports to the EU*
10
Economic Viewpoint April 22, 2015 www.desjardins.com/economics
In C$M In % In C$M In %
1 United Kingdom 4,734 32.9 1 United Kingdom 5,608 29.62 France 2,272 15.8 2 France 2,826 14.93 Germany 1,995 13.9 3 Germany 2,199 11.64 Netherlands 963 6.7 4 Netherlands 1,714 9.15 Ireland 807 5.6 5 Ireland 1,348 7.16 Belgium/Luxembourg 789 5.5 6 Greece 965 5.17 Other** 584 4.1 7 Italy 941 5.08 Sweden 546 3.8 8 Other** 818 4.39 Italy 461 3.2 9 Belgium/Luxembourg 805 4.3
10 Greece 270 1.9 10 Spain 504 2.711 Denmark 268 1.9 11 Sweden 334 1.812 Spain 263 1.8 12 Austria 260 1.413 Austria 179 1.2 13 Portugal 238 1.314 Finland 147 1.0 14 Denmark 237 1.315 Portugal 115 0.8 15 Finland 129 0.716 Croatia n/a n/a 16 Croatia n/a n/a
Total EU* 14,393 100.0 Total EU* 18,926 100.0
n.a.: not available* European Union; ** Bulgaria, Cyprus, Estonia, Hungary, Latvia, Lithuania, Malta, Poland, Romania, Slovakia, Slovenia and the Czech Republic.Sources: Foreign Affairs, Trade and Development Canada and Desjardins, Economic Studies
Table 2 – Relative weightof EU* member nations in Canada’s trade in services in 2013
Canadian receipts (exports) in tradein services with the EU*
Canadian payments (imports) in tradein services with the EU*

11
Economic Viewpoint April 22, 2015 www.desjardins.com/economics
In C$M In % In C$M In %
1 United Kingdom 86,087 46.0 1 Netherlands 67,805 35.42 Luxembourg 30,224 16.1 2 United Kingdom 56,745 29.63 Netherlands 17,742 9.5 3 Luxembourg 28,549 14.94 Ireland 15,976 8.5 4 France 11,016 5.85 Hungary 10,984 5.9 5 Germany 10,114 5.36 Germany 8,230 4.4 6 Belgium 4,897 2.67 France 5,745 3.1 7 Ireland 2,903 1.58 Spain 4,757 2.5 8 Sweden 2,710 1.49 Cyprus 3,362 1.8 9 Finland 2,327 1.2
10 Sweden 2,178 1.2 10 Denmark 1,375 0.711 Belgium 587 0.3 11 Italy 1,140 0.612 Italy 487 0.3 12 Austria 636 0.313 Denmark 395 0.2 13 Cyprus 595 0.314 Finland 261 0.1 14 Spain 590 0.315 Poland 202 0.1 15 Bulgaria --- 0.016 Portugal 41 0.0 16 Croatia --- 0.017 Romania 33 0.0 17 Estonia --- 0.018 Austria --- 0.0 18 Greece --- 0.019 Bulgaria --- 0.0 19 Hungary --- 0.020 Croatia --- 0.0 20 Latvia --- 0.021 Estonia --- 0.0 21 Lithuania --- 0.022 Greece --- 0.0 22 Malta --- 0.023 Latvia --- 0.0 23 Poland --- 0.024 Lithuania --- 0.0 24 Portugal --- 0.025 Malta --- 0.0 25 Czech Republic --- 0.026 Czech Republic --- 0.0 26 Romania --- 0.027 Slovakia --- 0.0 27 Slovakia --- 0.028 Slovenia --- 0.0 28 Slovenia --- 0.0
Total EU* 187,291 100.0 Total EU* 191,402 100.0
* European Union.Sources: Foreign Affairs, Trade and Development Canada and Desjardins, Economic Studies
Table 3 – Relative weight of EU* member nationsin the total stock of Canadian direct investment in 2013
Relative weightof Canadian direct investment in the EU*
Relative weightof EU* direct investment in Canada

12
Economic Viewpoint April 22, 2015 www.desjardins.com/economics
In C$M In %Ad
valorem(1)Non-ad
valorem(2)
Percentageof exempt
tariff lines(3)
1 HS 71 – Pearls, Precious Stones or Metals, Coinsand Jewellery
11,196 29.3 0.6 0 80.2
2 HS 27 – Mineral Fuels, Mineral Oils, BituminousSubstances and Mineral Waxes
3,757 9.8 0.8 0 70.6
3 HS 84 – Nuclear Reactors, Boilers, Machineryand Mechanical Appliances
3,339 8.7 1.8 0 21.4
4 HS 26 – Ores, Slag and Ash 2,603 6.8 0.0 0 100.0
5 HS 88 – Aircrafts and Spacecrafts 2,447 6.4 3.3 0 0.0
6 HS 30 – Pharmaceutical Products 1,613 4.2 0.0 0 100.0
7 HS 75 – Nickel and Articles Thereof 1,613 4.2 0.7 0 76.5
8 HS 10 – Cereals 1,315 3.4 2.2 47 32.7
9 HS 85 – Electrical or Electronic Machineryand Equipment
1,287 3.4 2.8 0 22.9
10 HS 90 – Optical, Medical , Photographic, Scientificand Technical Instrumentation
1,145 3.0 2.2 0 34.4
11 HS 12 – Oil Seeds, Oleaginous Fruits, Industrialor Medicinal Plants, Straw and Fodder
868 2.3 1.2 3 73.1
12 HS 28 – Inorganic Chemicals and Compoundsof Precious Metals and Radioactive Elements
721 1.9 4.5 0 12.1
13 HS 76 – Aluminum and Articles Thereof 593 1.5 6.4 0 2.9
14 HS 44 – Wood and Articles of Wood(Incl. Wood Charcoal)
461 1.2 2.2 0 58.3
15 HS 87 – Motor Vehicles, Trailers, Bicycles, Motorcyclesand Other Similar Vehicles
419 1.1 5.8 0 7.9
16 HS 03 – Fish, Crustaceans, Molluscs and OtherAquatic Invertebrates
364 1.0 11.1 0 7.0
17 HS 39 – Plastics and Articles Thereof 338 0.9 6.0 0 7.4
18 HS 07 – Edible Vegetables and Certain Rootsand Tubers
317 0.8 8.5 22 14.4
19 HS 48 – Paper, Paperboard and Articles Made FromThese Materials
273 0.7 0.0 0 100.0
20 HS 47 – Pulp of Wood and The Like; Waste and Scrapof Paper or Paperboard
268 0.7 0.0 0 100.0
21 HS 29 – Organic Chemicals (Including Vitamins,Alkaloids and Antibiotics)
193 0.5 4.3 5 27.9
22 HS 73 – Articles of Iron or Steel 180 0.5 1.7 0 44.4
23 HS 38 – Miscellaneous Chemical Products 176 0.5 5.4 8 5.3
24 HS 33 – Essential Oils and Resinoids, Perfumes,Cosmetics and Toilet Preparations
172 0.4 2.4 2 53.4
25 HS 72 – Iron and Steel 167 0.4 0.3 0 92.3
26 HS 89 – Ships, Boats and Floating Structures 134 0.3 1.1 0 46.3
27 HS 43 – Furskins, Artificial Fur and Related Articlesof Apparel or Clothing Accessories
129 0.3 1.2 0 61.9
28 HS 16 – Meat, Fish and Seafood Preparations 123 0.3 17.9 23 2.4
29 HS 49 – Printed Books, Newspapers, Pictures,Manuscripts and The Like
120 0.3 0.0 0 100.0
30 HS 82 – Tools, Implements, Cutlery, Spoons and Forksof Base Metals
113 0.3 3.1 0 0.0
31 HS 95 – Toys, Games, Sporting Goods and OtherGoods for Amusement
102 0.3 2.3 0 20.6
32 HS 23 – Residues and Waste from the Food Industries,and Prepared Animal Fodder
99 0.3 0.8 32 68.8
33 HS 81 – Other Base Metals, Cermets andArticles Thereof
91 0.2 3.0 0 36.0
34 HS 40 – Rubber and Articles Thereof 87 0.2 2.6 0 34.7
35 HS 08 – Edible Fruits and Nuts 86 0.2 6.4 16 20.4
Table 4Canada’s tariffs and export volumes to the EU* in 2014
Ran
king
**
Product type according to HS classification
Canadian exportsto the EU*
EU* tariffs onCanadian products

13
Economic Viewpoint April 22, 2015 www.desjardins.com/economics
In C$M In %Ad
valorem(1)Non-ad
valorem(2)
Percentageof exempt
tariff lines(3)
Table 4Canada’s tariffs and export volumes to the EU* in 2014
Ran
king
**
Product type according to HS classification
Canadian exportsto the EU*
EU* tariffs onCanadian products
36 HS 94 – Furniture, and Stuffed Furnishings; Lampsand Illuminated Signs; Prefabricated Buildings
86 0.2 2.3 0 41.0
37 HS 61 – Knitted or Crocheted Clothing and Articlesof Apparel
79 0.2 11.7 0 0.0
38 HS 17 – Sugars and Sugar Confectionery 74 0.2 6.8 39 11.8
39 HS 21 – Miscellaneous Edible Preparations 74 0.2 9.2 14 9.4
40 HS 96 – Miscellaneous Manufactured Articles 69 0.2 3.3 0 5.1
41 HS 97 – Works of Art, Collector's Pieces and Antiques 64 0.2 0.0 0 100.0
42 HS 93 – Arms and Ammunitions and Parts Thereof 63 0.2 2.2 0 22.2
43 HS 62 – Woven Clothing and Articles of Apparel 61 0.2 11.3 0 0.0
44 HS 19 – Preparations of Cereals, Flour, Starch or Milk(Including Bread and Pastry)
55 0.1 10.7 49 0.0
45 HS 83 – Miscellaneous Articles of Base Metal 52 0.1 2.5 0 8.3
46 HS 20 – Preparations of Vegetables, Fruit, Nutsor Other Parts of Plants
49 0.1 17.5 75 0.7
47 HS 34 – Soap, Washing and Lubricating Preparations,Waxes and Related Articles
48 0.1 2.0 0 54.3
48 HS 02 – Meat and Edible Meat Offal 47 0.1 5.1 186 19.1
49 HS 31 – Fertilizers 42 0.1 4.8 0 21.7
50 HS 74 – Copper and Articles Thereof 41 0.1 3.3 0 26.0
51 HS 35 – Albuminoidal Substances, Modified Starches,Glues and Enzymes
40 0.1 4.6 10 16.7
52 HS 05 – Products of Animal Origin Not ElsewhereClassified
39 0.1 0.1 0 98.3
53 HS 41 – Raw Hides, Skins (Other than Furskins)and Leather
38 0.1 2.0 0 51.1
54 HS 25 – Salt, Sulfur, Earths, Lime, Stone, Cementand Plastering Materials
35 0.1 0.2 3 86.1
55 HS 22 – Beverages, Spirits and Vinegar 31 0.1 3.9 126 41.9
56 HS 68 – Articles of Stone, Plaster, Cement, Asbestos,Mica or Similar Materials
30 0.1 1.4 0 32.7
57 HS 15 – Fats, Oils, Their Cleavage Products and Waxes 24 0.1 5.4 11 21.5
58 HS 32 – Tannins, Dyes, Pigments, Paints, Varnishes,Inks, Putty and Other Similar Substances
23 0.1 5.5 0 11.1
59 HS 70 – Glass and Glassware 20 0.1 5.0 7 3.6
60 HS 04 – Dairy Produce, Eggs, Honey and Other SimilarEdible Products of Animal Origin
19 0.0 5.8 161 5.7
61 HS 63 – Other Made–Up Textile Articles and WornClothing
14 0.0 10.1 0 3.9
62 HS 13 – Lac, Gums, Resins and Other Vegetable Sapsand Extracts
13 0.0 2.3 0 66.7
63 HS 92 – Musical Instruments 12 0.0 3.2 0 0.0
64 HS 65 – Headwear 10 0.0 2.3 0 25.0
65 HS 42 – Articles of Leather; Saddlery and Harness,Travel Goods, Handbags and Similar Containers
10 0.0 4.6 0 0.0
66 HS 59 – Coated, Impregnated, Covered or LaminatedFabrics and Industrial Textiles
10 0.0 6.1 0 0.0
67 HS 54 – Man–Made Filaments; Strip and the Like ofMan–Made Textile Materials
9 0.0 6.0 0 0.0
68 HS 36 – Explosives, Matches and Other MiscellaneousCombustible Preparations
8 0.0 6.3 0 0.0
69 HS 01 – Live Animals 7 0.0 1.2 32 55.6
70 HS 09 – Coffee, Tea, Maté and Spices 7 0.0 2.3 0 68.2
71 HS 37 – Photographic or Cinematographic Goods 6 0.0 5.5 2 7.0
72 HS 56 – Wadding, Felt, Nonwovens, Twine, Cordage,Rope, Cables and Related Articles
6 0.0 6.0 0 0.0
73 HS 80 – Tin and Articles Thereof 5 0.0 0.0 0 100.0
14
Economic Viewpoint April 22, 2015 www.desjardins.com/economics
In C$M In %Ad
valorem(1)Non-ad
valorem(2)
Percentageof exempt
tariff lines(3)
Table 4Canada’s tariffs and export volumes to the EU* in 2014
Ran
king
**
Product type according to HS classification
Canadian exportsto the EU*
EU* tariffs onCanadian products
74 HS 64 – Footwear 5 0.0 11.1 0 0.0
75 HS 18 – Cocoa and Cocoa Preparations 5 0.0 6.1 20 18.2
76 HS 69 – Ceramic Products 4 0.0 4.6 0 10.3
77 HS 67 – Prepared Feathers and Downs, ArtificialFlowers and the Like
4 0.0 2.8 0 0.0
78 HS 86 – Rail Transportation (Incl. Tramways and TrafficSignalling Equipment)
4 0.0 1.7 0 4.3
79 HS 11 – Products of the Milling Industry; Malt, Straches,Inulin and Wheat Gluten
3 0.0 12.2 65 0.0
80 HS 78 – Lead and Articles Thereof 3 0.0 2.3 0 37.5
81 HS 79 – Zinc and Articles Thereof 3 0.0 3.1 0 11.1
82 HS 91 – Clock and Watches and Parts Thereof 2 0.0 4.2 20 0.0
83 HS 57 – Carpets and Other Textile Floor Coverings 2 0.0 7.3 1 0.0
84 HS 06 – Live Trees and Other Plants (Incl. Cut Flowersand Ornamental Foliage)
2 0.0 6.7 0 13.3
85 HS 24 – Tobacco and Manufactured TobaccoSubstitutes
1 0.0 44.7 11 0.0
86 HS 55 – Man–Made Staple Fibers, Staple Fiber Yarnsand Fabrics
1 0.0 6.2 0 0.0
87 HS 58 – Special Woven or Tufted Fabrics, Lace, Trimmings,
1 0.0 7.3 0 0.0
88 HS 52 – Cotton, Cotton Yarns and Cotton Fabrics 1 0.0 6.1 0 4.0
89 HS 66 – Umbrellas, Whips, Walking–Sticksand Similar Articles
1 0.0 4.3 0 0.0
90 HS 53 – Other Vegetable Textile Fibers, Yarnsand Fabrics
1 0.0 2.8 0 52.2
91 HS 60 – Knitted or Crocheted Fabrics 1 0.0 7.9 0 0.0
92 HS 51 – Wool, Wool Yarns and Wool Fabrics 0 0.0 3.5 0 31.6
93 HS 46 – Straw and Other Plaiting Materials;Basketware and Wickerwork
0 0.0 3.0 0 9.1
94 HS 45 – Cork and Articles of Cork 0 0.0 2.7 0 42.9
95 HS 50 – Silk 0 0.0 3.1 0 33.3
96 HS 14 – Vegetable Plaiting Material and Other Similar Vegetable Products
0 0.0 0.0 0 100.0
Total 38,276 100.0 --- --- ---
Average --- --- 4.7 10.3 30.4
* European Union; ** Among all primary categories; (1) Average tariff (%); (2) Number of tariffs; (3) Exempt from duty.The grey areas show products with a high combination of value of trade and size of duties; the blue areas show products with a high combination of value of trade and size of duties for which some tariffs will remain.Sources: Industry Canada, World Trade Organization and Desjardins, Economic Studies

15
Economic Viewpoint April 22, 2015 www.desjardins.com/economics
In C$M In %Ad
valorem(1)Non-ad
valorem(2)
Percentageof exempt
tariff lines(3)
1 HS 84 – Nuclear Reactors, Boilers, Machineryand Mechanical Appliances
11,314 19.8 0.3 0 95.3
2 HS 87 – Motor Vehicles, Trailers, Bicycles, Motorcyclesand Other Similar Vehicles
6,874 12.1 3.6 0 44.3
3 HS 30 – Pharmaceutical Products 6,361 11.2 0.1 0 98.4
4 HS 27 – Mineral Fuels, Mineral Oils, BituminousSubstances and Mineral Waxes
4,149 7.3 0.7 0 90.6
5 HS 85 – Electrical or Electronic Machineryand Equipment
3,876 6.8 1.2 0 81.6
6 HS 90 – Optical, Medical , Photographic, Scientificand Technical Instrumentation
2,751 4.8 0.6 0 85.2
7 HS 22 – Beverages, Spirits and Vinegar 2,200 3.9 2.7 43 46.8
8 HS 71 – Pearls, Precious Stones or Metals, Coinsand Jewellery
1,598 2.8 1.4 0 79.2
9 HS 88 – Aircrafts and Spacecrafts 1,505 2.6 1.0 0 88.9
10 HS 29 – Organic Chemicals (Including Vitamins,Alkaloids and Antibiotics)
1,259 2.2 0.0 0 99.6
11 HS 73 – Articles of Iron or Steel 1,252 2.2 1.4 0 78.8
12 HS 72 – Iron and Steel 1,056 1.9 0.0 0 100.0
13 HS 39 – Plastics and Articles Thereof 948 1.7 1.1 0 80.4
14 HS 38 – Miscellaneous Chemical Products 824 1.4 1.1 0 83.1
15 HS 94 – Furniture, and Stuffed Furnishings; Lampsand Illuminated Signs; Prefabricated Buildings
782 1.4 5.0 0 43.4
16 HS 40 – Rubber and Articles Thereof 718 1.3 1.7 0 77.5
17 HS 33 – Essential Oils and Resinoids, Perfumes,Cosmetics and Toilet Preparations
682 1.2 4.6 0 25.9
18 HS 48 – Paper, Paperboard and Articles MadeFrom These Materials
416 0.7 0.0 0 100.0
19 HS 43 – Furskins, Artificial Fur and Related Articlesof Apparel or Clothing Accessories
372 0.7 3.5 0 70.8
20 HS 64 – Footwear 346 0.6 12.1 0 28.7
21 HS 19 – Preparations of Cereals, Flour, Starch or Milk(Including Bread and Pastry)
345 0.6 4.1 38 16.0
22 HS 82 – Tools, Implements, Cutlery, Spoonsand Forks of Base Metals
331 0.6 3.8 0 46.1
23 HS 62 – Woven Clothing and Articles of Apparel 315 0.6 15.9 0 6.7
24 HS 76 – Aluminum and Articles Thereof 314 0.6 1.3 0 78.6
25 HS 18 – Cocoa and Cocoa Preparations 295 0.5 3.0 2 47.7
26 HS 49 – Printed Books, Newspapers, Pictures,Manuscripts and The Like
279 0.5 0.0 0 100.0
27 HS 69 – Ceramic Products 267 0.5 4.0 0 39.1
28 HS 28 – Inorganic Chemicals and Compoundsof Precious Metals and Radioactive Elements
266 0.5 0.0 0 99.7
29 HS 83 – Miscellaneous Articles of Base Metal 255 0.4 2.4 0 60.2
30 HS 32 – Tannins, Dyes, Pigments, Paints, Varnishes,Inks, Putty and Other Similar Substances
233 0.4 1.5 0 76.1
31 HS 68 – Articles of Stone, Plaster, Cement, Asbestos,Mica or Similar Materials
217 0.4 3.0 0 45.2
32 HS 70 – Glass and Glassware 217 0.4 0.1 0 98.8
33 HS 42 – Articles of Leather; Saddlery and Harness,Travel Goods, Handbags and Similar Containers
209 0.4 7.8 0 18.3
34 HS 44 – Wood and Articles of Wood(Incl. Wood Charcoal)
204 0.4 1.2 0 72.4
35 HS 20 – Preparations of Vegetables, Fruit, Nutsor Other Parts of Plants
201 0.4 5.3 0 40.3
36 HS 15 – Fats, Oils, Their Cleavage Products and Waxes 201 0.4 4.7 2 34.5
Table 5Canada’s tariffs and import volumes from the EU* in 2014
Ran
king
**
Product type according to HS classification
Canadian importsfrom the EU*
Canadian tariffs onEU* products

16
Economic Viewpoint April 22, 2015 www.desjardins.com/economics
In C$M In %Ad
valorem(1)Non-ad
valorem(2)
Percentageof exempt
tariff lines(3)
Table 5Canada’s tariffs and import volumes from the EU* in 2014
Ran
king
**
Product type according to HS classification
Canadian importsfrom the EU*
Canadian tariffs onEU* products
37 HS 04 – Dairy Produce, Eggs, Honey and Other SimilarEdible Products of Animal Origin
186 0.3 6.0 76 10.4
38 HS 21 – Miscellaneous Edible Preparations 181 0.3 5.7 7 31.8
39 HS 95 – Toys, Games, Sporting Goods and OtherGoods for Amusement
180 0.3 0.8 0 88.7
40 HS 34 – Soap, Washing and Lubricating Preparations,Waxes and Related Articles
165 0.3 4.7 0 25.4
41 HS 61 – Knitted or Crocheted Clothing and Articlesof Apparel
146 0.3 17.1 0 3.9
42 HS 35 – Albuminoidal Substances, Modified Starches,Glues and Enzymes
138 0.2 3.7 4 43.3
43 HS 75 – Nickel and Articles Thereof 133 0.2 0.1 0 97.1
44 HS 08 – Edible Fruits and Nuts 127 0.2 0.8 19 84.1
45 HS 97 – Works of Art, Collector's Pieces and Antiques 125 0.2 0.9 0 85.7
46 HS 26 – Ores, Slag and Ash 124 0.2 0.0 0 100.0
47 HS 31 – Fertilizers 123 0.2 0.0 0 100.0
48 HS 93 – Arms and Ammunitions and Parts Thereof 118 0.2 4.0 0 21.3
49 HS 09 – Coffee, Tea, Maté and Spices 107 0.2 0.9 0 70.9
50 HS 96 – Miscellaneous Manufactured Articles 102 0.2 5.9 0 24.8
51 HS 74 – Copper and Articles Thereof 98 0.2 0.3 0 92.0
52 HS 89 – Ships, Boats and Floating Structures 93 0.2 16.2 0 16.2
53 HS 17 – Sugars and Sugar Confectionery 82 0.1 4.0 26 29.4
54 HS 02 – Meat and Edible Meat Offal 80 0.1 2.6 36 66.2
55 HS 59 – Coated, Impregnated, Covered or LaminatedFabrics and Industrial Textiles
70 0.1 2.8 0 45.3
56 HS 07 – Edible Vegetables and Certain Rootsand Tubers
64 0.1 2.3 50 48.6
57 HS 12 – Oil Seeds, Oleaginous Fruits, Industrialor Medicinal Plants, Straw and Fodder
63 0.1 0.6 0 91.7
58 HS 51 – Wool, Wool Yarns and Wool Fabrics 62 0.1 0.1 0 93.4
59 HS 56 – Wadding, Felt, Nonwovens, Twine, Cordage,Rope, Cables and Related Articles
58 0.1 2.5 0 72.5
60 HS 06 – Live Trees and Other Plants (Incl. Cut Flowers 57 0.1 4.8 0 39.6
61 HS 55 – Man–Made Staple Fibers, Staple Fiber Yarnsand Fabrics
54 0.1 0.6 0 74.2
62 HS 23 – Residues and Waste from the Food Industries,and Prepared Animal Fodder
53 0.1 0.4 3 85.5
63 HS 54 – Man–Made Filaments; Strip and the Like ofMan–Made Textile Materials
50 0.1 0.4 0 82.8
64 HS 03 – Fish, Crustaceans, Molluscs and OtherAquatic Invertebrates
48 0.1 0.4 0 90.7
65 HS 41 – Raw Hides, Skins (Other than Furskins)and Leather
48 0.1 0.0 0 100.0
66 HS 81 – Other Base Metals, Cermets andArticles Thereof
47 0.1 0.0 0 100.0
67 HS 86 – Rail Transportation (Incl. Tramways and TrafficSignalling Equipment)
47 0.1 6.6 0 29.3
68 HS 63 – Other Made–Up Textile Articles and WornClothing
47 0.1 15.6 0 5.1
69 HS 25 – Salt, Sulfur, Earths, Lime, Stone, Cementand Plastering Materials
39 0.1 0.0 0 99.3
70 HS 01 – Live Animals 39 0.1 0.5 7 86.8
71 HS 13 – Lac, Gums, Resins and Other Vegetable Sapsand Extracts
39 0.1 0.0 0 100.0
72 HS 24 – Tobacco and Manufactured TobaccoSubstitutes
38 0.1 7.0 0 3.3
73 HS 57 – Carpets and Other Textile Floor Coverings 36 0.1 11.3 0 4.8

17
Economic Viewpoint April 22, 2015 www.desjardins.com/economics
In C$M In %Ad
valorem(1)Non-ad
valorem(2)
Percentageof exempt
tariff lines(3)
Table 5Canada’s tariffs and import volumes from the EU* in 2014
Ran
king
**
Product type according to HS classification
Canadian importsfrom the EU*
Canadian tariffs onEU* products
74 HS 16 – Meat, Fish and Seafood Preparations 36 0.1 7.7 12 22.8
75 HS 11 – Products of the Milling Industry; Malt, Straches,Inulin and Wheat Gluten
35 0.1 3.8 25 28.6
76 HS 37 – Photographic or Cinematographic Goods 30 0.1 4.3 0 33.3
77 HS 92 – Musical Instruments 23 0.0 3.3 0 44.6
78 HS 10 – Cereals 23 0.0 14.1 8 76.9
79 HS 36 – Explosives, Matches and Other MiscellaneousCombustible Preparations
20 0.0 6.5 0 0.0
80 HS 60 – Knitted or Crocheted Fabrics 20 0.0 0.8 0 57.6
81 HS 45 – Cork and Articles of Cork 18 0.0 0.0 0 100.0
82 HS 79 – Zinc and Articles Thereof 16 0.0 0.2 0 94.4
83 HS 91 – Clock and Watches and Parts Thereof 16 0.0 3.3 0 56.8
84 HS 52 – Cotton, Cotton Yarns and Cotton Fabrics 14 0.0 0.6 0 73.7
85 HS 65 – Headwear 13 0.0 4.7 0 54.2
86 HS 58 – Special Woven or Tufted Fabrics, Lace, Trimmings,
13 0.0 0.2 0 96.7
87 HS 05 – Products of Animal Origin Not ElsewhereClassified
8 0.0 0.0 0 100.0
88 HS 53 – Other Vegetable Textile Fibers, Yarnsand Fabrics
4 0.0 0.0 0 97.8
89 HS 80 – Tin and Articles Thereof 3 0.0 0.2 0 95.0
90 HS 47 – Pulp of Wood and The Like; Waste and Scrapof Paper or Paperboard
3 0.0 0.0 0 100.0
91 HS 50 – Silk 2 0.0 0.0 0 100.0
92 HS 67 – Prepared Feathers and Downs, ArtificialFlowers and the Like
2 0.0 9.3 0 18.8
93 HS 78 – Lead and Articles Thereof 2 0.0 0.0 0 100.0
94 HS 66 – Umbrellas, Whips, Walking–Sticksand Similar Articles
2 0.0 4.3 0 41.7
95 HS 14 – Vegetable Plaiting Material and Other Similar Vegetable Products
1 0.0 0.0 0 100.0
96 HS 46 – Straw and Other Plaiting Materials; 0 0.0 4.4 0 10.5
Total 56,998 100.0 --- --- ---
Moyenne --- --- 3.1 3.7 63.8
* European Union; ** Among all primary categories; (1) Average tariff (%); (2) Number of tariffs; (3) Exempt from duty.The grey areas show products with a high combination of value of trade and size of duties; the blue areas show products with a high combination of value of trade and size of duties for which some tariffs will remain.Sources: Industry Canada, World Trade Organization and Desjardins, Economic Studies

18
Economic Viewpoint April 22, 2015 www.desjardins.com/economics
Top three provincesor territories
In C$MProportion as a %
of the total***
Ont. 9,490 84.8
N.W.T. 1,537 13.7
Que. 126 1.1
N.L. 2,793 74.3
B.C. 422 11.2
Ont. 243 6.5
Ont. 1,559 46.7
Que. 1,176 35.2
Alta. 218 6.5
Que. 2,090 85.4
Ont. 245 10.0
B.C. 39 1.6
Sask. 810 61.6
Que. 173 13.2
Alta. 168 12.8
Ont. 613 47.6
Que. 447 34.7
B.C. 147 11.4
Ont. 519 45.4
Que. 403 35.2
B.C. 112 9.8
Ont. 569 78.9
Sask. 79 11.0
Que. 46 6.3
Que. 534 90.0
Ont. 52 8.8
B.C. 3 0.5
Que. 192 45.7
Ont. 169 40.3
Man. 17 4.0
N.S. 192 45.7
N.L. 169 40.3
N.B. 17 4.0
Ont. 261 77.4
Que. 49 14.6
Alta. 12 3.6
Sask. 160 50.5
Ont. 107 33.8
Que. 18 5.6
Ont. 73 37.8
Que. 58 30.0
Alta. 28 14.7
Table 6 – Volume of Canadian exports to the EU*for products that will get the most out of eliminating tariffs** in 2014
Product type according to HS classification
* European Union; ** According to the leading three provinces or territories for each product; *** Total Canadian exports for that category.Sources: Industry Canada and Desjardins, Economic Studies
HS 71 – Pearls, Precious Stones or Metals, Coinsand Jewellery
HS 27 – Mineral Fuels, Mineral Oils, Bituminous Substancesand Mineral Waxes
HS 84 – Nuclear Reactors, Boilers, Machinery and MechanicalAppliances
HS 88 – Aircrafts and Spacecrafts
HS 10 – Cereals
HS 39 – Plastics and Articles Thereof
HS 07 – Edible Vegetables and Certain Roots and Tubers
HS 29 – Organic Chemicals (Including Vitamins, Alkaloidsand Antibiotics)
HS 85 – Electrical or Electronic Machinery and Equipment
HS 90 – Optical, Medical , Photographic, Scientificand Technical Instrumentation
HS 28 – Inorganic Chemicals and Compounds of PreciousMetals and Radioactive Elements
HS 76 – Aluminum and Articles Thereof
HS 87 – Motor Vehicles, Trailers, Bicycles, Motorcyclesand Other Similar Vehicles
HS 03 – Fish, Crustaceans, Molluscs and Other AquaticInvertebrates

19
Economic Viewpoint April 22, 2015 www.desjardins.com/economics
Top three provincesor territories
In C$MProportion as a %
of the total***
Ont. 4,806 42.5
Que. 3,209 28.4
B.C. 984 8.7
N.S. 3,064 44.6
Ont. 2,787 40.5
Que. 515 7.5
Que. 3,229 77.8
N.B. 545 13.1
Ont. 235 5.7
Ont. 1,637 42.2
Que. 1,300 33.6
B.C. 341 8.8
Ont. 1,580 57.4
Que. 660 24.0
Alta. 253 9.2
Ont. 1,399 87.5
Que. 159 10.0
B.C. 27 1.7
Que. 910 60.5
Ont. 337 22.4
Alta. 101 6.7
Ont. 374 29.9
Que. 237 19.0
Alta. 211 16.9
Ont. 486 51.3
Que. 285 30.1
Alta. 67 7.1
Ont. 353 42.8
Que. 272 33.0
Alta. 78 9.4
Que. 338 43.2
Ont. 256 32.8
B.C. 126 16.1
Ont. 301 41.9
Que. 286 39.9
N.S. 35 4.9
Ont. 408 59.9
Que. 236 34.6
B.C. 30 4.4
Ont. 162 46.9
Que. 151 43.7
B.C. 26 7.5
Ont. 159 46.0
Que. 146 42.2
B.C. 22 6.5
Ont. 207 65.8
Que. 76 24.0
B.C. 24 7.7
Ont. 144 68.9
Que. 34 16.1
B.C. 24 11.4
Table 7 – Volume of Canadian imports from the EU*for products that will get the most out of eliminating tariffs** in 2014
Product type according to HS classification
HS 71 – Pearls, Precious Stones or Metals, Coinsand Jewellery
HS 27 – Mineral Fuels, Mineral Oils, Bituminous Substancesand Mineral Waxes
HS 87 – Motor Vehicles, Trailers, Bicycles, Motorcyclesand Other Similar Vehicles
HS 39 – Plastics and Articles Thereof
HS 84 – Nuclear Reactors, Boilers, Machinery and MechanicalAppliances
HS 88 – Aircrafts and Spacecrafts
HS 73 – Articles of Iron or Steel
HS 85 – Electrical or Electronic Machinery and Equipment
HS 90 – Optical, Medical , Photographic, Scientific and Technical Instrumentation
HS 38 – Miscellaneous Chemical Products
HS 19 – Preparations of Cereals, Flour, Starch or Milk(Including Bread and Pastry)
HS 62 – Woven Clothing and Articles of Apparel
HS 42 – Articles of Leather; Saddlery and Harness, TravelGoods, Handbags and Similar Containers
HS 94 – Furniture, and Stuffed Furnishings; Lamps and Illuminated Signs; Prefabricated Buildings
HS 40 – Rubber and Articles Thereof
HS 33 – Essential Oils and Resinoids, Perfumes, Cosmetics and Toilet Preparations
HS 64 – Footwear
20
Economic Viewpoint April 22, 2015 www.desjardins.com/economics
Top three provincesor territories
In C$MProportion as a %
of the total***
Table 7 – Volume of Canadian imports from the EU*for products that will get the most out of eliminating tariffs** in 2014
Product type according to HS classification
Ont. 89 44.3
Que. 80 40.0
B.C. 24 12.1
Ont. 115 57.2
Que. 51 25.2
B.C. 25 12.5
Que. 97 52.3
Ont. 73 39.3
B.C. 13 6.9
Ont. 98 54.3
Que. 58 32.2
B.C. 17 9.5
HS 04 – Dairy Produce, Eggs, Honey and Other Similar EdibleProducts of Animal Origin
HS 21 – Miscellaneous Edible Preparations
* European Union; ** According to the leading three provinces or territories for each product; *** Total Canadian imports for that category.Sources: Industry Canada and Desjardins, Economic Studies
HS 20 – Preparations of Vegetables, Fruit, Nuts or Other Partsof Plants
HS 15 – Fats, Oils, Their Cleavage Products and Waxes