canada-united states law institute private financing of entrepreneurships: sources of private...
TRANSCRIPT

CANADA-UNITED STATES LAW INSTITUTE
Private Financing of Entrepreneurships:
Sources of Private Financing
2
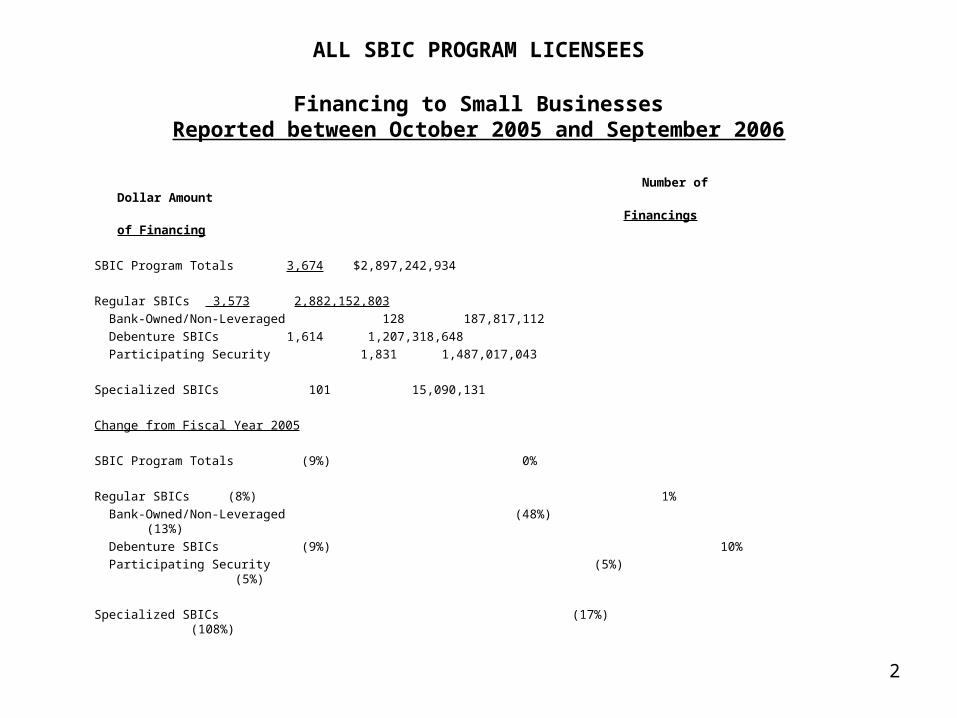
ALL SBIC PROGRAM LICENSEES
Financing to Small BusinessesReported between October 2005 and September 2006
Number of Dollar Amount
Financings of Financing
SBIC Program Totals 3,674 $2,897,242,934
Regular SBICs 3,573 2,882,152,803
Bank-Owned/Non-Leveraged 128 187,817,112
Debenture SBICs 1,614 1,207,318,648
Participating Security 1,831 1,487,017,043
Specialized SBICs 101 15,090,131
Change from Fiscal Year 2005
SBIC Program Totals (9%) 0%
Regular SBICs (8%) 1%
Bank-Owned/Non-Leveraged (48%) (13%)
Debenture SBICs (9%) 10%
Participating Security (5%) (5%)
Specialized SBICs (17%) (108%)
3
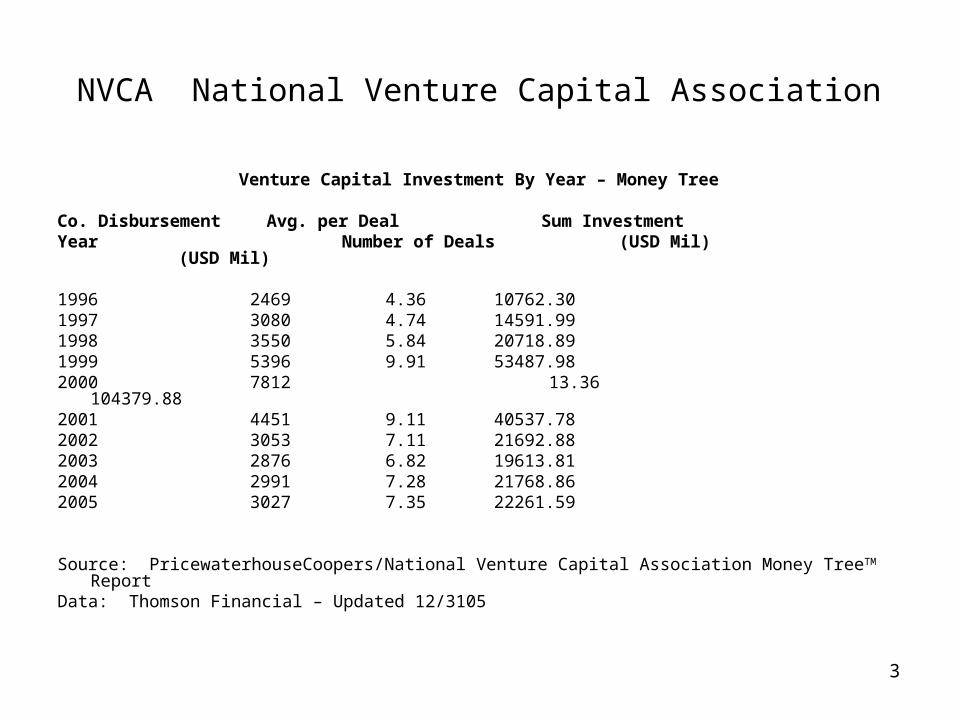
NVCA National Venture Capital Association
Venture Capital Investment By Year – Money Tree
Co. Disbursement Avg. per Deal Sum InvestmentYear Number of Deals (USD Mil) (USD Mil)
1996 2469 4.36 10762.301997 3080 4.74 14591.991998 3550 5.84 20718.891999 5396 9.91 53487.982000 7812 13.36 104379.882001 4451 9.11 40537.782002 3053 7.11 21692.882003 2876 6.82 19613.812004 2991 7.28 21768.862005 3027 7.35 22261.59
Source: PricewaterhouseCoopers/National Venture Capital Association Money TreeTM ReportData: Thomson Financial – Updated 12/3105
4
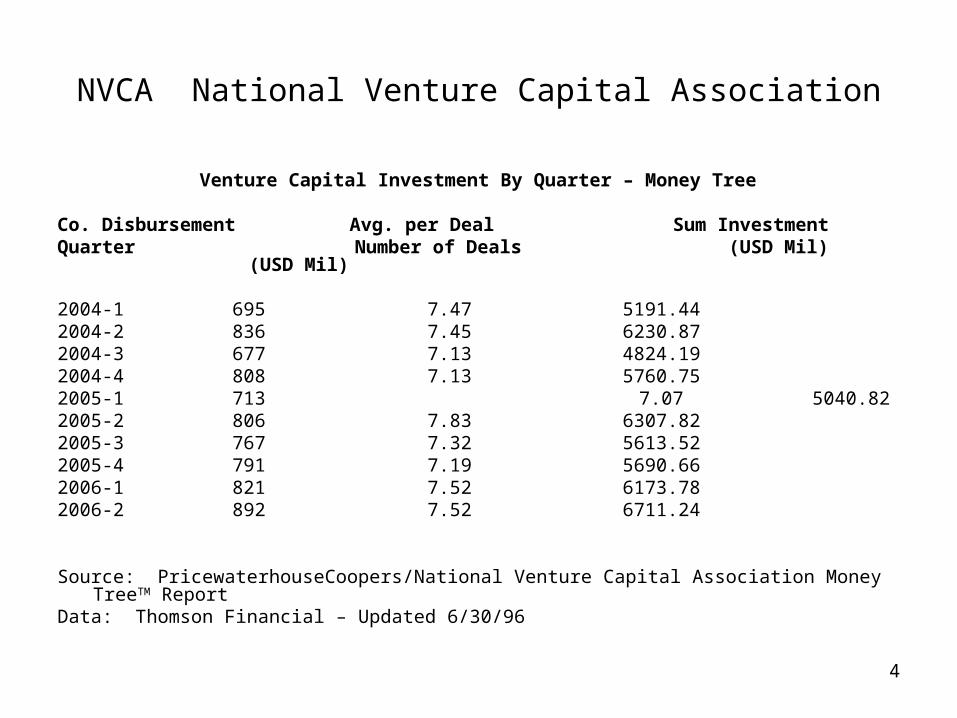
NVCA National Venture Capital Association
Venture Capital Investment By Quarter – Money Tree
Co. Disbursement Avg. per Deal Sum Investment
Quarter Number of Deals (USD Mil) (USD Mil)
2004-1 695 7.47 5191.442004-2 836 7.45 6230.872004-3 677 7.13 4824.192004-4 808 7.13 5760.752005-1 713 7.07 5040.822005-2 806 7.83 6307.822005-3 767 7.32 5613.522005-4 791 7.19 5690.662006-1 821 7.52 6173.782006-2 892 7.52 6711.24
Source: PricewaterhouseCoopers/National Venture Capital Association Money TreeTM ReportData: Thomson Financial – Updated 6/30/96
5
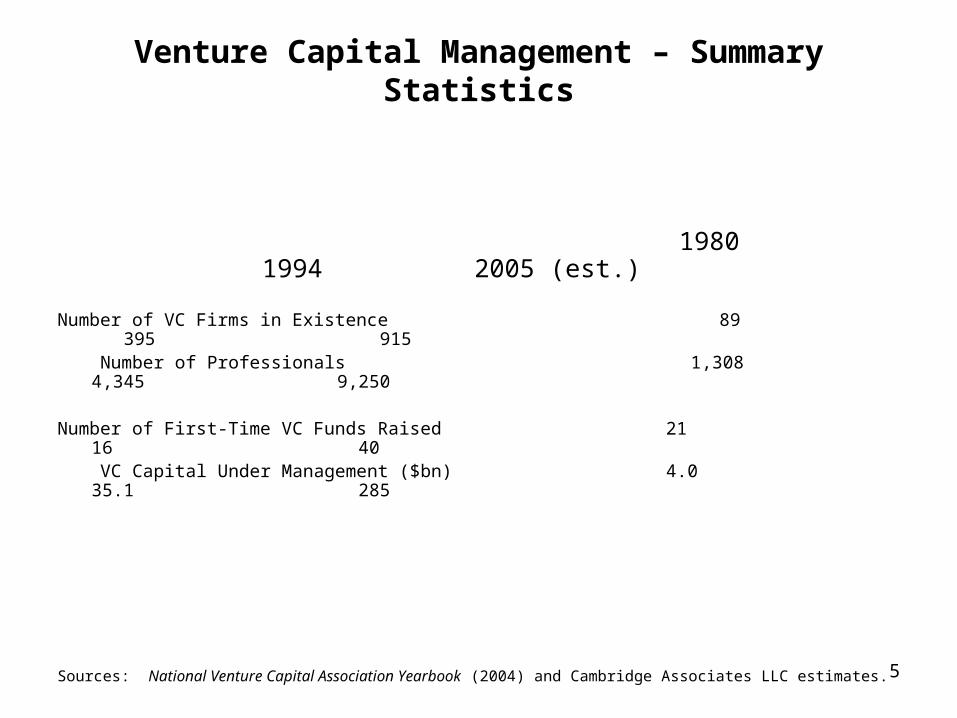
Venture Capital Management – Summary Statistics
1980 1994 2005 (est.)
Number of VC Firms in Existence 89 395 915 Number of Professionals 1,308 4,345 9,250
Number of First-Time VC Funds Raised 21 16 40 VC Capital Under Management ($bn) 4.0 35.1 285
Sources: National Venture Capital Association Yearbook (2004) and Cambridge Associates LLC estimates.
6
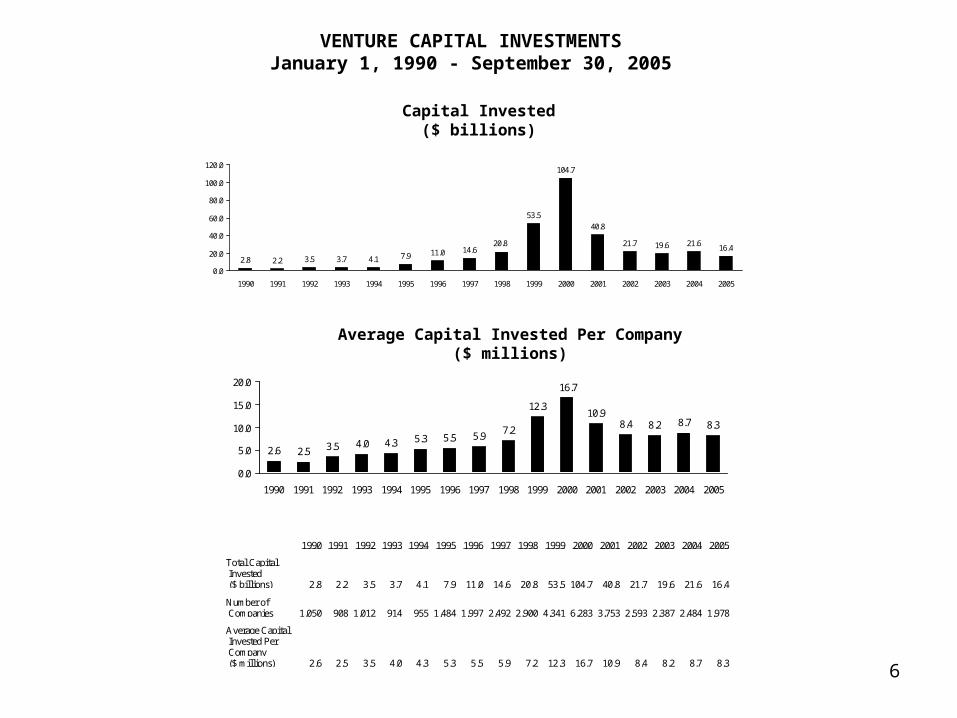
VENTURE CAPITAL INVESTMENTSJanuary 1, 1990 - September 30, 2005
Capital Invested($ billions)
2.8 2.2 3.5 3.7 4.1 7.9 11.0 14.6
53.5
104.7
40.8
21.619.620.816.4
21.7
0.0
20.0
40.0
60.0
80.0
100.0
120.0
1990 1991 1992 1993 1994 1995 1996 1997 1998 1999 2000 2001 2002 2003 2004 2005
2.6 2.5 3.5 4.0 4.3 5.3 5.5 5.97.2
12.310.9
8.4 8.2 8.7 8.3
16.7
0.0
5.0
10.0
15.0
20.0
1990 1991 1992 1993 1994 1995 1996 1997 1998 1999 2000 2001 2002 2003 2004 2005
1990 1991 1992 1993 1994 1995 1996 1997 1998 1999 2000 2001 2002 2003 2004 2005
Total Capital Invested ($ billions) 2.8 2.2 3.5 3.7 4.1 7.9 11.0 14.6 20.8 53.5 104.7 40.8 21.7 19.6 21.6 16.4
Number of Companies 1,050 908 1,012 914 955 1,484 1,997 2,492 2,900 4,341 6,283 3,753 2,593 2,387 2,484 1,978
Average Capital Invested Per Company ($ millions) 2.6 2.5 3.5 4.0 4.3 5.3 5.5 5.9 7.2 12.3 16.7 10.9 8.4 8.2 8.7 8.3
Sources: MoneyTree Survey, National Venture Capital Association, PricewaterhouseCoopers, and Thomson Venture Economics.
Note: Disbursement data include funds received from corporate co-investment.
Average Capital Invested Per Company($ millions)
7
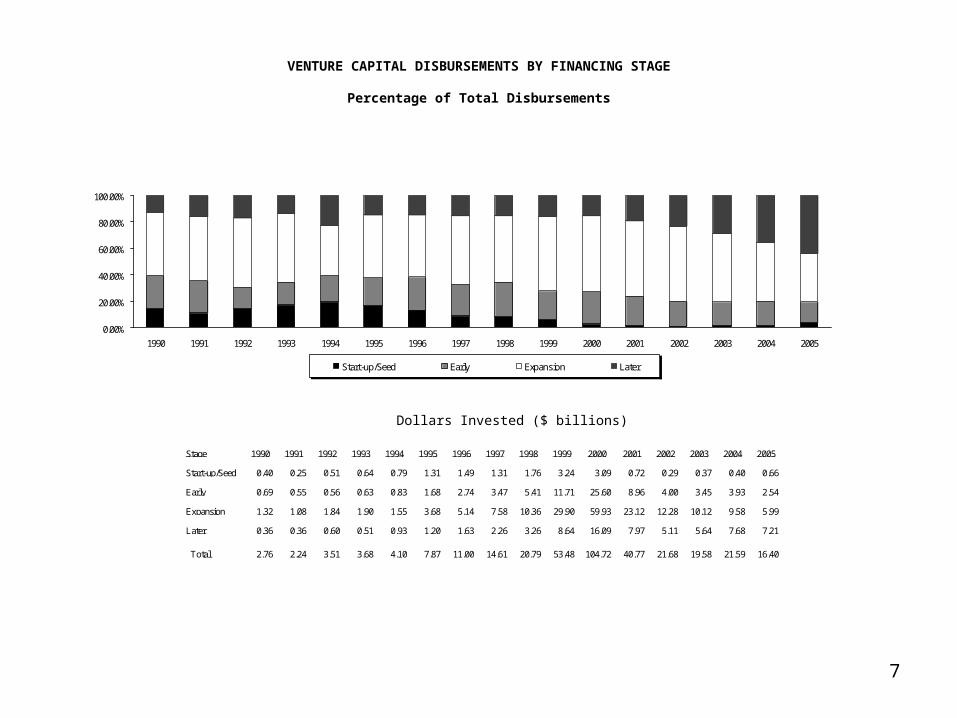
VENTURE CAPITAL DISBURSEMENTS BY FINANCING STAGE
Percentage of Total Disbursements
0.00%
20.00%
40.00%
60.00%
80.00%
100.00%
1990 1991 1992 1993 1994 1995 1996 1997 1998 1999 2000 2001 2002 2003 2004 2005
Start-up/Seed Early Expansion Later
Dollars Invested ($ billions)
Stage 1990 1991 1992 1993 1994 1995 1996 1997 1998 1999 2000 2001 2002 2003 2004 2005
Start-up/Seed 0.40 0.25 0.51 0.64 0.79 1.31 1.49 1.31 1.76 3.24 3.09 0.72 0.29 0.37 0.40 0.66
Early 0.69 0.55 0.56 0.63 0.83 1.68 2.74 3.47 5.41 11.71 25.60 8.96 4.00 3.45 3.93 2.54
Expansion 1.32 1.08 1.84 1.90 1.55 3.68 5.14 7.58 10.36 29.90 59.93 23.12 12.28 10.12 9.58 5.99
Later 0.36 0.36 0.60 0.51 0.93 1.20 1.63 2.26 3.26 8.64 16.09 7.97 5.11 5.64 7.68 7.21
Total 2.76 2.24 3.51 3.68 4.10 7.87 11.00 14.61 20.79 53.48 104.72 40.77 21.68 19.58 21.59 16.40
Sources: MoneyTree Survey, National Venture Capital Association, PricewaterhouseCoopers, and Thomson Venture Economics.
Notes: Figures may not total due to rounding. Data for 2005 are through September 30.
8
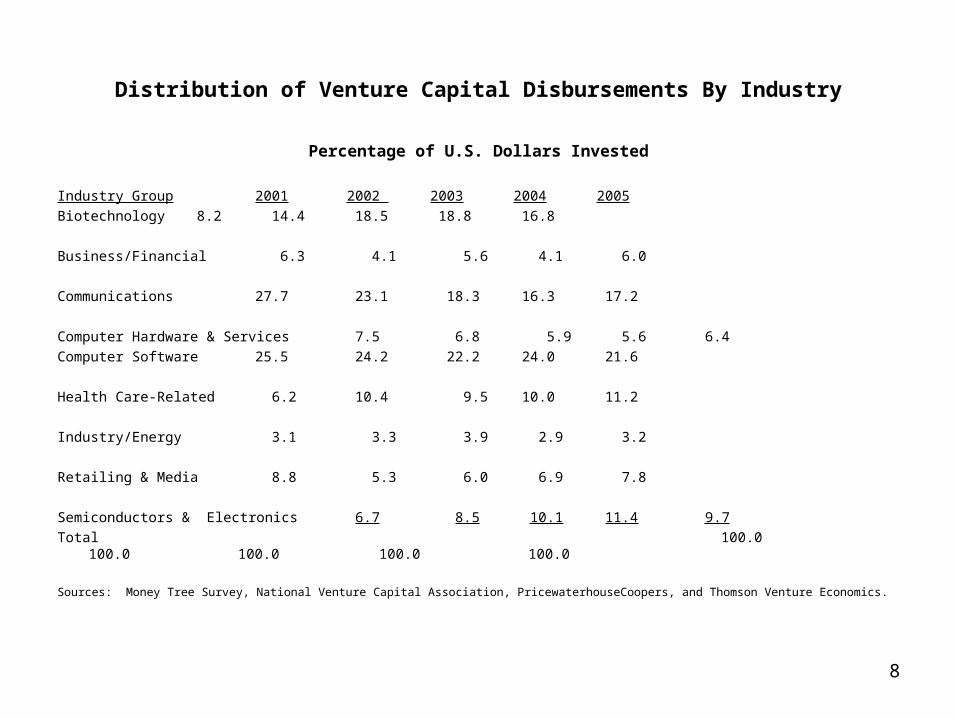
Distribution of Venture Capital Disbursements By Industry
Percentage of U.S. Dollars Invested
Industry Group 2001 2002 2003 2004 2005
Biotechnology 8.2 14.4 18.5 18.8 16.8
Business/Financial 6.3 4.1 5.6 4.1 6.0
Communications 27.7 23.1 18.3 16.3 17.2
Computer Hardware & Services 7.5 6.8 5.9 5.6 6.4
Computer Software 25.5 24.2 22.2 24.0 21.6
Health Care-Related 6.2 10.4 9.5 10.0 11.2
Industry/Energy 3.1 3.3 3.9 2.9 3.2
Retailing & Media 8.8 5.3 6.0 6.9 7.8
Semiconductors & Electronics 6.7 8.5 10.1 11.4 9.7
Total 100.0 100.0 100.0 100.0 100.0
Sources: Money Tree Survey, National Venture Capital Association, PricewaterhouseCoopers, and Thomson Venture Economics.
9
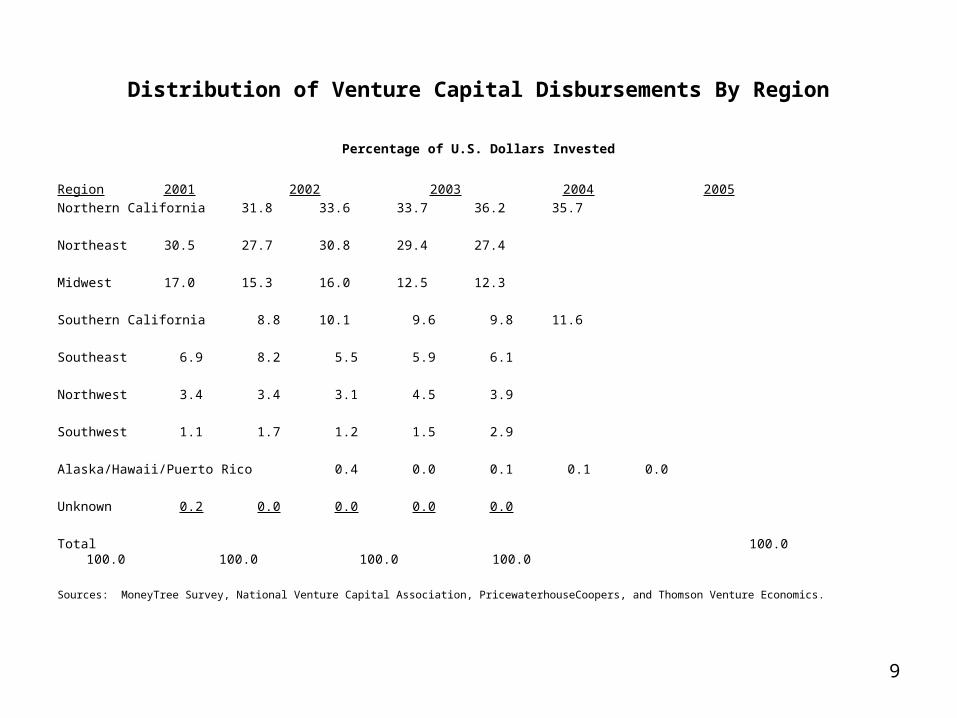
Distribution of Venture Capital Disbursements By Region
Percentage of U.S. Dollars Invested
Region 2001 2002 2003 2004 2005
Northern California 31.8 33.6 33.7 36.2 35.7
Northeast 30.5 27.7 30.8 29.4 27.4
Midwest 17.0 15.3 16.0 12.5 12.3
Southern California 8.8 10.1 9.6 9.8 11.6
Southeast 6.9 8.2 5.5 5.9 6.1
Northwest 3.4 3.4 3.1 4.5 3.9
Southwest 1.1 1.7 1.2 1.5 2.9
Alaska/Hawaii/Puerto Rico 0.4 0.0 0.1 0.1 0.0
Unknown 0.2 0.0 0.0 0.0 0.0
Total 100.0 100.0 100.0 100.0 100.0
Sources: MoneyTree Survey, National Venture Capital Association, PricewaterhouseCoopers, and Thomson Venture Economics.
10
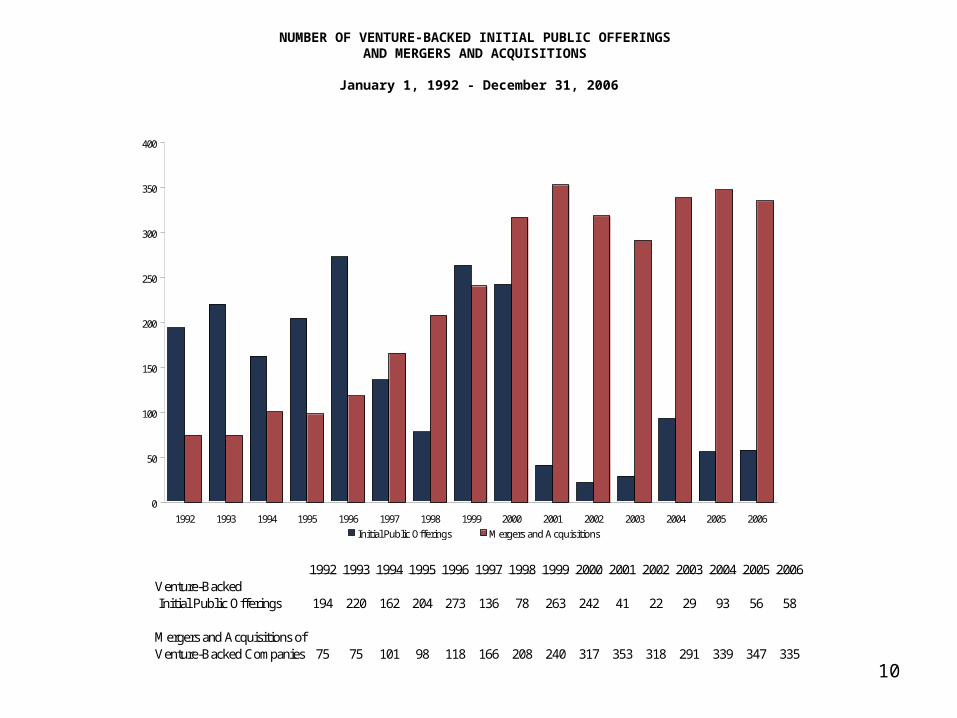
NUMBER OF VENTURE-BACKED INITIAL PUBLIC OFFERINGS AND MERGERS AND ACQUISITIONS
January 1, 1992 - December 31, 2006
0
50
100
150
200
250
300
350
400
1992 1993 1994 1995 1996 1997 1998 1999 2000 2001 2002 2003 2004 2005 2006
Initial Public Offerings Mergers and Acquisitions
1992 1993 1994 1995 1996 1997 1998 1999 2000 2001 2002 2003 2004 2005 2006Venture-Backed Initial Public Offerings 194 220 162 204 273 136 78 263 242 41 22 29 93 56 58
Mergers and Acquisitions ofVenture-Backed Companies 75 75 101 98 118 166 208 240 317 353 318 291 339 347 335
Sources: National Venture Capital Association Yearbook and Venture Economics.
Note: Data for 2006 are through December 31.213a
11
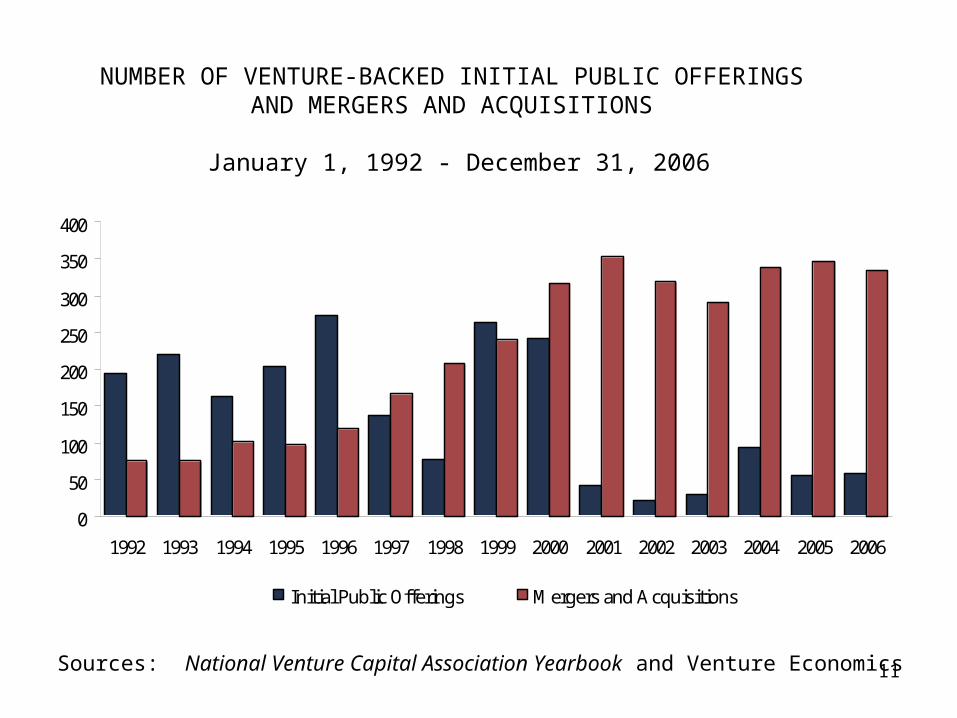
NUMBER OF VENTURE-BACKED INITIAL PUBLIC OFFERINGS AND MERGERS AND ACQUISITIONS
January 1, 1992 - December 31, 2006
0
50
100
150
200
250
300
350
400
1992 1993 1994 1995 1996 1997 1998 1999 2000 2001 2002 2003 2004 2005 2006
Initial Public Offerings Mergers and Acquisitions
Sources: National Venture Capital Association Yearbook and Venture Economics
12
PlacementTracker
With transaction data as of December 29, 2006, PlacementTracker is reporting 2006 full-year PIPE market issuances of $27.83 billion. This represents a 39% increase over the 2005 total of $20.01 billion and a 14% increase over the previous one-year issuance record set in 2000 with $24.34 billion. The fourth quarter of 2006 also set a new fourth-quarter record with $6.98 billion in PIPE Market issuances. All totals exclude Structured Equity Lines and Canadian-domiciled issuers.
Source: http://www.primenewswire.com
13
SPAC’s (Specialized Acquisition Companies)
In all, more than 50 SPAC’s filed to go public in 2005. About half of these, including Cold Spring Capital, have made it to market, raising around $1.2 billion that can be used for acquisitions. By comparison, only 11 deals went public in 2004, and those raised less than $500 million.
Source: http://www.usnews.com
14
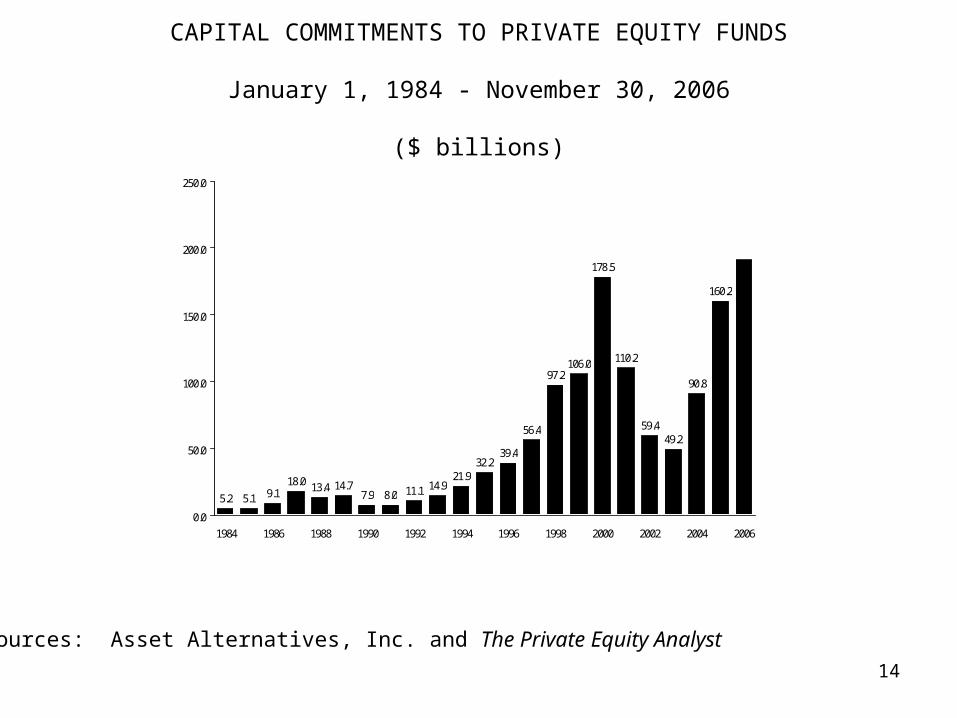
CAPITAL COMMITMENTS TO PRIVATE EQUITY FUNDS
January 1, 1984 - November 30, 2006
($ billions)
32.239.4
97.2
178.5
110.2
59.449.2
90.8
160.2
106.0
5.2 5.1 9.118.0 13.4 14.7
7.9 8.0 11.1 14.921.9
56.4
0.0
50.0
100.0
150.0
200.0
250.0
1984 1986 1988 1990 1992 1994 1996 1998 2000 2002 2004 2006
Sources: Asset Alternatives, Inc. and The Private Equity Analyst
15
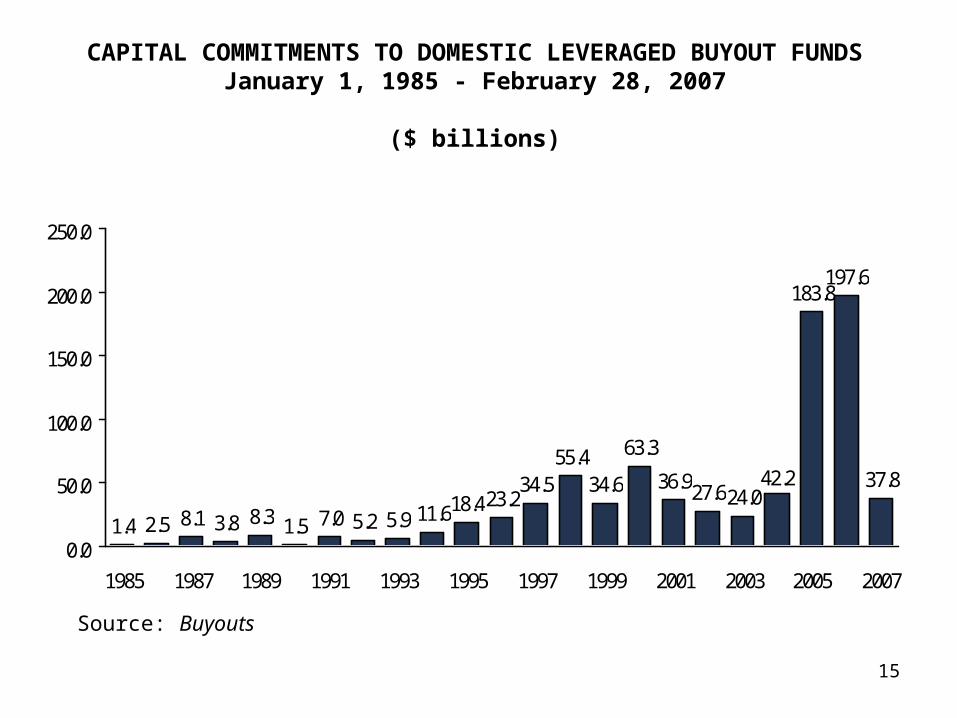
CAPITAL COMMITMENTS TO DOMESTIC LEVERAGED BUYOUT FUNDSJanuary 1, 1985 - February 28, 2007
($ billions)
1.4 2.5 8.1 3.8 8.3 1.5 7.0 5.2 5.9 11.618.423.234.5
55.434.6
63.3
36.927.624.0
183.8197.6
37.842.2
0.0
50.0
100.0
150.0
200.0
250.0
1985 1987 1989 1991 1993 1995 1997 1999 2001 2003 2005 2007
Source: Buyouts
16
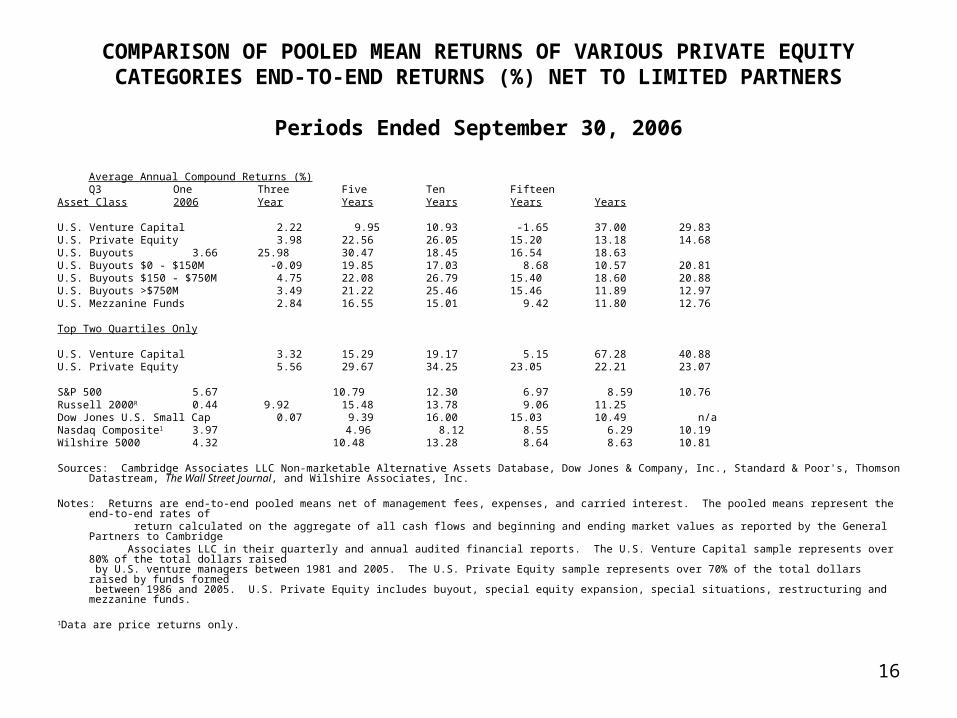
COMPARISON OF POOLED MEAN RETURNS OF VARIOUS PRIVATE EQUITY CATEGORIES END-TO-END RETURNS (%) NET TO LIMITED PARTNERS
Periods Ended September 30, 2006
Average Annual Compound Returns (%) Q3 One Three Five Ten Fifteen
Asset Class 2006 Year Years Years Years Years
U.S. Venture Capital 2.22 9.95 10.93 -1.65 37.00 29.83U.S. Private Equity 3.98 22.56 26.05 15.20 13.18 14.68U.S. Buyouts 3.66 25.98 30.47 18.45 16.54 18.63U.S. Buyouts $0 - $150M -0.09 19.85 17.03 8.68 10.57 20.81U.S. Buyouts $150 - $750M 4.75 22.08 26.79 15.40 18.60 20.88U.S. Buyouts >$750M 3.49 21.22 25.46 15.46 11.89 12.97U.S. Mezzanine Funds 2.84 16.55 15.01 9.42 11.80 12.76
Top Two Quartiles Only
U.S. Venture Capital 3.32 15.29 19.17 5.15 67.28 40.88U.S. Private Equity 5.56 29.67 34.25 23.05 22.21 23.07
S&P 500 5.67 10.79 12.30 6.97 8.59 10.76Russell 2000R 0.44 9.92 15.48 13.78 9.06 11.25Dow Jones U.S. Small Cap 0.07 9.39 16.00 15.03 10.49 n/aNasdaq Composite1 3.97 4.96 8.12 8.55 6.29 10.19Wilshire 5000 4.32 10.48 13.28 8.64 8.63 10.81
Sources: Cambridge Associates LLC Non-marketable Alternative Assets Database, Dow Jones & Company, Inc., Standard & Poor's, Thomson Datastream, The Wall Street Journal, and Wilshire Associates, Inc.
Notes: Returns are end-to-end pooled means net of management fees, expenses, and carried interest. The pooled means represent the end-to-end rates of return calculated on the aggregate of all cash flows and beginning and ending market values as reported by the General Partners to Cambridge Associates LLC in their quarterly and annual audited financial reports. The U.S. Venture Capital sample represents over 80% of the total dollars raised
by U.S. venture managers between 1981 and 2005. The U.S. Private Equity sample represents over 70% of the total dollars raised by funds formed between 1986 and 2005. U.S. Private Equity includes buyout, special equity expansion, special situations, restructuring and mezzanine funds.
1Data are price returns only.