canada test report - logitech.com ic report.pdf · dec. 27, 2010 dec. 26, 2011 rf cable na...
TRANSCRIPT

Report No.: IC110613E07 1 Report Format Version 4.0.0
CANADA TEST REPORT
REPORT NO.: IC110613E07
MODEL NO.: M-R0027 RECEIVED: June 13, 2011
TESTED: June 14 to 15, 2011 ISSUED: June 23, 2011
APPLICANT: LOGITECH FAR EAST LTD.
ADDRESS: #2 Creation Rd. 4, Science-Based Ind. Park Hsinchu Taiwan, R.O.C.
ISSUED BY: Bureau Veritas Consumer Products Services
(H.K.) Ltd., Taoyuan Branch
LAB ADDRESS : No. 81-1, Lu Liao Keng, 9th Ling,Wu Lung Tsuen, Chiung Lin Hsiang, Hsin Chu Hsien 307, Taiwan
TEST LOCATION (1): No. 81-1, Lu Liao Keng, 9th Ling,Wu Lung Tsuen, Chiung Lin Hsiang, Hsin Chu Hsien 307, Taiwan
TEST LOCATION (2): No. 49, Ln. 206, Wende Rd., Shangshan Tsuen, Chiung Lin Hsiang, Hsin Chu Hsien 307, Taiwan
This test report consists of 26 pages in total. It may be duplicated completely for legal use with the approval of the applicant. It should not be reproduced except in full, without the written approval of our laboratory. The client should not use it to claim product certification, approval, or endorsement by TAF or any government agencies. The test results in the report only apply to the tested sample.

Report No.: IC110613E07 2 Report Format Version 4.0.0
Table of Contents RELEASE CONTROL RECORD .......................................................................................3 1 CERTIFICATION.....................................................................................................4 2 SUMMARY OF TEST RESULTS...........................................................................5 2.1 MEASUREMENT UNCERTAINTY ........................................................................5 3 GENERAL INFORMATION ....................................................................................6 3.1 GENERAL DESCRIPTION OF EUT .....................................................................6 3.2 DESCRIPTION OF TEST MODES .......................................................................7 3.3 TEST MODE APPLICABILITY AND TESTED CHANNEL DETAIL ....................7 3.4 GENERAL DESCRIPTION OF APPLIED STANDARDS ....................................8 3.5 DESCRIPTION OF SUPPORT UNITS .................................................................9 3.6 CONFIGURATION OF SYSTEM UNDER TEST .................................................9 4 TEST PROCEDURES AND RESULTS .............................................................. 10 4.1 RADIATED EMISSION MEASUREMENT .......................................................... 10 4.1.1 LIMITS OF RADIATED EMISSION MEASUREMENT ...................................... 10 4.1.2 TEST INSTRUMENTS ......................................................................................... 11 4.1.3 TEST PROCEDURES .......................................................................................... 13 4.1.4 DEVIATION FROM TEST STANDARD .............................................................. 13 4.1.5 TEST SETUP ........................................................................................................ 14 4.1.6 EUT OPERATING CONDITIONS........................................................................ 14 4.1.7 TEST RESULTS.................................................................................................... 15 4.2 CONDUCTED - OUT BAND MEASUREMENT ................................................. 22 4.2.1 LIMITS OF CONDUCTED - OUT BAND MEASUREMENT ............................. 22 4.2.2 TEST INSTRUMENTS ......................................................................................... 22 4.2.3 TEST PROCEDURE............................................................................................. 22 4.2.4 DEVIATION FROM TEST STANDARD .............................................................. 22 4.2.5 EUT OPERATING CONDITION .......................................................................... 22 4.2.6 TEST RESULTS.................................................................................................... 23 5 INFORMATION ON THE TESTING LABORATORIES ..................................... 25 6 APPENDIX A - MODIFICATIONS RECORDERS FOR ENGINEERING
CHANGES TO THE EUT BY THE LAB .............................................................. 26 APPENDIX-B ........................................................................................................B-1
Report No.: IC110613E07 3 Report Format Version 4.0.0
RELEASE CONTROL RECORD
ISSUE NO. REASON FOR CHANGE DATE ISSUED IC110613E07 Original release June 23, 2011

Report No.: IC110613E07 4 Report Format Version 4.0.0
1 CERTIFICATION
PRODUCT : 2.4GHz Cordless Mouse BRAND NAME : Logitech
MODEL NO. : M-R0027
TEST SAMPLE : ENGINEERING SAMPLE APPLICANT : LOGITECH FAR EAST LTD.
TESTED : June 14 to 15, 2011 STANDARDS : Canada RSS-210 Issue 8 (2010-12)
Canada RSS-Gen Issue 3 (2010-12) ANSI C63.4-2003 ANSI C63.10-2009
The above equipment (Model: M-R0027) has been tested by Bureau Veritas Consumer Products Services (H.K.) Ltd., Taoyuan Branch, and found compliance
with the requirement of the above standards. The test record, data evaluation &
Equipment Under Test (EUT) configurations represented herein are true and accurate accounts of the measurements of the sample’s EMC characteristics under the conditions specified in this report.
PREPARED BY : , DATE: June 23, 2011 ( Claire Kuan, Specialist )
APPROVED BY :
, DATE: June 23, 2011
( May Chen, Deputy Manager )

Report No.: IC110613E07 5 Report Format Version 4.0.0
2 SUMMARY OF TEST RESULTS The EUT has been tested according to the following specifications:
APPLIED STANDARD: RSS-210; RSS-Gen Standard Section
RSS-Gen Test Type and Limit Result Remark
7.2.4 AC Power Conducted Emission NA Not Applicable
6.1 Receiver Radiated Emissions RSS-Gen Limit: Table 2
PASS Meet the requirement of limit. Minimum passing margin is -10.70dB at 2795.50MHz
Standard Section RSS-210
Test Type and Limit Result Remark
A2.9 Transmitter Radiated Emissions RSS-Gen Limit: Table 5, 6
PASS Meet the requirement of limit. Minimum passing margin is -3.40dB at 2400..00MHz
A2.9 Conducted out-band Emission PASS Meet the requirement of limit
NOTE: The “Receiver Radiated Emission measurement” and “99% Bandwidth Measurement” were recorded in Appendix B of this report.
2.1 MEASUREMENT UNCERTAINTY Where relevant, the following measurement uncertainty levels have been estimated for tests performed on the EUT as specified in CISPR 16-4:
This uncertainty represents an expanded uncertainty expressed at approximately the 95% confidence level using a coverage factor of k=2.
Measurement Value Radiated emissions (30MHz-1GHz) 3.81 dB Radiated emissions (1GHz -18GHz) 2.19 dB Radiated emissions (18GHz -40GHz) 2.56 dB

Report No.: IC110613E07 6 Report Format Version 4.0.0
3 GENERAL INFORMATION
3.1 GENERAL DESCRIPTION OF EUT
PRODUCT 2.4GHz Cordless Mouse MODEL NO. M-R0027
IC ID 4418A-MR0027 POWER SUPPLY DC 1.5V from battery
MODULATION TYPE GFSK
CARRIER FREQUENCY OF EACH CHANNEL 2405MHz ~ 2474MHz
NUMBER OF CHANNEL 12 ANTENNA TYPE PCB printed antenna with 2.82dBi antenna gain DATA CABLE NA I/O PORTS NA
ASSOCIATED DEVICES NA
NOTE:
1. The above EUT information was declared by the manufacturer and for more detailed features description, please refer to the manufacturer's specifications or User's Manual.
Report No.: IC110613E07 7 Report Format Version 4.0.0
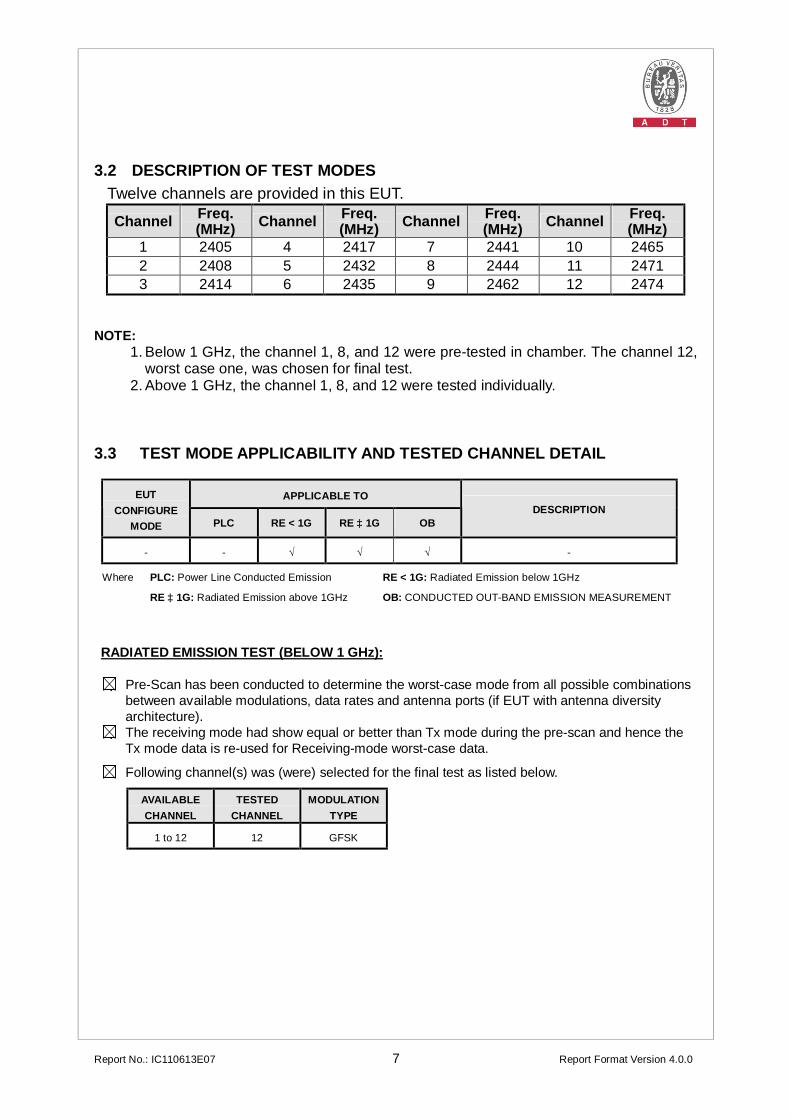
3.2 DESCRIPTION OF TEST MODES Twelve channels are provided in this EUT.
Channel Freq. (MHz) Channel Freq.
(MHz) Channel Freq. (MHz) Channel Freq.
(MHz) 1 2405 4 2417 7 2441 10 2465 2 2408 5 2432 8 2444 11 2471 3 2414 6 2435 9 2462 12 2474
NOTE:
1. Below 1 GHz, the channel 1, 8, and 12 were pre-tested in chamber. The channel 12, worst case one, was chosen for final test.
2. Above 1 GHz, the channel 1, 8, and 12 were tested individually.
3.3 TEST MODE APPLICABILITY AND TESTED CHANNEL DETAIL
APPLICABLE TO EUT CONFIGURE
MODE PLC RE < 1G RE ≥ 1G OB DESCRIPTION
- - √ √ √ -
Where PLC: Power Line Conducted Emission RE < 1G: Radiated Emission below 1GHz
RE ≥ 1G: Radiated Emission above 1GHz OB: CONDUCTED OUT-BAND EMISSION MEASUREMENT
RADIATED EMISSION TEST (BELOW 1 GHz):
Pre-Scan has been conducted to determine the worst-case mode from all possible combinations between available modulations, data rates and antenna ports (if EUT with antenna diversity architecture).
The receiving mode had show equal or better than Tx mode during the pre-scan and hence the Tx mode data is re-used for Receiving-mode worst-case data.
Following channel(s) was (were) selected for the final test as listed below.
AVAILABLE CHANNEL
TESTED CHANNEL
MODULATION TYPE
1 to 12 12 GFSK
Report No.: IC110613E07 8 Report Format Version 4.0.0
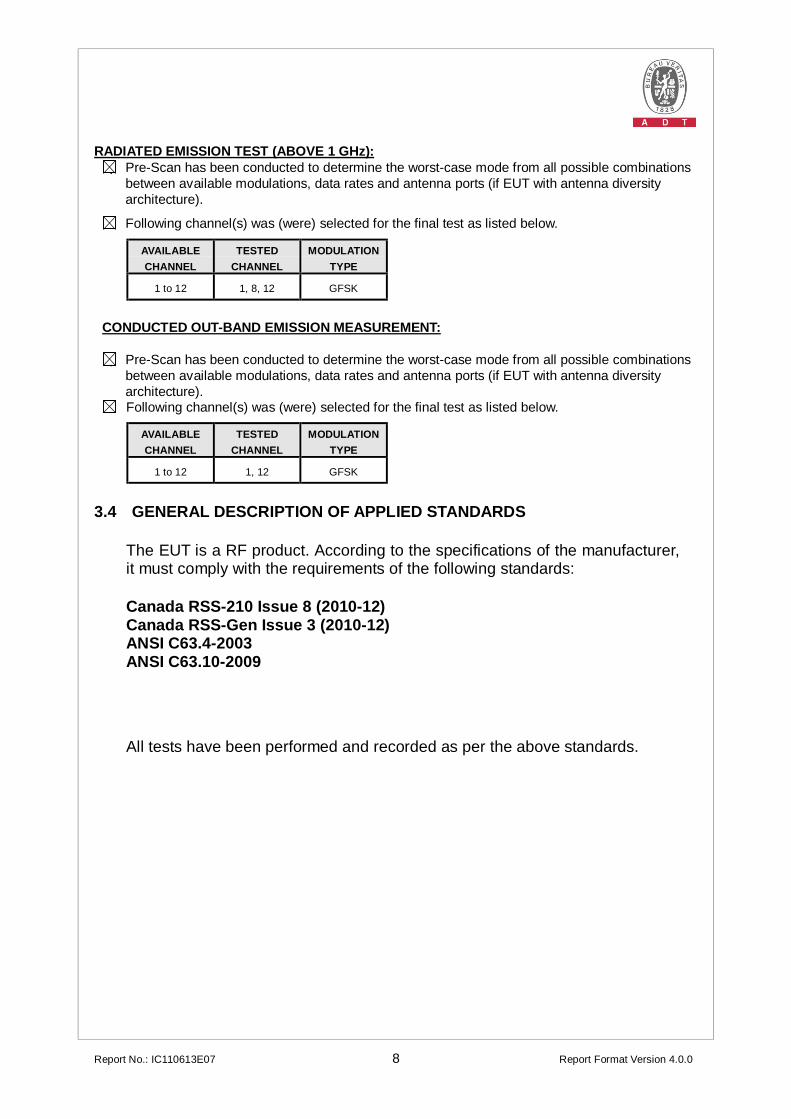
RADIATED EMISSION TEST (ABOVE 1 GHz):
Pre-Scan has been conducted to determine the worst-case mode from all possible combinations between available modulations, data rates and antenna ports (if EUT with antenna diversity architecture).
Following channel(s) was (were) selected for the final test as listed below.
AVAILABLE CHANNEL
TESTED CHANNEL
MODULATION TYPE
1 to 12 1, 8, 12 GFSK
CONDUCTED OUT-BAND EMISSION MEASUREMENT:
Pre-Scan has been conducted to determine the worst-case mode from all possible combinations between available modulations, data rates and antenna ports (if EUT with antenna diversity architecture).
Following channel(s) was (were) selected for the final test as listed below.
AVAILABLE CHANNEL
TESTED CHANNEL
MODULATION TYPE
1 to 12 1, 12 GFSK
3.4 GENERAL DESCRIPTION OF APPLIED STANDARDS
The EUT is a RF product. According to the specifications of the manufacturer, it must comply with the requirements of the following standards:
Canada RSS-210 Issue 8 (2010-12) Canada RSS-Gen Issue 3 (2010-12) ANSI C63.4-2003 ANSI C63.10-2009
All tests have been performed and recorded as per the above standards.
NOTE: It has been verified to comply with the requirements of FCC Part 15, Subpart B, Class B
(DoC). The test report has been issued separately.

Report No.: IC110613E07 9 Report Format Version 4.0.0
3.5 DESCRIPTION OF SUPPORT UNITS
The EUT has been tested as an independent unit.
3.6 CONFIGURATION OF SYSTEM UNDER TEST
TEST TABLE
EUT
Report No.: IC110613E07 10 Report Format Version 4.0.0
4 TEST PROCEDURES AND RESULTS
4.1 RADIATED EMISSION MEASUREMENT
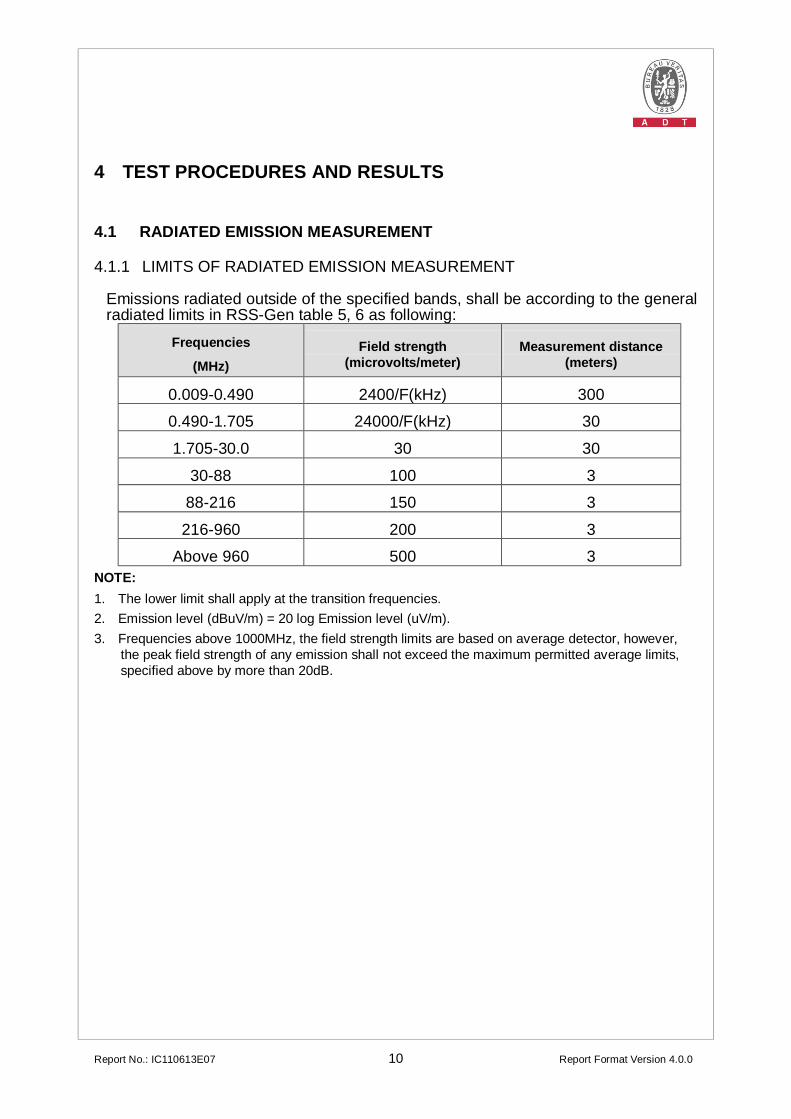
4.1.1 LIMITS OF RADIATED EMISSION MEASUREMENT
Emissions radiated outside of the specified bands, shall be according to the general radiated limits in RSS-Gen table 5, 6 as following:
Frequencies
(MHz) Field strength
(microvolts/meter) Measurement distance
(meters)
0.009-0.490 2400/F(kHz) 300
0.490-1.705 24000/F(kHz) 30
1.705-30.0 30 30
30-88 100 3
88-216 150 3
216-960 200 3
Above 960 500 3 NOTE: 1. The lower limit shall apply at the transition frequencies. 2. Emission level (dBuV/m) = 20 log Emission level (uV/m). 3. Frequencies above 1000MHz, the field strength limits are based on average detector, however,
the peak field strength of any emission shall not exceed the maximum permitted average limits, specified above by more than 20dB.

Report No.: IC110613E07 11 Report Format Version 4.0.0
4.1.2 TEST INSTRUMENTS
For Below 1GHz: DESCRIPTION & MANUFACTURER
MODEL NO. SERIAL NO. CALIBRATED DATE
CALIBRATED UNTIL
Agilent Spectrum Analyzer
E4446A MY48250254 July 14, 2010 July 13, 2011
Agilent Pre-Selector
N9039A MY46520311 July 14, 2010 July 13, 2011
Agilent Signal Generator N5181A MY49060517 July 14, 2010 July 13, 2011
Mini-Circuits Pre-Amplifier ZFL-1000VH2B AMP-ZFL-03 Nov. 16, 2010 Nov. 15, 2011
Agilent Pre-Amplifier 8449B 3008A02578 July 05, 2010 July 04, 2011 Miteq Pre-Amplifier
AFS33-18002650-30-8P-44 881786 NA NA
SCHWARZBECK Trilog Broadband Antenna
VULB 9168 9168-360 Apr. 14, 2011 Apr. 13, 2012
AISI Horn_Antenna AIH.8018
0000320091110
Nov. 12, 2010 Nov. 11, 2011
SCHWARZBECK Horn_Antenna BBHA 9170 9170-424 Oct. 08, 2010 Oct. 07, 2011
RF CABLE NA RF104-201 RF104-203 RF104-204
Dec. 27, 2010 Dec. 26, 2011
RF Cable NA CHGCAB_001 NA NA
Software ADT_Radiated_V8.7.05
NA NA NA
CT Antenna Tower & Turn Table NA NA NA NA
Note: 1. The calibration interval of the above test instruments is 12 months and the calibrations are traceable to NML/ROC and NIST/USA.
2. The horn antenna, preamplifier (model: 8449B) are used only for the measurement of emission frequency above 1GHz if tested.
3. The test was performed in 966 Chamber No. G. 4. The FCC Site Registration No. is 966073. 5. The VCCI Site Registration No. is G-137. 6. The CANADA Site Registration No. is IC 7450H-2.

Report No.: IC110613E07 12 Report Format Version 4.0.0
For Above 1GHz: DESCRIPTION & MANUFACTURER
MODEL NO. SERIAL NO. CALIBRATED DATE
CALIBRATED UNTIL
Agilent Spectrum Analyzer
E4446A MY48250253 Aug. 23, 2010 Aug. 22, 2011
Agilent Pre-Selector
N9039A MY46520310 Aug. 23, 2010 Aug. 22, 2011
Agilent Signal Generator N5181A MY49060347 July 30, 2010 July 29, 2011
Mini-Circuits Pre-Amplifier ZFL-1000VH2B AMP-ZFL-04 Nov. 16, 2010 Nov. 15, 2011
Agilent Pre-Amplifier 8449B 3008A02465 Feb. 28, 2011 Feb. 27, 2012 Miteq Pre-Amplifier
AFS33-18002650-30-8P-44 881786 NA NA
SCHWARZBECK Trilog Broadband Antenna
VULB 9168 9168-361 Apr. 14, 2011 Apr. 13, 2012
AISI Horn_Antenna AIH.8018
0000220091110
Nov. 22, 2010 Nov. 21, 2011
SCHWARZBECK Horn_Antenna BBHA 9170 9170-424 Oct. 08, 2010 Oct. 07, 2011
RF CABLE NA RF104-205 RF104-207 RF104-202
Dec. 28, 2010 Dec. 27, 2011
RF Cable NA CHHCAB_001 NA NA
Software ADT_Radiated_V8.7.05
NA NA NA
CT Antenna Tower & Turn Table NA NA NA NA
Note: 1. The calibration interval of the above test instruments is 12 months and the calibrations are traceable to NML/ROC and NIST/USA.
2. The horn antenna, preamplifier (model: 8449B) are used only for the measurement of emission frequency above 1GHz if tested.
3. The test was performed in 966 Chamber No. H. 4. The FCC Site Registration No. is 797305. 5. The CANADA Site Registration No. is IC 7450H-3.
Report No.: IC110613E07 13 Report Format Version 4.0.0
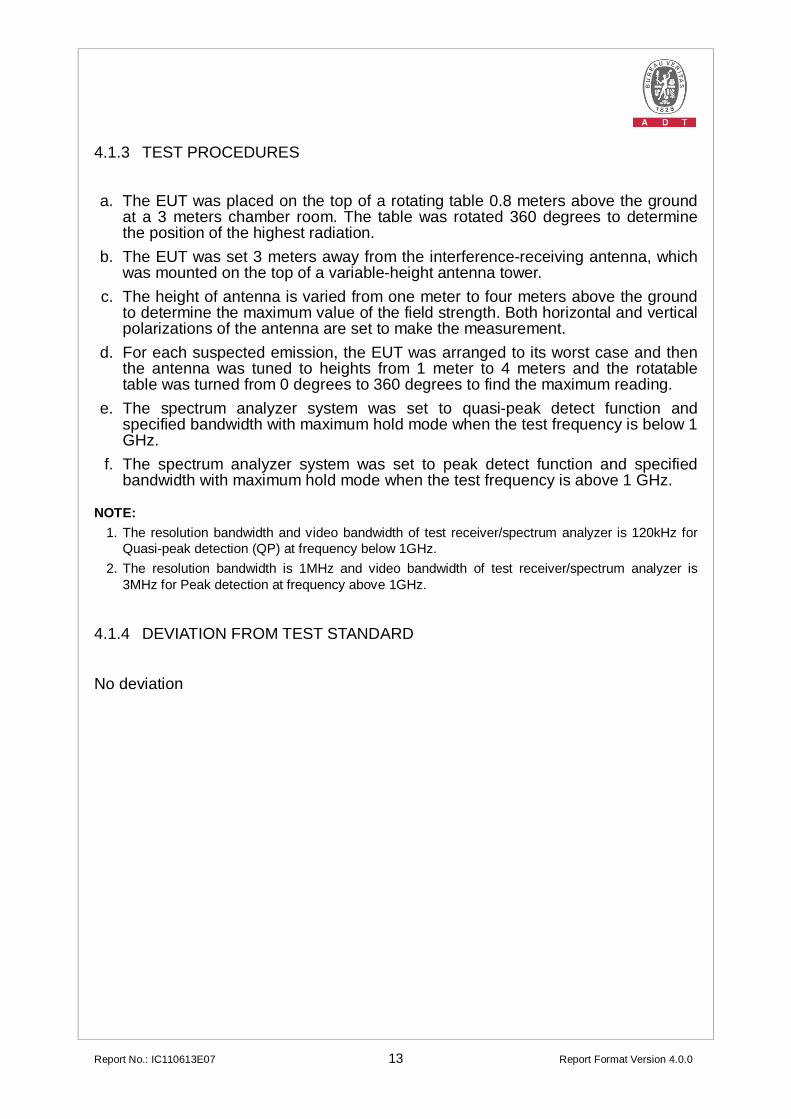
4.1.3 TEST PROCEDURES
a. The EUT was placed on the top of a rotating table 0.8 meters above the ground
at a 3 meters chamber room. The table was rotated 360 degrees to determine the position of the highest radiation.
b. The EUT was set 3 meters away from the interference-receiving antenna, which was mounted on the top of a variable-height antenna tower.
c. The height of antenna is varied from one meter to four meters above the ground to determine the maximum value of the field strength. Both horizontal and vertical polarizations of the antenna are set to make the measurement.
d. For each suspected emission, the EUT was arranged to its worst case and then the antenna was tuned to heights from 1 meter to 4 meters and the rotatable table was turned from 0 degrees to 360 degrees to find the maximum reading.
e. The spectrum analyzer system was set to quasi-peak detect function and specified bandwidth with maximum hold mode when the test frequency is below 1 GHz.
f. The spectrum analyzer system was set to peak detect function and specified bandwidth with maximum hold mode when the test frequency is above 1 GHz.
NOTE: 1. The resolution bandwidth and video bandwidth of test receiver/spectrum analyzer is 120kHz for
Quasi-peak detection (QP) at frequency below 1GHz. 2. The resolution bandwidth is 1MHz and video bandwidth of test receiver/spectrum analyzer is
3MHz for Peak detection at frequency above 1GHz.
4.1.4 DEVIATION FROM TEST STANDARD
No deviation

Report No.: IC110613E07 14 Report Format Version 4.0.0
4.1.5 TEST SETUP
For the actual test configuration, please refer to the related item – Photographs of the Test Configuration.
4.1.6 EUT OPERATING CONDITIONS
Set the EUT under transmission / receiver condition continuously at specific channel frequency.
Report No.: IC110613E07 15 Report Format Version 4.0.0
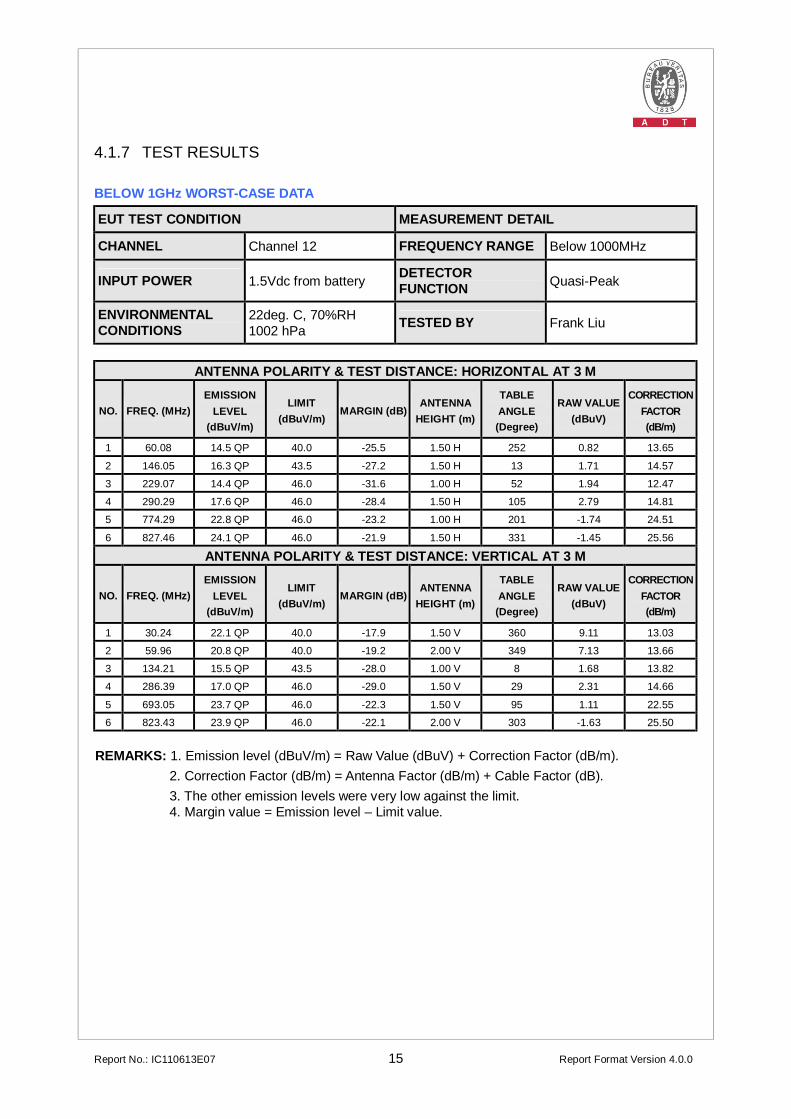
4.1.7 TEST RESULTS
BELOW 1GHz WORST-CASE DATA
EUT TEST CONDITION MEASUREMENT DETAIL
CHANNEL Channel 12 FREQUENCY RANGE Below 1000MHz
INPUT POWER 1.5Vdc from battery DETECTOR FUNCTION Quasi-Peak
ENVIRONMENTAL CONDITIONS
22deg. C, 70%RH 1002 hPa TESTED BY Frank Liu
ANTENNA POLARITY & TEST DISTANCE: HORIZONTAL AT 3 M
NO. FREQ. (MHz) EMISSION
LEVEL (dBuV/m)
LIMIT (dBuV/m)
MARGIN (dB) ANTENNA
HEIGHT (m)
TABLE ANGLE (Degree)
RAW VALUE (dBuV)
CORRECTION FACTOR (dB/m)
1 60.08 14.5 QP 40.0 -25.5 1.50 H 252 0.82 13.65
2 146.05 16.3 QP 43.5 -27.2 1.50 H 13 1.71 14.57
3 229.07 14.4 QP 46.0 -31.6 1.00 H 52 1.94 12.47
4 290.29 17.6 QP 46.0 -28.4 1.50 H 105 2.79 14.81
5 774.29 22.8 QP 46.0 -23.2 1.00 H 201 -1.74 24.51
6 827.46 24.1 QP 46.0 -21.9 1.50 H 331 -1.45 25.56
ANTENNA POLARITY & TEST DISTANCE: VERTICAL AT 3 M
NO. FREQ. (MHz) EMISSION
LEVEL (dBuV/m)
LIMIT (dBuV/m)
MARGIN (dB) ANTENNA
HEIGHT (m)
TABLE ANGLE (Degree)
RAW VALUE (dBuV)
CORRECTION FACTOR (dB/m)
1 30.24 22.1 QP 40.0 -17.9 1.50 V 360 9.11 13.03
2 59.96 20.8 QP 40.0 -19.2 2.00 V 349 7.13 13.66
3 134.21 15.5 QP 43.5 -28.0 1.00 V 8 1.68 13.82
4 286.39 17.0 QP 46.0 -29.0 1.50 V 29 2.31 14.66
5 693.05 23.7 QP 46.0 -22.3 1.50 V 95 1.11 22.55
6 823.43 23.9 QP 46.0 -22.1 2.00 V 303 -1.63 25.50
REMARKS: 1. Emission level (dBuV/m) = Raw Value (dBuV) + Correction Factor (dB/m). 2. Correction Factor (dB/m) = Antenna Factor (dB/m) + Cable Factor (dB). 3. The other emission levels were very low against the limit. 4. Margin value = Emission level – Limit value.
Report No.: IC110613E07 16 Report Format Version 4.0.0
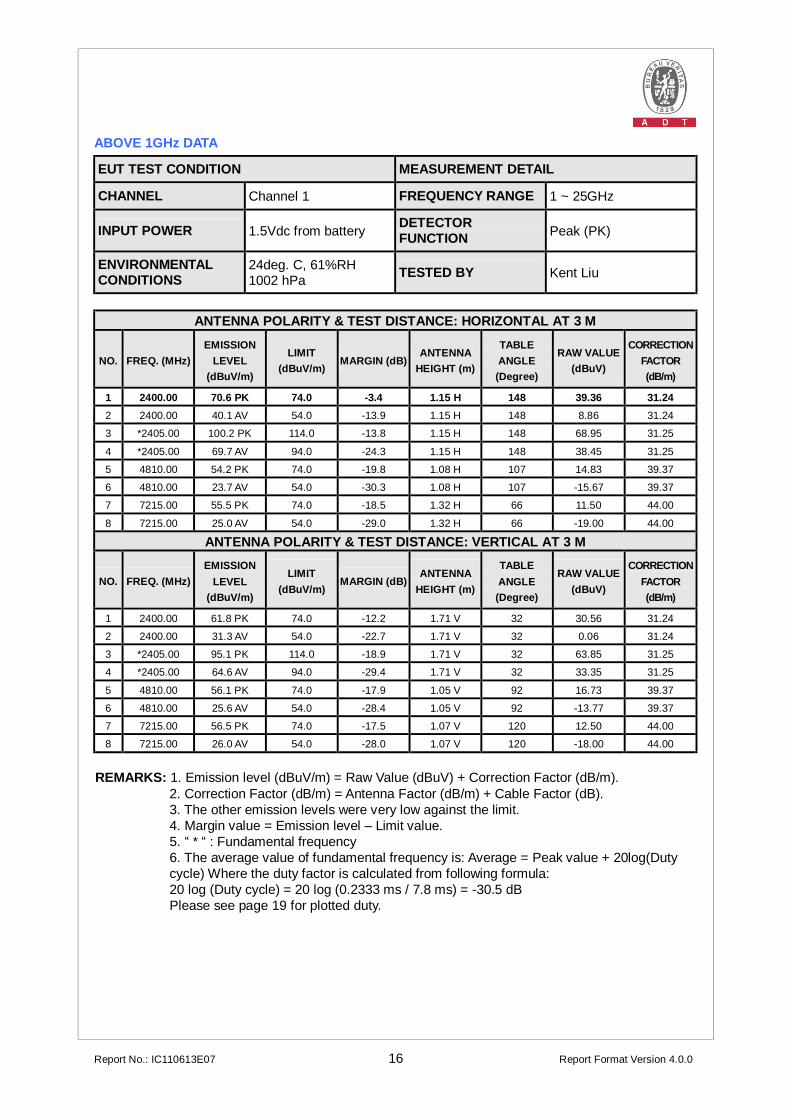
ABOVE 1GHz DATA
EUT TEST CONDITION MEASUREMENT DETAIL
CHANNEL Channel 1 FREQUENCY RANGE 1 ~ 25GHz
INPUT POWER 1.5Vdc from battery DETECTOR FUNCTION Peak (PK)
ENVIRONMENTAL CONDITIONS
24deg. C, 61%RH 1002 hPa TESTED BY Kent Liu
ANTENNA POLARITY & TEST DISTANCE: HORIZONTAL AT 3 M
NO. FREQ. (MHz) EMISSION
LEVEL (dBuV/m)
LIMIT (dBuV/m)
MARGIN (dB) ANTENNA
HEIGHT (m)
TABLE ANGLE (Degree)
RAW VALUE (dBuV)
CORRECTION FACTOR (dB/m)
1 2400.00 70.6 PK 74.0 -3.4 1.15 H 148 39.36 31.24 2 2400.00 40.1 AV 54.0 -13.9 1.15 H 148 8.86 31.24
3 *2405.00 100.2 PK 114.0 -13.8 1.15 H 148 68.95 31.25
4 *2405.00 69.7 AV 94.0 -24.3 1.15 H 148 38.45 31.25
5 4810.00 54.2 PK 74.0 -19.8 1.08 H 107 14.83 39.37
6 4810.00 23.7 AV 54.0 -30.3 1.08 H 107 -15.67 39.37
7 7215.00 55.5 PK 74.0 -18.5 1.32 H 66 11.50 44.00
8 7215.00 25.0 AV 54.0 -29.0 1.32 H 66 -19.00 44.00
ANTENNA POLARITY & TEST DISTANCE: VERTICAL AT 3 M
NO. FREQ. (MHz) EMISSION
LEVEL (dBuV/m)
LIMIT (dBuV/m)
MARGIN (dB) ANTENNA
HEIGHT (m)
TABLE ANGLE (Degree)
RAW VALUE (dBuV)
CORRECTION FACTOR (dB/m)
1 2400.00 61.8 PK 74.0 -12.2 1.71 V 32 30.56 31.24
2 2400.00 31.3 AV 54.0 -22.7 1.71 V 32 0.06 31.24
3 *2405.00 95.1 PK 114.0 -18.9 1.71 V 32 63.85 31.25
4 *2405.00 64.6 AV 94.0 -29.4 1.71 V 32 33.35 31.25
5 4810.00 56.1 PK 74.0 -17.9 1.05 V 92 16.73 39.37
6 4810.00 25.6 AV 54.0 -28.4 1.05 V 92 -13.77 39.37
7 7215.00 56.5 PK 74.0 -17.5 1.07 V 120 12.50 44.00
8 7215.00 26.0 AV 54.0 -28.0 1.07 V 120 -18.00 44.00
REMARKS: 1. Emission level (dBuV/m) = Raw Value (dBuV) + Correction Factor (dB/m). 2. Correction Factor (dB/m) = Antenna Factor (dB/m) + Cable Factor (dB). 3. The other emission levels were very low against the limit. 4. Margin value = Emission level – Limit value. 5. “ * “ : Fundamental frequency 6. The average value of fundamental frequency is: Average = Peak value + 20log(Duty cycle) Where the duty factor is calculated from following formula: 20 log (Duty cycle) = 20 log (0.2333 ms / 7.8 ms) = -30.5 dB Please see page 19 for plotted duty.
Report No.: IC110613E07 17 Report Format Version 4.0.0
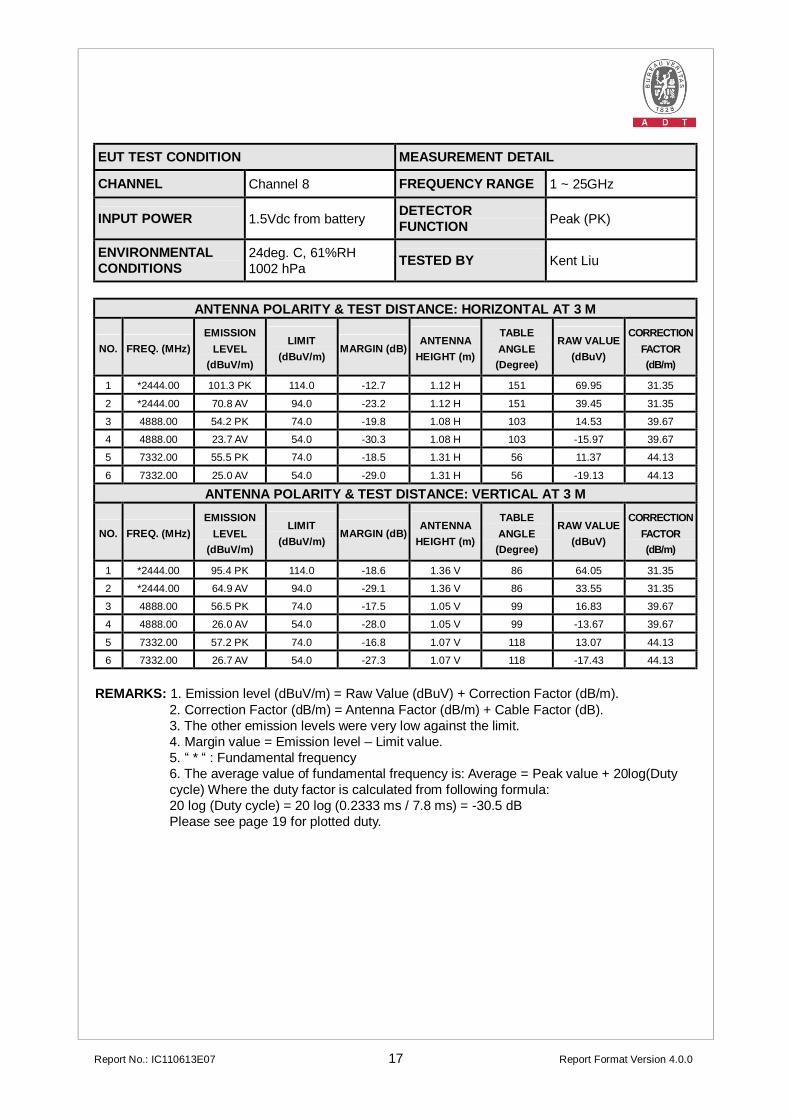
EUT TEST CONDITION MEASUREMENT DETAIL
CHANNEL Channel 8 FREQUENCY RANGE 1 ~ 25GHz
INPUT POWER 1.5Vdc from battery DETECTOR FUNCTION Peak (PK)
ENVIRONMENTAL CONDITIONS
24deg. C, 61%RH 1002 hPa TESTED BY Kent Liu
ANTENNA POLARITY & TEST DISTANCE: HORIZONTAL AT 3 M
NO. FREQ. (MHz) EMISSION
LEVEL (dBuV/m)
LIMIT (dBuV/m)
MARGIN (dB) ANTENNA
HEIGHT (m)
TABLE ANGLE (Degree)
RAW VALUE (dBuV)
CORRECTION FACTOR (dB/m)
1 *2444.00 101.3 PK 114.0 -12.7 1.12 H 151 69.95 31.35
2 *2444.00 70.8 AV 94.0 -23.2 1.12 H 151 39.45 31.35
3 4888.00 54.2 PK 74.0 -19.8 1.08 H 103 14.53 39.67
4 4888.00 23.7 AV 54.0 -30.3 1.08 H 103 -15.97 39.67
5 7332.00 55.5 PK 74.0 -18.5 1.31 H 56 11.37 44.13
6 7332.00 25.0 AV 54.0 -29.0 1.31 H 56 -19.13 44.13
ANTENNA POLARITY & TEST DISTANCE: VERTICAL AT 3 M
NO. FREQ. (MHz) EMISSION
LEVEL (dBuV/m)
LIMIT (dBuV/m)
MARGIN (dB) ANTENNA
HEIGHT (m)
TABLE ANGLE (Degree)
RAW VALUE (dBuV)
CORRECTION FACTOR (dB/m)
1 *2444.00 95.4 PK 114.0 -18.6 1.36 V 86 64.05 31.35
2 *2444.00 64.9 AV 94.0 -29.1 1.36 V 86 33.55 31.35
3 4888.00 56.5 PK 74.0 -17.5 1.05 V 99 16.83 39.67
4 4888.00 26.0 AV 54.0 -28.0 1.05 V 99 -13.67 39.67
5 7332.00 57.2 PK 74.0 -16.8 1.07 V 118 13.07 44.13
6 7332.00 26.7 AV 54.0 -27.3 1.07 V 118 -17.43 44.13
REMARKS: 1. Emission level (dBuV/m) = Raw Value (dBuV) + Correction Factor (dB/m). 2. Correction Factor (dB/m) = Antenna Factor (dB/m) + Cable Factor (dB). 3. The other emission levels were very low against the limit. 4. Margin value = Emission level – Limit value. 5. “ * “ : Fundamental frequency 6. The average value of fundamental frequency is: Average = Peak value + 20log(Duty cycle) Where the duty factor is calculated from following formula: 20 log (Duty cycle) = 20 log (0.2333 ms / 7.8 ms) = -30.5 dB Please see page 19 for plotted duty.
Report No.: IC110613E07 18 Report Format Version 4.0.0
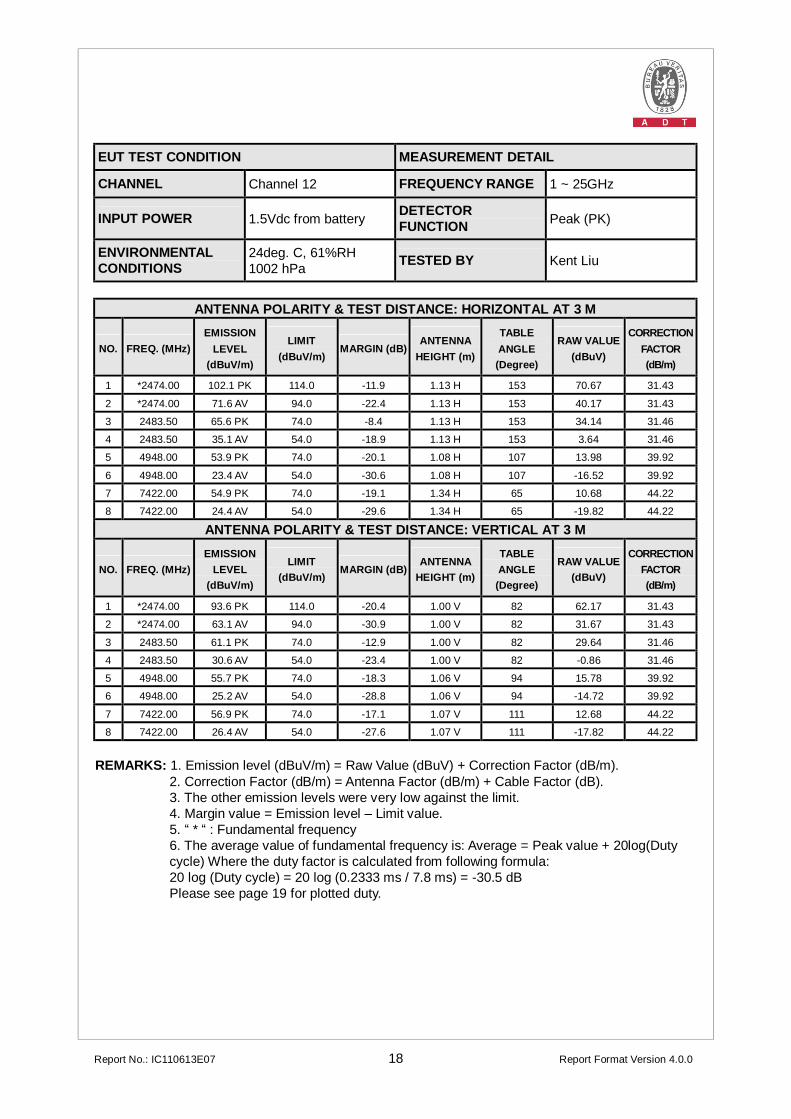
EUT TEST CONDITION MEASUREMENT DETAIL
CHANNEL Channel 12 FREQUENCY RANGE 1 ~ 25GHz
INPUT POWER 1.5Vdc from battery DETECTOR FUNCTION Peak (PK)
ENVIRONMENTAL CONDITIONS
24deg. C, 61%RH 1002 hPa TESTED BY Kent Liu
ANTENNA POLARITY & TEST DISTANCE: HORIZONTAL AT 3 M
NO. FREQ. (MHz) EMISSION
LEVEL (dBuV/m)
LIMIT (dBuV/m)
MARGIN (dB) ANTENNA
HEIGHT (m)
TABLE ANGLE (Degree)
RAW VALUE (dBuV)
CORRECTION FACTOR (dB/m)
1 *2474.00 102.1 PK 114.0 -11.9 1.13 H 153 70.67 31.43
2 *2474.00 71.6 AV 94.0 -22.4 1.13 H 153 40.17 31.43
3 2483.50 65.6 PK 74.0 -8.4 1.13 H 153 34.14 31.46
4 2483.50 35.1 AV 54.0 -18.9 1.13 H 153 3.64 31.46
5 4948.00 53.9 PK 74.0 -20.1 1.08 H 107 13.98 39.92
6 4948.00 23.4 AV 54.0 -30.6 1.08 H 107 -16.52 39.92
7 7422.00 54.9 PK 74.0 -19.1 1.34 H 65 10.68 44.22
8 7422.00 24.4 AV 54.0 -29.6 1.34 H 65 -19.82 44.22
ANTENNA POLARITY & TEST DISTANCE: VERTICAL AT 3 M
NO. FREQ. (MHz) EMISSION
LEVEL (dBuV/m)
LIMIT (dBuV/m)
MARGIN (dB) ANTENNA
HEIGHT (m)
TABLE ANGLE (Degree)
RAW VALUE (dBuV)
CORRECTION FACTOR (dB/m)
1 *2474.00 93.6 PK 114.0 -20.4 1.00 V 82 62.17 31.43
2 *2474.00 63.1 AV 94.0 -30.9 1.00 V 82 31.67 31.43
3 2483.50 61.1 PK 74.0 -12.9 1.00 V 82 29.64 31.46
4 2483.50 30.6 AV 54.0 -23.4 1.00 V 82 -0.86 31.46
5 4948.00 55.7 PK 74.0 -18.3 1.06 V 94 15.78 39.92
6 4948.00 25.2 AV 54.0 -28.8 1.06 V 94 -14.72 39.92
7 7422.00 56.9 PK 74.0 -17.1 1.07 V 111 12.68 44.22
8 7422.00 26.4 AV 54.0 -27.6 1.07 V 111 -17.82 44.22
REMARKS: 1. Emission level (dBuV/m) = Raw Value (dBuV) + Correction Factor (dB/m). 2. Correction Factor (dB/m) = Antenna Factor (dB/m) + Cable Factor (dB). 3. The other emission levels were very low against the limit. 4. Margin value = Emission level – Limit value. 5. “ * “ : Fundamental frequency 6. The average value of fundamental frequency is: Average = Peak value + 20log(Duty cycle) Where the duty factor is calculated from following formula: 20 log (Duty cycle) = 20 log (0.2333 ms / 7.8 ms) = -30.5 dB Please see page 19 for plotted duty.
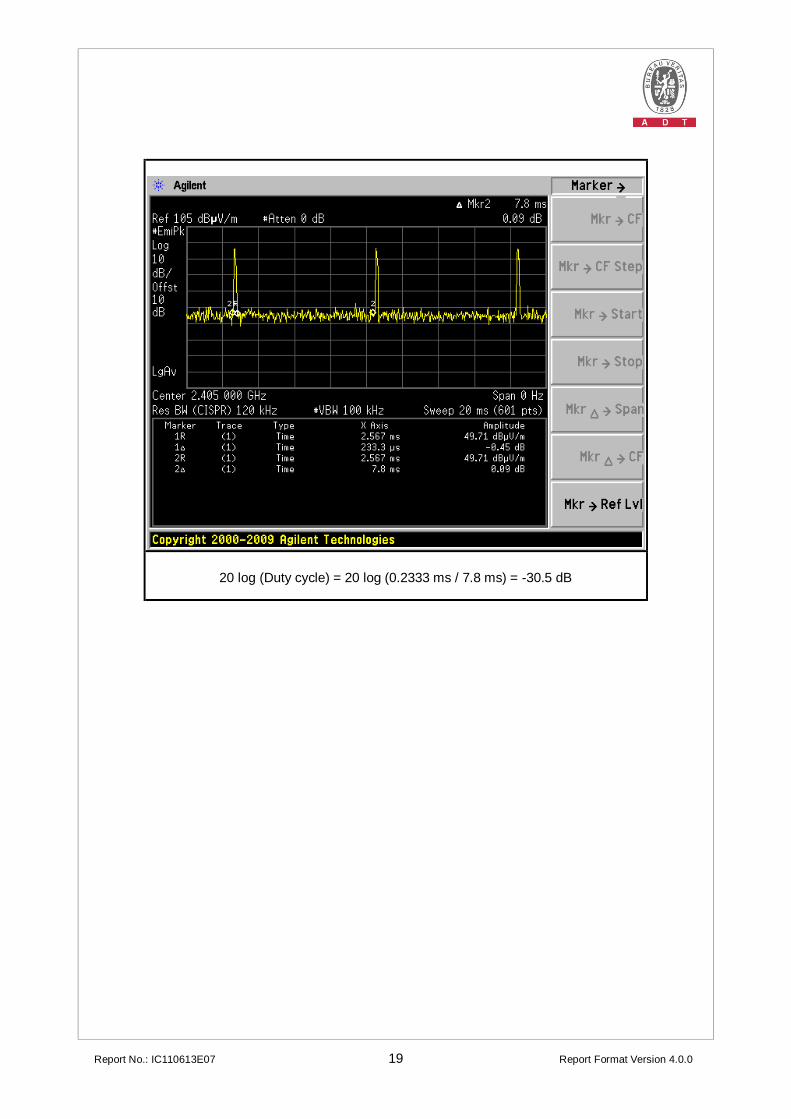
Report No.: IC110613E07 19 Report Format Version 4.0.0
20 log (Duty cycle) = 20 log (0.2333 ms / 7.8 ms) = -30.5 dB
Report No.: IC110613E07 20 Report Format Version 4.0.0
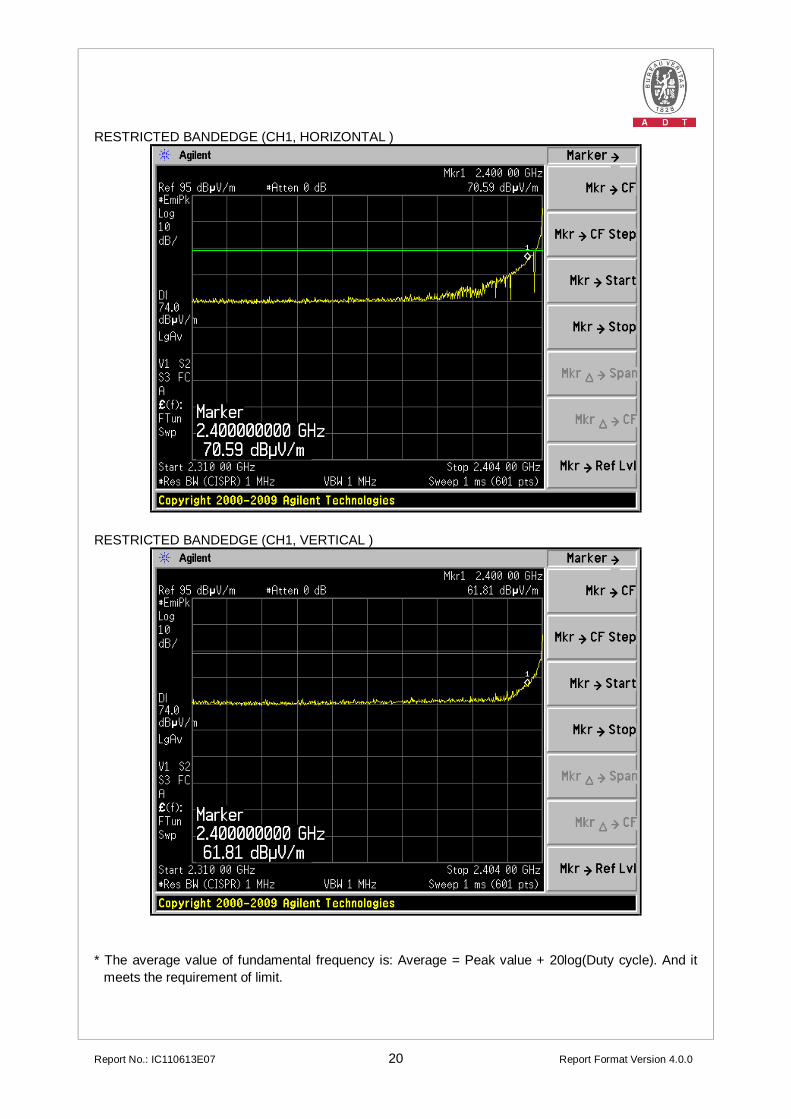
RESTRICTED BANDEDGE (CH1, HORIZONTAL )
RESTRICTED BANDEDGE (CH1, VERTICAL )
* The average value of fundamental frequency is: Average = Peak value + 20log(Duty cycle). And it
meets the requirement of limit.
Report No.: IC110613E07 21 Report Format Version 4.0.0
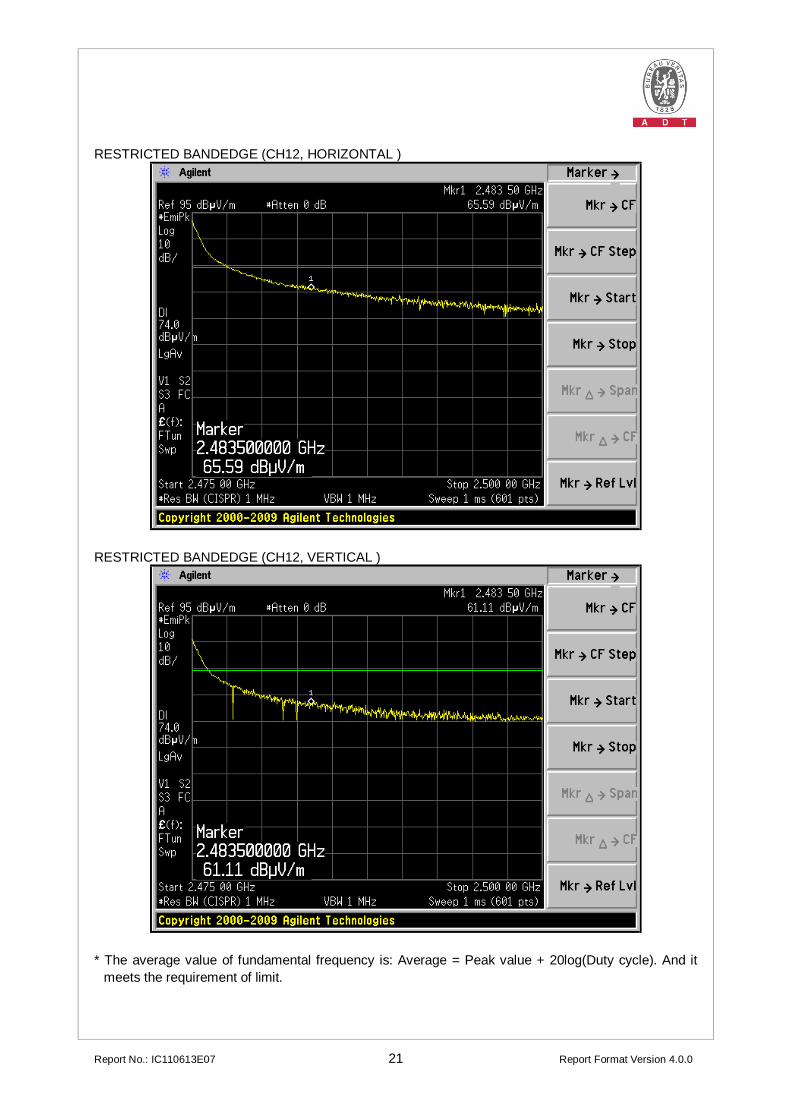
RESTRICTED BANDEDGE (CH12, HORIZONTAL )
RESTRICTED BANDEDGE (CH12, VERTICAL )
* The average value of fundamental frequency is: Average = Peak value + 20log(Duty cycle). And it
meets the requirement of limit.

Report No.: IC110613E07 22 Report Format Version 4.0.0
4.2 CONDUCTED - OUT BAND MEASUREMENT
4.2.1 LIMITS OF CONDUCTED - OUT BAND MEASUREMENT
Emissions radiated outside of the specified frequency bands, except for harmonics, shall be attenuated by at least 50 dB below the level of the fundamental or to the general radiated emission limits in A2.9(b), whichever is the lesser attenuation.
4.2.2 TEST INSTRUMENTS
DESCRIPTION & MANUFACTURER
MODEL NO. SERIAL NO.
CALIBRATED DATE
CALIBRATED UNTIL
R&S SPECTRUM ANALYZER FSP40 100036 Dec. 08, 2010 Dec. 07, 2011
NOTE: 1. The calibration interval of the above test instruments is 12 months and the calibrations are
traceable to NML/ROC and NIST/USA.
4.2.3 TEST PROCEDURE
The transmitter output was connected to the spectrum analyzer via a low lose cable. Set both RBW and VBW of spectrum analyzer to 100 kHz and 300 kHz with suitable frequency span from band edge. The band edges was measured and recorded.
4.2.4 DEVIATION FROM TEST STANDARD
No deviation
4.2.5 EUT OPERATING CONDITION
The software provided by client enabled the EUT to transmit and receive data at
lowest, middle and highest channel frequencies individually.
Report No.: IC110613E07 23 Report Format Version 4.0.0
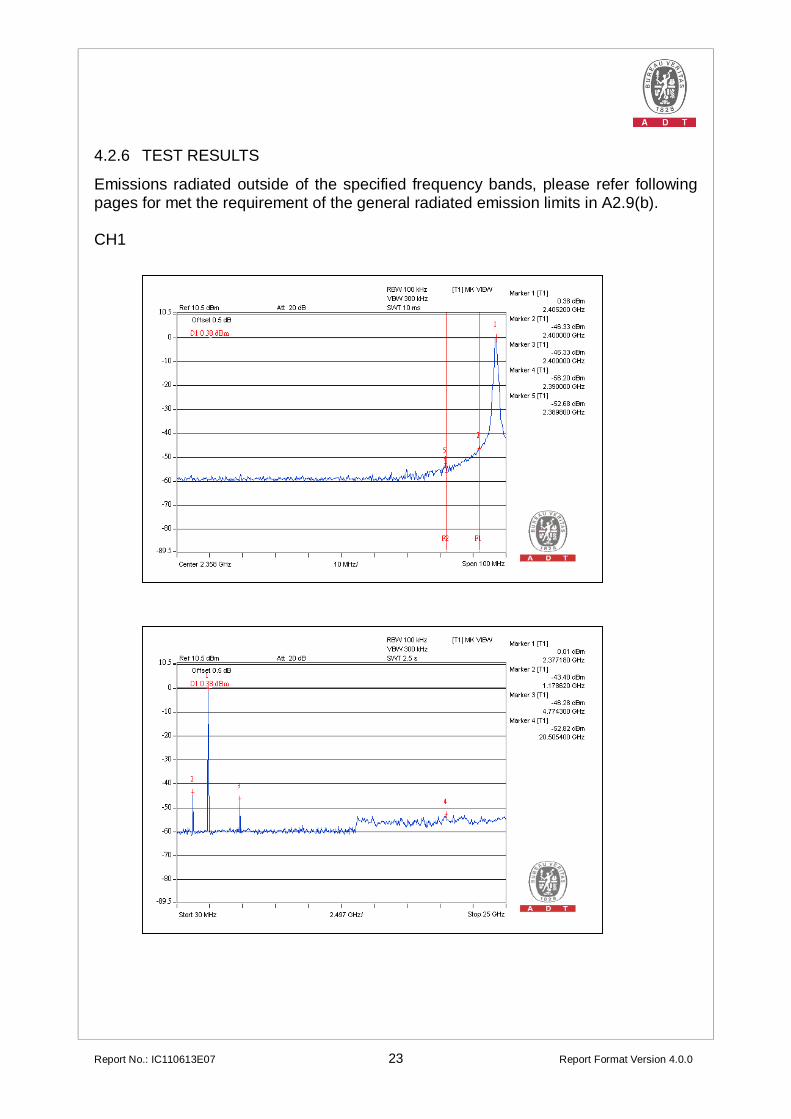
4.2.6 TEST RESULTS
Emissions radiated outside of the specified frequency bands, please refer following pages for met the requirement of the general radiated emission limits in A2.9(b). CH1
Report No.: IC110613E07 24 Report Format Version 4.0.0
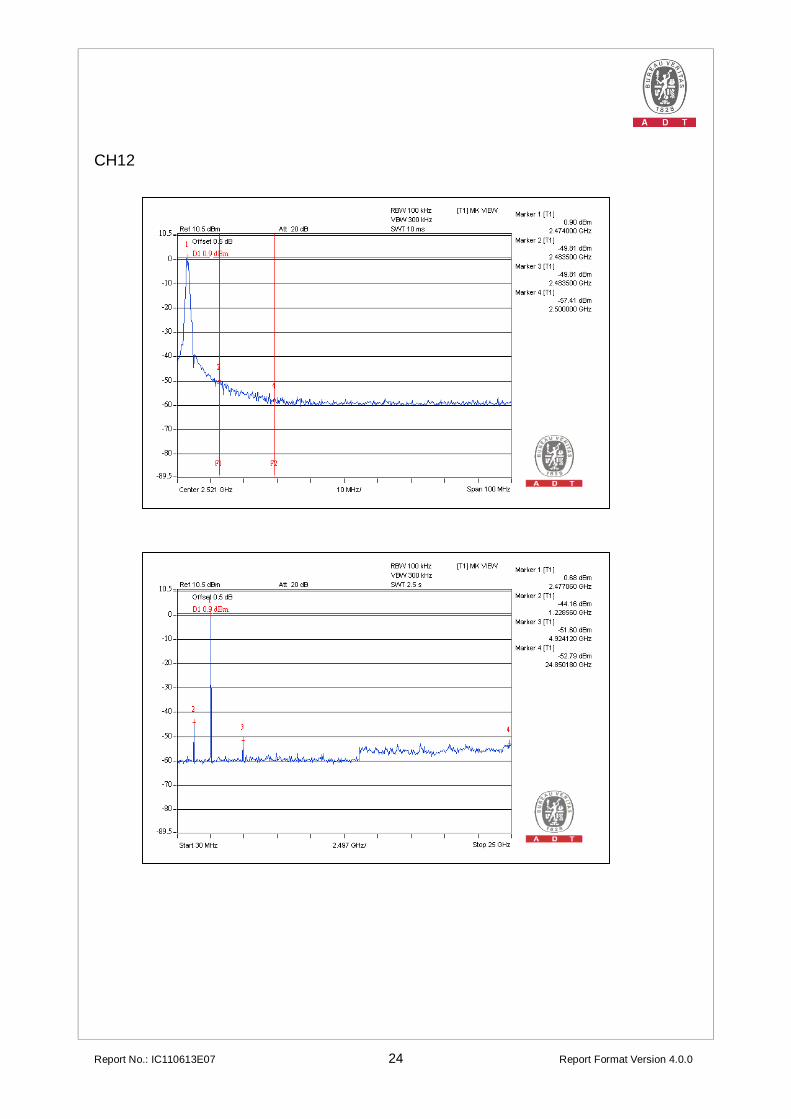
CH12
Report No.: IC110613E07 25 Report Format Version 4.0.0
5 INFORMATION ON THE TESTING LABORATORIES
We, Bureau Veritas Consumer Products Services (H.K.) Ltd., Taoyuan Branch, were founded in 1988 to provide our best service in EMC, Radio, Telecom and Safety consultation. Our laboratories are accredited and approved according to ISO/IEC 17025.
Copies of accreditation certificates of our laboratories obtained from approval agencies can be downloaded from our web site: www.adt.com.tw/index.5.phtml. If you have any comments, please feel free to contact us at the following:
Linko EMC/RF Lab: Tel: 886-2-26052180 Fax: 886-2-26052943
Hsin Chu EMC/RF Lab: Tel: 886-3-5935343 Fax: 886-3-5935342
Hwa Ya EMC/RF/Safety/Telecom Lab: Tel: 886-3-3183232 Fax: 886-3-3185050
Email: [email protected] Web Site: www.adt.com.tw
The address and road map of all our labs can be found in our web site also.
Report No.: IC110613E07 26 Report Format Version 4.0.0
6 APPENDIX A - MODIFICATIONS RECORDERS FOR
ENGINEERING CHANGES TO THE EUT BY THE LAB No any modifications are made to the EUT by the lab during the test.
--- END ---

Report No.: IC110613E07 B-1 Report Format Version 4.0.0
APPENDIX-B
Table of Contents
1 TEST TYPES AND RESULTS......................................................................... 2 1.1 RECEIVER RADIATED EMISSION MEASUREMENT.................................... 2 1.1.1 LIMITS OF RADIATED EMISSION MEASUREMENT..................................... 2 1.1.2 TEST INSTRUMENTS .................................................................................... 3 1.1.3 TEST PROCEDURES..................................................................................... 5 1.1.4 DEVIATION FROM TEST STANDARD ........................................................... 5 1.1.5 TEST SETUP .................................................................................................. 6 1.1.6 EUT OPERATING CONDITIONS.................................................................... 6 1.1.7 TEST RESULTS.............................................................................................. 7 1.2 99% BANDWIDTH MEASUREMENT............................................................ 11 TEST INSTRUMENTS............................................................................................. 11 TEST PROCEDURE................................................................................................ 11 TEST SETUP ........................................................................................................ 11 EUT OPERATING CONDITIONS............................................................................. 11 TEST RESULTS....................................................................................................... 12
Report No.: IC110613E07 B-2 Report Format Version 4.0.0
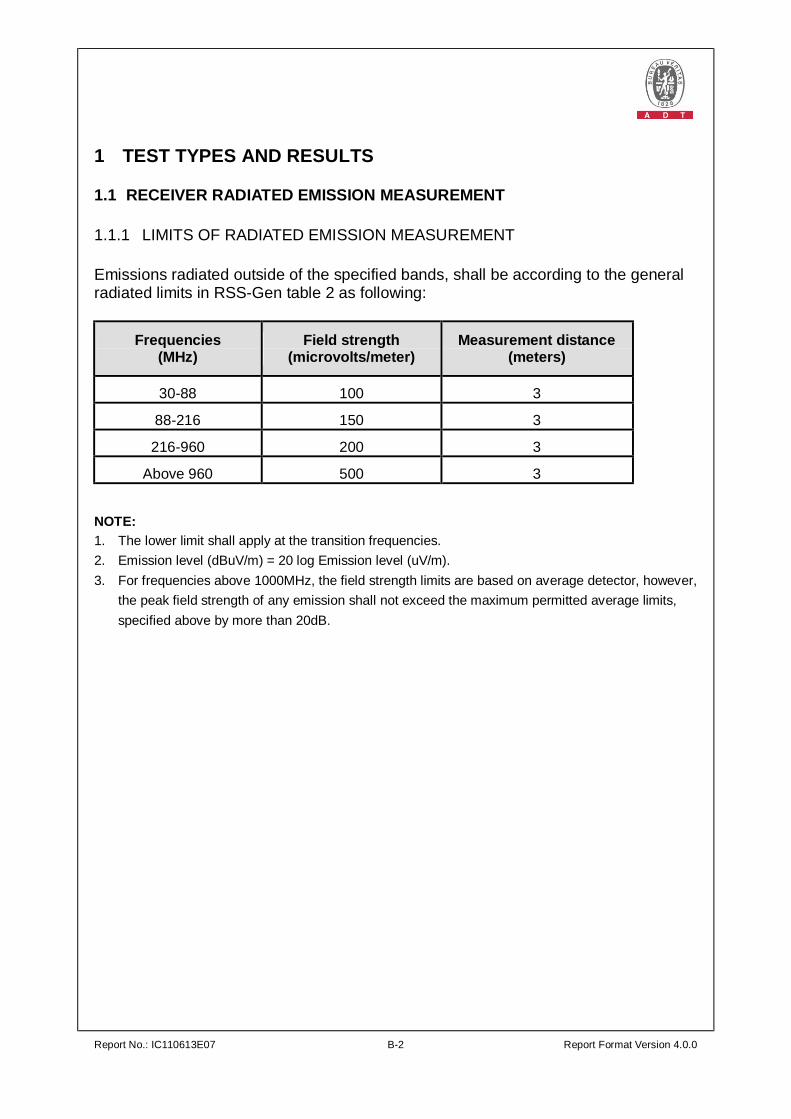
1 TEST TYPES AND RESULTS 1.1 RECEIVER RADIATED EMISSION MEASUREMENT 1.1.1 LIMITS OF RADIATED EMISSION MEASUREMENT Emissions radiated outside of the specified bands, shall be according to the general radiated limits in RSS-Gen table 2 as following:
Frequencies (MHz)
Field strength (microvolts/meter)
Measurement distance (meters)
30-88 100 3
88-216 150 3
216-960 200 3
Above 960 500 3 NOTE: 1. The lower limit shall apply at the transition frequencies. 2. Emission level (dBuV/m) = 20 log Emission level (uV/m). 3. For frequencies above 1000MHz, the field strength limits are based on average detector, however,
the peak field strength of any emission shall not exceed the maximum permitted average limits, specified above by more than 20dB.

Report No.: IC110613E07 B-3 Report Format Version 4.0.0
1.1.2 TEST INSTRUMENTS
For Below 1GHz: DESCRIPTION & MANUFACTURER
MODEL NO. SERIAL NO. CALIBRATED DATE
CALIBRATED UNTIL
Agilent Spectrum Analyzer
E4446A MY48250254 July 14, 2010 July 13, 2011
Agilent Pre-Selector
N9039A MY46520311 July 14, 2010 July 13, 2011
Agilent Signal Generator N5181A MY49060517 July 14, 2010 July 13, 2011
Mini-Circuits Pre-Amplifier ZFL-1000VH2B AMP-ZFL-03 Nov. 16, 2010 Nov. 15, 2011
Agilent Pre-Amplifier 8449B 3008A02578 July 05, 2010 July 04, 2011 Miteq Pre-Amplifier
AFS33-18002650-30-8P-44 881786 NA NA
SCHWARZBECK Trilog Broadband Antenna
VULB 9168 9168-360 Apr. 14, 2011 Apr. 13, 2012
AISI Horn_Antenna AIH.8018
0000320091110
Nov. 12, 2010 Nov. 11, 2011
SCHWARZBECK Horn_Antenna BBHA 9170 9170-424 Oct. 08, 2010 Oct. 07, 2011
RF CABLE NA RF104-201 RF104-203 RF104-204
Dec. 27, 2010 Dec. 26, 2011
RF Cable NA CHGCAB_001 NA NA
Software ADT_Radiated_V8.7.05
NA NA NA
CT Antenna Tower & Turn Table
NA NA NA NA
Note: 1. The calibration interval of the above test instruments is 12 months and the calibrations are traceable to NML/ROC and NIST/USA.
2. The horn antenna, preamplifier (model: 8449B) are used only for the measurement of emission frequency above 1GHz if tested.
3. The test was performed in 966 Chamber No. G. 4. The FCC Site Registration No. is 966073. 5. The VCCI Site Registration No. is G-137. 6. The CANADA Site Registration No. is IC 7450H-2.

Report No.: IC110613E07 B-4 Report Format Version 4.0.0
For Above 1GHz: DESCRIPTION & MANUFACTURER
MODEL NO. SERIAL NO. CALIBRATED DATE
CALIBRATED UNTIL
Agilent Spectrum Analyzer
E4446A MY48250253 Aug. 23, 2010 Aug. 22, 2011
Agilent Pre-Selector
N9039A MY46520310 Aug. 23, 2010 Aug. 22, 2011
Agilent Signal Generator N5181A MY49060347 July 30, 2010 July 29, 2011
Mini-Circuits Pre-Amplifier ZFL-1000VH2B AMP-ZFL-04 Nov. 16, 2010 Nov. 15, 2011
Agilent Pre-Amplifier 8449B 3008A02465 Feb. 28, 2011 Feb. 27, 2012 Miteq Pre-Amplifier
AFS33-18002650-30-8P-44 881786 NA NA
SCHWARZBECK Trilog Broadband Antenna
VULB 9168 9168-361 Apr. 14, 2011 Apr. 13, 2012
AISI Horn_Antenna AIH.8018
0000220091110
Nov. 22, 2010 Nov. 21, 2011
SCHWARZBECK Horn_Antenna BBHA 9170 9170-424 Oct. 08, 2010 Oct. 07, 2011
RF CABLE NA RF104-205 RF104-207 RF104-202
Dec. 28, 2010 Dec. 27, 2011
RF Cable NA CHHCAB_001 NA NA
Software ADT_Radiated_V8.7.05
NA NA NA
CT Antenna Tower & Turn Table
NA NA NA NA
Note: 1. The calibration interval of the above test instruments is 12 months and the calibrations are traceable to NML/ROC and NIST/USA.
2. The horn antenna, preamplifier (model: 8449B) are used only for the measurement of emission frequency above 1GHz if tested.
3. The test was performed in 966 Chamber No. H. 4. The FCC Site Registration No. is 797305. 5. The CANADA Site Registration No. is IC 7450H-3.

Report No.: IC110613E07 B-5 Report Format Version 4.0.0
1.1.3 TEST PROCEDURES a. The EUT was placed on the top of a rotating table 0.8 meters above the ground
at a 3 meters chamber room. The table was rotated 360 degrees to determine the position of the highest radiation.
b. The EUT was set 3 meters away from the interference-receiving antenna, which was mounted on the top of a variable-height antenna tower.
c. The height of antenna is varied from one meter to four meters above the ground to determine the maximum value of the field strength. Both horizontal and vertical polarizations of the antenna are set to make the measurement.
d. For each suspected emission, the EUT was arranged to its worst case and then the antenna was tuned to heights from 1 meter to 4 meters and the rotatable table was turned from 0 degrees to 360 degrees to find the maximum reading.
e. The spectrum analyzer system was set to quasi-peak detect function and specified bandwidth with maximum hold mode when the test frequency is below 1 GHz.
f. The spectrum analyzer system was set to peak and average detect function and specified bandwidth with maximum hold mode when the test frequency is above 1 GHz. If the peak reading value also meets average limit, measurement with the average detector is unnecessary.
NOTE: 1. The resolution bandwidth and video bandwidth of test receiver/spectrum analyzer is 120kHz for
Quasi-peak detection at frequency below 1GHz. 2. The resolution bandwidth of test receiver/spectrum analyzer is 1MHz and video bandwidth is
3MHz for Peak detection at frequency above 1GHz.The resolution bandwidth of test receiver/spectrum analyzer is 1 MHz for Average detection (AV) at frequency above 1GHz.
3. All modes of operation were investigated and the worst-case emissions are reported. 1.1.4 DEVIATION FROM TEST STANDARD No deviation.

Report No.: IC110613E07 B-6 Report Format Version 4.0.0
1.1.5 TEST SETUP
For the actual test configuration, please refer to the related item – Photographs of the Test Configuration. 1.1.6 EUT OPERATING CONDITIONS Set the EUT under receiving condition continuously at specific channel frequency.

Report No.: IC110613E07 B-7 Report Format Version 4.0.0
1.1.7 TEST RESULTS BELOW 1GHz WORST-CASE DATA
EUT TEST CONDITION MEASUREMENT DETAIL
CHANNEL Channel 12 FREQUENCY RANGE Below 1000MHz
INPUT POWER 1.5Vdc from battery DETECTOR FUNCTION Quasi-Peak
ENVIRONMENTAL CONDITIONS
22deg. C, 70%RH 1002 hPa TESTED BY Frank Liu
ANTENNA POLARITY & TEST DISTANCE: HORIZONTAL AT 3 M
NO. FREQ. (MHz) EMISSION
LEVEL (dBuV/m)
LIMIT (dBuV/m)
MARGIN (dB) ANTENNA
HEIGHT (m)
TABLE ANGLE (Degree)
RAW VALUE (dBuV)
CORRECTION FACTOR (dB/m)
1 60.08 14.5 QP 40.0 -25.5 1.50 H 252 0.82 13.65
2 146.05 16.3 QP 43.5 -27.2 1.50 H 13 1.71 14.57
3 229.07 14.4 QP 46.0 -31.6 1.00 H 52 1.94 12.47
4 290.29 17.6 QP 46.0 -28.4 1.50 H 105 2.79 14.81
5 774.29 22.8 QP 46.0 -23.2 1.00 H 201 -1.74 24.51
6 827.46 24.1 QP 46.0 -21.9 1.50 H 331 -1.45 25.56
ANTENNA POLARITY & TEST DISTANCE: VERTICAL AT 3 M
NO. FREQ. (MHz) EMISSION
LEVEL (dBuV/m)
LIMIT (dBuV/m)
MARGIN (dB) ANTENNA
HEIGHT (m)
TABLE ANGLE (Degree)
RAW VALUE (dBuV)
CORRECTION FACTOR (dB/m)
1 30.24 22.1 QP 40.0 -17.9 1.50 V 360 9.11 13.03
2 59.96 20.8 QP 40.0 -19.2 2.00 V 349 7.13 13.66
3 134.21 15.5 QP 43.5 -28.0 1.00 V 8 1.68 13.82
4 286.39 17.0 QP 46.0 -29.0 1.50 V 29 2.31 14.66
5 693.05 23.7 QP 46.0 -22.3 1.50 V 95 1.11 22.55
6 823.43 23.9 QP 46.0 -22.1 2.00 V 303 -1.63 25.50
REMARKS: 1. Emission level (dBuV/m) = Raw Value (dBuV) + Correction Factor (dB/m). 2. Correction Factor (dB/m) = Antenna Factor (dB/m) + Cable Factor (dB). 3. The other emission levels were very low against the limit. 4. Margin value = Emission level – Limit value.

Report No.: IC110613E07 B-8 Report Format Version 4.0.0
ABOVE 1GHz DATA
EUT TEST CONDITION MEASUREMENT DETAIL
CHANNEL Channel 1 FREQUENCY RANGE 1 ~ 7.5GHz
INPUT POWER 1.5Vdc from battery DETECTOR FUNCTION
Peak (PK) Average (AV)
ENVIRONMENTAL CONDITIONS
24deg. C, 61%RH 1002 hPa TESTED BY Kent Liu
ANTENNA POLARITY & TEST DISTANCE: HORIZONTAL AT 3 M
NO. FREQ. (MHz) EMISSION
LEVEL (dBuV/m)
LIMIT (dBuV/m)
MARGIN (dB) ANTENNA
HEIGHT (m)
TABLE ANGLE (Degree)
RAW VALUE (dBuV)
CORRECTION FACTOR (dB/m)
1 2750.86 45.5 PK 74.0 -28.5 1.02 H 203 13.38 32.12
2 2750.86 43.2 AV 54.0 -10.8 1.02 H 203 11.08 32.12
3 5501.72 42.6 PK 74.0 -31.4 1.00 H 14 1.55 41.05
4 5501.72 30.6 AV 54.0 -23.4 1.00 H 14 -10.45 41.05
ANTENNA POLARITY & TEST DISTANCE: VERTICAL AT 3 M
NO. FREQ. (MHz) EMISSION
LEVEL (dBuV/m)
LIMIT (dBuV/m)
MARGIN (dB) ANTENNA
HEIGHT (m)
TABLE ANGLE (Degree)
RAW VALUE (dBuV)
CORRECTION FACTOR (dB/m)
1 2750.86 44.1 PK 74.0 -29.9 1.13 V 196 11.98 32.12
2 2750.86 40.1 AV 54.0 -13.9 1.13 V 196 7.98 32.12
3 5501.72 42.0 PK 74.0 -32.0 1.00 V 18 0.95 41.05
4 5501.72 29.8 AV 54.0 -24.2 1.00 V 18 -11.25 41.05
REMARKS: 1. Emission level (dBuV/m) = Raw Value (dBuV) + Correction Factor (dB/m). 2. Correction Factor (dB/m) = Antenna Factor (dB/m) + Cable Factor (dB). 3. The other emission levels were very low against the limit. 4. Margin value = Emission level – Limit value.
Report No.: IC110613E07 B-9 Report Format Version 4.0.0
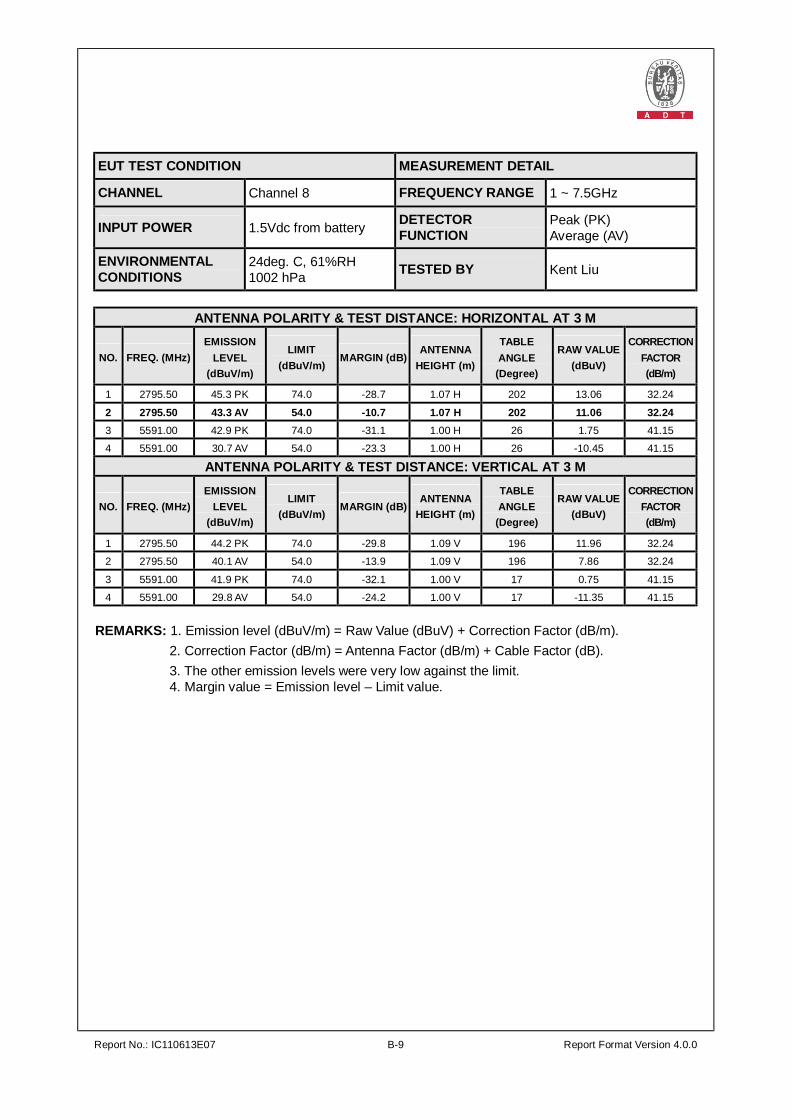
EUT TEST CONDITION MEASUREMENT DETAIL
CHANNEL Channel 8 FREQUENCY RANGE 1 ~ 7.5GHz
INPUT POWER 1.5Vdc from battery DETECTOR FUNCTION
Peak (PK) Average (AV)
ENVIRONMENTAL CONDITIONS
24deg. C, 61%RH 1002 hPa TESTED BY Kent Liu
ANTENNA POLARITY & TEST DISTANCE: HORIZONTAL AT 3 M
NO. FREQ. (MHz) EMISSION
LEVEL (dBuV/m)
LIMIT (dBuV/m)
MARGIN (dB) ANTENNA
HEIGHT (m)
TABLE ANGLE (Degree)
RAW VALUE (dBuV)
CORRECTION FACTOR (dB/m)
1 2795.50 45.3 PK 74.0 -28.7 1.07 H 202 13.06 32.24
2 2795.50 43.3 AV 54.0 -10.7 1.07 H 202 11.06 32.24 3 5591.00 42.9 PK 74.0 -31.1 1.00 H 26 1.75 41.15
4 5591.00 30.7 AV 54.0 -23.3 1.00 H 26 -10.45 41.15
ANTENNA POLARITY & TEST DISTANCE: VERTICAL AT 3 M
NO. FREQ. (MHz) EMISSION
LEVEL (dBuV/m)
LIMIT (dBuV/m)
MARGIN (dB) ANTENNA
HEIGHT (m)
TABLE ANGLE (Degree)
RAW VALUE (dBuV)
CORRECTION FACTOR (dB/m)
1 2795.50 44.2 PK 74.0 -29.8 1.09 V 196 11.96 32.24
2 2795.50 40.1 AV 54.0 -13.9 1.09 V 196 7.86 32.24
3 5591.00 41.9 PK 74.0 -32.1 1.00 V 17 0.75 41.15
4 5591.00 29.8 AV 54.0 -24.2 1.00 V 17 -11.35 41.15
REMARKS: 1. Emission level (dBuV/m) = Raw Value (dBuV) + Correction Factor (dB/m). 2. Correction Factor (dB/m) = Antenna Factor (dB/m) + Cable Factor (dB). 3. The other emission levels were very low against the limit. 4. Margin value = Emission level – Limit value.

Report No.: IC110613E07 B-10 Report Format Version 4.0.0
EUT TEST CONDITION MEASUREMENT DETAIL
CHANNEL Channel 12 FREQUENCY RANGE 1 ~ 7.5GHz
INPUT POWER 1.5Vdc from battery DETECTOR FUNCTION
Peak (PK) Average (AV)
ENVIRONMENTAL CONDITIONS
24deg. C, 61%RH 1002 hPa TESTED BY Kent Liu
ANTENNA POLARITY & TEST DISTANCE: HORIZONTAL AT 3 M
NO. FREQ. (MHz) EMISSION
LEVEL (dBuV/m)
LIMIT (dBuV/m)
MARGIN (dB) ANTENNA
HEIGHT (m)
TABLE ANGLE (Degree)
RAW VALUE (dBuV)
CORRECTION FACTOR (dB/m)
1 2829.80 45.4 PK 74.0 -28.6 1.02 H 201 13.07 32.33
2 2829.80 43.0 AV 54.0 -11.0 1.02 H 201 10.67 32.33
3 5659.60 42.4 PK 74.0 -31.6 1.00 H 16 1.17 41.23
4 5659.60 30.4 AV 54.0 -23.6 1.00 H 16 -10.83 41.23
ANTENNA POLARITY & TEST DISTANCE: VERTICAL AT 3 M
NO. FREQ. (MHz) EMISSION
LEVEL (dBuV/m)
LIMIT (dBuV/m)
MARGIN (dB) ANTENNA
HEIGHT (m)
TABLE ANGLE (Degree)
RAW VALUE (dBuV)
CORRECTION FACTOR (dB/m)
1 2829.80 44.5 PK 74.0 -29.5 1.15 V 192 12.17 32.33
2 2829.80 40.3 AV 54.0 -13.7 1.15 V 192 7.97 32.33
3 5659.60 42.4 PK 74.0 -31.6 1.05 V 31 1.17 41.23
4 5659.60 30.0 AV 54.0 -24.0 1.05 V 31 -11.23 41.23
REMARKS: 1. Emission level (dBuV/m) = Raw Value (dBuV) + Correction Factor (dB/m). 2. Correction Factor (dB/m) = Antenna Factor (dB/m) + Cable Factor (dB). 3. The other emission levels were very low against the limit. 4. Margin value = Emission level – Limit value.
Report No.: IC110613E07 B-11 Report Format Version 4.0.0
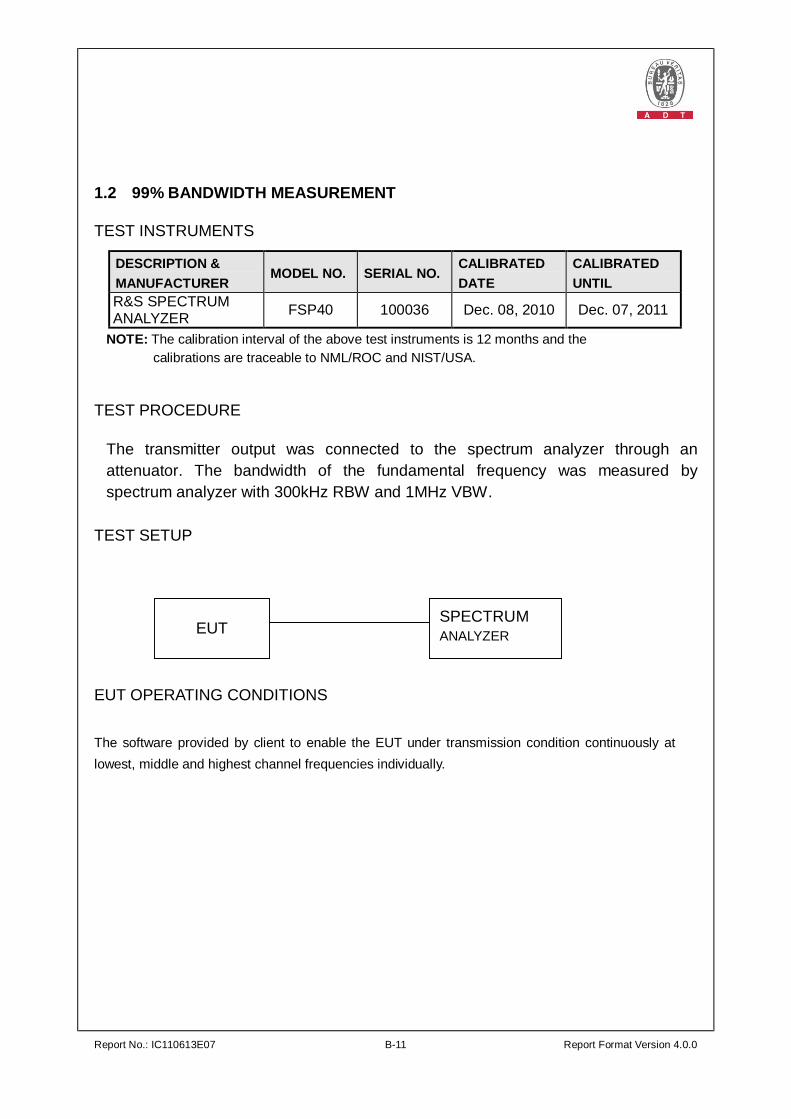
1.2 99% BANDWIDTH MEASUREMENT TEST INSTRUMENTS
DESCRIPTION & MANUFACTURER
MODEL NO. SERIAL NO. CALIBRATED DATE
CALIBRATED UNTIL
R&S SPECTRUM ANALYZER FSP40 100036 Dec. 08, 2010 Dec. 07, 2011
NOTE: The calibration interval of the above test instruments is 12 months and the calibrations are traceable to NML/ROC and NIST/USA.
TEST PROCEDURE
The transmitter output was connected to the spectrum analyzer through an attenuator. The bandwidth of the fundamental frequency was measured by spectrum analyzer with 300kHz RBW and 1MHz VBW.
TEST SETUP
EUT OPERATING CONDITIONS
The software provided by client to enable the EUT under transmission condition continuously at lowest, middle and highest channel frequencies individually.
EUT SPECTRUM ANALYZER
Report No.: IC110613E07 B-12 Report Format Version 4.0.0
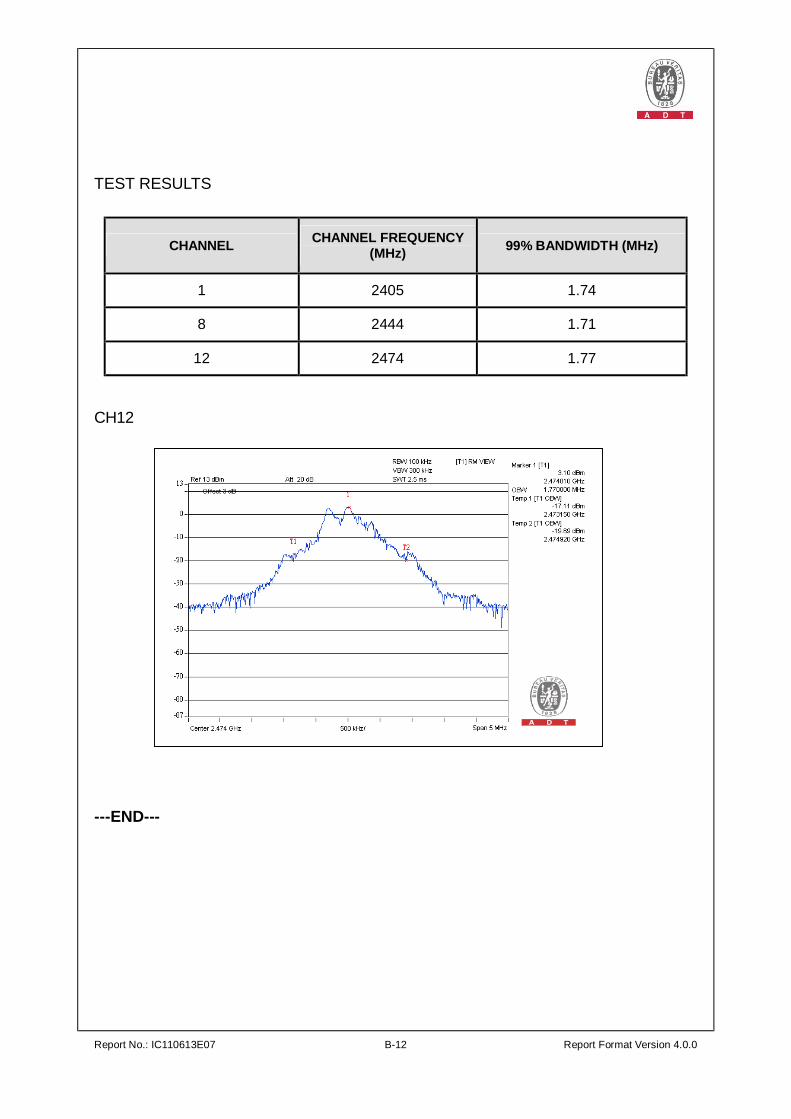
TEST RESULTS
CHANNEL CHANNEL FREQUENCY (MHz) 99% BANDWIDTH (MHz)
1 2405 1.74
8 2444 1.71
12 2474 1.77
CH12
---END---

Page 1
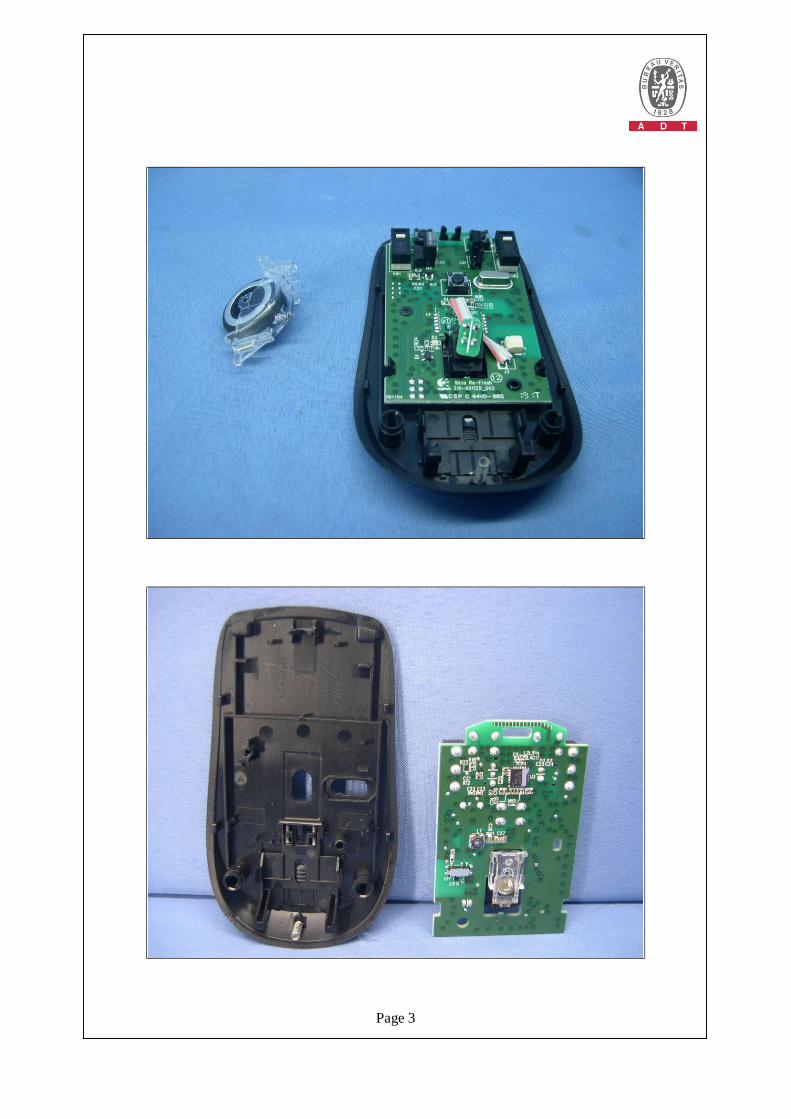
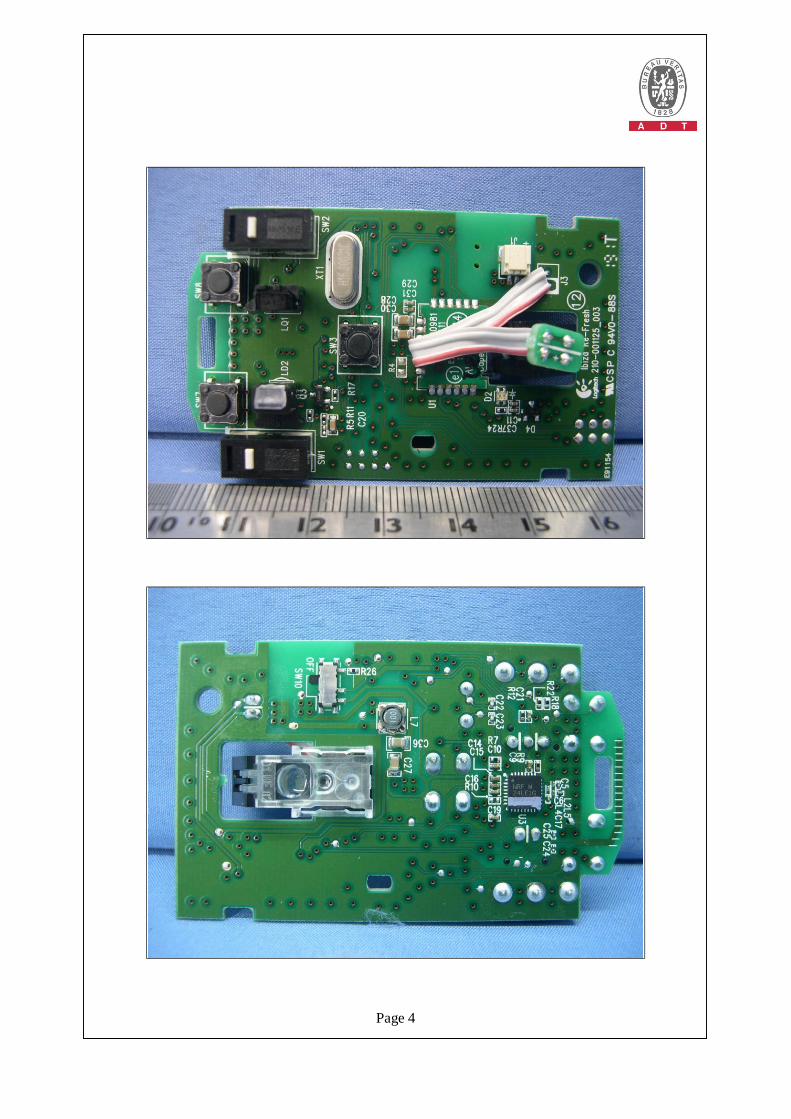
CONSTRUCTION PHOTOS OF EUT

Page 2
Page 3
Page 4