canada food service - hotel restaurant institutional … gain publications/food service... ·...
TRANSCRIPT

THIS REPORT CONTAINS ASSESSMENTS OF COMMODITY AND TRADE ISSUES MADE BY
USDA STAFF AND NOT NECESSARILY STATEMENTS OF OFFICIAL U.S. GOVERNMENT
POLICY
Date:
GAIN Report Number:
Approved By:
Prepared By:
Report Highlights:
Canada's foodservice industry plays a key role in Canada's economy. With over C$81 billion in sales, it
accounts for nearly 5.0 percent of Canada's gross domestic product. It employs over 1.3 million people.
With approximately 90,000 establishments (including hotels and other lodging facilities, restaurants,
cafeterias, snack bars, pubs and caterers), the food service industry in Canada continues to provide
excellent opportunities for U.S. food and beverage companies.
Post:
Ottawa
Sonya Jenkins
Robin Gray
An Overview of the Canadian Foodservice Market 2012
Food Service - Hotel Restaurant Institutional
Canada
CA12051
12/27/2012
Required Report - public distribution

Table of Contents Section I: Market Summary .......................................................................................................................... 3
Hotels and Resorts ................................................................................................................................ 3
Restaurants ........................................................................................................................................... 3
Institutional Contract............................................................................................................................ 3
Breakdown of HRI Food Sales in Canada by Sub-sector ........................................................................... 3
Expected Growth Rate of Canadian Foodservice Sector ...................................................................... 4
Expected Growth Rate by Sub-Sector .................................................................................................. 5
U.S. Exports of Agriculture, Fish and Forestry Products to Canada (in thousands of U.S. dollars) ...... 5
Advantages and Challenges for U.S. HRI Food Products ...................................................................... 6
Section II: Road Map for Market Entry ......................................................................................................... 7
Entry Strategy ........................................................................................................................................... 7
1) Contact your State Regional Trade Group .................................................................................... 7
2) Research the Competitive Marketplace ....................................................................................... 8
3) Locate a Broker/Distributor/Importer .......................................................................................... 9
4) Understand Canadian government standards and regulations that pertain to your product ... 10
5) SIAL Canada ................................................................................................................................ 11
Sub-Sector Profiles ................................................................................................................................. 12
Hotels and Resorts .............................................................................................................................. 12
Restaurants ......................................................................................................................................... 13
Institutional ........................................................................................................................................ 14
Competition ................................................................................................................................................ 16
Products Facing Significant Barriers in Exporting to Canada .................................................................. 19
Best Product Prospects ............................................................................................................................... 20
Diet Friendly ........................................................................................................................................... 20
Snacking .................................................................................................................................................. 21
Vegetables .............................................................................................................................................. 21
Ethnic Foods ........................................................................................................................................... 21
Post Contact and Further Information ....................................................................................................... 22
Section I: Market Summary Although Canada's economy has performed well relative to other economies in recent years; economic
growth, job creation and increases in disposable income are all projected to slow in the next year which
will have an effect on foodservice spending. The economic situation has also led to a decrease in
tourism as well as more people preparing meals at home. Though over growth has been slow Alberta
(7.5 percent), Saskatchewan (5.2 percent)and Manitoba (5.8 percent)posted the highest, consistent
percentage growth in 2010/2011.
Lunch was the fastest growing day part (2.7 percent) in commercial foodservice in Canada in 2011,
although snacking accounts for the largest portion of visits (34.1 percent). Growth in supper visits is
slowing (0.2 percent). Breakfast is growing in importance particularly at quick service restaurants, with
many adding breakfast sandwiches or oatmeal to their menus.
Hotels and Resorts
According to a report by the Hotel Association of Canada, the Hotel and Resort sector consisted of
8,486 establishments in 2010. These establishments accounted for 456,689 rooms. The distribution of
rooms reflects population distribution with the greatest number of rooms found in Ontario (131,456),
Quebec (104,583), British Columbia (79,780) and Alberta (70,359). Total revenue for this sector
equaled C$16.6 billion, with over C$3 billion of that resulting from food and beverage sales (this
excludes alcoholic beverages.)
Restaurants
Canada is home to 81,577 restaurants, bars and caterers who generate almost C$64 billion in annual
sales, or 4 percent of Canada's total GDP. Of these establishments, 63.5 percent are independent while
36.5 percent are part of a chain. Canadians make approximately 18 million restaurant visits daily. The
industry purchases C$23.3 billion of food and beverage products annually.
Institutional Contract
The Institutional foodservice sector in Canada totaled approximately C$3.7 billion in 2011. This total
was expected to climb 5.6 percent in 2012 to reach over C$3.9 billion. The institutional sector consists
of hospitals, residential care facilities, schools, prisons, factories, remote facilities and offices, including
patient and inmate meals.
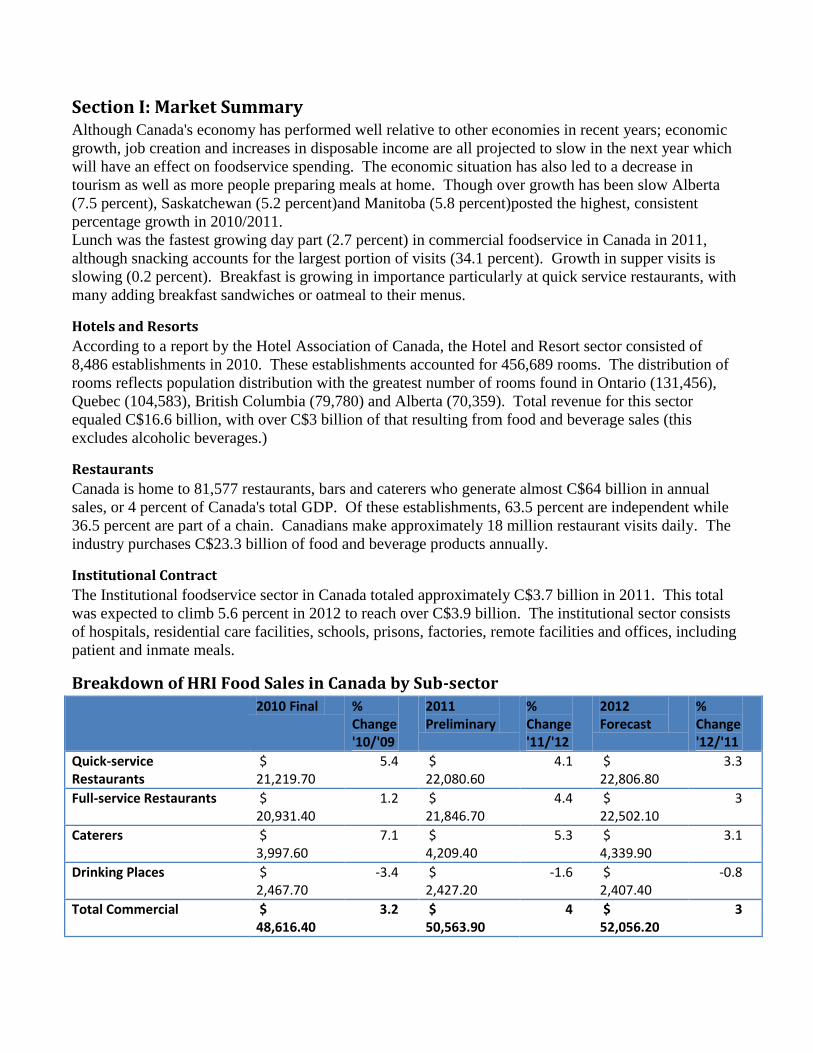
Breakdown of HRI Food Sales in Canada by Sub-sector
2010 Final % Change '10/'09
2011 Preliminary
% Change '11/'12
2012 Forecast
% Change '12/'11
Quick-service Restaurants
$ 21,219.70
5.4 $ 22,080.60
4.1 $ 22,806.80
3.3
Full-service Restaurants $ 20,931.40
1.2 $ 21,846.70
4.4 $ 22,502.10
3
Caterers $ 3,997.60
7.1 $ 4,209.40
5.3 $ 4,339.90
3.1
Drinking Places $ 2,467.70
-3.4 $ 2,427.20
-1.6 $ 2,407.40
-0.8
Total Commercial $ 48,616.40
3.2 $ 50,563.90
4 $ 52,056.20
3

2010 Final % Change '10/'09
2011 Preliminary
% Change '11/'12
2012 Forecast
% Change '12/'11
Accommodation Foodservice
$ 5,206.00
7.1 $ 5,503.00
5.7 $ 5,764.00
4.7
Institutional Foodservice1 $ 3,635.50
4.3 $ 3,774.90
3.8 $ 3,986.50
5.6
Retail Foodservice $ 1,284.60
0.2 $ 1,306.70
1.7 $ 1,326.30
1.5
Other Foodservice $ 2,254.80
2.7 $ 2,304.40
2.2 $ 2,350.50
2
Total Non-commercial $ 12,380.90
4.7 $ 12,889.00
4.1 $ 13,427.30
4.2
Total Foodservice $ 60,997.20
3.5 $ 63,452.80
4 $ 65,483.50
3.2
Menu Inflation 2.4 2.9 2.5
Real Growth 1.1 1.1 0.7
Source: CRFA's InfoStats, Statistics Canada, fsSTRATEGY Inc. and Pannell Kerr Foster Please check CRFA's website (www.crfa.ca for updates)
All dollar amounts in millions of Canadian dollars 1 - Includes vending, sports and private clubs, movie theatres, stadiums, and other seasonal or entertainment operations
Expected Growth Rate of Canadian Foodservice Sector

Expected Growth Rate by Sub-Sector
U.S. Exports of Agriculture, Fish and Forestry Products to Canada
(in thousands of U.S. dollars)
Product 2008 2009 2010 2011 2012 % Change

'11/'12
Bulk (includes wheat, grains, coffee, sugar etc.)
1,264,266
974,988
973,075
1,003,975
964,928
-3.89
Intermediate (includes oils, seeds, live animals etc.)
2,998,780
2,792,761
2,853,708
3,251,846
3,563,967
9.6
Consumer-oriented (includes snack food, meat, dairy, fruits, vegetables, wine etc.)
11,995,189
11,772,889
12,769,727
14,361,365
15,479,361
7.78
Forest Products
2,404,274
1,808,121
2,118,852
2,227,746
2,365,349
6.18
Seafood Products
769,612
653,409
772,804
900,911
893,020
-0.88
Agricultural Products Total
16,258,235
15,540,639
16,596,511
18,617,185
20,005,257
7.47
Ag, Fish & Forestry Products Total
19,432,121
18,002,169
19,488,167
21,745,842
23,266,626
6.99
Advantages and Challenges for U.S. HRI Food Products
Advantages Challenges
Majority of U.S. products enter Canada duty free under NAFTA Dairy and poultry product imports
are controlled and limited by a
tariff rate quota system
Canadian consumers have a very good perception of U.S.
products and much prefer them to products of different origins
when Canadian products are not available
Foodservice industry
predisposition to buy Canadian
first means a unique competitive
advantage is necessary
Geographical proximity gives U.S. exporters an advantage in
terms of transit time and cost as well as speed after ordering
Geographical vastness encourages
regional production and
distribution
Familiarity and confidence in Canadian based U.S. hotel,
restaurant and fast food establishments
Competition from domestic
producers and other countries
Canada's wide ethnic diversity provides broad specialty cuisine A sophisticated selection of

opportunities product is already available in the
Canadian market
The Canadian dollar is near parity with the U.S. dollar providing
a significant boost to U.S. products
Requirements for labeling,
formulation and sizing are
different than in the United States
Canadian consumers enjoy a high disposable income compared to
the rest of the world
U.S. foods match Canadian tastes and expectations
Canadian organic food demand exceeds current domestic
production stimulating significant imports from the United States.
Mutual recognition of each other's organic certification
procedures enables U.S. producers to export with a USDA
certification.
Section II: Road Map for Market Entry
Entry Strategy Though Canada is a long established market for U.S. agricultural products, plenty of opportunities exist
for companies interested in exporting. In Fiscal Year 2012 (October 2011 to September 2012), U.S.
agricultural exports to Canada grew by almost C$1.5 billion dollars, or 7 percent over FY2011.
Companies in the United States enjoy advantages made possible by an established shipping corridor,
similar consumer preferences and expectations as well as favorable duty rates under NAFTA.
Canadians are always on the lookout for new and innovative U.S. products, but each sector and product
can pose its own challenges. These obstacles can include currency, labeling and customs. With the
right tools, these can be overcome. Following are the main steps for U.S. exporters who are looking to
enter the Canadian market.
1) Contact your State Regional Trade Group
State Regional Trade Groups (SRTGs) are non-profit organizations representing state agricultural
promotion agencies that use federal, state and industry resources to promote the export of food and
agricultural products. They can help qualifying exporters to obtain partial reimbursement for some
marketing costs.
Food Export
Association of the
Midwest USA
Illinois, Indiana, Iowa, Kansas, Michigan,
Minnesota, Missouri, Nebraska, North Dakota,
Ohio, South Dakota, Wisconsin
www.foodexport.org 309 West Washington,
Suite 600
Chicago, IL 60606
USA
Phone 312.334.9200

Fax 312.334.9230
Food Export USA
Northeast
Connecticut, Delaware, Maine, Massachusetts,
New Hampshire, New Jersey, New York,
Pennsylvania, Rhode Island, Vermont
www.foodexport.org
One Penn Center
1617 JFK Blvd
Suite 420
Philadelphia, PA 19103
USA
Phone 215.829.9111
Fax 215.829.9777
Southern United
States Trade
Association
Alabama, Arkansas, Florida, Georgia, Kentucky,
Louisiana, Maryland, Mississippi, North Carolina,
Oklahoma, South Carolina, Tennessee, Texas,
Virginia, West Virginia, the Commonwealth of
Puerto Rico
www.susta.org
701 Poydras Street
Suite 3725
New Orleans, LA
70139
Phone: (504) 568-5986
Fax: (504) 568-6010
Western United
States Agricultural
Trade Association
Alaska, Arizona, California, Colorado, Hawaii,
Idaho, Montana, Nevada, New Mexico, Oregon,
Utah, Washington, Wyoming
www.wusata.org 4601 NE 77th Ave,
Suite 240
Vancouver, WA 98662
Tel: 360-693-3373
Fax: 360-693-3464
Additionally, many commodities have their own marketing associations which may be able to provide
additional, product specific information. A listing of the groups who are active in Canada be found
here: http://www.tasteus.ca/about/listing-of-cooperators/
2) Research the Competitive Marketplace
A thorough understanding of consumer trends and needs is vital to developing a market strategy. The
internet offers a wealth of information for U.S. exporters interested in researching the many aspects and
particularities of the Canadian food and beverage market. Though some consumer data can only be
obtained with a fee, there are several industry specific publications that continuously report on specific
developments of interest for U.S. exporters. Some of these resources are listed in the table below.
The Foreign Agricultural Service (FAS) publishes reports on Canada throughout the year. These reports
can be found at http://gain.fas.usda.gov . Additionally, FAS Canada has launched a new website
targeted at Canadian consumers. It also contains links to the State Regional Trade Groups and
cooperators as well as articles that may be of interest to U.S. exporters. The website can be found at
www.tasteus.ca.
The Canadian government has recently passed the "Safe Food for Canadians Act" which will result in
changing regulations for food products entering the Canadian market. It will be important to monitor
changes caused by this act over the coming year. FAS Canada puts out regular updates on changes in
Canada in its "This Week in Canadian Agriculture" (TWICA) newsletters. To be added to this list,
please contact the FAS Canada office at [email protected].
Canadian Government Market Information Resources:
Agriculture and Provides information and research on policies and www.agr.gc.ca

Agri-Food Canada programs. Also provides access to statistics. This
Ministry is the counterpart to the USDA.
Industry Canada Information on specific sectors, as well as company
profiles and other databases
www.ic.gc.ca
Statistics Canada The official source for Canadian social and economic
statistics and products.
www.statcan.gc.ca
Industry Associations:
Canadian Restaurant and Foodservices Association
The largest hospitality association in
Canada.
www.crfa.ca
Hotel Association of Canada
National resource for the Hotel and
Lodging Industry in Canada.
www.hotelassociation.ca
I.E. Canada (Canadian Association of Importers and Exporters)
I.E. Canada is a national, non-profit
organization committed to providing
services to develop and enhance the
international trade activity and
profitability of importers and exporters.
www.iecanada.com
Restaurant Central Research site maintained by the CRFA http://www.restaurantcentral.ca/
Industry Publications:
Canadian Grocer Focus is on retail, but contains
good information on market
trends.
www.canadiangrocer.com/
Canadian Restaurant and Foodservice News
Bi-monthly publication by the
CRFA.
www.crfa.ca
Food in Canada Focus in on manufacturing, but
contains good information on
changing requirements and
industry developments.
www.canadianmanufacturing.com/food
Foodservice and Hospitality
Monthly magazine focusing on the
Hospitality Industry in Canada.
www.foodserviceworld.com
Hotelier Magazine Published 8 times per year, focuses
on hotel industry in Canada
www.hoteliermagazine.com
3) Locate a Broker/Distributor/Importer
It is recommended that most new entrants to the Canadian market secure the services of a broker and/or
distributor.
Local representation provides exporters with a domestic advantage to understanding the local, regional
and national markets and the opportunities available. Brokers and distributors provide guidance on best
business practices, sales contacts, market development, logistics and government regulations. Many
also provide merchandising and marketing programs and their volume purchasing power can help
reduce retail slotting fees.

The Foreign Agricultural Service offices in Ottawa and Toronto can provide assistance in locating a
broker or distributor by assembling lists of potential partners. Contacts can be made while exhibiting at
the USDA endorsed pavilion at SIAL Canada. The office has also assembled a partial list of industry
brokers and distributors in central Canada.
4) Understand Canadian government standards and regulations that pertain to your product
The Canadian Government has multiple acts that govern the importation and sales of foods. Some of the
most important ones are:
Canada Agricultural Product Act and Associated Regulations
Consumer Packaging and Labelling Act
Fish Inspection Act
Food and Drug Act
Food and Drug Regulations
Importation of Intoxicating Liquors Act
Meat Inspection Act
Weight and Measures Act
A more thorough outline of applicable acts and regulations can be found on the Canadian Food
Inspection Agency's website at: www.inspection.gc.ca.
The Canadian Food Inspection Agency, Health Canada and the Department of Foreign Affairs and
International Trade are the main government ministries U.S. exporters can contact for specific
information when studying regulations with which they need to comply. Though Canada and the U.S.
share many consumer trends, cultural similarities and lifestyles, many regulations differ – including
nutrition facts, ingredient declarations and health claim labeling. Moreover, as previously mentioned,
Canada is in the process of drafting several major regulatory changes. Exporters should make an effort
to stay abreast of the latest developments.
Canada Border
Services Agency
The Canada Border Services Agency (CBSA)
ensures the security and prosperity of Canada by
managing the access of people and goods to and
from Canada.
www.cbsa.gc.ca
Canadian Food
Inspection Agency
(CFIA)
Government of Canada's regulator for food
safety (along with Health Canada), animal health
and plant protection.
www.inspection.gc.ca
Canada Revenue
Agency
The Canada revenue Agency (CRA) administers
tax laws for the Government of Canada and for
most provinces and territories as well as various
social and economic benefit and incentive
programs delivered through the tax system.
www.cra-arc.gc.ca
Department of
Foreign Affairs and
International Trade
(DFAIT)
The mandate of Foreign Affairs and International
Trade is to manage Canada's diplomatic and
consular relations and to encourage the country's
international trade. DFAIT manages all tariff
rate quotas and supplemental import permits for
controlled products (primarily dairy and poultry).
www.international.gc.ca

Department of
Justice Canada –
Justice Laws
Website
Online consolidation of PDFs of Canadian
Government Acts and regulations.
http://laws-
lois.justice.gc.ca/eng/
Health Canada Administers the Food Safety Assessment
Program, which assesses the effectiveness of the
CFIA's activities related to food safety.
www.hc-sc.gc.ca
For more information on food labeling and other information useful to U.S. food exporters, refer to the
Canada 2012 Exporter Guide on the FAS Website at http://gain.fas.usda.gov.
Information exporters need to understand about labeling regulations can be found on the following sites:
Nutrition Labelling Resource Page
http://www.inspection.gc.ca/english/fssa/labeti/quest/gengene.shtml
The Guide to Food Labelling and Advertising
http://www.inspection.gc.ca/food/labelling/guide-to-food-labelling-and-
advertising/eng/1300118951990/1300118996556
In order to better provide information, the CFIA maintains a National Import Service Centre (NISC),
which handles telephone inquiries regarding import requirements and inspections, in addition to
processing import documentation and data. The contact information of the NISC is as follows:
7:00 a.m. to 03:00 a.m. (Eastern Time)
Telephone and EDI: 1-800-835-4486 (Canada or U.S.A.)
1-289-247-4099 (local calls and all other countries)
Facsimile: 1-613-773-9999
5) SIAL Canada
The USDA and FAS Canada endorse and organize a U.S. pavilion at SIAL Canada every year. The next
SIAL Canada show is scheduled for April 30 to May 2 in Toronto, Ontario. For further information,
please contact:
Office of Agricultural Affairs
Embassy of the United States of America
P.O. Box 866, Station B
Ottawa, Ontario
Phone: (613) 6885267
Fax: (613) 6883124
Email: [email protected]

Market Structure
Domestic and imported food products in the Canadian market may route directly to foodservice
establishments but most filter through importers, brokers, distributors, wholesalers and/or re-packers.
Smaller restaurants or hotel foodservice establishments make food service purchases through a
wholesaler or distributor. Large chains may choose to purchase directly through customized growing
agreements, contract purchasing, central procurement office or from a chain-wide designated distributor.
Many Canadian foodservice establishments purchase the majority of product through the large
foodservice distributors like Gordon Food Service and Sysco. Specialty and niche products are often
purchased through smaller distributors.
FAS Canada has assembled a partial list of industry brokers and distributors in a report entitled Agent
and Broker Directory – Central Canada. Additionally, Western Grocer also maintains a list of brokers
on its website. These companies primarily handle retail outlets, but some deal with foodservice as well.
Sub-Sector Profiles
Hotels and Resorts
Company Name Outlet Name, Type & Number of Outlets Sales (C$ Mil)/Year
Location
Four Seasons Hotels and Resorts23
86 $ 1,210.0 Global
Fairmont Raffles Hotels International23
99 $ 1,205.0 Global
U.S. Exporter
Hotel
Foodservice Restaurant
Foodservice
Institutional
Foodservice
Canadian Food
Inspection
Agency
Customs
Importer Distributor Wholesale
r
Broker Re-packer

Company Name Outlet Name, Type & Number of Outlets Sales (C$ Mil)/Year
Location
Northland Properties Corporation
199 (Sandman Hotel Group, Sutton Place Hotels and restaurants Denny's, Moxie's, Shark Club, Chop
Steakhouse, Rockford Grill)
$ 470.0 National
Westmount Hospitality Group3
167 (manages various brands including Holiday Inn,
Radisson and Delta)
$ 270.0 National
Starwood Hotels & Resorts Worldwide
60 (in Canada)
$ 166.0 Global
Hilton Worldwide Inc.1 84 (in Canada)
$ 147.0 Global
Best Western International1
198 $ 117.7 Global
Marriott Hotels of Canada
66 $ 106.1 National
Coast Hotels & Resorts 31 $ 57.3 National
Atlific Hotels1 46 (manages various brands including Holiday Inn,
Crowne Plaza and Marriott)
$ 55.0 National
Source: Foodservice and Hospitality Magazine Top 100 Report
1 - Foodservice sales only
2 - Canadian owned company whose operations outside Canada are reflected in revenues and units
3 - Sales estimated
In 2011, the accommodation sector in Canada generated C$16.4 billion in revenue. For 2012, the
occupancy rate was projected to reach 62 percent while the average daily rate was expected to be C$129.
Over half of all overnight travel in Canada by Canadian residents is for pleasure. Hotels are by far the
most common choice for overnight stays.
Restaurants
Company Name Outlet Name, Type & Number of Outlets
Sales (C$ Mil)/Year
Location
Tim Horton's Inc.2 4,014 $ 6,058.0 National and U.S.

Company Name Outlet Name, Type & Number of Outlets
Sales (C$ Mil)/Year
Location
McDonald's Restaurants of Canada Ltd.
1,408 $ 3,550.0 National
Subway 2,717 $ 1,500.0 National
Cara Operations 689 Swiss Chalet, Harvey's, Kelsey's, Montana's, Milestones, Coza!
$ 1,311.0 National
Starbucks Coffee Canada Inc.
1,115 $ 1,200.0 National
Yum! Restaurants International (Canada)
1,028 KFC, Pizza Hut, Taco Bell
$ 1,100.0 National
Boston Pizza International Inc.2
392 $ 905.0 Global (346 in Canada)
A&W Food Services of Canada Inc.
749 $ 824.6 National
Wendy's Restaurants of Canada inc.
368 $ 641.0 National
MTY Tiki Ming Enterprises Inc.2
2,263 Jugo Juice, Koryo Korean
Barbeque, Mr. Sub
$ 528.0 Canada and the U.S.
Source: Foodservice and Hospitality Magazine Top 100 Report
2 - Canadian owned company whose operations outside Canada are reflected in revenues and units
3 - Sales estimated
Quick-service restaurants (QSRs) in Canada have been upgrading the quality and nutrition of their food,
specifically items such as coffee, pizza and burgers. The sector has been making gains on the casual
dining sector in Canada. QSRs have also been upgrading their interiors to help bolster customer
experience as well.
Institutional
Company Name Outlet Name, Type & Number of Outlets Sales (C$
Mil)/Year
Location
Compass Group Canada 1,450 (focus on educational institutions, hospitals,
airports, businesses)
$ 1,500.0
National

Company Name Outlet Name, Type & Number of Outlets Sales (C$
Mil)/Year
Location
Aramark Canada Ltd.4 1,500 (focus on health-care, educational, public
and remote-market businesses)
$ 916.0
National
Sodexo Canada Ltd. 750 (focus on educational institutions, hospitals
and corporate businesses)
$ 550.0
National
Cineplex Entertainment LP1 446 $ 291.6
B.C. to Quebec
British Columbia Ferry Services Inc.
36 $ 56.4
Coastal B.C.
Dana Hospitality Inc. 104 (residential and educational foodservice,
resource industries, seniors' market)
$ 47.0
National
ClubLink Corporation 46 (Golf Courses)
$ 40.7
National
byPeterandPauls.com 7 (catering and banquet halls)
$ 27.0
Ontario
Metro Toronto Convention Centre
1 $ 25.0
Toronto
Stagewest Hospitality 8 $ 24.3
National
Source: Foodservice and Hospitality Magazine Top 100 Report
1 - Foodservice sales only
2 - Canadian owned company whose operations outside Canada are reflected in revenues and units
3 - Sales estimated
4-Fiscal Year Data

Competition
Product
Category
Major
Supply
Sources
Strengths of Key Supply
Countries
Advantages and
Disadvantages of Local
Suppliers FRESH FRUITS & VEGETABLES VEGETABLES:
CANADIAN GLOBAL IMPORTS: U.S.$2.2 BILLION
VEGETABLES: 1. U.S.: 66% 2. Mexico: 25% 3. China: 2%
Canada is the largest foreign buyer of U.S. fruits and vegetables. The U.S. benefits from relatively unimpeded export access into Canada during Canada’s winter or non-growing months.
Among imports, U.S. fruits and vegetables are viewed by most Canadians as their number one choice to other imports.
Mexico gained significant share of the market due to lower prices. Their leading products are tomatoes, peppers, avocados, mangos, and limes. Recently, Mexico has begun offering strawberries.
Chile is competitive with their leading exports of grapes and berries. They offer apples and cherries as well.
Dry onions, carrots, lettuce, sweet corn, cabbage are the leading vegetables sold in the fresh market.
Apples are the largest production item, followed by blueberries, cranberries, grapes and peaches.
Seasonality poses a constraint to growers; Canada imports 80% of its fresh vegetables between November and June.
The ‘Buy Local’ campaigns are well supported by grocery retailers starting in June through October with year round support becoming more common as well.
FRUIT:
CANADIAN GLOBAL IMPORTS: U.S. $3.1 BILLION
FRUIT: 1. U.S.: 48% 2. Mexico: 11% 3. Chile: 10% 4. Costa Rica:
6%
PROCESSED FRUITS AND VEGETABLES
CANADIAN GLOBAL IMPORTS: U.S. $ 1.9 BILLION
1. U.S.: 59% 2. China: 9% 3. Thailand: 4%
The U.S imports amounted to U.S$ 1.2 billion. There is a full range of prepared and frozen products. Major products are prepared potatoes, tomato paste, mixed fruits, and a variety of processed vegetables.
The U.S. is a major player in the market with established process brands.
China has seen a 15% growth in the category of dried fruits and vegetables.
Thailand's major products are pineapples and fruit mixtures.
Canadian companies process a wide range of canned, chilled, and frozen products.
Adoption of advanced technologies in food processing has been fairly extensive among Canadian processors. Statistics Canada reported almost 50% companies reported adopting more than 5 new technologies in their operations.
Higher manufacturing and operation costs than in the U.S.
SNACK FOODS
CANADIAN GLOBAL IMPORTS: U.S. $ 1.5 BILLION (excluding nuts)
1. U.S.: 58% 2. Germany: 5% 3. Belgium: 5 % (U.S. share of
sub category 82%)
The U.S. dominates this category given the more perishable and bulky nature of some products, such as chips, which adds significantly to shipping costs.
Competitors vary by sub category, with the main competitors being: Germany (cocoa, confectionaries and chocolate), Belgium (chocolate and confections), U.K. and Switzerland (chocolate, along with confection and non-confection items).
Canada’s snack food imports have grown by U.S. $ 316 million since 2006. The category includes chocolate and non-chocolate confectionary, cookies, crackers, potato chips, corn chips, popped popcorn, pretzels, and extruded cheese snacks, seed snacks, mixed nuts, peanuts and peanut butter, as well as pork rinds.
The snack food industry is served primarily by domestic manufacturers, however domestic market share is being

Product
Category
Major
Supply
Sources
Strengths of Key Supply
Countries
Advantages and
Disadvantages of Local
Suppliers lost to imports. The rapid increase in imports is due both to the strengthening Canadian dollar and a number of new products in the category, many targeted at specific ethnic groups
Canada does have domestic raw materials for the grain based products but has to import sugar, chocolate, cacao, and nuts for manufacturing and is not competitive on dairy and egg ingredients used in some of the processing.
RED MEATS
(Fresh/Chilled/Frozen) CANADIAN GLOBAL IMPORTS: U.S. $1.7 BILLION RED MEATS
(Prepared/Preserved)
1. U.S.: 79% 2. New
Zealand: 12%
3. Australia: 6% 1. U.S.: 94% 2. Thailand: 2% 3. Brazil: 2%
Beef imports fall into two distinct categories. The largest portion of imports being chilled cuts traditionally from the U.S. Midwest heavily destined for the Ontario region. The other part is frozen manufacturing meat from Australia (for grinding) and New Zealand (largely for specific manufacturing purposes).
Uruguay, which is beginning to make inroads in the manufacturing market, remains ineligible for entry to Canada (except as a supplier of cooked and canned beef) due to sanitary reasons.
Canada continues to grow as a key U.S. pork export market. Canadian hog production numbers have been declining across the country and U.S. pork imports are up 6.5% due to market structures and the Canadian strong dollar.
The industry has worked its way out of the inventory surge from the BSE trade disruption. Canadian exports have been sluggish due to a strong Canadian dollar but increased by 1% in 2011.
Canadian per capita basis consumption has declined since 2006 from 31 kilograms to 29 kilograms.
FISH & SEAFOOD
CANADIAN GLOBAL IMPORTS: U.S. $ 2.4 BILLION
1. U.S.: 36% 2. China: 16% 3. Thailand:16%
Two major categories make up approximately half of the imports: Crustaceans (including lobster, crab, shrimp and prawn) totaling U.S. $ 915 million with the U.S. representing 34% market of the share; Thailand’s share is 26% and China’s is 11%. The other category is fresh and frozen fish fillets. Canada world imports are U.S. $ 1 billion with the U.S. share at 24% followed by China at 24%, Thailand at 14%., and Chile at 10%.
Fish filleting is extremely labor intensive, which accounts for the rapid penetration of China and Thailand in this segment.
With ocean catches having peaked, aqua culture is becoming a more important
Declining fish stocks have lad to almost zero growth in fish and seafood catch over the last decade.
In total, the capture fishery
accounts for 76 percent of total fish and seafood production in Canada.
Lobster, crab and shrimp comprise 67% of the landed value of all fish and shellfish harvested in Canada.
Aquaculture is increasing in importance. Key products include farmed salmon, trout, steelhead, arctic char, blue mussels, oysters and manila clams.
At approximately 50 lbs. per person, Canadian consumption of fish is significantly higher than

Product
Category
Major
Supply
Sources
Strengths of Key Supply
Countries
Advantages and
Disadvantages of Local
Suppliers source of product and China is the dominant producer of farmed fish and seafood in the world.
A growing concern among consumers and retailers for sustainable production practices may help some U.S. fish processors.
More than two-thirds of seafood is sold by retailers.
in the U.S. 16.5 lbs. per person, making Canada an excellent export market for U.S. exporters.
BREAKFAST CEREALS/PANCAKE MIXES
CANADIAN GLOBAL IMPORTS: U.S. $ 424 MILLION
1. U.S.: 93% 2. U.K.: 2% 3. Mexico: 1%
Breakfast cereal imports have grown by over US $150 million since 2006. The U.S. continues to dominate imports although a variety of competitors are all growing small niche positions.
Canada represents the largest market for U.S. Breakfast cereals accounting for approximately half of U.S. exports.
Sales and manufacturing in Canada is largely controlled by U.S. based companies.
Domestic non-U.S. owned competitors tend to be in the specialty or organic breakfast cereal business.
Canadian consumption of breakfast cereals reached an annual 9 lbs per person.
Three key trends in cereal consumption have driven continues growth, reduced sugar, high fiber whole wheat, and hot cereals.
FRUIT & VEGETABLE JUICES
CANADIAN GLOBAL IMPORTS: U.S. $739 MILLION
1. U.S.: 60% 2. Brazil 15% 3. China 7%
U.S. imports to Canada increased and fastest growing juice category, fresh orange juice.
Brazil is the leader in frozen orange juice concentrate, the second largest imported juice category, with 70% of the import share.
China’s major juice export to Canada is fortified apple juice; China represents 89% of this import market.
Canada is a major per capita consumer of citrus juices but is unable to grow these products. It will continue to be an exceptional value added market for the U.S.
Both Canada and the U.S. have experienced major penetration by Chinese apple juice due to the major shift of Chinese agriculture toward labor-intensive crops and labor intensive processing.
NUTS
CANADIAN GLOBAL IMPORTS: U.S. $609 MILLION
1. U.S.: 54% 2. Turkey: 15% 3. Vietnam 9%
In 2010 and 2011 U.S. imports of almonds, peanuts and walnuts increased between 26% to 28% from the previous year.
US products, led by peanuts and almonds, are preferred by Canadian importers as it meets Canadian sanitary and phytosanitary standards consistently.
Turkey is a competitive supplier of Hazelnuts.
Vietnam competes with cashew nuts.
Growing trend of nut allergens by Canadians has caused the
Canadian per capita consumption of peanuts and tree nuts increased respectively from 2.4 to 2.7 kg and 1.2 to 1.3 kg from 2005 to 2006.
Canada has areas of Ontario, which can grow peanuts, but it has not done so in commercial quantities as the returns are not competitive with other crop alternatives. Similarly British Columbia and other provinces produce small quantities of a number of tree nuts including hazelnuts. However, in general, Canada is not price competitive.

Product
Category
Major
Supply
Sources
Strengths of Key Supply
Countries
Advantages and
Disadvantages of Local
Suppliers Canadian Food Inspection Agency and Health Canada to set specific allergen labeling regulations for all suppliers. Many schools and public spaces (including Air Canada) are banning nuts to maintain a safe environment for those with allergies.
PET FOOD
( Dog and Cat) CANADIAN GLOBAL IMPORTS: U.S. $ 536 MILLION
1. U.S.: 94% 2. China: 2% 3. Thailand: 2%
U.S. imports of dog and cat food registered at U.S. $ 505 million in 2011.
Canadians regard U.S. pet foods as a trusted and quality product.
Pet food sector is largely U.S. owned multinationals.
Canada has approximately 17 (non-raw) pet food manufacturers.
New pet food importation requirements have been in place as of June 2009.
More than 322,000 tons of pet food is sold in Canada.
Products Facing Significant Barriers in Exporting to Canada
Product Category
Major Supply Sources
Strengths of Key Supply Countries
Advantages and Disadvantages of Local Suppliers
POULTRY
CANADIAN GLOBAL IMPORTS: U.S. $331 MILLION
1. U.S.: 85% 2. Brazil: 12 % 3. Chile: 2 %
The U.S. is the world’s largest producer of poultry meat. Brazil is the largest exporter of poultry meat and can land product in Canada at a lower cost compared to the U.S.
Brazil has rapidly expanded its share of the Canadian broiler market except with Canadian further processing plants that do not want to take the risk of commingling U.S. and Brazilian origin which would result in being unable to sell processed products to the U.S.A.
Increases in imports of U.S. chicken are due in part to imports under the Canadian Import for Re-Export Program (IREP).
The Canadian poultry industry is a Tariff Regulated Industry with live bird and meat prices well above the world market. The Canadian strategy has been to differentiate the product particularly at retail through air chilling and such additional attributes as ‘vegetable grain fed chicken.” However the scale of plant operations in Canada remains relatively small due to the supply managed system. In an effort to mitigate this and to offset difficulty obtaining labor, Canadian processing plants are among the most highly mechanized sectors in Canadian agriculture and employ the latest in robotics.
The Canadian industry has significantly increased surveillance since the A.I. outbreaks in B.C. in 2004 and has continuously improved bio-security measures.
DAIRY
CANADIAN GLOBAL IMPORTS: (excluding cheese) : U.S. $ 306 MILLION
1. U.S.: 61% 2. New Zealand:
17 % 3. Argentina: 9%
The U.S.’s close proximity to market, speedy delivery, and significant freight advantage has allowed it to be competitive in the Canadian Import for Re-export Program (IREP) which allows U.S. dairy product to be imported into Canada duty free, and used in further processing, provided the product is subsequently exported.
The European Union has a
The Canadian dairy market operates under a supply management system, which attempts to match domestic supply with domestic demand while paying producers on a cost of production related formula. This system has tended to price dairy products above prevailing world levels. Imports are controlled under Tariff-rate-quota (TRQ) and over quota imports are subject to high tariffs.
American suppliers have taken advantage of the Import for Re-export Program (IREP), which allows Canadian processors to import

Product Category
Major Supply Sources
Strengths of Key Supply Countries
Advantages and Disadvantages of Local Suppliers
(Cheese) : U.S. $265 MILLION
1. Italy.: 23% 2. France: 21.5% 3. U.S.: 21%
distinct advantage in the cheese trade since it has been allocated 66% of Canada’s cheese quota as a result of the 1994 Agreement on Agriculture (AoA). Italy recently surpassed France as the largest supplier of cheese from the E.U.
New Zealand has a cost leadership advantage. Low costs of production due to the availability of year-round pasturage have helped New Zealand achieve a 30% share of world dairy exports. New Zealand has an additional advantage on butter imports into Canada and hold 61% of Canada’s import quota for butter.
dairy products used in manufacturing provided the product is exported. The U.S. is the largest user of this program due to the perishable nature of the products.
Canadian tariff rate quotas stipulate a 50 percent dairy content guideline for imported product, resulting in the creation of ingredients and blend products that are designed to circumvent this guideline. Butter-oil-sugar blends were the first major products to be imported tariff-free, displacing Canadian milk for ice cream. More recently there has been an increase in flavored milks imported as “beverages” and a number of milk proteins which are not captured by the dairy TRQ. For example milk albumin from whey concentrates destined for dairy manufacturing increased by U.S. $ 10 million between 2010 and 2011.
EGGS & EGG PRODUCTS
CANADIAN GLOBAL IMPORTS: U.S. $75 MILLION
1. U.S.: 95%
2. China: 4%
The U.S. egg industry traditionally fills Canada’s needs when supply is seasonally low. There were significant increases in U.S. imports following the Avian Flu outbreaks in B.C. to both avert shortages in the market and rebuild the hatching egg supply.
The U.S. has also become a supplier of organic eggs to Canada.
Canada’s egg industry operates under Supply Management, which is designed to encourage production of a sufficient volume of eggs to meet market needs without creating surplus. The market is protected by high tariffs. Today, about 75% of Canada’s total egg production is sold for the table market, while the remaining 25% is used in the manufacturing of value-added food and other products (liquid, frozen or dried form). These supplies are supplemented by imports and a Tariff Rate Quota system.
The Canadian industry has made considerable inroads at retail with differentiated egg offerings such as “free range”, Omega 3, and Organic all of which are sold at a premium... The Canadian Egg Marketing Agency has a sustained media campaign focused on the health benefits of eggs to support retail movement.
Best Product Prospects
Diet Friendly Healthy eating has been a growing trend in Canada over the last several years. As a result, many
Canadians have become more aware of what their food contains and have identified certain ingredients
they would like to exclude. Demand for foods that are free of gluten, trans-fats, sugar and/or lactose is
growing. Functional foods and organics also continue to be popular. Voluntary sodium reductions are
taking place in processed products of all kind to take advantage of this trend.

Snacking
Snacking continues to grow in importance in the Canadian market. In Technomic's 2012 "Canadian
Snacking Consumer Trend Report," 56 percent of respondents revealed that they snack at least twice per
day. Foodservice outlets are responding by altering their menus, McDonald's snack wraps are an
example. Snacking also blurs the line between traditional dayparts, which has caused some outlets to
extend their service to allow for late-night options, longer breakfast hours etc. As an extension of this,
small plates and sharing meals are also becoming more popular in foodservice outlets.
Vegetables Vegetables are moving to the center of the plate in Canada and are no longer treated as solely side
dishes. This is a continuation of the trend toward healthy eating, which is now seeing more consumers
embrace "flexitarian" choices that do not always include meat. Leafy greens, such as kale and mustard
greens, are particularly expected to grow further in popularity in 2013.
Ethnic Foods Asian food is projected to continue to grow in popularity in the coming year. While Southeast Asian
cuisine will again be popular, there will also be a focus on more traditional and regional offerings from
China and Japan. In many cities in Canada, izakayas (casual, Japanese drinking establishments) as well
as noodle and ramen bars are popping up. In addition, meals that are a fusion of cuisines (i.e.
Vietnamese and Italian) will become more common.

Post Contact and Further Information
Conversion Rate Per the most recent Bank of Canada noon rate, on December 20, 2012, 1.00 Canadian Dollar(s) = 1.01
U.S. dollar(s), at an exchange rate of 1.0118 (using nominal rate).
Foreign Agricultural Service (FAS) Ottawa
From the U.S.:
Office of Agricultural Affairs
American Embassy
P.O. Box 5000
Ogdensburg, NY
13669
USA
From Canada:
Office of Agricultural Affairs
P.O. Box 866, Station B
Ottawa ON
K1P 5T1
Canada
Telephone: (613) 688-5267
Fax: (613) 688-3124
Email: [email protected]
Scott Reynolds, Agricultural Minister-Counselor
Robin Gray, Agricultural Attaché
Mihai Lupescu, Agricultural Specialist
Erin Danielson, Agricultural Specialist
Sonya Jenkins, Agricultural Marketing Specialist
Joyce Gagnon, Administrative Assistant
FAS Toronto:
From the U.S.:
Foreign Agricultural Service
U.S. Consulate General Toronto
P.O. Box 135
Lewiston, NY
14092-0135
USA
From Canada:
Foreign Agricultural Service
U.S. Consulate General Toronto
480 University Avenue, Suite 602
Toronto, ON
M5G 1V2
Canada
Telephone: (416) 646-1656
Fax: (416) 646-1389
Email: [email protected]
Maria Arbulu, Senior Agricultural Marketing Specialist
Market Sector Reports:
Listed below are the food sector and marketing reports published by FAS Canada. For a complete
listing of other Post reports and of FAS' worldwide agricultural reporting, visit the FAS GAIN web page
at http://gain.fas.usda.gov.
This Week in Canadian Agriculture is a periodic newsletter containing summaries of developments in
the Canadian market, including regulatory changes. To be added to the distribution list, please contact
FAS Canada at [email protected].

CA12050 FAIRS Export Certificate Report 12/21/2012
CA12049 Export Guide: A Practical Guide 12/21/2012
CA12048 This Week in Canadian Agriculture – Issue 22 12/19/2012
CA12046 The New Legislative Framework for Animal Traceability - Public 12/03/2012
CA12045 This Week in Canadian Agriculture – Issue 21 11/26/2012
CA12044 This Week in Canadian Agriculture – Issue 20 11/13/2012
CA12042 Grain and Feed Annual 10/30/2012
CA12041 Fresh Deciduous Fruit Annual 11/02/2012
CA12040 This Week in Canadian Agriculture – Issue 19 10/18/2012
CA12039 Dairy Annual 10/15/2012
CA12037 Potatoes Annual 10/01/2012
CA12036 Livestock Annual 09/11/2012
CA12035 This Week in Canadian Agriculture – Issue 18 08/17/2012
CA12034 Poultry and Products Annual 08/16/2012
CA12033 This Week in Canadian Agriculture Issue 17 08/14/2012
CA12032 This Week in Canadian Agriculture Issue 16 08/03/2012
CA12031 Grain and Feed July Quarterly 07/27/2012
CA12030 FAIRS Country Report 07/27/2012
CA12029 Biotechnology Annual 07/20/2012
CA12028 This Week in Canadian Agriculture, Issue 15 07/20/2012
CA12027 Biofuels Annual 2012 – revised 07/20/2012
CA12025 This Week in Canadian Agriculture, Issue 14 07/06/2012
CA12024 Biofuels Annual 2012 06/29/2012
CA12022 This Week in Canadian Agriculture, Issue 13 06/15/2012
CA12021 This Week in Canadian Agriculture, Issue 12 06/01/2012
CA12020 This Week in Canadian Agriculture, Issue 11 05/17/2012
CA12019 This Week in Canadian Agriculture, Issue 10 05/10/2012
CA12018 This Week in Canadian Agriculture, Issue 09 05/04/2012
CA12017 This Week in Canadian Agriculture, Issue 08 04/27/2012
CA12016 This Week in Canadian Agriculture, Issue 07 04/25/2012
CA12015 Oilseeds and Products Annual - Canada 04/10/2012
CA12014 Grain and Feed Annual Report - Canada 04/03/2012
CA12011 Retail Food Sector Report for Canada 03/08/12
CA12010 This Week in Canadian Agriculture, Issue 06 03/02/2012
CA12009 Livestock Semi-annual 03/02/2012
CA12008 This Week in Canadian Agriculture, Issue 05 03/02/2012

CA12006 Northern Trends – Winter 2012 02/03/2012
CA12005 Grain And Feed Quarterly 01/27/2012
CA12004 This Week in Canadian Agriculture, Issue 04 01/25/2012
CA12003 This Week in Canadian Agriculture, Issue 03 01/19/2012
CA12002 This Week in Canadian Agriculture, Issue 02
01/11/2012
CA12001 This Week in Canadian Agriculture, Issue 01 01/06/2012