canada food service - hotel restaurant institutional an ... gain publications/food service... ·...
TRANSCRIPT

THIS REPORT CONTAINS ASSESSMENTS OF COMMODITY AND TRADE ISSUES MADE BY
USDA STAFF AND NOT NECESSARILY STATEMENTS OF OFFICIAL U.S. GOVERNMENT
POLICY
Date:
GAIN Report Number:
Approved By:
Prepared By:
Report Highlights:
Canada remains a top U.S. agricultural export destination for consumer-oriented products offering
promising opportunities for small businesses to expand their sales to Canada. In fiscal year 2015, U.S.
agricultural exports to Canada reached $22 billion making Canada the second largest export destination,
closely behind China. However, a closer look reveals Canada remains in the number one position as the
ideal export market for U.S. consumer oriented products, reaching $17 billion, an amount double to the
second highest export destination, Mexico. For those U.S. food firms with unique and competitively
priced products, the food service sector serves as an excellent entry into the Canadian market.
Post:
Contents
Ottawa
Maria A. Arbulú – Senior Agricultural Marketing Specialist
Jeff Zimmerman – Agricultural Attaché and Director of Marketing
An Updated Overview of HRI Sector in Canada
Food Service - Hotel Restaurant Institutional
Canada
CA15110
12/11/2015
Required Report - public distribution
2 | P a g e
Section I: Market Summary .......................................................................................................................... 3
Breakdown of HRI Food Sales in Canada by Province and by Sub-Sector for 2015 ................. 3
Breakdown of HRI Food Sales in Canada by Sub-sector ........................................................... 6
Expected Growth Rate by Commercial Sub-Sector (2015-2018) ............................................... 7
Global and Canadian Imports of Consumer Oriented Foods ...................................................... 7
Advantages and Challenges for U.S. HRI Food Products .......................................................... 8
Section II. Road Map for Market Entry ....................................................................................................... 9
Entry Strategy .............................................................................................................................. 9
Frequently Asked Questions and their Answers ....................................................................... 12
Canadian Government Standards and Regulations ................................................................... 14
Key Contacts ............................................................................................................................. 16
Summary of Useful Websites .................................................................................................... 16
Section III. Market Structure and Foodservice Distribution Channel ........................................................ 19
Sub-Sector Profiles .................................................................................................................... 20
Hotels and Resorts .............................................................................................................................. 20
Restaurants ......................................................................................................................................... 22
Institutional ......................................................................................................................................... 25
Partial Listing of Foodservice Distributors ............................................................................... 26
Section IV. The GRID on Leading U.S. Products and the Competition ................................................... 27
Section V. Growing Trends ..................................................................................................................... 34
Section VI. Top Ten Hot Trends on Canadian Menus ............................................................................. 35
Appendix B. Summary of Key Resources .................................................................................................. 38
3 | P a g e
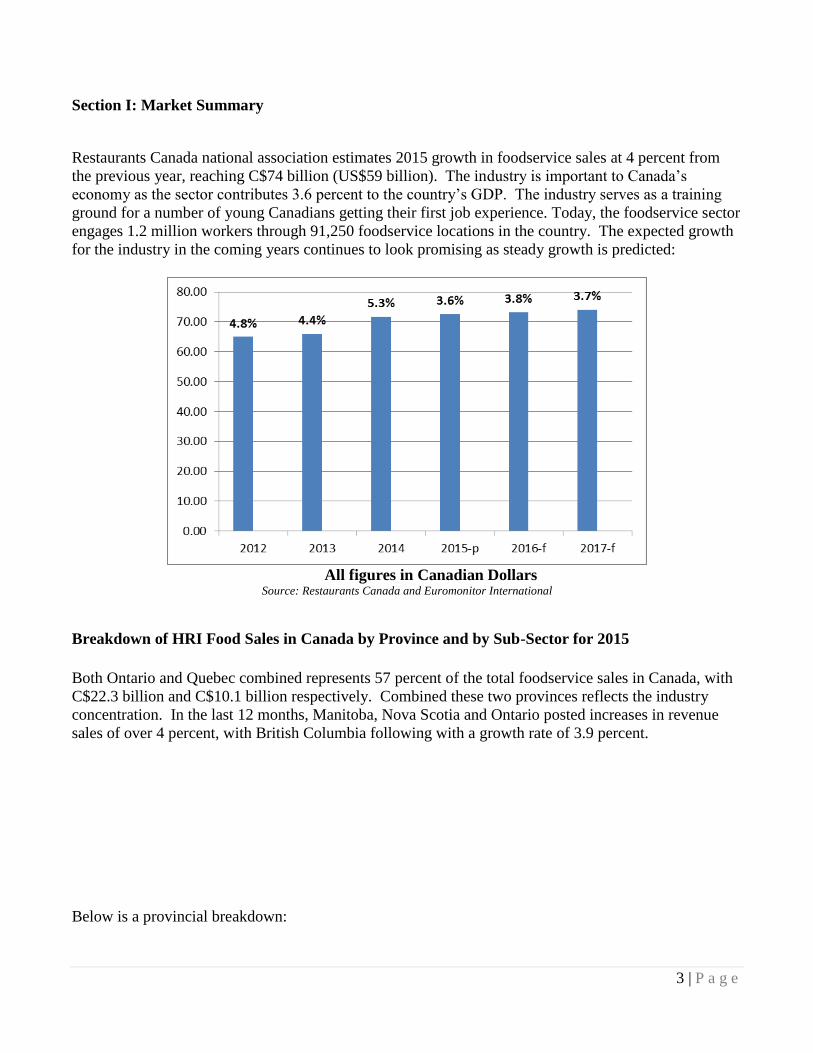
Section I: Market Summary
Restaurants Canada national association estimates 2015 growth in foodservice sales at 4 percent from
the previous year, reaching C$74 billion (US$59 billion). The industry is important to Canada’s
economy as the sector contributes 3.6 percent to the country’s GDP. The industry serves as a training
ground for a number of young Canadians getting their first job experience. Today, the foodservice sector
engages 1.2 million workers through 91,250 foodservice locations in the country. The expected growth
for the industry in the coming years continues to look promising as steady growth is predicted:
All figures in Canadian Dollars
Source: Restaurants Canada and Euromonitor International
Breakdown of HRI Food Sales in Canada by Province and by Sub-Sector for 2015
Both Ontario and Quebec combined represents 57 percent of the total foodservice sales in Canada, with
C$22.3 billion and C$10.1 billion respectively. Combined these two provinces reflects the industry
concentration. In the last 12 months, Manitoba, Nova Scotia and Ontario posted increases in revenue
sales of over 4 percent, with British Columbia following with a growth rate of 3.9 percent.
Below is a provincial breakdown:

4 | P a g e
Source: Statistics Canada and Restaurants Canada Industry Forecast
o Foodservice Subsectors
The industry falls into three main subsectors. They are hotels and resorts, restaurants, and the
institutional foodservice sector.
Hotels and Resorts
Canada attracts over 1.6 million international visitors from around the world with 75 percent of them
from the United States. The growing number of visitors help fuel the growth of foodservice in this
sector. The Hotel Association of Canada reports 8,090 hotels, motels and resorts that generated
revenues of close to C$17.5 billion (US$16 billion) in 2014 and in these ‘accommodation foodservice’
sales reached 6 billion (US$5.5 billion)1. These establishments accounted for 440,123 rooms. Growth
rate for ‘accommodation foodservice,’ in 2014/2015 is 4.6 percent. Canada continues to attract visitors
to its destinations, particularly with the strengthening of the U.S. dollar. Some of Canada’s most
profitable hotel chains are, Four Seasons Hotels and Resorts, Fairmont Hotels International, Starwood
Hotels & Resorts Worldwide, Marriott Hotels of Canada (acquired Delta Hotels), Wyndham Hotel
Group, Invest REIT, and Best Western International.
1 2014 Canadian Institutional Foodservice Market Report by fsStrategy, p. 10
5 | P a g e
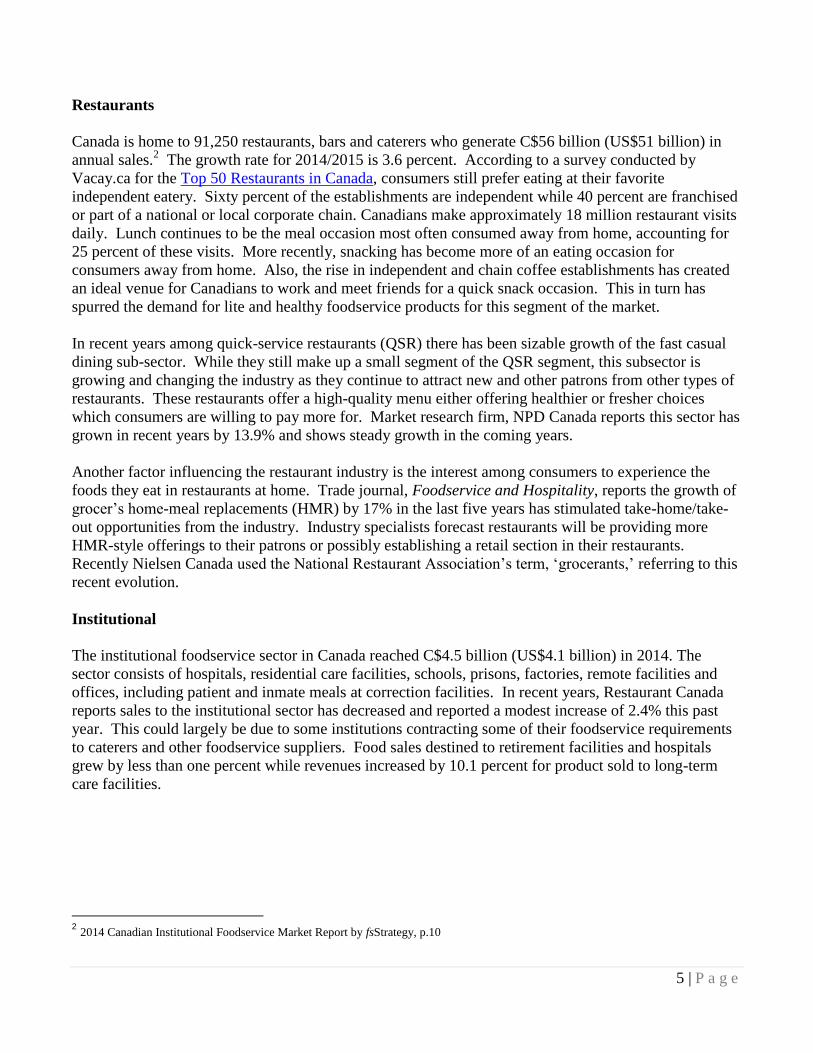
Restaurants
Canada is home to 91,250 restaurants, bars and caterers who generate C$56 billion (US$51 billion) in
annual sales.2 The growth rate for 2014/2015 is 3.6 percent. According to a survey conducted by
Vacay.ca for the Top 50 Restaurants in Canada, consumers still prefer eating at their favorite
independent eatery. Sixty percent of the establishments are independent while 40 percent are franchised
or part of a national or local corporate chain. Canadians make approximately 18 million restaurant visits
daily. Lunch continues to be the meal occasion most often consumed away from home, accounting for
25 percent of these visits. More recently, snacking has become more of an eating occasion for
consumers away from home. Also, the rise in independent and chain coffee establishments has created
an ideal venue for Canadians to work and meet friends for a quick snack occasion. This in turn has
spurred the demand for lite and healthy foodservice products for this segment of the market.
In recent years among quick-service restaurants (QSR) there has been sizable growth of the fast casual
dining sub-sector. While they still make up a small segment of the QSR segment, this subsector is
growing and changing the industry as they continue to attract new and other patrons from other types of
restaurants. These restaurants offer a high-quality menu either offering healthier or fresher choices
which consumers are willing to pay more for. Market research firm, NPD Canada reports this sector has
grown in recent years by 13.9% and shows steady growth in the coming years.
Another factor influencing the restaurant industry is the interest among consumers to experience the
foods they eat in restaurants at home. Trade journal, Foodservice and Hospitality, reports the growth of
grocer’s home-meal replacements (HMR) by 17% in the last five years has stimulated take-home/take-
out opportunities from the industry. Industry specialists forecast restaurants will be providing more
HMR-style offerings to their patrons or possibly establishing a retail section in their restaurants.
Recently Nielsen Canada used the National Restaurant Association’s term, ‘grocerants,’ referring to this
recent evolution.
Institutional
The institutional foodservice sector in Canada reached C$4.5 billion (US$4.1 billion) in 2014. The
sector consists of hospitals, residential care facilities, schools, prisons, factories, remote facilities and
offices, including patient and inmate meals at correction facilities. In recent years, Restaurant Canada
reports sales to the institutional sector has decreased and reported a modest increase of 2.4% this past
year. This could largely be due to some institutions contracting some of their foodservice requirements
to caterers and other foodservice suppliers. Food sales destined to retirement facilities and hospitals
grew by less than one percent while revenues increased by 10.1 percent for product sold to long-term
care facilities.
2 2014 Canadian Institutional Foodservice Market Report by fsStrategy, p.10

6 | P a g e
Breakdown of HRI Food Sales in Canada by Sub-sector
2013
Final
percent
Change
'13/12
2014
Prelimin
ary
percent
Change
'14/13
2014
Forecast
percent
Change
'15/'14
Quick-service
Restaurants
$
24,137.9
0
4.4
percent
$
25,536.00
5.8
percent
$
26,531.9
0
3.9
percent
Full-service
Restaurants
$
23,722.0
0
5.2
percent
$
24,916.30
5.0
percent
$
25,813.2
0
3.6
percent
Caterers $
4,600.40
3.4
percent
$
4,903.60
6.6
percent
$
5,085.00
3.7
percent
Drinking Places $
2,311.30
-1.2
percent
$
2,296.10
-0.7%
percent
$
2,312.10
0.7
percent
Total Commercial $
54,771.6
0
4.4
percent
$
57,651.90
5.3
percent
$
59,742.3
0
3.6
percent
Accommodation
Foodservice
$
5,623.00
3.1
percent
$
5,890.00
4.7
percent
$
6,162.00
4.6
percent
Institutional
Foodservice
$
4,252.50
6.1
percent
$
4,397.20
3.4
percent
$
4,501.00
2.4
percent
Retail Foodservice $
1,351.30
10.1%
percent
$
1,425.60
5.5 percent $
1,485.5
4.2
percent
Other Foodservice* $
2,416.30
2.3
percent
$
2,484.00
2.8 percent $
2,558.50
3.0
percent
Total Non-
commercial
$
13,643.1
0
4.5
percent
$
14,196.80
4.1
percent
$
14,707.0
0
3.6
percent
Total Foodservice $
68,414.0
0
4.5
percent
$
71,848.70
5.0
percent
$
74,449.2
0
3.6
percent
Menu Inflation 2.3 percent 2.1 percent 2.4
percent
Real Growth 2.2
percent
2.9
percent
1.2
percent
Source: Restaurants Canada’s InfoStats, Statistics Canada, fsSTRATEGY Inc. and Pannell Kerr Foster
All dollar amounts above in Canadian millions, October 1, 2014 to November 1, 2015 – USD$1.00 = CAD$1.24
*Includes vending, sports and private clubs, movie theatres, stadiums, and other seasonal or entertainment operations

7 | P a g e
Expected Growth Rate by Commercial Sub-Sector (2015-2018)
Source: Restaurants Canada’s Foodservice Facts (2014)
Global and Canadian Imports of Consumer Oriented Foods
Total Global
Imports
(US$ millions)
Total U.S. Food
Imports
(US$ millions)
U.S. Share of
Market Total Foodservice Sales
in Canada (US$ millions)
2010 20,243 12,575 62 percent 59,390
2011 22,818 14,297 62 percent 65,950
2012 24,314 15,535 62 percent 65,261
2013 25,563
16,420
64 percent
66,160
2014 26,265
16,817
64
percent 69,000
2015-
p 26,301
16,832
64 percent
59,000*
8 | P a g e
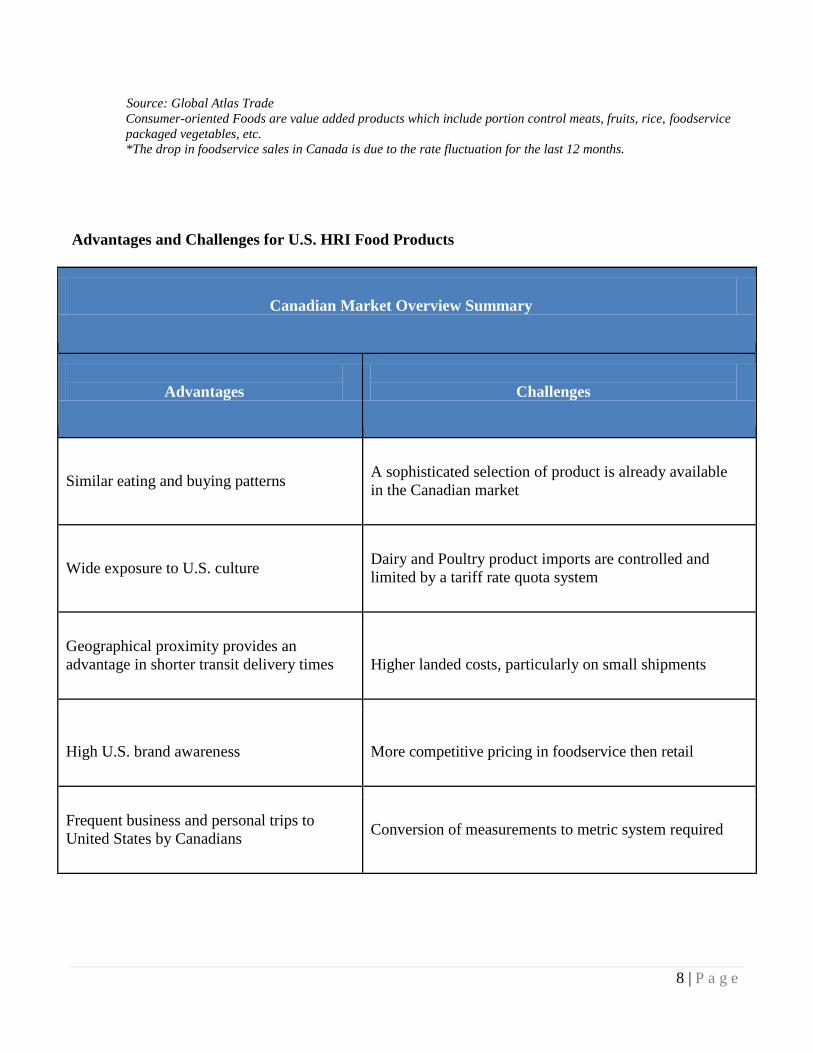
Source: Global Atlas Trade
Consumer-oriented Foods are value added products which include portion control meats, fruits, rice, foodservice
packaged vegetables, etc.
*The drop in foodservice sales in Canada is due to the rate fluctuation for the last 12 months.
Advantages and Challenges for U.S. HRI Food Products
Canadian Market Overview Summary
Advantages
Challenges
Similar eating and buying patterns
A sophisticated selection of product is already available
in the Canadian market
Wide exposure to U.S. culture Dairy and Poultry product imports are controlled and
limited by a tariff rate quota system
Geographical proximity provides an
advantage in shorter transit delivery times
Higher landed costs, particularly on small shipments
High U.S. brand awareness
More competitive pricing in foodservice then retail
Frequent business and personal trips to
United States by Canadians Conversion of measurements to metric system required

9 | P a g e
Ease of business travel to Canada Standard Canadian English required
Duty free tariff treatment for most
products under NAFTA
Differences in nutrition labelling. Not required on
foodservice products but helpful for foodservice
operators.
High U.S. quality and safety perceptions Differences in chemical residue tolerances
U.S. origin top choice among imported
foods Higher landed costs, particularly on small shipments
Canada’s wide ethnic diversity provides a
broad specialty cuisine opportunities
Section II. Road Map for Market Entry
Entry Strategy
Food product manufacturers from the United States seeking to enter the Canadian marketplace have a
number of opportunities. The United States is Canada’s primary trading partner – with more than 64
percent of Canada’s processed food imports originating from the United States. The demand for U.S.
foods can be attributed to many factors, such as; proximity to the market, reliable shipping methods,
similar business practices and similar food tastes between Canadians and Americans.
Although, Canadians are looking for new and innovative U.S. products, there are a number of challenges
U.S. exporters must be prepared to meet. Some of them include currency, customs procedures,
regulatory compliancy, and labeling requirements.
Overcoming these hurdles is possible with the right tools. FAS together with agricultural partners
facilitate the exporting process and we recommend the following as first steps when entering the
Canadian market:
1. Contact your state regional trade office or the international specialist of your State Department of
Agriculture.
2. Conduct a thorough research on the competitive marketplace.
10 | P a g e
3. Locate a Canadian partner, such as a broker/distributor/importer to help in identifying key
Canadian accounts.
4. Learn Canadian government standards and regulations that pertain to your product.
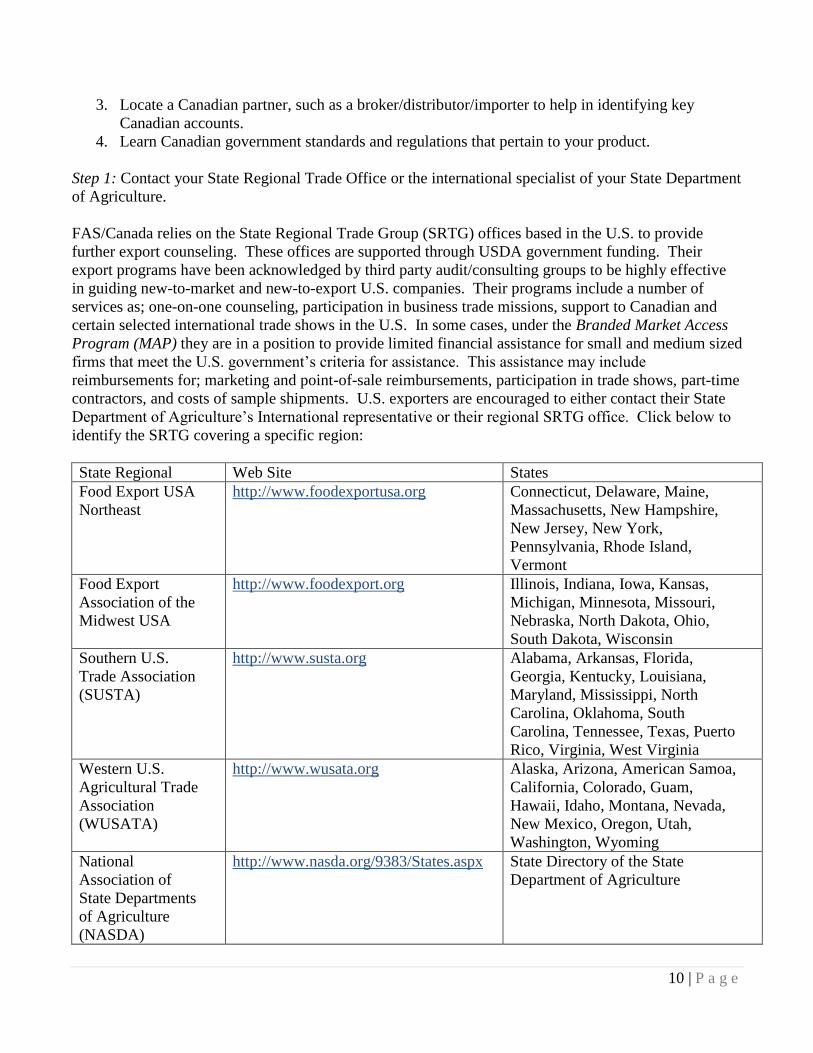
Step 1: Contact your State Regional Trade Office or the international specialist of your State Department
of Agriculture.
FAS/Canada relies on the State Regional Trade Group (SRTG) offices based in the U.S. to provide
further export counseling. These offices are supported through USDA government funding. Their
export programs have been acknowledged by third party audit/consulting groups to be highly effective
in guiding new-to-market and new-to-export U.S. companies. Their programs include a number of
services as; one-on-one counseling, participation in business trade missions, support to Canadian and
certain selected international trade shows in the U.S. In some cases, under the Branded Market Access
Program (MAP) they are in a position to provide limited financial assistance for small and medium sized
firms that meet the U.S. government’s criteria for assistance. This assistance may include
reimbursements for; marketing and point-of-sale reimbursements, participation in trade shows, part-time
contractors, and costs of sample shipments. U.S. exporters are encouraged to either contact their State
Department of Agriculture’s International representative or their regional SRTG office. Click below to
identify the SRTG covering a specific region:
State Regional Web Site States
Food Export USA
Northeast
http://www.foodexportusa.org Connecticut, Delaware, Maine,
Massachusetts, New Hampshire,
New Jersey, New York,
Pennsylvania, Rhode Island,
Vermont
Food Export
Association of the
Midwest USA
http://www.foodexport.org
Illinois, Indiana, Iowa, Kansas,
Michigan, Minnesota, Missouri,
Nebraska, North Dakota, Ohio,
South Dakota, Wisconsin
Southern U.S.
Trade Association
(SUSTA)
http://www.susta.org Alabama, Arkansas, Florida,
Georgia, Kentucky, Louisiana,
Maryland, Mississippi, North
Carolina, Oklahoma, South
Carolina, Tennessee, Texas, Puerto
Rico, Virginia, West Virginia
Western U.S.
Agricultural Trade
Association
(WUSATA)
http://www.wusata.org Alaska, Arizona, American Samoa,
California, Colorado, Guam,
Hawaii, Idaho, Montana, Nevada,
New Mexico, Oregon, Utah,
Washington, Wyoming
National
Association of
State Departments
of Agriculture
(NASDA)
http://www.nasda.org/9383/States.aspx
State Directory of the State
Department of Agriculture
11 | P a g e
Step 2: Research the competitive marketplace
The State Regional Trade Groups will often have available information on specific markets. Some of the
SRTGs maintain Canadian representatives that can help in providing specific market intelligence to a
particular product category. This type of information is invaluable as this may help a potential U.S.
export to price their products accordingly and identify the food channel most appropriate for their
company. In coordination with the SRTG’s services, FAS/Canada publishes over fifty market and
commodity reports that are available through the Global Agriculture Information Network (GAIN) for a
number of commodities. To access these reports go to: http://gain.fas.usda.gov/Lists/Advanced
percent20Search/AllItems.aspx
Step 3: Locate a Canadian partner - broker/distributor/importer
It is recommended that most new entrants to the Canadian market consider appointing a broker or
develop a business relationship with a distributor/importer to enter the Canadian market. Some retailers
and even distributors prefer U.S. companies appointing a broker that will set up a distribution network.
As the market is smaller than that of the United States, food companies are urged to closely evaluate
their Canadian business partners well before entering into a contractual arrangement. Factors such as
work experience, the Canadian firm’s financial stability, product familiarity, account base, sales force,
executive team commitment, and other considerations should all be taken into account prior to
appointing the Canadian partner and or a entering into a future business transactions.
A partial listing of Canadian food brokers is available on our latest brokers report, Agent/Broker
Directory – Central Canada (CA 11025) available online at: http://gain.fas.usda.gov
FAS/Canada can provide some assistance in identifying a broker/distributor/importer but is not in a
position to endorse any Canadian firm. Furthermore, companies are encouraged to visit and/or
participate in specific trade shows in Canada (see http://www.ats-sea.agr.gc.ca/eve/eve-can-eng.htm for
a complete listing of trade shows in Canada) as this will help in evaluating the market and meeting
potential Canadian partners.
FAS/USDA recommends a number of Canadian food shows. Among them is the Restaurants Canada
Show which is the premier foodservice show in Canada. The event attracts 13,000 executives from the
foodservice sector. The show takes place annually from the first Sunday to Tuesday of March each year
at the Direct Energy Centre in Toronto. This year the event will take place February 28 thru March 1,
2016. Additionally, the show organizers partners with two other foodservice shows in Atlantic Canada
and in Vancouver, British Columbia. Although, FAS/Canada currently offers no USA Pavilion, some of
the U.S. state agencies exhibit with a state pavilion. In previous years, if there is enough interest, show
management has pulled together a U.S.A presence on the exhibit floor. Interested U.S. companies are
recommended to contact their respective Department of Agriculture representative or Natalie Mestnik,
show coordinator at [email protected]
FAS/USDA endorses one trade show in Canada that attracts some food service executives; SIAL
Canada. The event alternates between Montreal, Quebec and Toronto, Ontario. The show takes place in
Montreal the even years and in Toronto the odd years. Next year’s show will take place in Toronto from
Tuesday, April 13th
to Thursday, April 15th
of 2016 at the Palais Congre in downtown Montreal. For the
12 | P a g e
first time, the U.S. will be the Country of Honor and FAS/Canada anticipates this will serve to attract
more Canadian buyers to visit the USA Pavilion and its’ companies. Interested U.S. food companies
can contact FAS/USDA’s show contractor, IMEX Management and ask for Kelly Wheatley at
[email protected] / T. 704-365-0041 or Sharon Cook at [email protected]
Step 4: Understand Canadian government standards and regulations that pertain to your product
Review the 2015 GAIN Export Guide (CA15113) Canadian government standards and regulations that
pertain to your product. FAS/Canada recommends contacting the Canadian National Import Service
Centre to ensure all customs paperwork is accurate and allow for pre-clearance of exported goods from
the U.S. Canadian agents, distributors, brokers, and/or importers are also very adept to assisting
exporters through the import regulatory process.
Canadian National Import Service Centre 7:00 a.m. to 3:00 a.m. (Eastern Time)
Telephone and EDI( electronic data interexchange: 1-800-835-4486 (Canada or U.S.A.)
1-289-247-4099 (local calls and all other countries)
Fax: 1-613-773-9999
Mailing Address:
1050 Courtney Park Drive East
Mississauga, Ontario L5T 2R4
The best entry method depends on the food product and the sub-sector identified as appropriate for each
food product. Government and industry import policies and trade acts regulate each sub-sector. Each
U.S. export opportunity must be thoroughly investigated relative to the legislation that exists for the
product requesting entry. For additional information on the broadest Canadian regulations see the Food
and Agricultural Import Regulations and Standards (FAIRS) Country Report and the FAIRS Export
Certificate Report available online at: http://gain.fas.usda.gov
Frequently Asked Questions and their Answers
The following are some of the common questions asked by U.S. food and agricultural product exporters
of the staff at the Office of Agricultural Affairs in Ottawa.
1. Question: Do I need to modify my labels for foodservice as I do for the retail market in Canada?
Answer: The Canadian Food Inspection Agency exempts foodservice products from bilingual and
nutrition facts table (NFT) requirements. However, there are other mandatory requirements to meet
label compliancy such as the common name of the product, country of origin, best/before dates, storage
instructions, general nutrition information, and other elements. Additionally, as more and more
restaurant menus try to inform their patrons of healthy options, some food processors are voluntarily
providing nutrition information in the NFT format so it is easy to understand.
Most U.S. firms engage the services of a labelling specialist to ensure all required compliancy have been
met as regulations may be difficult to interpret for a manufacturer unfamiliar with these requirements.
In the coming year, with the proposed labelling changes being introduced possibly in 2016 by Health
13 | P a g e
Canada and CFIA, FAS Canada is urging firms to pay particular attention that all label modifications are
current with the changes.
2. Question: How do I find a distributor?
Answer: The USDA/FAS Office of Agricultural Affairs, U.S. Embassy and Toronto U.S. Consulate in
Canada can provide marketing lists in helping U.S. companies identify a potential broker/distributor.
Services available to help exporters locate appropriate brokers/distributors include USDA endorsed
pavilions at various Canadian trade shows and referrals to the appropriate State Regional Trade Group
(see "Entry Strategy" section).
3. Question: I know that Canada has a tariff rate quota for certain dairy and poultry products. How do I
know if my particular dairy or poultry product is going to be affected by Canadian tariff rate quotas?
Answer: For a determination as to whether or not the product you intend to export into Canada is within
the scope of Canada’s tariff rate quota (TRQ), contact Canada Border Services Agency.
Contact information can be found at the following webpage:
http://cbsa-asfc.gc.ca/publications/dm-md/d10/d10-18-1-eng.html
4. Question: How do I identify the major Canadian importers of my product(s)?
Answer: Industry Canada (IC) maintains a database of major Canadian importers by product type. To
access the database, go to IC’s web page at http://www.ic.gc.ca/eic/site/cid-dic.nsf/eng/home . The page
will prompt the user to identify the product.
5. Question: Will there be import duties on my food products entering Canada?
Answer: Under provisions of the U.S./Canada Free Trade Agreement and the North American Free
Trade Agreement (NAFTA), the majority of Canadian import duties on all U.S. food and commercial
products have been phased out with a few exceptions like over-quota tariffs on dairy and poultry
products. There are federal excise taxes and surcharges on alcoholic beverages. If using the services of
a customs broker, there will be clearance and handling fees and these should not be confused for duty
charges.
6. Question: I’ve heard that U.S. fruit and vegetable exporters can’t sell apples or potatoes to Canada.
Is this true?
Answer: There are package-size regulations restricting bulk imports if Canadian supplies are available,
but imports in consumer and wholesale sized packages are permitted. In fact, US apple exports to
Canada averaged $150 million per year between 2008 and 2013. Commonly referred to as Canada’s
“bulk waiver” requirement (or ministerial exemption), processors or packers must apply to the Canadian
Food Inspection Agency (CFIA) for a special exemption to import bulk products. In late 2007, the
United States and Canada established an arrangement to facilitate bilateral potato trade. The
arrangement will provide U.S. potato producers with predictable access to Canadian Ministerial
exemptions.
14 | P a g e
7. Question: My company is new to exporting. Can I test market my product(s) in Canada with my
U.S. label? I don’t want to produce a label for the Canadian market until I know it will be successful.
Answer: Canada offers a test marketing provision; however, this provision has certain limitations and is
specifically designed to facilitate those products that are highly unique and not currently found in
Canada. This provision does not apply to U.S. brand introductions into Canada for processed foods
commonly found on retail shelves. We highly encourage U.S. exporters to work with their respective
State Regional Trade Group to see if they qualify for export assistance programs as some of the costs on
packaging and labeling modifications may be covered.
Canadian Government Standards and Regulations
The Canadian Government has multiple acts that govern the importation and sales of foods. As
previously noted, the Canadian government is overhauling its food and beverage regulations and will
eventually combine them all into one larger price of legislation. For now, some of the most important
laws in place are:
Canada Agricultural Product Act and Associated Regulations
Consumer Packaging and Labelling Act
Fish Inspection Act
Food and Drug Act
Food and Drug Regulations
Importation of Intoxicating Liquors Act
Meat Inspection Act
Weight and Measures Act
U.S. exporters are urged to review the GAIN Export Guide (CA 15113) that helps to further breakdown
regulations and steps to doing business in Canada.
Import documentation or an official inspection certificate is required for meat, poultry, dairy, egg, fresh
fruit and vegetable. Information on these certificates may be obtained through the 2015 GAIN FAIRS
Export Certification Requirements for Canada. All temporary and commercial import requirements may
be reviewed through the Automated Import Reference Systems (AIRS) of the Canadian Food Inspection
Agency (CRFA) at:
CRFA - Automated Import Reference System
http://inspection.gc.ca/english/imp/airse.shtml
Selected Labelling Exemptions for Foodservice products
Products destined for the HRI segment are exempt from bilingual labeling companies and nutritional
facts table. This is noted here:
15 | P a g e
Foods for Commercial or Industrial Enterprise or Institution
Exemption of Nutrition Fact Table (NFT) labelling
http://www.inspection.gc.ca/food/labelling/food-labelling-for-industry/nutrition-
labelling/additional-information/restaurants-and-food-service-
establishments/eng/1409850385603/1409850437890
Exemption of bilingual labelling on shipping containers destined to the HRI Sector
http://www.inspection.gc.ca/food/labelling/food-labelling-for-
industry/label/eng/1388160267737/1388160350769?chap=1#s2c1
Although, foodservice products are exempted from the submitting nutrition information in a NFT
(format), food manufacturers are expected to provide nutrition information. This nutrition information
may be adhered to the outside of the container or inserted in the container. Also, if the mandatory
information is not displayed on the outside of containers then the information will need to be displayed
on the respective foodservice packages inside the container.
The required mandatory information is:
1. Information in one official Language
2. Common Name
3. Country of Origin or
4. Identity and Principal Place of Business (manufacturer/Canadian dealer, noted “imported
for/importé pour”).
5. Date Markings and Storage Instructions (includes durable life date)
6. Irradiated Foods
7. Net Quantities expressed in Metric Units
8. Legibility and Location
9. List of Ingredients and Allergens
10. Nutrition Information
11. Sweeteners
These requirements can be further reviewed at:
Industry Labelling Tool
http://www.inspection.gc.ca/food/labelling/food-labelling-for-
industry/eng/1383607266489/1383607344939

16 | P a g e
Key Contacts
Office of Agricultural Affairs U.S. Embassy, Canada
P.O. Box 5000, MS-30
Ogdensburg, NY 13669-0430
Telephone: (613) 688-5267
Fax: (613) 688-3124
Email: [email protected]
Holly Higgins, Agricultural Minister-Counselor
Jeff Zimmerman, Agricultural Attaché & Director of Marketing
Darlene Dessureault, Senior Agricultural Specialist
Mihai Lupescu, Agricultural Specialist
Sonya Jenkins, Marketing Specialist
Joyce Gagnon, Administrative Assistant
Foreign Agricultural Service
U.S. Consulate General Toronto
P.O. Box 135
Lewiston, NY 14092-0135
Telephone: (416) 646-1656
Fax: (416) 646-1389
Email: [email protected]
Maria Arbulu, Senior Agricultural Marketing Specialist
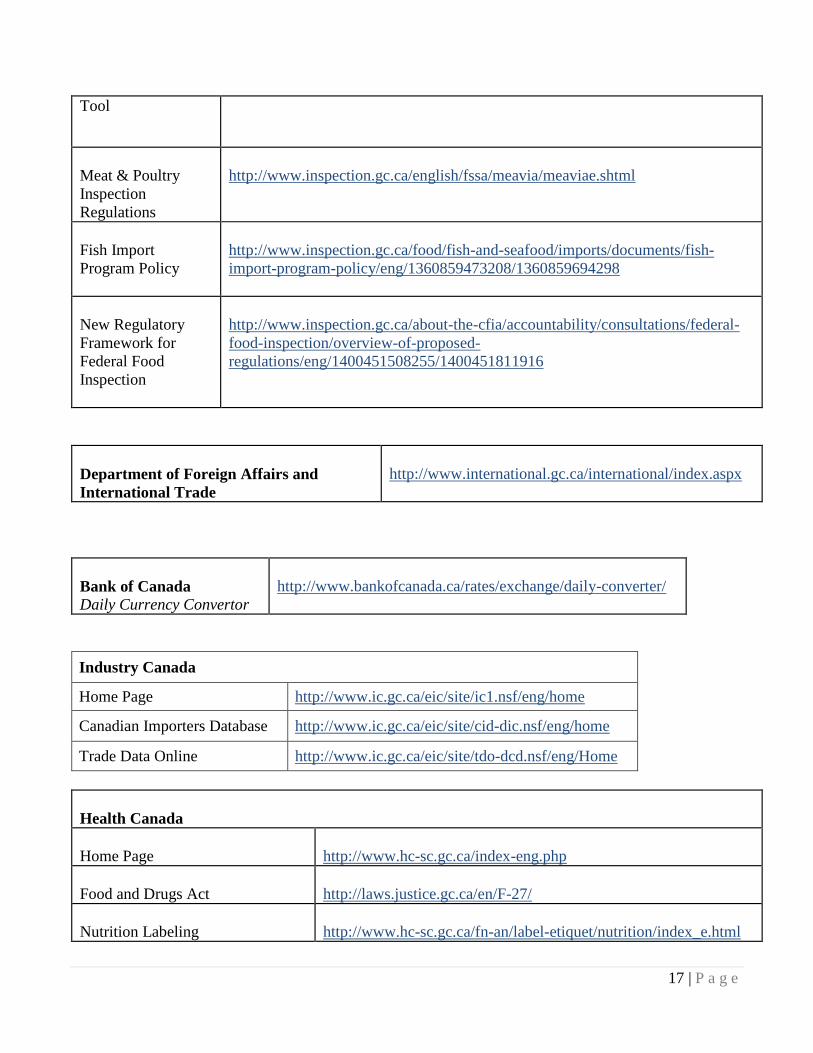
Summary of Useful Websites
The following is a listing of the major Canadian websites mentioned in the body of this report:
Canada Border Services Agency
http://www.cbsa-asfc.gc.ca/menu-eng.html
Canadian Food Inspection Agency
Home Page
http://www.inspection.gc.ca
Acts and
Regulations
http://www.cfia-acia.agr.ca/english/reg/rege.shtml
Food Labelling
and Advertising
Industry Labelling
http://www.inspection.gc.ca/english/fssa/labeti/guide/toce.shtml
17 | P a g e
Tool
Meat & Poultry
Inspection
Regulations
http://www.inspection.gc.ca/english/fssa/meavia/meaviae.shtml
Fish Import
Program Policy
http://www.inspection.gc.ca/food/fish-and-seafood/imports/documents/fish-
import-program-policy/eng/1360859473208/1360859694298
New Regulatory
Framework for
Federal Food
Inspection
http://www.inspection.gc.ca/about-the-cfia/accountability/consultations/federal-
food-inspection/overview-of-proposed-
regulations/eng/1400451508255/1400451811916
Department of Foreign Affairs and
International Trade
http://www.international.gc.ca/international/index.aspx
Bank of Canada
Daily Currency Convertor
http://www.bankofcanada.ca/rates/exchange/daily-converter/
Industry Canada
Home Page http://www.ic.gc.ca/eic/site/ic1.nsf/eng/home
Canadian Importers Database http://www.ic.gc.ca/eic/site/cid-dic.nsf/eng/home
Trade Data Online http://www.ic.gc.ca/eic/site/tdo-dcd.nsf/eng/Home
Health Canada
Home Page
http://www.hc-sc.gc.ca/index-eng.php
Food and Drugs Act
http://laws.justice.gc.ca/en/F-27/
Nutrition Labeling
http://www.hc-sc.gc.ca/fn-an/label-etiquet/nutrition/index_e.html
18 | P a g e
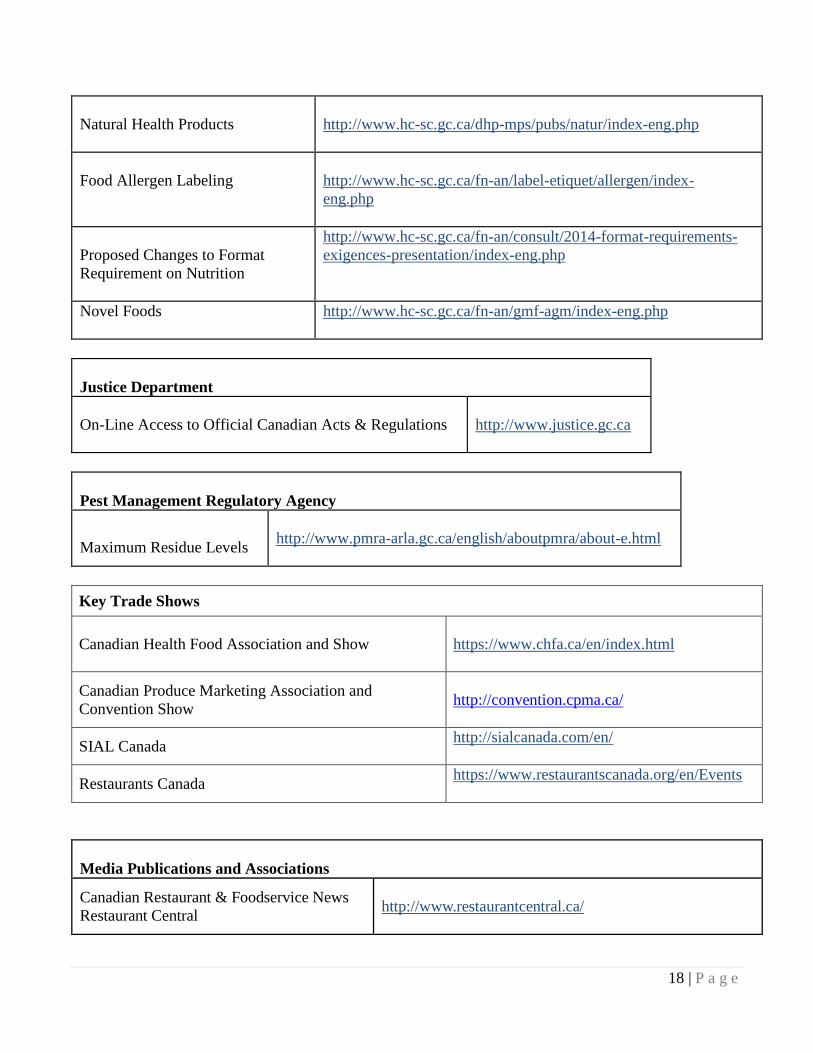
Natural Health Products
http://www.hc-sc.gc.ca/dhp-mps/pubs/natur/index-eng.php
Food Allergen Labeling
http://www.hc-sc.gc.ca/fn-an/label-etiquet/allergen/index-
eng.php
Proposed Changes to Format
Requirement on Nutrition
http://www.hc-sc.gc.ca/fn-an/consult/2014-format-requirements-
exigences-presentation/index-eng.php
Novel Foods http://www.hc-sc.gc.ca/fn-an/gmf-agm/index-eng.php
Justice Department
On-Line Access to Official Canadian Acts & Regulations
http://www.justice.gc.ca
Pest Management Regulatory Agency
Maximum Residue Levels
http://www.pmra-arla.gc.ca/english/aboutpmra/about-e.html
Key Trade Shows
Canadian Health Food Association and Show
https://www.chfa.ca/en/index.html
Canadian Produce Marketing Association and
Convention Show
http://convention.cpma.ca/
SIAL Canada http://sialcanada.com/en/
Restaurants Canada https://www.restaurantscanada.org/en/Events
Media Publications and Associations
Canadian Restaurant & Foodservice News
Restaurant Central
http://www.restaurantcentral.ca/
19 | P a g e
Canadian Hotel Association
http://www.canadianlodgingnews.com/lodging
Canadian Lodging News http://www.hoteliermagazine.com/
National Foodservice Distributors
Association (Canada)
http://nfda.ca/our-members
Restaurants Canada Association https://restaurantscanada.org/
Restaurants Canada Foodservice Buyers
Guide
http://buyersguide.restaurantscanada.org/Categories.aspx
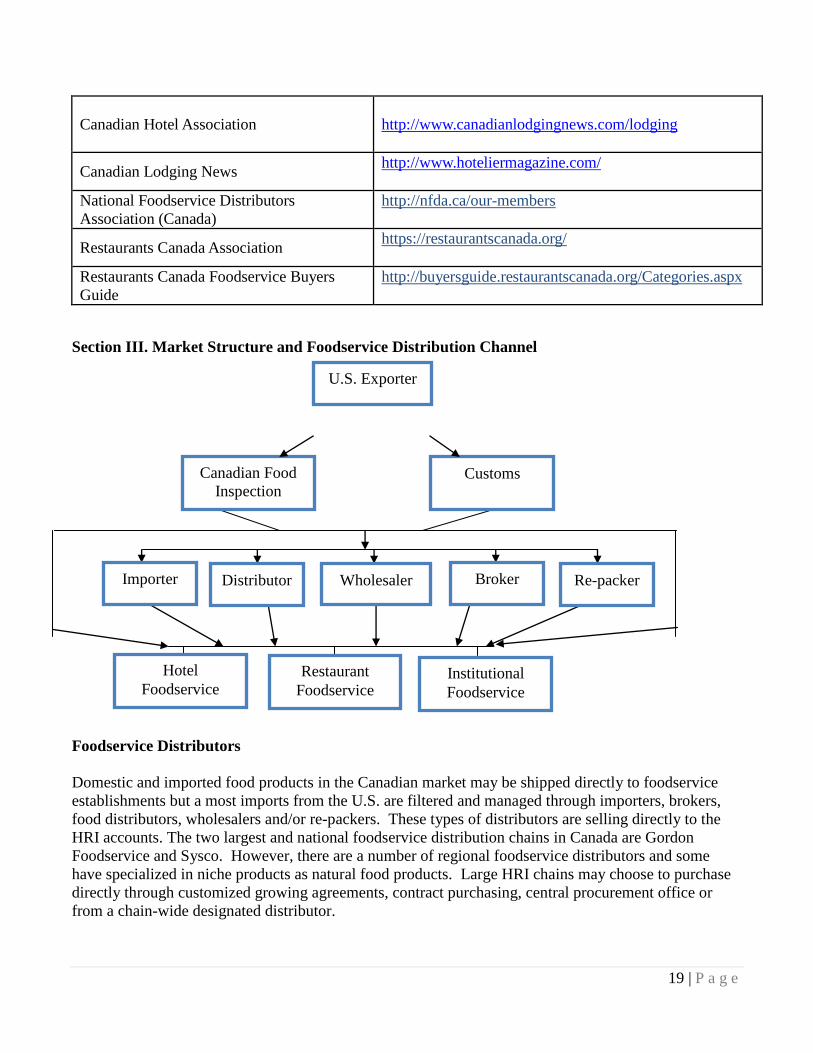
Section III. Market Structure and Foodservice Distribution Channel
Foodservice Distributors
Domestic and imported food products in the Canadian market may be shipped directly to foodservice
establishments but a most imports from the U.S. are filtered and managed through importers, brokers,
food distributors, wholesalers and/or re-packers. These types of distributors are selling directly to the
HRI accounts. The two largest and national foodservice distribution chains in Canada are Gordon
Foodservice and Sysco. However, there are a number of regional foodservice distributors and some
have specialized in niche products as natural food products. Large HRI chains may choose to purchase
directly through customized growing agreements, contract purchasing, central procurement office or
from a chain-wide designated distributor.
U.S. Exporter
Hotel
Foodservice Restaurant
Foodservice Institutional
Foodservice
Canadian Food
Inspection
Agency
Customs
Importer Distributor Wholesaler Broker Re-packer
20 | P a g e
Canadian Partners - Broker/Food Distributor/Importer Arrangements
U.S. firms, particularly small to medium sized firms are recommended to partner with a Canadian food
broker/food distributor/importer.3 Most food distributors and importers will import and take title of the
shipment. In turn, the shipment is likely to be stored in their warehouse facility and then sold to various
foodservice accounts. Brokers on the other hand, usually do not take title of the goods but act as a sales
people to help develop awareness for the product to chain and individual accounts. There are some
brokers that simply specialize in brokering foodservice products while others represent a combination of
foodservice and retail products. Exporters are recommended to inquire a prospective’ s business split
between foodservice and retail to help them assess if the Canadian firm has sufficient expertise in this
segment of the market and resources to develop specific HRI accounts. In most cases, once a firm
appoints a broker then they will build a distribution network for their food client. Usually brokers take a
percentage of the product sales revenue, ranging from 3 percent to 10 percent. The percentage is
influenced by several factors: the type of product line, expected sales volume, additional special services
such as planning promotions or data collection. In the beginning, a broker may request a monthly
retainer fee as they must ‘pioneer’ the product to prospective foodservice accounts and distributors.
Once targeted sales volumes are reached then the broker will switch to a percentage of the established
sales. All fees are negotiated between the principal and the broker prior to future transactions.
Sub-Sector Profiles
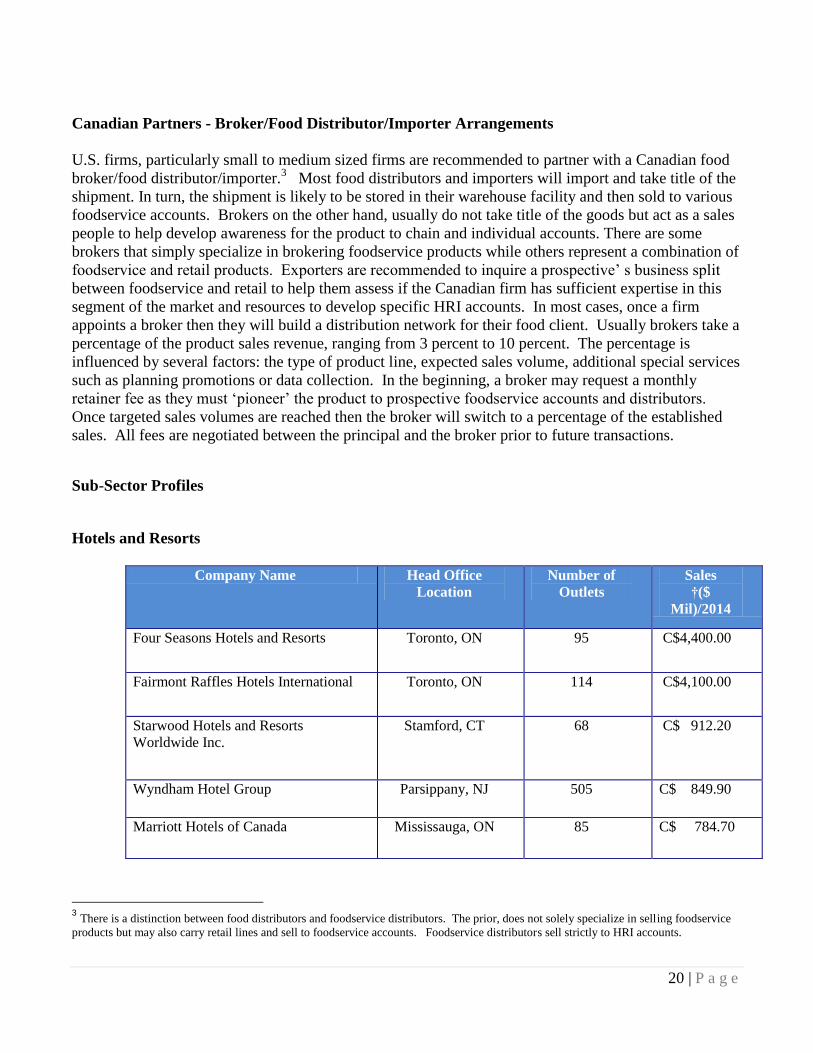
Hotels and Resorts
Company Name Head Office
Location
Number of
Outlets
Sales
†($
Mil)/2014
Four Seasons Hotels and Resorts Toronto, ON 95 C$4,400.00
Fairmont Raffles Hotels International Toronto, ON 114 C$4,100.00
Starwood Hotels and Resorts
Worldwide Inc.
Stamford, CT 68 C$ 912.20
Wyndham Hotel Group Parsippany, NJ 505 C$ 849.90
Marriott Hotels of Canada Mississauga, ON 85 C$ 784.70
3 There is a distinction between food distributors and foodservice distributors. The prior, does not solely specialize in selling foodservice
products but may also carry retail lines and sell to foodservice accounts. Foodservice distributors sell strictly to HRI accounts.
21 | P a g e
Company Name Head Office
Location
Number of
Outlets
Sales
†($
Mil)/2014
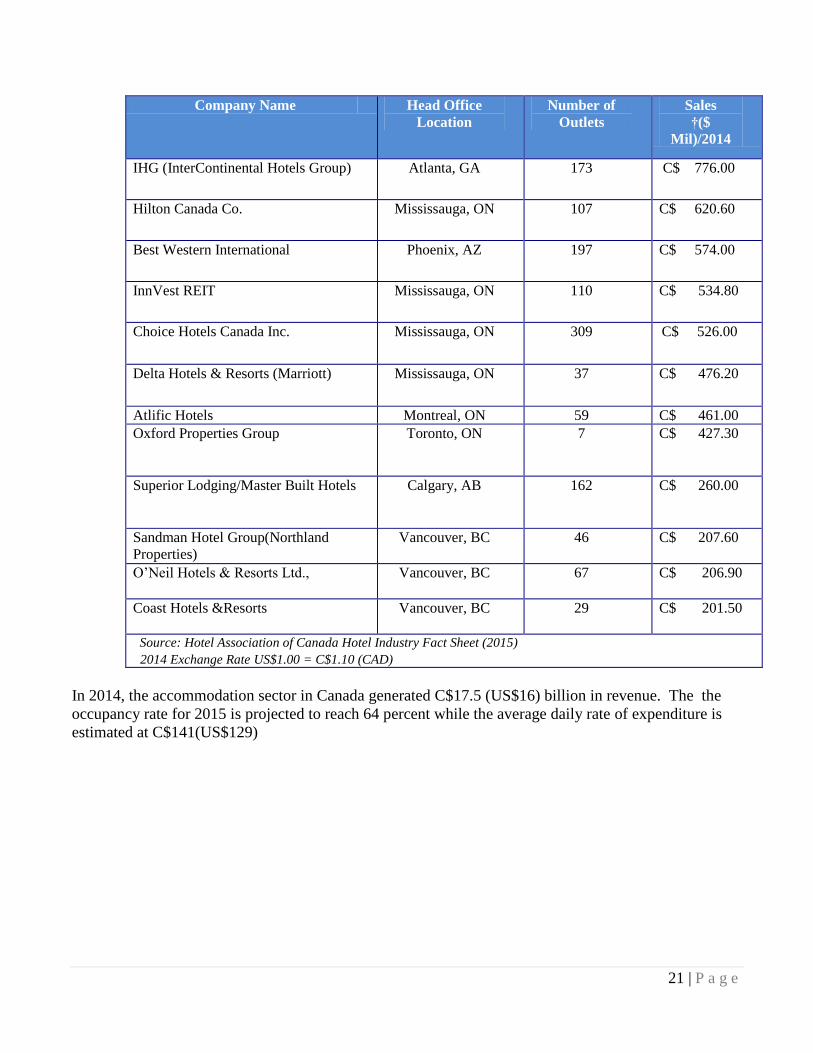
IHG (InterContinental Hotels Group) Atlanta, GA 173 C$ 776.00
Hilton Canada Co. Mississauga, ON 107 C$ 620.60
Best Western International Phoenix, AZ 197 C$ 574.00
InnVest REIT Mississauga, ON 110 C$ 534.80
Choice Hotels Canada Inc. Mississauga, ON 309 C$ 526.00
Delta Hotels & Resorts (Marriott) Mississauga, ON 37 C$ 476.20
Atlific Hotels Montreal, ON 59 C$ 461.00
Oxford Properties Group Toronto, ON 7 C$ 427.30
Superior Lodging/Master Built Hotels Calgary, AB 162 C$ 260.00
Sandman Hotel Group(Northland
Properties)
Vancouver, BC 46 C$ 207.60
O’Neil Hotels & Resorts Ltd., Vancouver, BC 67 C$ 206.90
Coast Hotels &Resorts Vancouver, BC 29 C$ 201.50
Source: Hotel Association of Canada Hotel Industry Fact Sheet (2015)
†2014 Exchange Rate US$1.00 = C$1.10 (CAD)
In 2014, the accommodation sector in Canada generated C$17.5 (US$16) billion in revenue. The the
occupancy rate for 2015 is projected to reach 64 percent while the average daily rate of expenditure is
estimated at C$141(US$129)
22 | P a g e
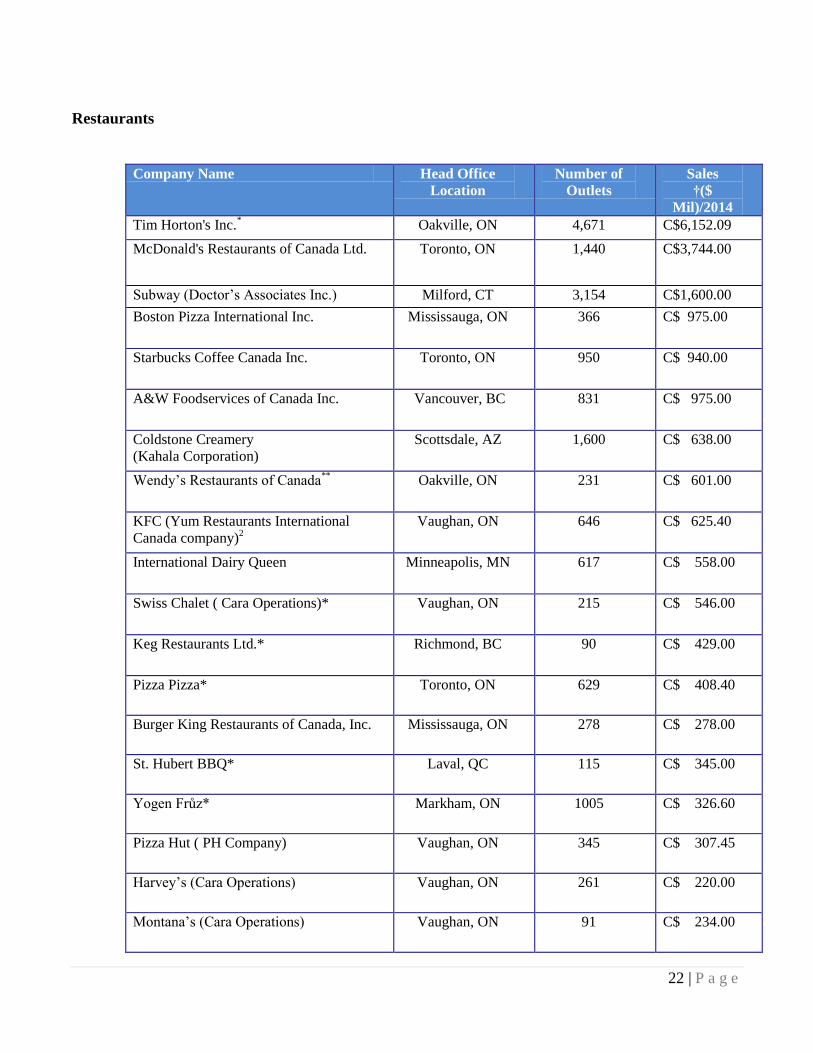
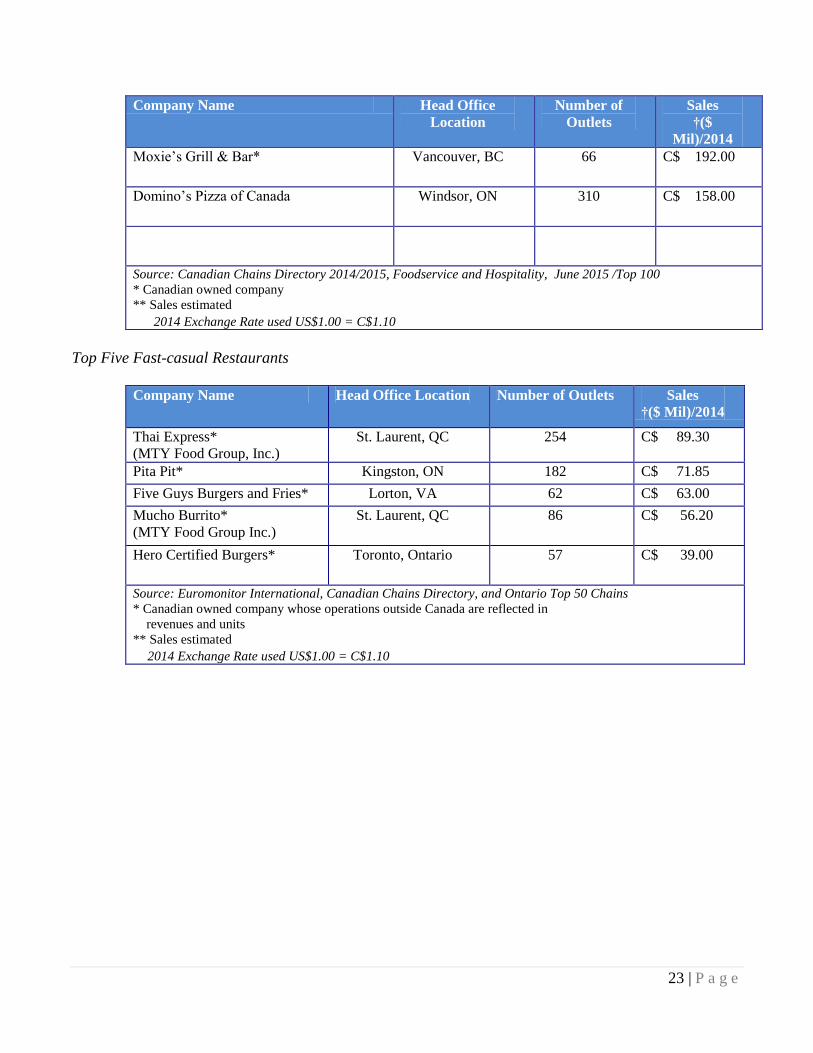
Restaurants
Company Name Head Office
Location
Number of
Outlets
Sales
†($
Mil)/2014
Tim Horton's Inc.* Oakville, ON 4,671 C$6,152.09
McDonald's Restaurants of Canada Ltd. Toronto, ON 1,440 C$3,744.00
Subway (Doctor’s Associates Inc.) Milford, CT 3,154 C$1,600.00
Boston Pizza International Inc. Mississauga, ON 366 C$ 975.00
Starbucks Coffee Canada Inc. Toronto, ON 950 C$ 940.00
A&W Foodservices of Canada Inc. Vancouver, BC 831 C$ 975.00
Coldstone Creamery
(Kahala Corporation)
Scottsdale, AZ 1,600 C$ 638.00
Wendy’s Restaurants of Canada**
Oakville, ON 231 C$ 601.00
KFC (Yum Restaurants International
Canada company)2
Vaughan, ON 646 C$ 625.40
International Dairy Queen Minneapolis, MN 617 C$ 558.00
Swiss Chalet ( Cara Operations)* Vaughan, ON 215 C$ 546.00
Keg Restaurants Ltd.* Richmond, BC 90 C$ 429.00
Pizza Pizza* Toronto, ON 629 C$ 408.40
Burger King Restaurants of Canada, Inc. Mississauga, ON 278 C$ 278.00
St. Hubert BBQ* Laval, QC 115 C$ 345.00
Yogen Frůz* Markham, ON 1005 C$ 326.60
Pizza Hut ( PH Company) Vaughan, ON 345 C$ 307.45
Harvey’s (Cara Operations) Vaughan, ON 261 C$ 220.00
Montana’s (Cara Operations) Vaughan, ON 91 C$ 234.00
23 | P a g e
Company Name Head Office
Location
Number of
Outlets
Sales
†($
Mil)/2014
Moxie’s Grill & Bar* Vancouver, BC 66 C$ 192.00
Domino’s Pizza of Canada Windsor, ON 310 C$ 158.00
Source: Canadian Chains Directory 2014/2015, Foodservice and Hospitality, June 2015 /Top 100
* Canadian owned company
** Sales estimated
†222014 Exchange Rate used US$1.00 = C$1.10
Top Five Fast-casual Restaurants
Company Name Head Office Location Number of Outlets Sales
†($ Mil)/2014
Thai Express*
(MTY Food Group, Inc.)
St. Laurent, QC 254 C$ 89.30
Pita Pit* Kingston, ON 182 C$ 71.85
Five Guys Burgers and Fries* Lorton, VA 62 C$ 63.00
Mucho Burrito*
(MTY Food Group Inc.)
St. Laurent, QC 86 C$ 56.20
Hero Certified Burgers* Toronto, Ontario 57 C$ 39.00
Source: Euromonitor International, Canadian Chains Directory, and Ontario Top 50 Chains
* Canadian owned company whose operations outside Canada are reflected in
revenues and units
** Sales estimated
†22014 Exchange Rate used US$1.00 = C$1.10

24 | P a g e
Top Five Sub/Sandwich Chains
Company Name Head Office
Location
Number of
Outlets
Sales
†($
Mil)/2014
Subway (Doctor’s Associates
Inc.)
Milford, CT 3,162 C$1,600.00
Country Style Food Services, Inc.
*
Richmond Hill, ON 442 C$ 220.10
Quiznos Canada Restaurant Corp. Oakville, ON 332 C$ 166.00
Mr. Sub (MTY Group) Windsor, ON 311 C$ 88.80
Coffee Time Donuts Inc.* Toronto, ON 137 C$ 61.60
Source: Euromonitor International, Canadian Chains Directory, and Ontario Top 50 Chains
* Canadian owned company
** Sales estimated
†22014 Exchange Rate used US$1.00 = C$1.10
Top Five International/Ethnic Chains
Company Name Head Office
Location
Number of
Outlets
Sales
†($
Mil)/2014
Pita Pit* Kingston, ON 532 C$ 226.00
Mandarin Restaurant Franchise
Corporation*
Brampton, ON 23 C$ 125.00
Thai Express (MTY Group)* St-Laurent, QC 254 C$ 89.30
Lone Star Texas Grill Restaurants Oakville, ON 23 C$ 54.00
Teriyaki Experience* Oakville, ON 131 C$ 42.20
Source: Foodservice and Hospitality, June 2015/Top 100, , Canadian Chains Directory, and Ontario Top 50
Chains
* Canadian owned company
** Sales estimated
22014 Exchange Rate used US$1.00 = C$1.10
25 | P a g e
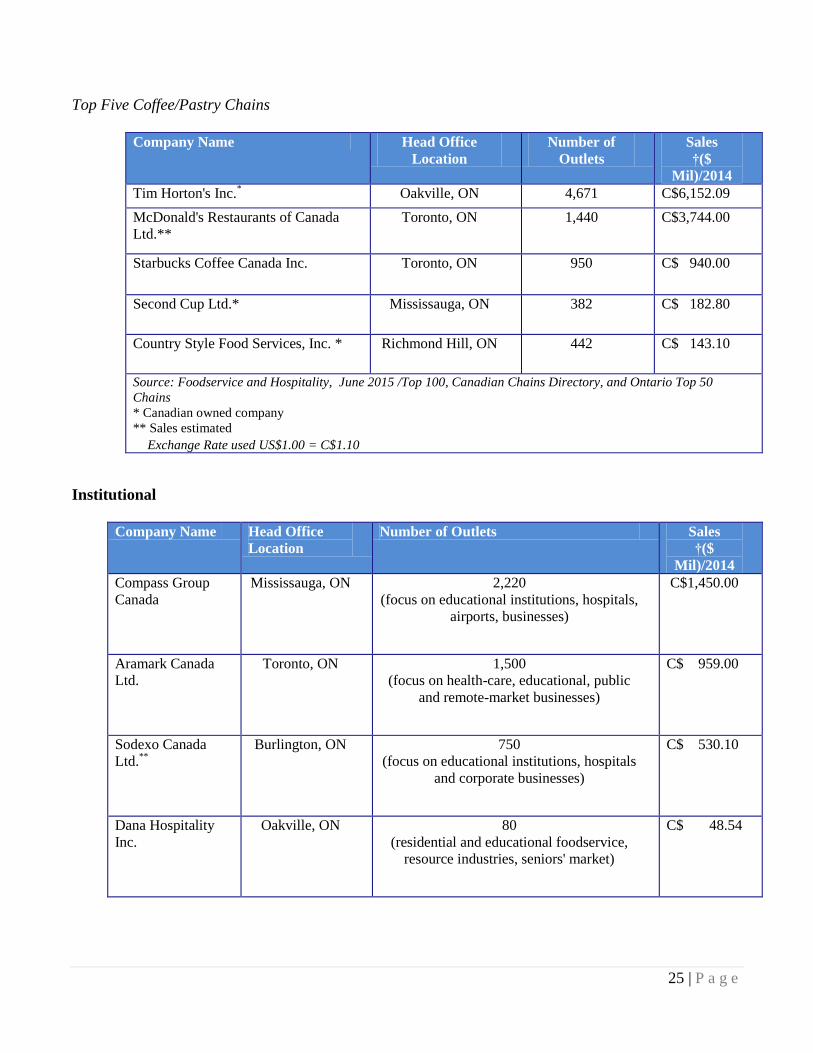
Top Five Coffee/Pastry Chains
Company Name Head Office
Location
Number of
Outlets
Sales
†($
Mil)/2014
Tim Horton's Inc.* Oakville, ON 4,671 C$6,152.09
McDonald's Restaurants of Canada
Ltd.**
Toronto, ON 1,440 C$3,744.00
Starbucks Coffee Canada Inc. Toronto, ON 950 C$ 940.00
Second Cup Ltd.* Mississauga, ON 382 C$ 182.80
Country Style Food Services, Inc. * Richmond Hill, ON 442 C$ 143.10
Source: Foodservice and Hospitality, June 2015 /Top 100, Canadian Chains Directory, and Ontario Top 50
Chains
* Canadian owned company
** Sales estimated
†2Exchange Rate used US$1.00 = C$1.10
Institutional
Company Name Head Office
Location
Number of Outlets Sales
†($
Mil)/2014
Compass Group
Canada
Mississauga, ON 2,220
(focus on educational institutions, hospitals,
airports, businesses)
C$1,450.00
Aramark Canada
Ltd.
Toronto, ON 1,500
(focus on health-care, educational, public
and remote-market businesses)
C$ 959.00
Sodexo Canada
Ltd.**
Burlington, ON 750
(focus on educational institutions, hospitals
and corporate businesses)
C$ 530.10
Dana Hospitality
Inc.
Oakville, ON 80
(residential and educational foodservice,
resource industries, seniors' market)
C$ 48.54
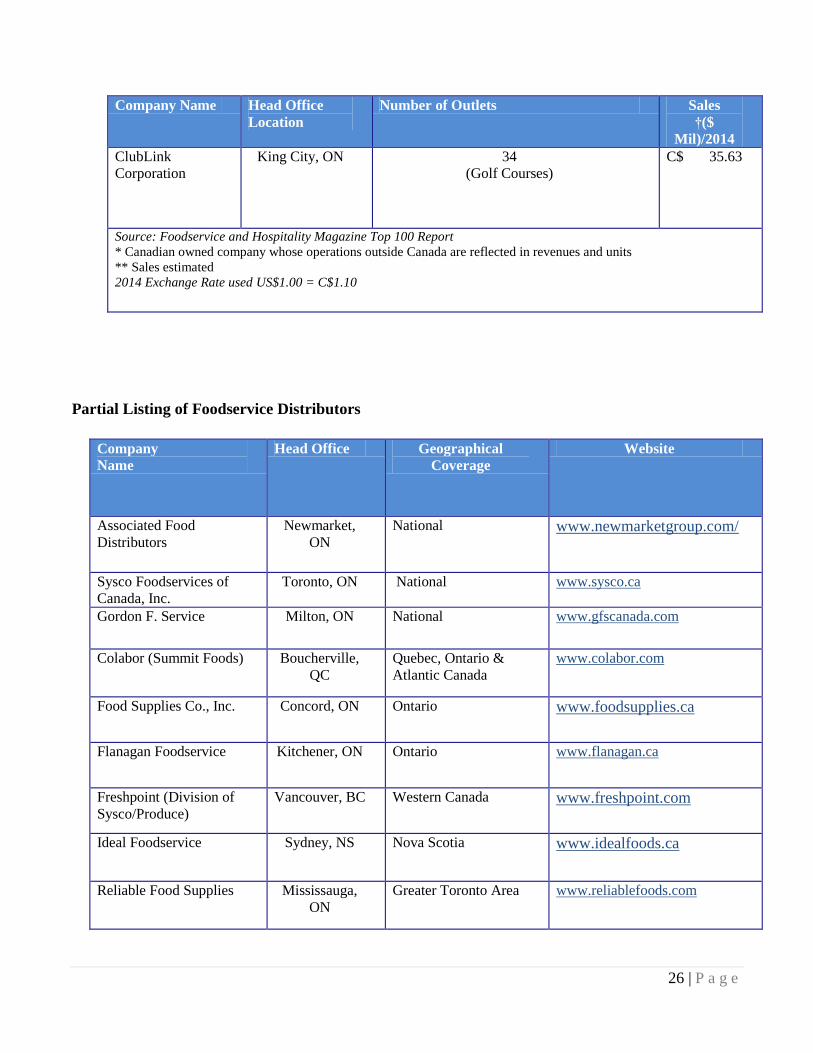
26 | P a g e
Company Name Head Office
Location
Number of Outlets Sales
†($
Mil)/2014
ClubLink
Corporation
King City, ON 34
(Golf Courses)
C$ 35.63
Source: Foodservice and Hospitality Magazine Top 100 Report
* Canadian owned company whose operations outside Canada are reflected in revenues and units
** Sales estimated
2014 Exchange Rate used US$1.00 = C$1.10
Partial Listing of Foodservice Distributors
Company
Name
Head Office Geographical
Coverage
Website
Associated Food
Distributors
Newmarket,
ON
National www.newmarketgroup.com/
Sysco Foodservices of
Canada, Inc.
Toronto, ON National www.sysco.ca
Gordon F. Service Milton, ON National www.gfscanada.com
Colabor (Summit Foods) Boucherville,
QC
Quebec, Ontario &
Atlantic Canada
www.colabor.com
Food Supplies Co., Inc. Concord, ON Ontario www.foodsupplies.ca
Flanagan Foodservice Kitchener, ON Ontario www.flanagan.ca
Freshpoint (Division of
Sysco/Produce)
Vancouver, BC Western Canada www.freshpoint.com
Ideal Foodservice Sydney, NS Nova Scotia www.idealfoods.ca
Reliable Food Supplies Mississauga,
ON
Greater Toronto Area www.reliablefoods.com
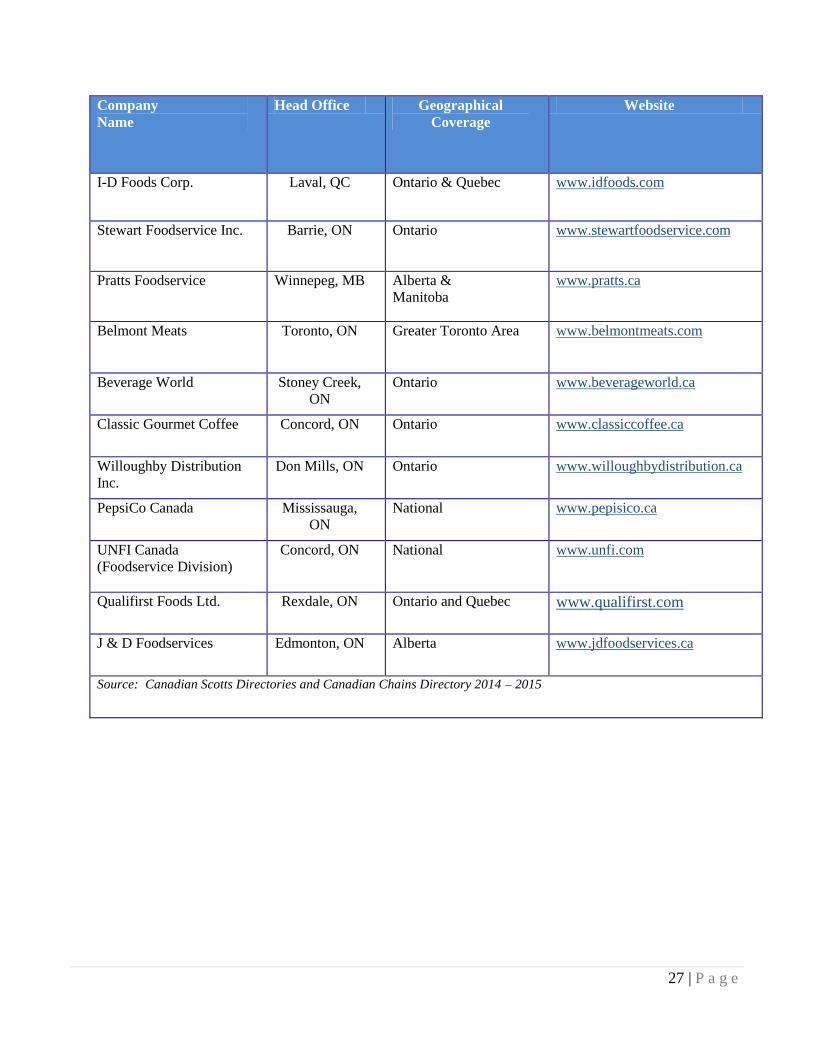
27 | P a g e
Company
Name
Head Office Geographical
Coverage
Website
I-D Foods Corp. Laval, QC Ontario & Quebec www.idfoods.com
Stewart Foodservice Inc. Barrie, ON Ontario www.stewartfoodservice.com
Pratts Foodservice Winnepeg, MB Alberta &
Manitoba
www.pratts.ca
Belmont Meats Toronto, ON Greater Toronto Area www.belmontmeats.com
Beverage World Stoney Creek,
ON
Ontario www.beverageworld.ca
Classic Gourmet Coffee Concord, ON Ontario www.classiccoffee.ca
Willoughby Distribution
Inc.
Don Mills, ON Ontario www.willoughbydistribution.ca
PepsiCo Canada Mississauga,
ON
National www.pepisico.ca
UNFI Canada
(Foodservice Division)
Concord, ON National www.unfi.com
Qualifirst Foods Ltd. Rexdale, ON Ontario and Quebec www.qualifirst.com
J & D Foodservices Edmonton, ON Alberta www.jdfoodservices.ca
Source: Canadian Scotts Directories and Canadian Chains Directory 2014 – 2015

28 | P a g e
Section IV. The GRID on Leading U.S. Products and the Competition
Product
Category
Major
Supply
Sources
Strengths of Key Supply Countries Advantages and
Disadvantages of
Local Suppliers
FRESH FRUITS
&
VEGETABLES
VEGETABLES:
CANADIAN
GLOBAL
IMPORTS (2014):
U.S. $2.4.
BILLION
VEGETABLES:
1. U.S.: 66%
2. Mexico:
26%
3. Peru: 2%
Canada is the largest foreign buyer of U.S. fruits
and vegetables. The U.S. benefits from relatively
unimpeded export access into Canada during
Canada’s winter or non-growing months.
Among imports, U.S. fruits and vegetables are
viewed by most Canadians as their number one
choice to other imports.
Mexico maintained the same level of market share
in Canada for the last three years. They remain a
major competitor due to lower prices, along with
some Canadian produce companies with winter
operations in Mexico. Their leading products are
tomatoes, cucumbers, asparagus,
raspberries/blackberries/strawberries, peppers,
avocados, watermelons, papayas, lemons/ limes.
Peru is competitive with their asparagus, avocados,
artichokes and some citrus products.
Lettuce, onions, carrots,
tomatoes, potatoes,
cauliflower, and spinach
are the leading vegetables
sold in the fresh market.
Apples are the largest
production item, followed
by blueberries,
cranberries, grapes and
peaches.
Seasonality poses a
constraint to growers;
Canada imports 80% of its
fresh vegetables between
November and June.
The ‘Buy Local’
campaigns are well
supported by grocery
retailers starting in June
through October.
FRUIT:
CANADIAN
GLOBAL
IMPORTS (2014):
U.S. $3.6
BILLION
FRUIT:
1. U.S.: 47%
2. Mexico:
14%
3. Chile: 9%
PROCESSED
FRUITS AND
VEGETABLES
CANADIAN
GLOBAL
IMPORTS (2014):
U.S. $2.3
BILLION
1. U.S.: 62%
2. China: 7%
3. Mexico: 4%
There is a full range of prepared and frozen
products. Major products are prepared potatoes,
tomato paste, mixes fruits, and variety of processed
vegetables.
U.S. is a major player in the market with
established process brands in the market.
China’s products are dried and prepared vegetables
and fruits.
Mexico supplies prepared and frozen strawberries
and other prepared fruits and vegetables.
Canadian companies
process a wide range of
canned, chilled, and
frozen products.
Adoption of advanced
technologies in food
processing has been fairly
extensive among
Canadian processors.
Statistics Canada reported
almost 50% companies
adopted more than 5 new
technologies in their
operations.
Higher manufacturing and
operation costs than in the
U.S.
29 | P a g e
Product
Category (continued)
Major
Supply
Sources
Strengths of Key Supply
Countries
Advantages and
Disadvantages of Local
Suppliers
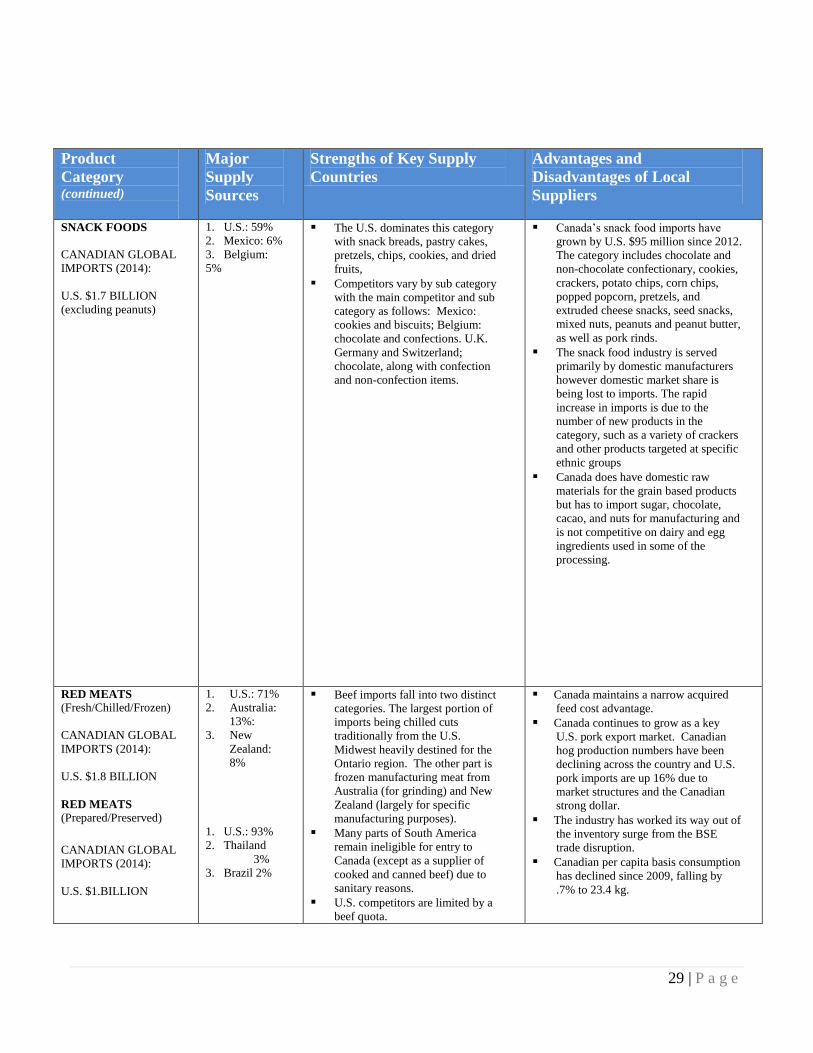
SNACK FOODS
CANADIAN GLOBAL
IMPORTS (2014):
U.S. $1.7 BILLION
(excluding peanuts)
1. U.S.: 59%
2. Mexico: 6%
3. Belgium:
5%
The U.S. dominates this category
with snack breads, pastry cakes,
pretzels, chips, cookies, and dried
fruits,
Competitors vary by sub category
with the main competitor and sub
category as follows: Mexico:
cookies and biscuits; Belgium:
chocolate and confections. U.K.
Germany and Switzerland;
chocolate, along with confection
and non-confection items.
Canada’s snack food imports have
grown by U.S. $95 million since 2012.
The category includes chocolate and
non-chocolate confectionary, cookies,
crackers, potato chips, corn chips,
popped popcorn, pretzels, and
extruded cheese snacks, seed snacks,
mixed nuts, peanuts and peanut butter,
as well as pork rinds.
The snack food industry is served
primarily by domestic manufacturers
however domestic market share is
being lost to imports. The rapid
increase in imports is due to the
number of new products in the
category, such as a variety of crackers
and other products targeted at specific
ethnic groups
Canada does have domestic raw
materials for the grain based products
but has to import sugar, chocolate,
cacao, and nuts for manufacturing and
is not competitive on dairy and egg
ingredients used in some of the
processing.
RED MEATS
(Fresh/Chilled/Frozen)
CANADIAN GLOBAL
IMPORTS (2014):
U.S. $1.8 BILLION
RED MEATS
(Prepared/Preserved)
CANADIAN GLOBAL
IMPORTS (2014):
U.S. $1.BILLION
1. U.S.: 71%
2. Australia:
13%:
3. New
Zealand:
8%
1. U.S.: 93%
2. Thailand
3% 3. Brazil 2%
Beef imports fall into two distinct
categories. The largest portion of
imports being chilled cuts
traditionally from the U.S.
Midwest heavily destined for the
Ontario region. The other part is
frozen manufacturing meat from
Australia (for grinding) and New
Zealand (largely for specific
manufacturing purposes).
Many parts of South America
remain ineligible for entry to
Canada (except as a supplier of
cooked and canned beef) due to
sanitary reasons.
U.S. competitors are limited by a
beef quota.
Canada maintains a narrow acquired
feed cost advantage.
Canada continues to grow as a key
U.S. pork export market. Canadian
hog production numbers have been
declining across the country and U.S.
pork imports are up 16% due to
market structures and the Canadian
strong dollar.
The industry has worked its way out of
the inventory surge from the BSE
trade disruption.
Canadian per capita basis consumption
has declined since 2009, falling by
.7% to 23.4 kg.
30 | P a g e
Product Category (continued)
Major
Supply
Sources
Strengths of Key Supply
Countries
Advantages and Disadvantages
of Local Suppliers
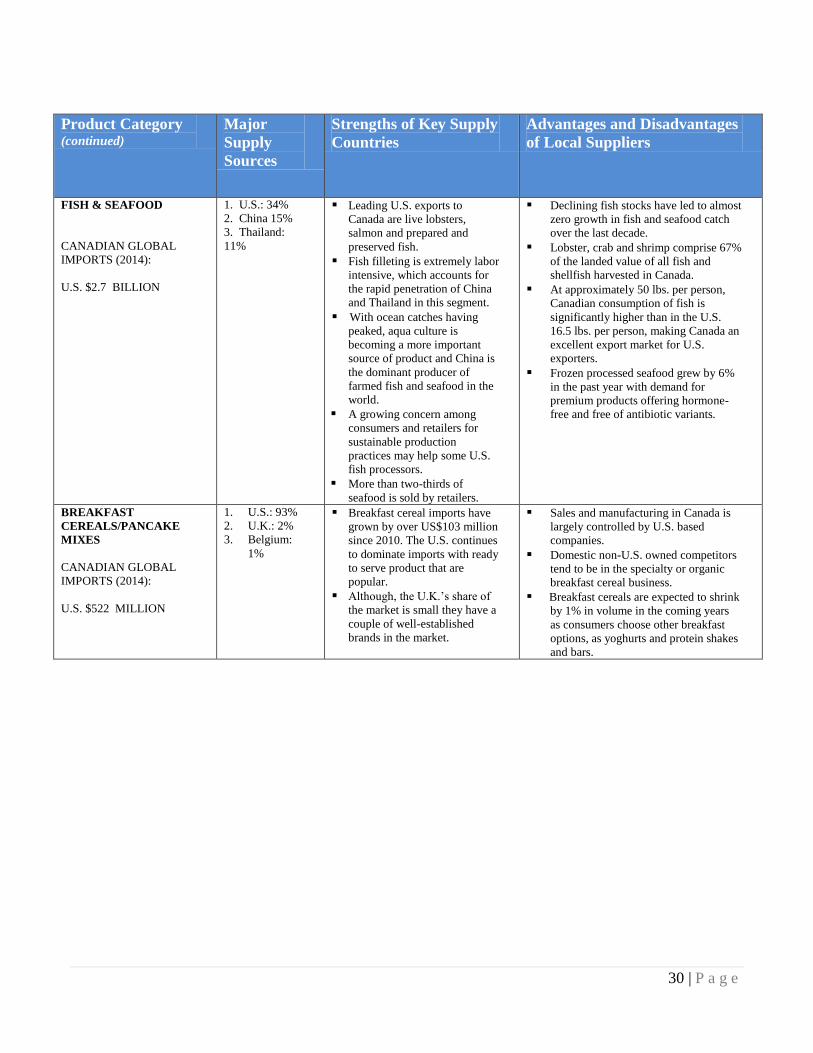
FISH & SEAFOOD
CANADIAN GLOBAL
IMPORTS (2014):
U.S. $2.7 BILLION
1. U.S.: 34%
2. China 15%
3. Thailand:
11%
Leading U.S. exports to
Canada are live lobsters,
salmon and prepared and
preserved fish.
Fish filleting is extremely labor
intensive, which accounts for
the rapid penetration of China
and Thailand in this segment.
With ocean catches having peaked, aqua culture is
becoming a more important
source of product and China is
the dominant producer of
farmed fish and seafood in the
world.
A growing concern among
consumers and retailers for
sustainable production
practices may help some U.S.
fish processors.
More than two-thirds of
seafood is sold by retailers.
Declining fish stocks have led to almost
zero growth in fish and seafood catch
over the last decade.
Lobster, crab and shrimp comprise 67%
of the landed value of all fish and
shellfish harvested in Canada.
At approximately 50 lbs. per person,
Canadian consumption of fish is
significantly higher than in the U.S.
16.5 lbs. per person, making Canada an
excellent export market for U.S.
exporters.
Frozen processed seafood grew by 6%
in the past year with demand for
premium products offering hormone-
free and free of antibiotic variants.
BREAKFAST
CEREALS/PANCAKE
MIXES
CANADIAN GLOBAL
IMPORTS (2014):
U.S. $522 MILLION
1. U.S.: 93%
2. U.K.: 2%
3. Belgium:
1%
Breakfast cereal imports have
grown by over US$103 million
since 2010. The U.S. continues
to dominate imports with ready
to serve product that are
popular.
Although, the U.K.’s share of
the market is small they have a
couple of well-established
brands in the market.
Sales and manufacturing in Canada is
largely controlled by U.S. based
companies.
Domestic non-U.S. owned competitors
tend to be in the specialty or organic
breakfast cereal business.
Breakfast cereals are expected to shrink
by 1% in volume in the coming years
as consumers choose other breakfast
options, as yoghurts and protein shakes
and bars.
31 | P a g e
Product
Category (continued)
Major
Supply
Sources
Strengths of Key Supply
Countries
Advantages and Disadvantages of Local
Suppliers
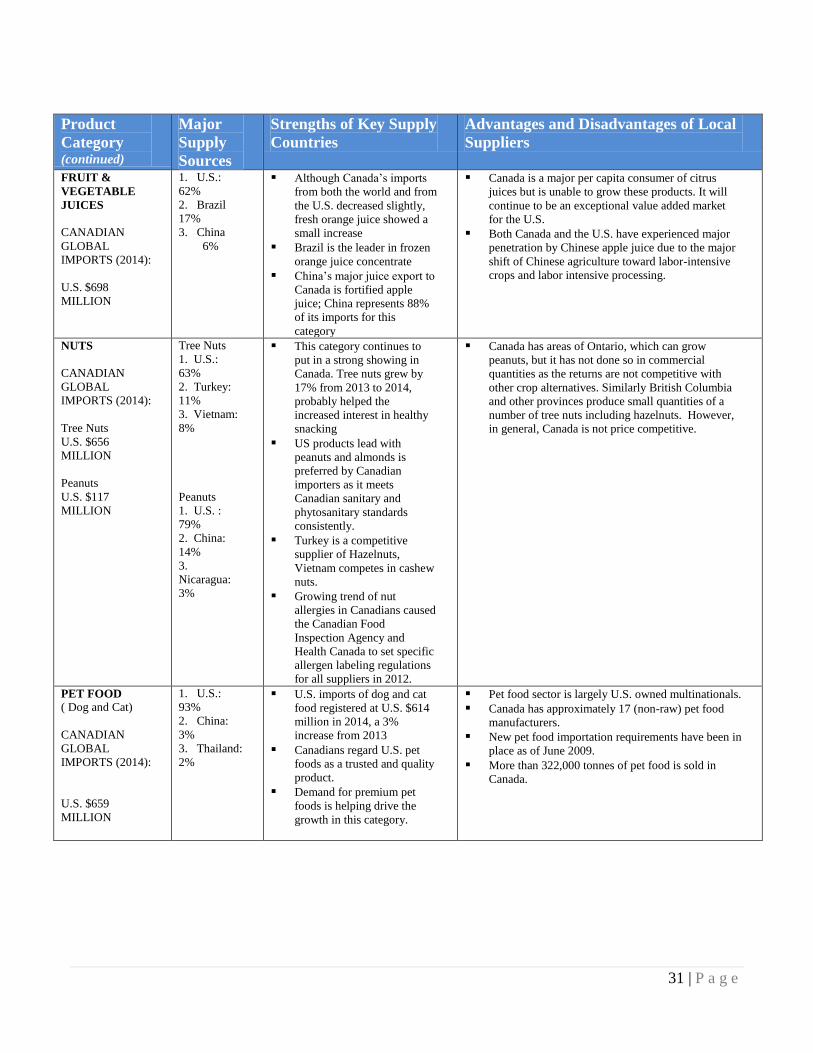
FRUIT &
VEGETABLE
JUICES
CANADIAN
GLOBAL
IMPORTS (2014):
U.S. $698
MILLION
1. U.S.:
62%
2. Brazil
17%
3. China
6%
Although Canada’s imports
from both the world and from
the U.S. decreased slightly,
fresh orange juice showed a
small increase
Brazil is the leader in frozen
orange juice concentrate
China’s major juice export to
Canada is fortified apple
juice; China represents 88%
of its imports for this
category
Canada is a major per capita consumer of citrus
juices but is unable to grow these products. It will
continue to be an exceptional value added market
for the U.S.
Both Canada and the U.S. have experienced major
penetration by Chinese apple juice due to the major
shift of Chinese agriculture toward labor-intensive
crops and labor intensive processing.
NUTS
CANADIAN
GLOBAL
IMPORTS (2014):
Tree Nuts
U.S. $656
MILLION
Peanuts
U.S. $117
MILLION
Tree Nuts
1. U.S.:
63%
2. Turkey:
11%
3. Vietnam:
8%
Peanuts
1. U.S. :
79%
2. China:
14%
3.
Nicaragua:
3%
This category continues to
put in a strong showing in
Canada. Tree nuts grew by
17% from 2013 to 2014,
probably helped the
increased interest in healthy
snacking
US products lead with
peanuts and almonds is
preferred by Canadian
importers as it meets
Canadian sanitary and
phytosanitary standards
consistently.
Turkey is a competitive
supplier of Hazelnuts,
Vietnam competes in cashew
nuts.
Growing trend of nut
allergies in Canadians caused
the Canadian Food
Inspection Agency and
Health Canada to set specific
allergen labeling regulations
for all suppliers in 2012.
Canada has areas of Ontario, which can grow
peanuts, but it has not done so in commercial
quantities as the returns are not competitive with
other crop alternatives. Similarly British Columbia
and other provinces produce small quantities of a
number of tree nuts including hazelnuts. However,
in general, Canada is not price competitive.
PET FOOD
( Dog and Cat)
CANADIAN
GLOBAL
IMPORTS (2014):
U.S. $659
MILLION
1. U.S.:
93%
2. China:
3%
3. Thailand:
2%
U.S. imports of dog and cat
food registered at U.S. $614
million in 2014, a 3%
increase from 2013
Canadians regard U.S. pet
foods as a trusted and quality
product.
Demand for premium pet
foods is helping drive the
growth in this category.
Pet food sector is largely U.S. owned multinationals.
Canada has approximately 17 (non-raw) pet food
manufacturers.
New pet food importation requirements have been in
place as of June 2009.
More than 322,000 tonnes of pet food is sold in
Canada.
32 | P a g e
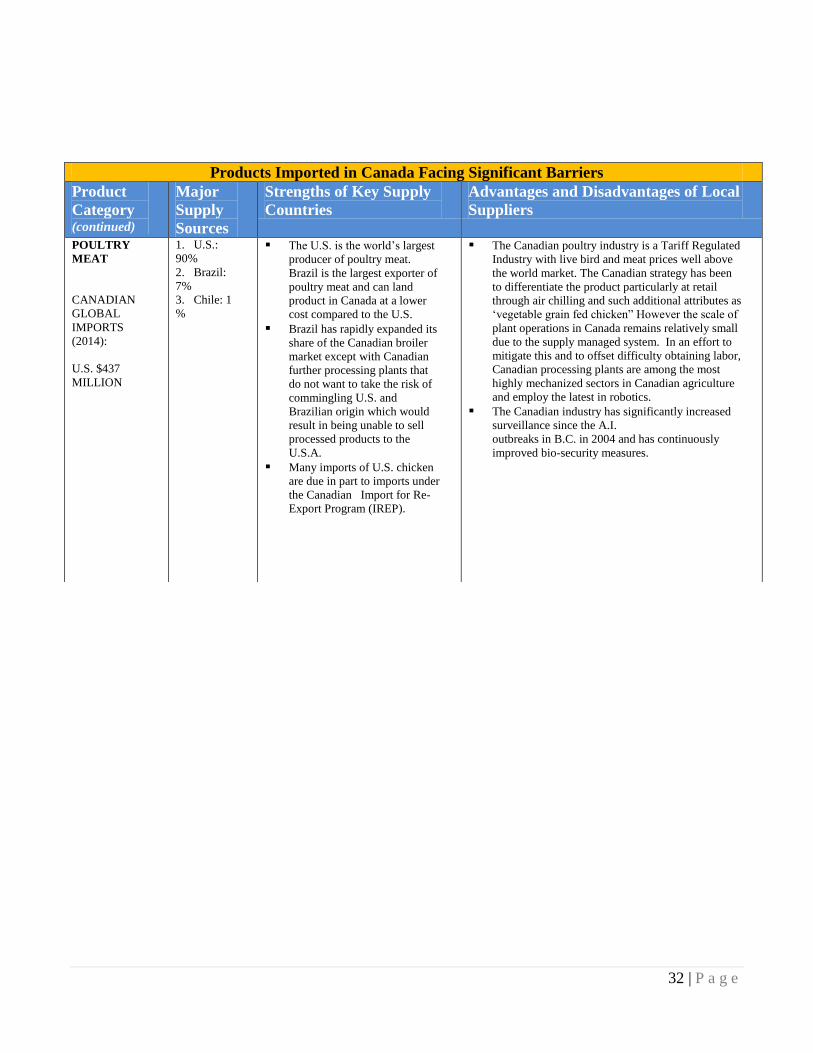
Products Imported in Canada Facing Significant Barriers
Product
Category (continued)
Major
Supply
Sources
Strengths of Key Supply
Countries
Advantages and Disadvantages of Local
Suppliers
POULTRY
MEAT
CANADIAN
GLOBAL
IMPORTS
(2014):
U.S. $437
MILLION
1. U.S.:
90%
2. Brazil:
7%
3. Chile: 1
%
The U.S. is the world’s largest
producer of poultry meat.
Brazil is the largest exporter of
poultry meat and can land
product in Canada at a lower
cost compared to the U.S.
Brazil has rapidly expanded its
share of the Canadian broiler
market except with Canadian
further processing plants that
do not want to take the risk of
commingling U.S. and
Brazilian origin which would
result in being unable to sell
processed products to the
U.S.A.
Many imports of U.S. chicken
are due in part to imports under
the Canadian Import for Re-
Export Program (IREP).
The Canadian poultry industry is a Tariff Regulated
Industry with live bird and meat prices well above
the world market. The Canadian strategy has been
to differentiate the product particularly at retail
through air chilling and such additional attributes as
‘vegetable grain fed chicken” However the scale of
plant operations in Canada remains relatively small
due to the supply managed system. In an effort to
mitigate this and to offset difficulty obtaining labor,
Canadian processing plants are among the most
highly mechanized sectors in Canadian agriculture
and employ the latest in robotics.
The Canadian industry has significantly increased
surveillance since the A.I.
outbreaks in B.C. in 2004 and has continuously
improved bio-security measures.

33 | P a g e
Products Imported in Canada Facing Significant Barriers
Product
Category
Major
Supply
Sources
Strengths of Key Supply
Countries
Advantages and Disadvantages of
Local Suppliers
DAIRY
CANADIAN
GLOBAL
IMPORTS
(2014):
(excluding
cheese):
U.S. $384
MILLION
(Cheese) :
U.S. $271
MILLION
1. U.S.:
67%
2. New
Zealand:
14%
3.
Germany:
8%
1. U.S.
26%
2. Italy
19%
3. France
18%
The U.S.’s close proximity to
market, speedy delivery, and
significant freight advantage has
allowed it to be competitive in the
Canadian Import for Re-export
Program (IREP) which allows U.S.
dairy product to be imported into
Canada duty free, and used in
further processing, provided the
product is subsequently exported.
The European Union has a distinct
advantage in the cheese trade since
it has been allocated 66% of
Canada’s cheese quota as a result of
the 1994 Agreement on Agriculture
(AoA). Though details of the
CETA free trade agreement
between Canada and the EU have
yet to be finalized, it is expected
that this advantage will either
increase or be maintained.
New Zealand has a cost leadership
advantage. Low costs of
production due to the availability of
year-round pasturage have helped
New Zealand achieve a 30% share
of world dairy exports. New
Zealand has an additional
advantage on butter imports into
Canada and hold 61% of Canada’s
import quota for butter.
The Canadian dairy market operates under a
supply management system, which attempts to
match domestic supply with domestic demand
while paying producers on a cost of production
related formula. This system has tended to price
dairy products above prevailing world levels.
Imports are controlled under Tariff-rate-quota
(TRQ) and over quota imports are subject to
high tariffs.
American suppliers have taken advantage of the
Import for Re-export Program (IREP), which
allows Canadian processors to import dairy
products used in manufacturing provided the
product is exported. The U.S. is the largest
user of this program due to the perishable
nature of the products.
Canadian tariff rate quotas stipulate a 50-per-
cent dairy content guideline for imported
product, resulting in the creation of ingredients
and blend products that are designed to
circumvent this guideline. Butter-oil-sugar
blends were the first major products to be
imported tariff-free, displacing Canadian milk
for ice cream. More recently there has been an
increase in flavored milks imported as
“beverages” and a number of milk proteins
which are not captured by the dairy TRQ.
34 | P a g e
Section V. Growing Trends
Diet Friendly
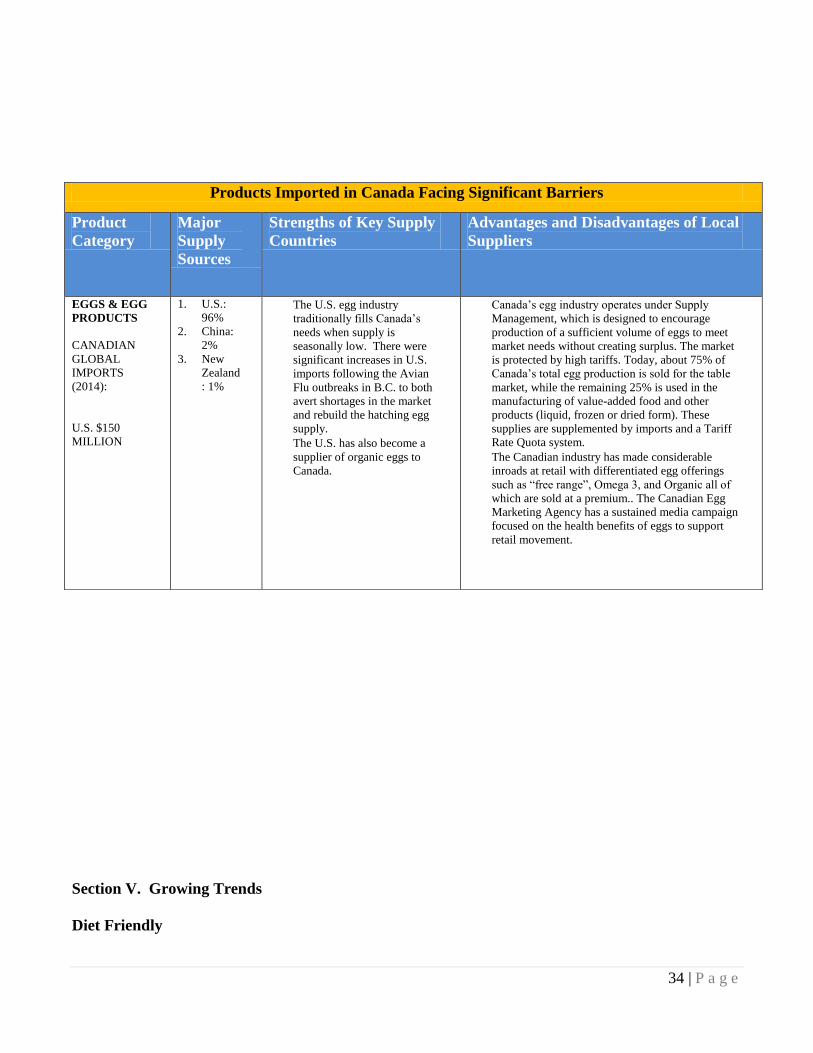
Products Imported in Canada Facing Significant Barriers
Product
Category
Major
Supply
Sources
Strengths of Key Supply
Countries
Advantages and Disadvantages of Local
Suppliers
EGGS & EGG
PRODUCTS
CANADIAN
GLOBAL
IMPORTS
(2014):
U.S. $150
MILLION
1. U.S.:
96%
2. China:
2%
3. New
Zealand
: 1%
The U.S. egg industry
traditionally fills Canada’s
needs when supply is
seasonally low. There were
significant increases in U.S.
imports following the Avian
Flu outbreaks in B.C. to both
avert shortages in the market
and rebuild the hatching egg
supply.
The U.S. has also become a
supplier of organic eggs to
Canada.
Canada’s egg industry operates under Supply
Management, which is designed to encourage
production of a sufficient volume of eggs to meet
market needs without creating surplus. The market
is protected by high tariffs. Today, about 75% of
Canada’s total egg production is sold for the table
market, while the remaining 25% is used in the
manufacturing of value-added food and other
products (liquid, frozen or dried form). These
supplies are supplemented by imports and a Tariff
Rate Quota system.
The Canadian industry has made considerable
inroads at retail with differentiated egg offerings
such as “free range”, Omega 3, and Organic all of
which are sold at a premium.. The Canadian Egg
Marketing Agency has a sustained media campaign
focused on the health benefits of eggs to support
retail movement.
35 | P a g e
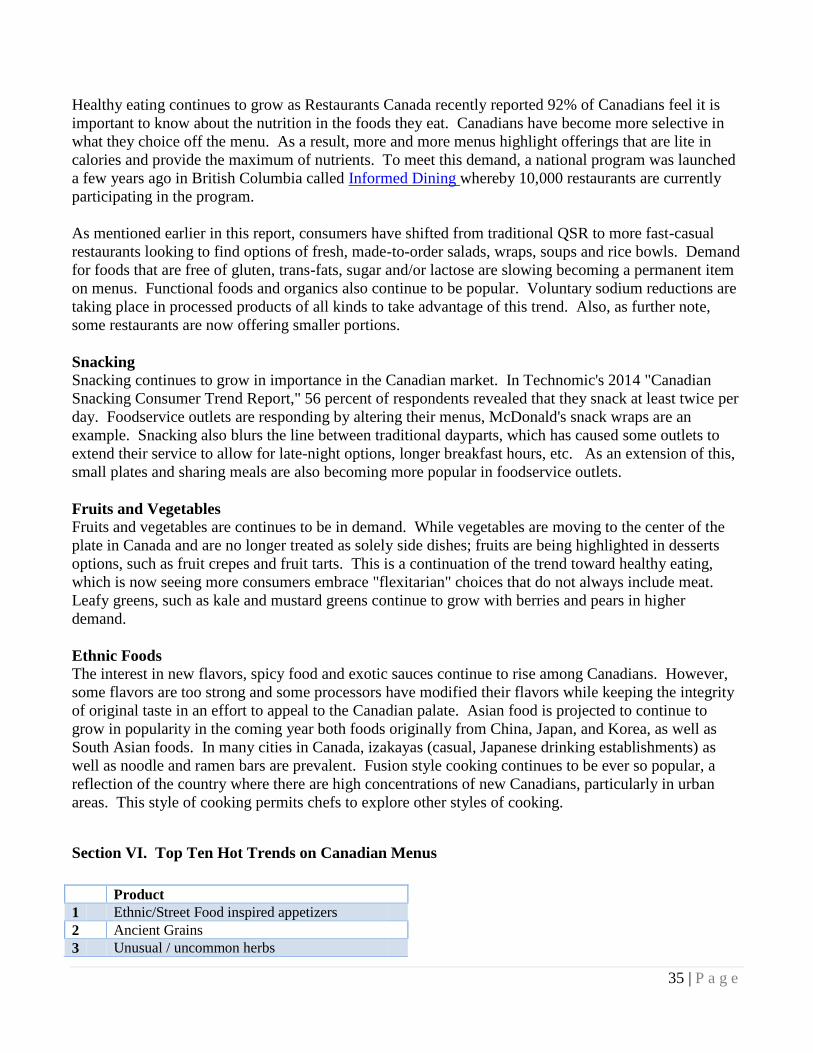
Healthy eating continues to grow as Restaurants Canada recently reported 92% of Canadians feel it is
important to know about the nutrition in the foods they eat. Canadians have become more selective in
what they choice off the menu. As a result, more and more menus highlight offerings that are lite in
calories and provide the maximum of nutrients. To meet this demand, a national program was launched
a few years ago in British Columbia called Informed Dining whereby 10,000 restaurants are currently
participating in the program.
As mentioned earlier in this report, consumers have shifted from traditional QSR to more fast-casual
restaurants looking to find options of fresh, made-to-order salads, wraps, soups and rice bowls. Demand
for foods that are free of gluten, trans-fats, sugar and/or lactose are slowing becoming a permanent item
on menus. Functional foods and organics also continue to be popular. Voluntary sodium reductions are
taking place in processed products of all kinds to take advantage of this trend. Also, as further note,
some restaurants are now offering smaller portions.
Snacking
Snacking continues to grow in importance in the Canadian market. In Technomic's 2014 "Canadian
Snacking Consumer Trend Report," 56 percent of respondents revealed that they snack at least twice per
day. Foodservice outlets are responding by altering their menus, McDonald's snack wraps are an
example. Snacking also blurs the line between traditional dayparts, which has caused some outlets to
extend their service to allow for late-night options, longer breakfast hours, etc. As an extension of this,
small plates and sharing meals are also becoming more popular in foodservice outlets.
Fruits and Vegetables
Fruits and vegetables are continues to be in demand. While vegetables are moving to the center of the
plate in Canada and are no longer treated as solely side dishes; fruits are being highlighted in desserts
options, such as fruit crepes and fruit tarts. This is a continuation of the trend toward healthy eating,
which is now seeing more consumers embrace "flexitarian" choices that do not always include meat.
Leafy greens, such as kale and mustard greens continue to grow with berries and pears in higher
demand.
Ethnic Foods
The interest in new flavors, spicy food and exotic sauces continue to rise among Canadians. However,
some flavors are too strong and some processors have modified their flavors while keeping the integrity
of original taste in an effort to appeal to the Canadian palate. Asian food is projected to continue to
grow in popularity in the coming year both foods originally from China, Japan, and Korea, as well as
South Asian foods. In many cities in Canada, izakayas (casual, Japanese drinking establishments) as
well as noodle and ramen bars are prevalent. Fusion style cooking continues to be ever so popular, a
reflection of the country where there are high concentrations of new Canadians, particularly in urban
areas. This style of cooking permits chefs to explore other styles of cooking.
Section VI. Top Ten Hot Trends on Canadian Menus
Product
1 Ethnic/Street Food inspired appetizers
2 Ancient Grains
3 Unusual / uncommon herbs

36 | P a g e
Market Sector Reports
Listed below are the food sector and marketing reports published by the Office of Agricultural Affairs in
Ottawa and Toronto, Canada. For a complete listing of other Post reports and of FAS’ worldwide
agricultural reporting, visit the FAS GAIN web page and be sure to insert the report number at:
http://gain.fas.usda.gov/Lists/Advanced percent20Search/AllItems.aspx
Appendix A. Trade and Demographic Information
Agricultural Imports/from All Countries/2014/U.S. Market Share 1
$37.8 billion/ 61 percent
4 Non-wheat noodles
5 Fewer Choices on the menu but healthier
6 Natural ingredients/minimally processed foods
7 Fermenting
8 Natural sweeteners
9 Family-style dining (e.g. shared plates)
10 Vinegar/flavored vinegar/house-made vinegar Source: CRFA’s Foodservice Facts 2015
AGR
REPORT#
Title of Report Date
CA 15113 Exporter Guide: A Practical Guide 12/16/2015
CA 15109 An Updated Overview of the Retail Sector in Canada 12/9/2015
CA 15100 Fresh Deciduous Fruit Annual 10/27/15
CA 15084 Canadian Labelling Requirements for Fresh Fruits and Vegetables 09/23/15
CA 15074 Pesticides and MRLs in Canada 08/07/15
CA 15058 Proposed Changes to Nutrition Labelling Regulations Published 06/23/15
CA 15040 Container Size Regulations 04/24/15
CA 15026 Canada Top Market for U.S. High Value Agricultural Exports 03/19/15
CA 15012 Outlook of 2015 Canadian Food and Beverage Trends 01/30/15
CA 14117 An Overview of the Food Processing Sector in Canada 12/17/14
CA 14103 Entering Canada with Products for a Show or Trade Fair 11/07/14
CA 14054 Turkey Meat in Canada 05/28/14
CA 14044 Impact of Canadian Trade Action Taken Against US-Origin Pizza
Toppings Kits
05/07/14
CA 14024 Canadians to Consume More Poultry Meat in 2014 02/27/14
CA 13008 Survey Voluntary – Canadian Consumer Insights 02/08/13
37 | P a g e
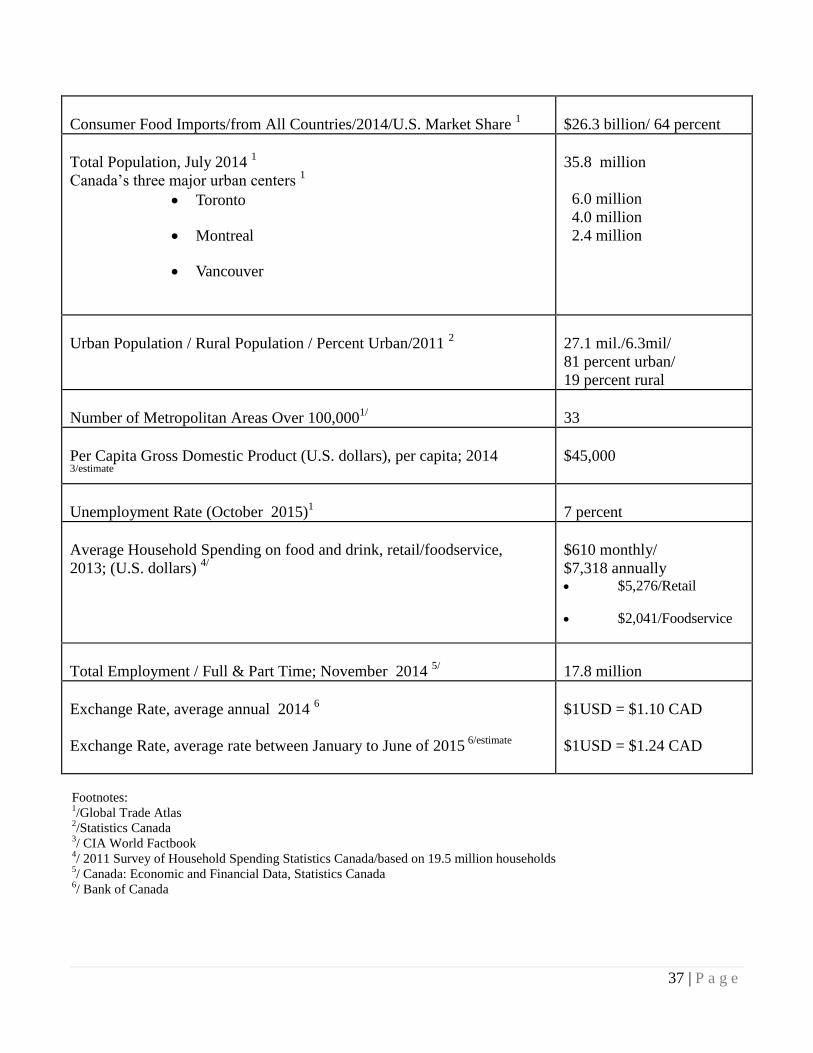
Consumer Food Imports/from All Countries/2014/U.S. Market Share 1
$26.3 billion/ 64 percent
Total Population, July 2014 1
Canada’s three major urban centers 1
Toronto
Montreal
Vancouver
35.8 million
6.0 million
4.0 million
2.4 million
Urban Population / Rural Population / Percent Urban/2011 2
27.1 mil./6.3mil/
81 percent urban/
19 percent rural
Number of Metropolitan Areas Over 100,0001/
33
Per Capita Gross Domestic Product (U.S. dollars), per capita; 2014 3/estimate
$45,000
Unemployment Rate (October 2015)1
7 percent
Average Household Spending on food and drink, retail/foodservice,
2013; (U.S. dollars) 4/
$610 monthly/
$7,318 annually $5,276/Retail
$2,041/Foodservice
Total Employment / Full & Part Time; November 2014 5/
17.8 million
Exchange Rate, average annual 2014 6
Exchange Rate, average rate between January to June of 2015 6/estimate
$1USD = $1.10 CAD
$1USD = $1.24 CAD
Footnotes: 1/Global Trade Atlas
2/Statistics Canada
3/ CIA World Factbook
4/ 2011 Survey of Household Spending Statistics Canada/based on 19.5 million households
5/ Canada: Economic and Financial Data, Statistics Canada
6/ Bank of Canada
38 | P a g e
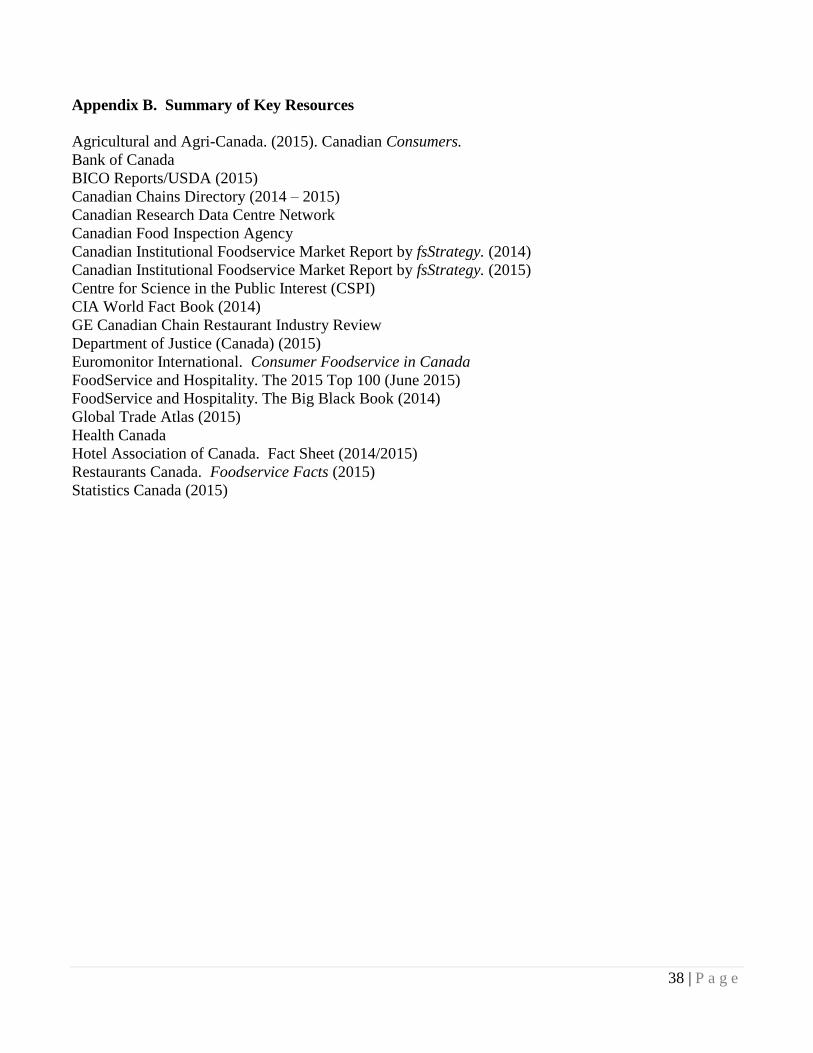
Appendix B. Summary of Key Resources
Agricultural and Agri-Canada. (2015). Canadian Consumers.
Bank of Canada
BICO Reports/USDA (2015)
Canadian Chains Directory (2014 – 2015)
Canadian Research Data Centre Network
Canadian Food Inspection Agency
Canadian Institutional Foodservice Market Report by fsStrategy. (2014)
Canadian Institutional Foodservice Market Report by fsStrategy. (2015)
Centre for Science in the Public Interest (CSPI)
CIA World Fact Book (2014)
GE Canadian Chain Restaurant Industry Review
Department of Justice (Canada) (2015)
Euromonitor International. Consumer Foodservice in Canada
FoodService and Hospitality. The 2015 Top 100 (June 2015)
FoodService and Hospitality. The Big Black Book (2014)
Global Trade Atlas (2015)
Health Canada
Hotel Association of Canada. Fact Sheet (2014/2015)
Restaurants Canada. Foodservice Facts (2015)
Statistics Canada (2015)