can silicate and turbulence regulate the vertical flux of biogenic
TRANSCRIPT
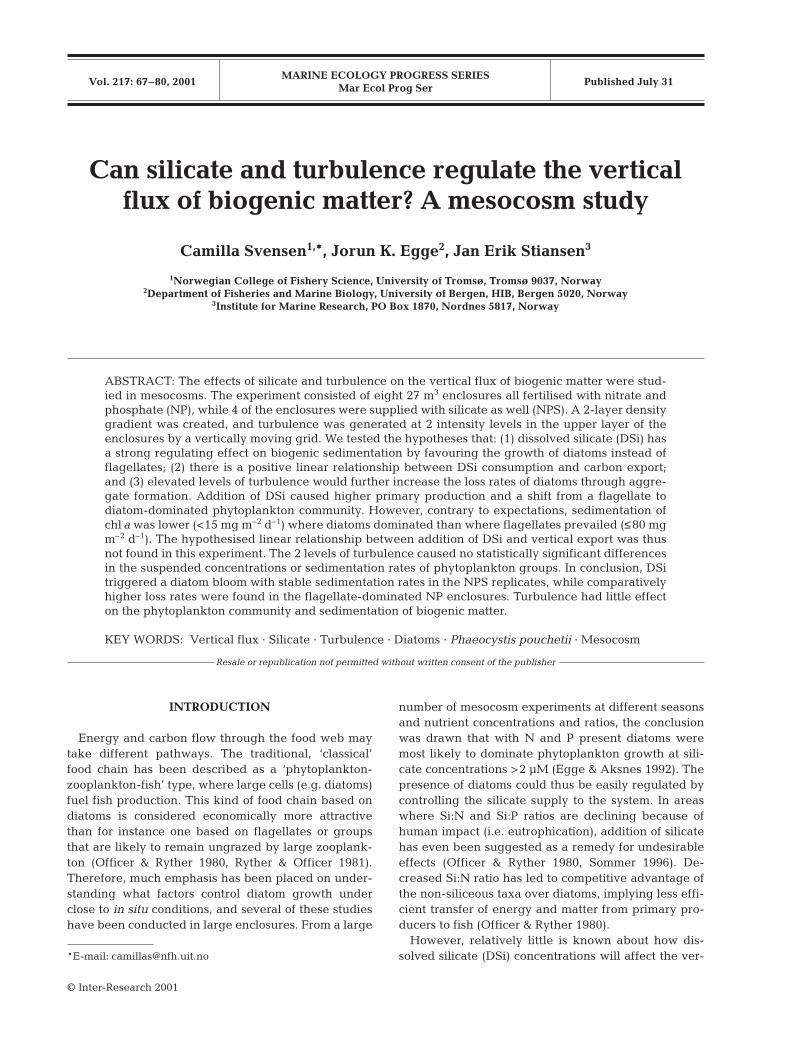
MARINE ECOLOGY PROGRESS SERIESMar Ecol Prog Ser
Vol. 217: 67–80, 2001 Published July 31
INTRODUCTION
Energy and carbon flow through the food web maytake different pathways. The traditional, ‘classical’food chain has been described as a ‘phytoplankton-zooplankton-fish’ type, where large cells (e.g. diatoms)fuel fish production. This kind of food chain based ondiatoms is considered economically more attractivethan for instance one based on flagellates or groupsthat are likely to remain ungrazed by large zooplank-ton (Officer & Ryther 1980, Ryther & Officer 1981).Therefore, much emphasis has been placed on under-standing what factors control diatom growth underclose to in situ conditions, and several of these studieshave been conducted in large enclosures. From a large
number of mesocosm experiments at different seasonsand nutrient concentrations and ratios, the conclusionwas drawn that with N and P present diatoms weremost likely to dominate phytoplankton growth at sili-cate concentrations >2 µM (Egge & Aksnes 1992). Thepresence of diatoms could thus be easily regulated bycontrolling the silicate supply to the system. In areaswhere Si:N and Si:P ratios are declining because ofhuman impact (i.e. eutrophication), addition of silicatehas even been suggested as a remedy for undesirableeffects (Officer & Ryther 1980, Sommer 1996). De-creased Si:N ratio has led to competitive advantage ofthe non-siliceous taxa over diatoms, implying less effi-cient transfer of energy and matter from primary pro-ducers to fish (Officer & Ryther 1980).
However, relatively little is known about how dis-solved silicate (DSi) concentrations will affect the ver-
© Inter-Research 2001
*E-mail: [email protected]
Can silicate and turbulence regulate the verticalflux of biogenic matter? A mesocosm study
Camilla Svensen1,*, Jorun K. Egge2, Jan Erik Stiansen3
1Norwegian College of Fishery Science, University of Tromsø, Tromsø 9037, Norway2Department of Fisheries and Marine Biology, University of Bergen, HIB, Bergen 5020, Norway
3Institute for Marine Research, PO Box 1870, Nordnes 5817, Norway
ABSTRACT: The effects of silicate and turbulence on the vertical flux of biogenic matter were stud-ied in mesocosms. The experiment consisted of eight 27 m3 enclosures all fertilised with nitrate andphosphate (NP), while 4 of the enclosures were supplied with silicate as well (NPS). A 2-layer densitygradient was created, and turbulence was generated at 2 intensity levels in the upper layer of theenclosures by a vertically moving grid. We tested the hypotheses that: (1) dissolved silicate (DSi) hasa strong regulating effect on biogenic sedimentation by favouring the growth of diatoms instead offlagellates; (2) there is a positive linear relationship between DSi consumption and carbon export;and (3) elevated levels of turbulence would further increase the loss rates of diatoms through aggre-gate formation. Addition of DSi caused higher primary production and a shift from a flagellate todiatom-dominated phytoplankton community. However, contrary to expectations, sedimentation ofchl a was lower (<15 mg m–2 d–1) where diatoms dominated than where flagellates prevailed (≤80 mgm–2 d–1). The hypothesised linear relationship between addition of DSi and vertical export was thusnot found in this experiment. The 2 levels of turbulence caused no statistically significant differencesin the suspended concentrations or sedimentation rates of phytoplankton groups. In conclusion, DSitriggered a diatom bloom with stable sedimentation rates in the NPS replicates, while comparativelyhigher loss rates were found in the flagellate-dominated NP enclosures. Turbulence had little effecton the phytoplankton community and sedimentation of biogenic matter.
KEY WORDS: Vertical flux · Silicate · Turbulence · Diatoms · Phaeocystis pouchetii · Mesocosm
Resale or republication not permitted without written consent of the publisher
Mar Ecol Prog Ser 217: 67–80, 2001
tical flux of biogenic matter, although this could pro-vide important information about pelagic food webefficiency. An efficient food chain based on diatomsshould give rise to high vertical export of carbon, eitherthrough aggregates or faecal pellets (Ryther & Officer1981, Smetacek et al. 1984, Peinert et al. 1989, Passowet al. 1994). From a mesocosm experiment in which DSiwas added in moderate concentrations correspondingto 3 µM, Wassmann et al. (1996) postulated that ‘pres-ence of dissolved silicate appears to decrease the nutri-ent turn-over time in the euphotic zone by increasingvertical export’. Furthermore the authors suggestedthat there may be a curve-linear relationship betweenadded (or consumed) DSi and carbon export (when Nand P are available at non-limiting concentrations),until phytoplankton growth is limited by other factorssuch as light. It remains to be seen if this suggestion isvalid over the entire range of DSi concentrations.
Turbulence intensity is another factor that is believedto have an impact on the structure of the pelagic foodweb, for instance by promoting growth of larger cellssuch as diatoms (Nielsen & Kiørboe 1991, Kiørboe 1993)and inhibiting dinoflagellates (Margalef 1978, Marga-lef et al. 1979). Turbulence, cell size and abundancedetermine the collision frequency of suspended phyto-plankton cells, and some of these will stick together andgradually build up larger aggregates with enhancedsettling velocities (Kiørboe 1993, Ruiz 1996). While thismay increase the vertical flux of biogenic matter, turbu-lence may also decrease sedimentation by increasedgrazing pressure (Petersen et al. 1998) and, if strongenough, also disrupt aggregates (Alldredge et al. 1990).Although extensive theoretical work on the effect ofturbulence on sedimentation is available (see for in-stance Kiørboe 1993 and references therein), less effort
has been given to testing these theoretical assumptionsat an ecosystem and community level under more nat-ural, but controlled conditions.
In order to investigate the relationship betweenadded DSi and vertical carbon export under controlledconditions, we fertilised large mesocosm enclosureswith nitrogen, phosphorus and silicate. Furthermorewe attempted to identify the possible impact of 2 dif-ferent levels of turbulence (within the range of turbu-lence intensities reported in coastal areas) on the verti-cal flux of carbon. We wanted to test the followinghypotheses: (1) addition of DSi will favour the growthof diatoms and thereby lead to increased sedimenta-tion of biogenic matter; (2) there is a positive linearrelationship between DSi consumption and carbonexport (Wassmann et al. 1996); (3) higher turbulenceintensity will cause higher phytoplankton sedimenta-tion than lower turbulence intensities.
MATERIALS AND METHODS
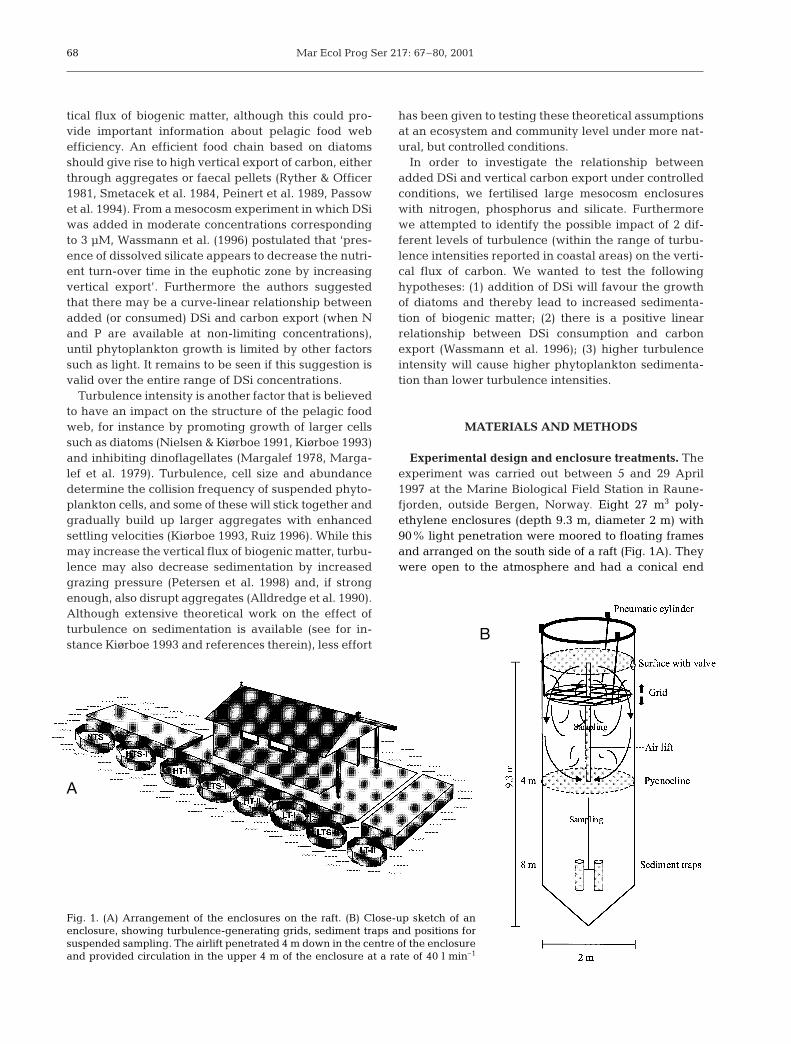
Experimental design and enclosure treatments. Theexperiment was carried out between 5 and 29 April1997 at the Marine Biological Field Station in Raune-fjorden, outside Bergen, Norway. Eight 27 m3 poly-ethylene enclosures (depth 9.3 m, diameter 2 m) with90% light penetration were moored to floating framesand arranged on the south side of a raft (Fig. 1A). Theywere open to the atmosphere and had a conical end
68
Fig. 1. (A) Arrangement of the enclosures on the raft. (B) Close-up sketch of anenclosure, showing turbulence-generating grids, sediment traps and positions forsuspended sampling. The airlift penetrated 4 m down in the centre of the enclosureand provided circulation in the upper 4 m of the enclosure at a rate of 40 l min–1
A
B

Svensen et al.: Can silicate and turbulence regulate the vertical flux of biogenic matter?
(Fig. 1B). An airlift-system provided homogeneity inthe upper layer by circulating water from 4 m depth tothe surface (Fig. 1B) at a pumping rate of 40 l min–1
(Jacobsen et al. 1995). As an attempt to minimise thedisturbance from wind-induced waves on the enclo-sures, an oil boom was arranged in a circle around theraft. The boom penetrated ca 1 m down into the seaand was anchored to the bottom.
The enclosures were filled simultaneously by pump-ing unfiltered seawater from 5 m into a large tank withseparate outlets. In order to increase the salinity of thebottom layer in the enclosures by 1.5, seawater satu-rated with NaCl was supplied to the large tank whenthe bottom 13 m3 was filled. An open valve wasmounted to each enclosure, allowing approximately6% daily exchange of surface water. Renewal waterwas pumped from 5 m depth into a large tank and thenfed through tubes to each of the enclosures by outletsat 4 and 7 m. The flow to the upper layer consisted ofnatural seawater, while the flow to the bottom layerwas filtered (10 µm) seawater with an increased salin-ity of 1.5 (S. Nerheim et al. unpubl. data). To compen-sate for loss of nutrients due to renewal of water, 10%of the initial addition was supplied daily to the upperlayer. Flow-through enclosures were chosen becausethey allow the introduction of new phytoplankton spe-cies and prevents an increase in pH caused by higherprimary production (for further details see Egge 1993).
An overview of treatments given to each enclosure issummarised in Table 1. Nitrogen (NaNO3) and phos-phate (KH2PO4) were added to the upper layer of allenclosures on 5 April, while silicate (Na2SiO3· 5H2O)was added to only 4 of the enclosures. Nutrient addi-tions corresponded to 15 µM nitrate, 1 µM phosphateand 10 µM silicate. Turbulence was generated in allenclosures, but with 2 different intensity levels (forsimplicity termed ‘high’ or ‘low’). All treatments weregiven 2 replicate enclosures, indicated by the number Ior II throughout this paper.
Turbulence was generated in the upper layer by avertically moving grid, driven by 3 pneumatic cylin-
ders (Fig. 1b). The grid had a diameter of 1.5 m andwas made of plexiglass that allowed 95% penetrationof PAR. The grid had a bar width of 5 cm, a mesh sizeof 10 cm and a stroke-length of 40 cm, centred at adepth of 1.0 m. A part of the grid could be removed tomake sampling from the enclosures possible. The 2turbulence regimes were generated by differing theoscillation periods. A discontinuous oscillation cyclewas electronically set to start a half-period each 7 s inthe high turbulence case (HT) and each 28 sec in thelow turbulence case (LT). Each half-period consisted ofan interval of grid motion followed by an interval ofrest. In the high turbulence case the periods of motionand rest were 5 and 2 s, respectively, whereas in thelow turbulence case the same periods were 10 and18 s. On 13 April the turbulence generation systembroke down in one of the high turbulence enclosures(HTS-II), and was switched off for the rest of the exper-iment (leaving the grid in the lowest position at 1.2 m).This enclosure will therefore be referred to as a no-turbulence enclosure (NTS), although ‘background’turbulence was still present in the enclosures gener-ated by the airlift and external forcing. (S. Nerheim etal. unpubl. data).
Sampling procedures and turbulence measure-ments. Sampling from the mesocosms at 2 and 6 mdepth was performed every second day at 09:00 h.Subsamples were collected for the determination ofsuspended chlorophyll a (chl a), particulate organiccarbon (POC) and nitrogen (PON), and nutrients. Sam-ples for phytoplankton species composition were takenfrom 2 m only and preserved with a glutaraldehyde-Lugol solution (2% final concentration, Rousseau et al.1990).
Vertical flux was measured with sediment traps con-sisting of 2 parallel plexiglass cylinders (aspect ratio6.25), positioned at 8 m in the centre of the enclosures(Fig. 1b). The traps were emptied every second day,and no poison was used during the deployment period.The content of each cylinder (1.8 l) was gently mixedand diluted to 2 l before subsampling. Triplicate sub-samples of 25 to 150 ml were taken for determinationof chl a, POC and PON. As far as possible, swimmerswere removed from the filters with forceps to preventcontamination (Lee et al. 1988). Subsamples of 100 mlwere taken from the sediment traps every secondsampling day for 1 replicate only (i.e. enclosures LT-I,LTS-I, HT-I and HTS-I) and preserved with Lugol-mixfor analysis of phytoplankton composition and faecalpellets.
Turbulence intensities were calculated in terms ofenergy dissipation rates (ε), calculated from velocitytime series, using the method of linear regressiondescribed in Stiansen & Sundby (in press). The velocitytime series were measured using a focusing acoustic
69
NP: NPS:15 µM N + 1 µM P 15 µM N + 1 µM P + 10 µM Si
Low turbulence LT LTSHigh turbulence HT HTS
Table 1. Treatment terminology. Nitrate and phosphate (NP)and nitrate, phosphate and silicate (NPS) enclosures andnutrient doses. Enclosures treated with low/high turbulence;replicate treatments designated by I or II throughout text.Note: during HTS-II the turbulence generation system brokedown so this treatment was renamed NTS (no turbulence,
plus silicate)
Mar Ecol Prog Ser 217: 67–80, 2001
current meter (ADV lab probe, from NORTEK) with asampling frequency of 25 Hz, and a resolution of0.1 mm s–1. The ADV is fully described in Kraus et al.(1994). A total of 103 time series were taken during theexperiment. The energy dissipation rates for each ofthe 3 velocity components were calculated. Bad com-ponents were removed, and a logarithmic mean foreach time series was calculated from the remainingcomponents (the logarithmic mean was preferred be-cause it is more robust towards a single high valuethan the sample mean).
Surface irradiance (PAR) was registered continu-ously, and data stored as average values every 10 minin a Li-Cor Li-1000 data logger. Salinity (S) and tem-perature (°C) were measured each day with a Seacatprofiler (Sea Bird Electronics, Bellevue, WA, USA).
Analysis and calculations. Chl a samples were fil-tered onto Sartorius filters (0.45 µm), extracted in 10 ml90% acetone for 8 to 12 h (Parsons et al. 1984) andanalysed on a Turner Design Fluorometer (Model 10-AU) without acidification (Welschmeyer 1994). ThePOC samples were filtered onto pre-combusted What-man GF/F glass-fiber filters and analysed on a LeemanLab CEC 440 elemental analyser after removal of car-bonate with fumes of concentrated HCl. Water samplesof 100 ml for measurements of primary productionwere incubated every second day at 2 and 6 mbetween 10:00 and 14:00 h in the center of the enclo-sures. Primary production was measured using the 14Cmethod according to Steemann Nielsen (1952) andGargas (1975). The samples were filtered onto Sarto-rius membrane filters (0.45 µm), frozen, and latercounted in a Packard Tricarb Liquid ScintillationAnalyser (Model 1900 CA) after fuming with HCl.Daily production rates was calculated according tolight intensity during the incubation time. Nutrientswere measured from freshly collected samples using aSkalar autoanalyser. The silicate values obtained bythis method were adjusted by subtracting 1.3 µM tocorrect for biased blank values. Additional measure-ments and Si uptake kinetic experiments demon-strated that this correction was reasonable (S. Kris-tiansen unpubl. results). Values <0.1 µM (detectionlimit) were set to zero.
Integration of chl a, suspended biomass and nutri-ents were made on the assumption that samples takenfrom 2 m were representative for the mixed upperlayer of the enclosures (about 4 m), while the samplestaken at 6 m were representative for the 4 to 8 m depthinterval. The consumption of nutrients (N, P and Si) ineach enclosure was calculated as:
Nconsumed = Nstart – Nend + Nadd + Nin – Nout (1)
where N represents the type of nutrient, Nstart the startconcentration, Nend the end concentration. Nadd is the
concentration added to the enclosures, Nin the concen-tration supplied with the intake water, and Nout theconcentration leaving the enclosures through the openvalve. The Nout estimates are based on measurementsof the nutrient concentration in the mixed layer of theenclosures and the flow out of each enclosure, whileNin estimates are correspondingly calculated from theflow rate and the nutrient concentrations of the intakewater to the upper and lower layer.
Suspended phytoplankton was enumerated andidentified using the sedimentation method of Utermöhl(1931). Phytoplankton from the sediment traps wascounted using a combination of methods according toSournia (1978) as described by Ratkova et al. (1999).Biovolumes of individual cells were calculated fromlinear dimensions of measured cells applied to appro-priate stereometric formulae (Smayda 1978). The car-bon content of the algae (PPC) was calculated based onaverage volume of the different species and accordingto Strathmann (1967). A volumetric carbon conversionfactor of 69.4 µg C mm–3 (Riebesell et al. 1995) wasapplied to estimate faecal pellet carbon (FPC). The car-bon content of microzooplankton (mainly ciliates) wascalculated using a conversion factor of 0.08 pg C µm–3
according to Garrison & Buck (1989).The effect of nutrients and turbulence on the sus-
pended phytoplankton community (chl a concentra-tions, POC, primary production and phytoplanktongroups) and on the vertical flux of biogenic matter (chl aand POC) was tested with ANOVA repeated measures(Type III model). Each enclosure was defined as sub-ject, with time as the repeated effect. Time was also in-cluded in the model to correct for time-dependency ofdata. When necessary, data were logarithmically trans-formed to obtain normality in the distribution.
RESULTS
Physical environment and development of turbulence regimes
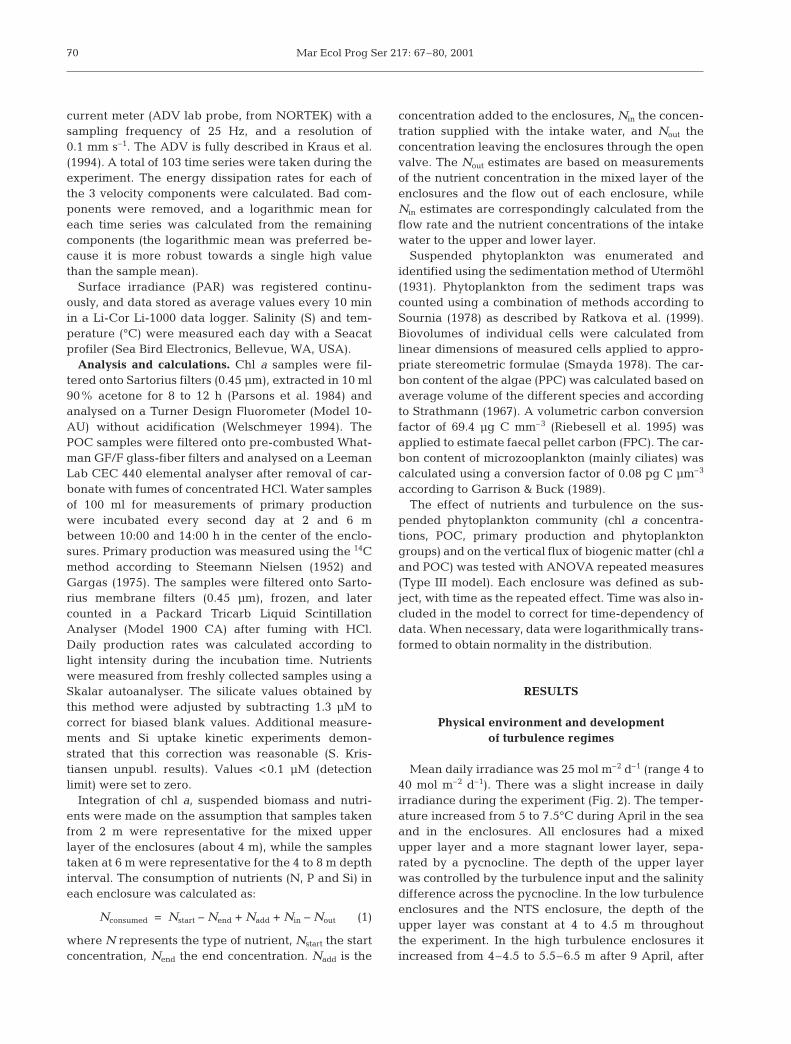
Mean daily irradiance was 25 mol m–2 d–1 (range 4 to40 mol m–2 d–1). There was a slight increase in dailyirradiance during the experiment (Fig. 2). The temper-ature increased from 5 to 7.5°C during April in the seaand in the enclosures. All enclosures had a mixedupper layer and a more stagnant lower layer, sepa-rated by a pycnocline. The depth of the upper layerwas controlled by the turbulence input and the salinitydifference across the pycnocline. In the low turbulenceenclosures and the NTS enclosure, the depth of theupper layer was constant at 4 to 4.5 m throughoutthe experiment. In the high turbulence enclosures itincreased from 4–4.5 to 5.5–6.5 m after 9 April, after
70
Svensen et al.: Can silicate and turbulence regulate the vertical flux of biogenic matter?
which it stayed stable (Fig. 3A). The pycnocline wasalways well above the sediment traps positioned at 8 mdepth.
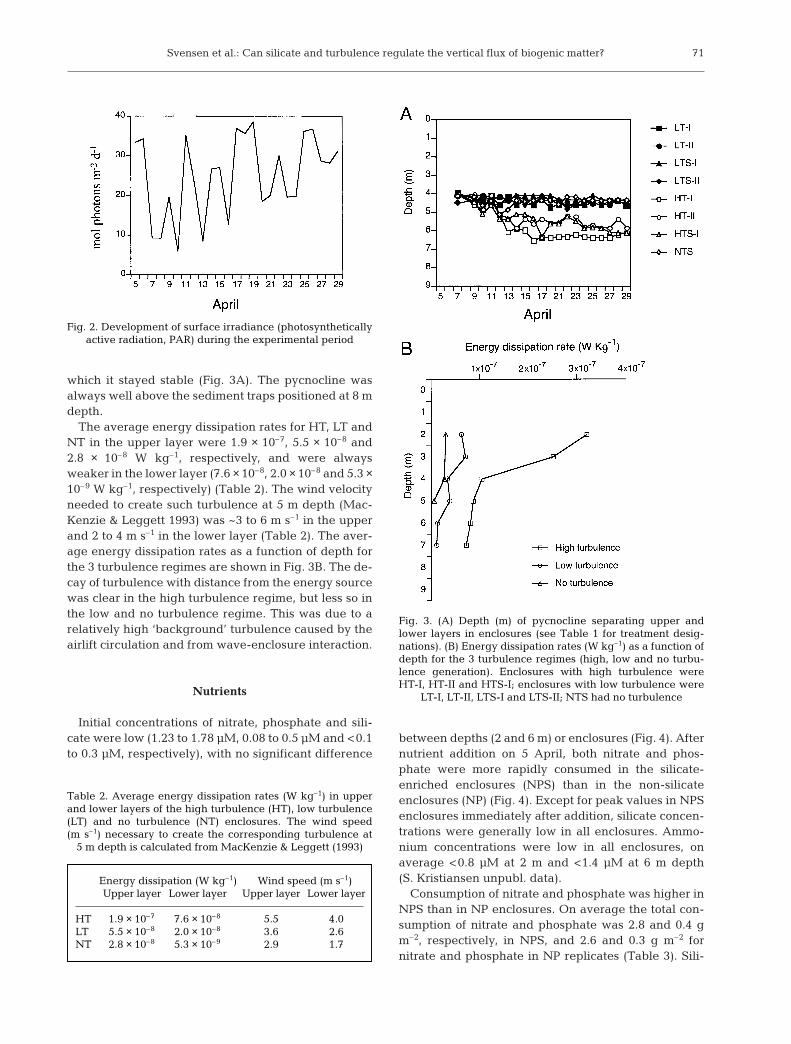
The average energy dissipation rates for HT, LT andNT in the upper layer were 1.9 × 10⁻⁷, 5.5 × 10⁻⁸ and2.8 × 10–8 W kg–1, respectively, and were alwaysweaker in the lower layer (7.6 × 10⁻⁸, 2.0 × 10⁻⁸ and 5.3 ×10⁻⁹ W kg–1, respectively) (Table 2). The wind velocityneeded to create such turbulence at 5 m depth (Mac-Kenzie & Leggett 1993) was ~3 to 6 m s–1 in the upperand 2 to 4 m s–1 in the lower layer (Table 2). The aver-age energy dissipation rates as a function of depth forthe 3 turbulence regimes are shown in Fig. 3B. The de-cay of turbulence with distance from the energy sourcewas clear in the high turbulence regime, but less so inthe low and no turbulence regime. This was due to arelatively high ‘background’ turbulence caused by theairlift circulation and from wave-enclosure interaction.
Nutrients
Initial concentrations of nitrate, phosphate and sili-cate were low (1.23 to 1.78 µM, 0.08 to 0.5 µM and <0.1to 0.3 µM, respectively), with no significant difference
between depths (2 and 6 m) or enclosures (Fig. 4). Afternutrient addition on 5 April, both nitrate and phos-phate were more rapidly consumed in the silicate-enriched enclosures (NPS) than in the non-silicateenclosures (NP) (Fig. 4). Except for peak values in NPSenclosures immediately after addition, silicate concen-trations were generally low in all enclosures. Ammo-nium concentrations were low in all enclosures, onaverage <0.8 µM at 2 m and <1.4 µM at 6 m depth(S. Kristiansen unpubl. data).
Consumption of nitrate and phosphate was higher inNPS than in NP enclosures. On average the total con-sumption of nitrate and phosphate was 2.8 and 0.4 gm–2, respectively, in NPS, and 2.6 and 0.3 g m–2 fornitrate and phosphate in NP replicates (Table 3). Sili-
71
Fig. 2. Development of surface irradiance (photosynthetically active radiation, PAR) during the experimental period
Fig. 3. (A) Depth (m) of pycnocline separating upper andlower layers in enclosures (see Table 1 for treatment desig-nations). (B) Energy dissipation rates (W kg–1) as a function ofdepth for the 3 turbulence regimes (high, low and no turbu-lence generation). Enclosures with high turbulence wereHT-I, HT-II and HTS-I; enclosures with low turbulence were
LT-I, LT-II, LTS-I and LTS-II; NTS had no turbulence
Energy dissipation (W kg–1) Wind speed (m s–1)Upper layer Lower layer Upper layer Lower layer
HT 1.9 × 10⁻⁷ 7.6 × 10⁻⁸ 5.5 4.0LT 5.5 × 10⁻⁸ 2.0 × 10⁻⁸ 3.6 2.6NT 2.8 × 10⁻⁸ 5.3 × 10⁻⁹ 2.9 1.7
Table 2. Average energy dissipation rates (W kg–1) in upperand lower layers of the high turbulence (HT), low turbulence(LT) and no turbulence (NT) enclosures. The wind speed(m s–1) necessary to create the corresponding turbulence at
5 m depth is calculated from MacKenzie & Leggett (1993)
Mar Ecol Prog Ser 217: 67–80, 2001
cate was only added to NPS repli-cates, and on average consumptionin these enclosures was 3.6 g m–2
(Table 3).
Suspended material
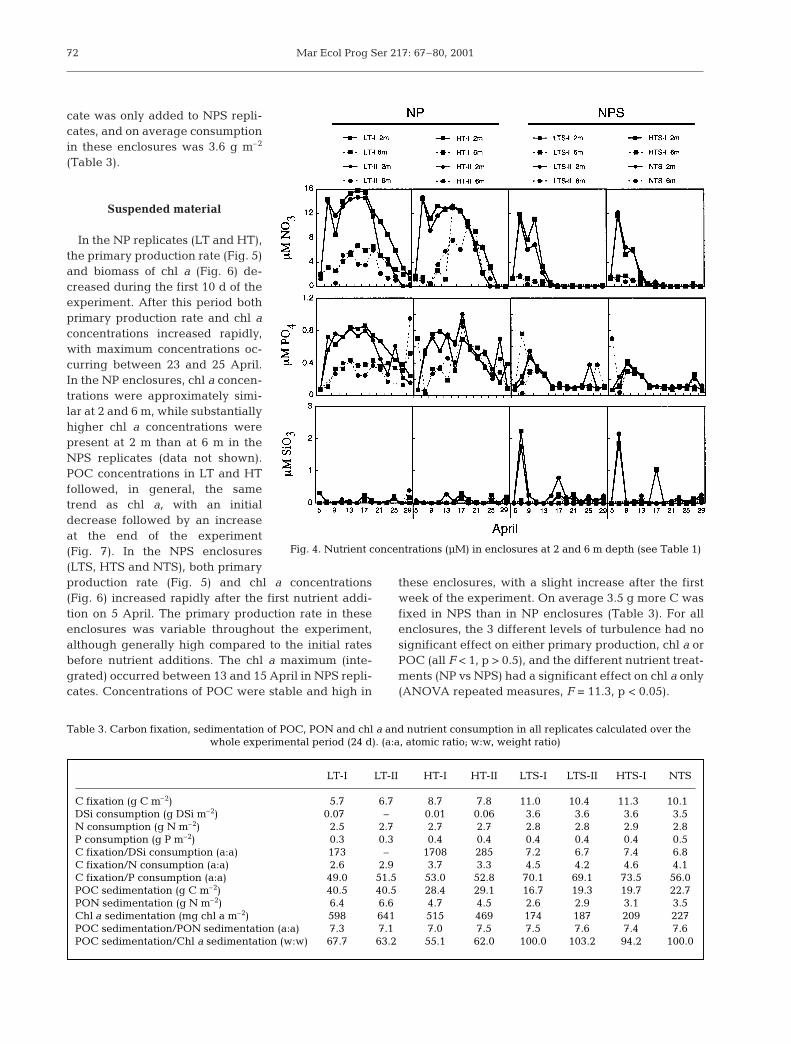
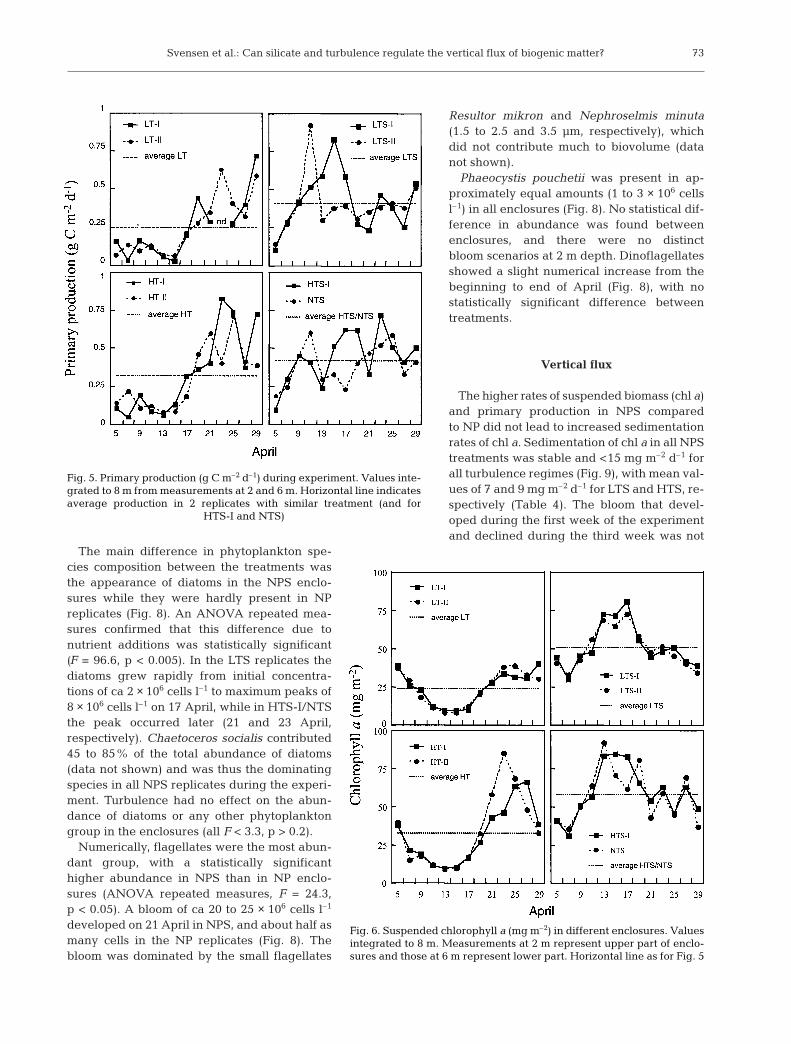
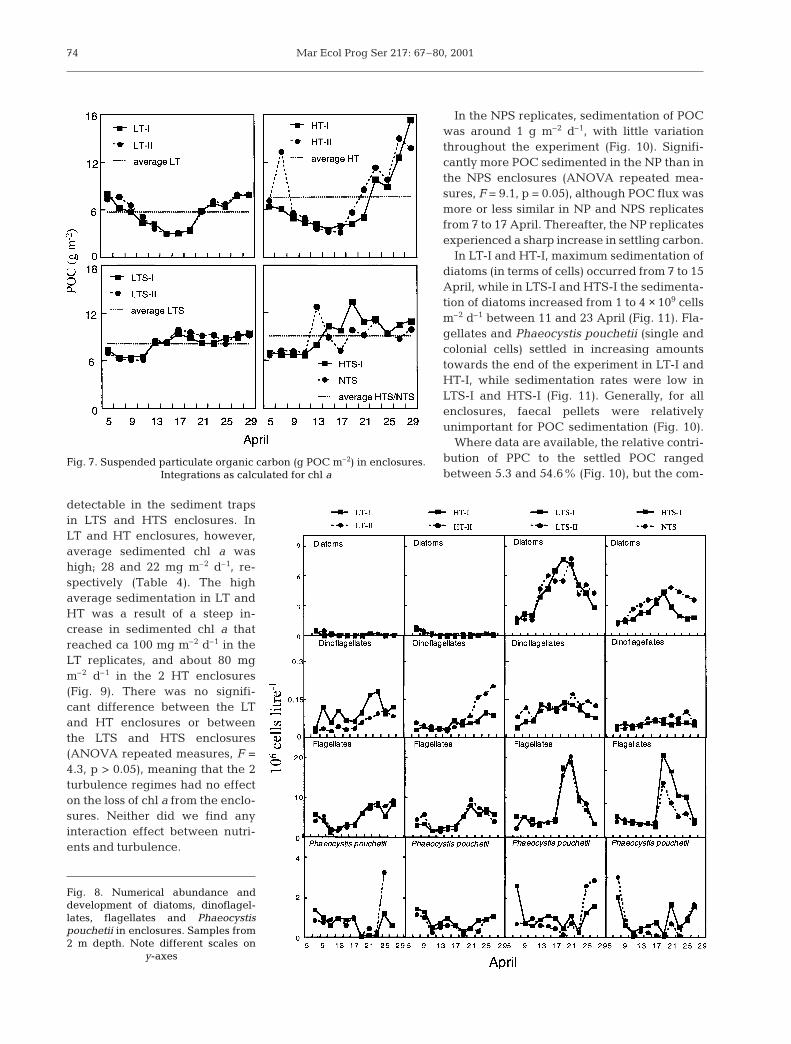
In the NP replicates (LT and HT),the primary production rate (Fig. 5)and biomass of chl a (Fig. 6) de-creased during the first 10 d of theexperiment. After this period bothprimary production rate and chl aconcentrations increased rapidly,with maximum concentrations oc-curring between 23 and 25 April.In the NP enclosures, chl a concen-trations were approximately simi-lar at 2 and 6 m, while substantiallyhigher chl a concentrations werepresent at 2 m than at 6 m in theNPS replicates (data not shown).POC concentrations in LT and HTfollowed, in general, the sametrend as chl a, with an initialdecrease followed by an increaseat the end of the experiment(Fig. 7). In the NPS enclosures(LTS, HTS and NTS), both primaryproduction rate (Fig. 5) and chl a concentrations(Fig. 6) increased rapidly after the first nutrient addi-tion on 5 April. The primary production rate in theseenclosures was variable throughout the experiment,although generally high compared to the initial ratesbefore nutrient additions. The chl a maximum (inte-grated) occurred between 13 and 15 April in NPS repli-cates. Concentrations of POC were stable and high in
these enclosures, with a slight increase after the firstweek of the experiment. On average 3.5 g more C wasfixed in NPS than in NP enclosures (Table 3). For allenclosures, the 3 different levels of turbulence had nosignificant effect on either primary production, chl a orPOC (all F < 1, p > 0.5), and the different nutrient treat-ments (NP vs NPS) had a significant effect on chl a only(ANOVA repeated measures, F = 11.3, p < 0.05).
72
LT-I LT-II HT-I HT-II LTS-I LTS-II HTS-I NTS
C fixation (g C m–2) 5.7 6.7 8.7 7.8 11.00 10.40 11.30 10.10DSi consumption (g DSi m–2) 0.070 – 0.01 0.06 3.6 3.6 3.6 3.5N consumption (g N m–2) 2.5 2.7 2.7 2.7 2.8 2.8 2.9 2.8P consumption (g P m–2) 0.3 0.3 0.4 0.4 0.4 0.4 0.4 0.5C fixation/DSi consumption (a:a) 173 – 1708 285 7.2 6.7 7.4 6.8C fixation/N consumption (a:a) 2.6 2.9 3.7 3.3 4.5 4.2 4.6 4.1C fixation/P consumption (a:a) 49.0 51.5 53.0 52.8 70.1 69.1 73.5 56.0POC sedimentation (g C m–2) 40.5 40.5 28.4 29.1 16.7 19.3 19.7 22.7PON sedimentation (g N m–2) 6.4 6.6 4.7 4.5 2.6 2.9 3.1 3.5Chl a sedimentation (mg chl a m–2) 598 641 515 469 174 187 209 227POC sedimentation/PON sedimentation (a:a) 7.3 7.1 7.0 7.5 7.5 7.6 7.4 7.6POC sedimentation/Chl a sedimentation (w:w) 67.7 63.2 55.1 62.0 100.0 103.2 94.2 100.0
Table 3. Carbon fixation, sedimentation of POC, PON and chl a and nutrient consumption in all replicates calculated over the whole experimental period (24 d). (a:a, atomic ratio; w:w, weight ratio)
Fig. 4. Nutrient concentrations (µM) in enclosures at 2 and 6 m depth (see Table 1)
Svensen et al.: Can silicate and turbulence regulate the vertical flux of biogenic matter?
The main difference in phytoplankton spe-cies composition between the treatments wasthe appearance of diatoms in the NPS enclo-sures while they were hardly present in NPreplicates (Fig. 8). An ANOVA repeated mea-sures confirmed that this difference due tonutrient additions was statistically significant(F = 96.6, p < 0.005). In the LTS replicates thediatoms grew rapidly from initial concentra-tions of ca 2 × 10⁶ cells l–1 to maximum peaks of8 × 106 cells l–1 on 17 April, while in HTS-I/NTSthe peak occurred later (21 and 23 April,respectively). Chaetoceros socialis contributed45 to 85% of the total abundance of diatoms(data not shown) and was thus the dominatingspecies in all NPS replicates during the experi-ment. Turbulence had no effect on the abun-dance of diatoms or any other phytoplanktongroup in the enclosures (all F < 3.3, p > 0.2).
Numerically, flagellates were the most abun-dant group, with a statistically significanthigher abundance in NPS than in NP enclo-sures (ANOVA repeated measures, F = 24.3,p < 0.05). A bloom of ca 20 to 25 × 106 cells l–1
developed on 21 April in NPS, and about half asmany cells in the NP replicates (Fig. 8). Thebloom was dominated by the small flagellates
Resultor mikron and Nephroselmis minuta(1.5 to 2.5 and 3.5 µm, respectively), whichdid not contribute much to biovolume (datanot shown).
Phaeocystis pouchetii was present in ap-proximately equal amounts (1 to 3 × 10⁶ cellsl–1) in all enclosures (Fig. 8). No statistical dif-ference in abundance was found betweenenclosures, and there were no distinctbloom scenarios at 2 m depth. Dinoflagellatesshowed a slight numerical increase from thebeginning to end of April (Fig. 8), with nostatistically significant difference betweentreatments.
Vertical flux
The higher rates of suspended biomass (chl a)and primary production in NPS comparedto NP did not lead to increased sedimentationrates of chl a. Sedimentation of chl a in all NPStreatments was stable and <15 mg m–2 d–1 forall turbulence regimes (Fig. 9), with mean val-ues of 7 and 9 mg m–2 d–1 for LTS and HTS, re-spectively (Table 4). The bloom that devel-oped during the first week of the experimentand declined during the third week was not
73
Fig. 6. Suspended chlorophyll a (mg m–2) in different enclosures. Valuesintegrated to 8 m. Measurements at 2 m represent upper part of enclo-sures and those at 6 m represent lower part. Horizontal line as for Fig. 5
Fig. 5. Primary production (g C m–2 d–1) during experiment. Values inte-grated to 8 m from measurements at 2 and 6 m. Horizontal line indicatesaverage production in 2 replicates with similar treatment (and for
HTS-I and NTS)
Mar Ecol Prog Ser 217: 67–80, 2001
detectable in the sediment trapsin LTS and HTS enclosures. InLT and HT enclosures, however,average sedimented chl a washigh; 28 and 22 mg m–2 d–1, re-spectively (Table 4). The highaverage sedimentation in LT andHT was a result of a steep in-crease in sedimented chl a thatreached ca 100 mg m–2 d–1 in theLT replicates, and about 80 mgm–2 d–1 in the 2 HT enclosures(Fig. 9). There was no signifi-cant difference between the LTand HT enclosures or betweenthe LTS and HTS enclosures(ANOVA repeated measures, F =4.3, p > 0.05), meaning that the 2turbulence regimes had no effecton the loss of chl a from the enclo-sures. Neither did we find anyinteraction effect between nutri-ents and turbulence.
In the NPS replicates, sedimentation of POCwas around 1 g m–2 d–1, with little variationthroughout the experiment (Fig. 10). Signifi-cantly more POC sedimented in the NP than inthe NPS enclosures (ANOVA repeated mea-sures, F = 9.1, p = 0.05), although POC flux wasmore or less similar in NP and NPS replicatesfrom 7 to 17 April. Thereafter, the NP replicatesexperienced a sharp increase in settling carbon.
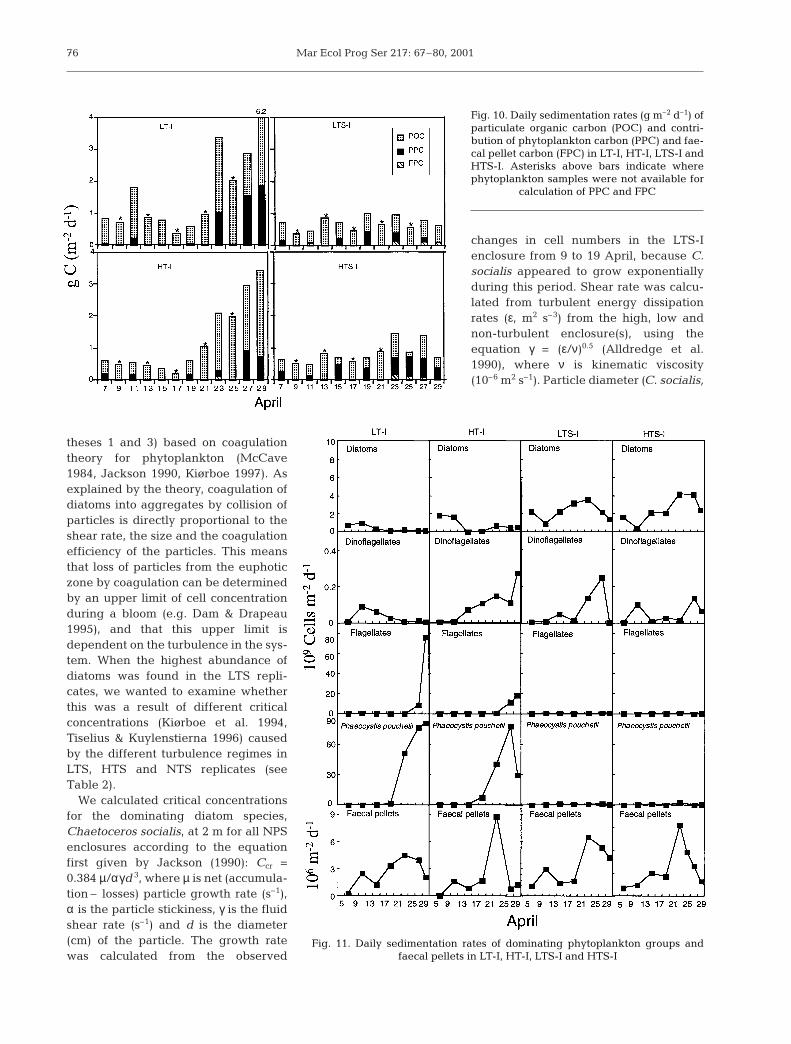
In LT-I and HT-I, maximum sedimentation ofdiatoms (in terms of cells) occurred from 7 to 15April, while in LTS-I and HTS-I the sedimenta-tion of diatoms increased from 1 to 4 × 10⁹ cellsm–2 d–1 between 11 and 23 April (Fig. 11). Fla-gellates and Phaeocystis pouchetii (single andcolonial cells) settled in increasing amountstowards the end of the experiment in LT-I andHT-I, while sedimentation rates were low inLTS-I and HTS-I (Fig. 11). Generally, for allenclosures, faecal pellets were relativelyunimportant for POC sedimentation (Fig. 10).
Where data are available, the relative contri-bution of PPC to the settled POC rangedbetween 5.3 and 54.6% (Fig. 10), but the com-
74
Fig. 8. Numerical abundance anddevelopment of diatoms, dinoflagel-lates, flagellates and Phaeocystispouchetii in enclosures. Samples from2 m depth. Note different scales on
y-axes
Fig. 7. Suspended particulate organic carbon (g POC m–2) in enclosures. Integrations as calculated for chl a

Svensen et al.: Can silicate and turbulence regulate the vertical flux of biogenic matter?
position of PPC itself was highly variable between thetreatments. On average, diatoms contributed 86 and89% of total PPC in LTS-I and HTS-I, respectively(Fig. 12). In LT-I and HT-I, however, the composition ofPPC was much more variable, and can be divided intothe same 2 periods as sedimented POC. During thefirst period (7 to 15 April), the composition of sedi-mented PPC was characterised by a gradual decreaseof diatoms and dinoflagellates. During the secondperiod (19 to 29 April), Phaeocystis sp. cell carbon con-tributed 80% both in LT-I and HT-I.
DISCUSSION
To the best of our knowledge, the present mesocosmexperiment is the first to combine turbulence and mea-surements of vertical flux of biogenic matter. We suc-ceeded in creating a more stagnant layer below theupper part of the enclosures where turbulence wasgenerated (Table 2), thus making sedimentation mea-surements possible. The dissipation rates generatedcorrespond well to measurements in other mesocosmexperiments with turbulence generation (Petersen etal. 1998), and lie within typical turbulent intensitiesO (10–9 W kg–1) found in the upper mixed layer in thesea (Oakey & Elliott 1980). However, the dissipationrates between the high and low turbulence replicatesdiffered less than intended, due to the high ‘back-ground’ turbulence. An experiment running parallelto ours, using only airlift to mix a 6 m deep enclosure,had an average energy dissipation rate of 8.3 × 10⁻⁸ Wkg–1 (S. Nerheim pers. comm.). It appears problematicto carry out experiments in enclosures with flexiblewalls in the ocean with turbulence intensities lowerthan O (10–9 W kg–1), and other mesocosm experimentswith similar flexible wall enclosures should take thisinto account when analysing the data. It should also bementioned that flexible wall enclosures may causefocusing of material into the sediment traps (Wass-mann et al. 1996). Therefore, differences betweenenclosures and responses to treatments are of moreinterest than absolute sedimentation rates in thisexperiment.
Effect of silicate and turbulence ondiatoms
The present study shows that DSiaddition created a substantial shift inthe flagellate-dominated phytoplank-ton community to a diatom-dominatedone. Buoyancy regulation in diatomsis very sensitive to Si-deprivation(Bienfang et al. 1982), and in the NPreplicates the diatoms sank outrapidly, probably as a result of Sidepletion. In NPS, the diatoms didshow a sinking potential by makingup 80 to 100% of sedimented PPC inthe NPS replicates (Fig. 12), althoughin terms of carbon the sedimentationrates were surprisingly much higherin NP than in NPS.
We expected high sedimentation ofdiatoms in the highly turbulent,diatom-dominated enclosures (hypo-
75
LT-I LTS-I HT-I HTS-ILT-II LTS-II HT-II NTS
Dominating photo- Flagellates Diatoms/ Flagellates Diatoms/plankton group Flagellates Flagellates
Chl aIntegrated (mg m–2) 24 ± 11 51 ± 14 33 ± 22 58 ± 17Sedimented (mg m–2 d–1) 28 ± 32 7 ± 2 22 ± 25 9 ± 3Max. sed. (mg m–2 d–1) 107.7 14.6 75.4 13.3
POCIntegrated (g m–2) 5.7 ± 1.8 8.2 ± 1.2 7.5 ± 4.1 9.1 ± 1.9Sedimented (g m–2 d–1) 1.8 ± 1.6 0.7 ± 0.3 1.2 ± 1.0 0.9 ± 0.3
PONIntegrated (g m–2) 0.9 ± 0.2 1.3 ± 0.2 1.1 ± 0.5 1.4 ± 0.3Sedimented (g m–2 d–1) 0.3 ± 0.2 0.1 ± 0.04 0.2 ± 0.2 0.1 ± 0.04
Table 4. Suspended and sedimented chlorophyll a (chl a), particulate organiccarbon (POC) and particulate organic nitrogen (PON). All values are averages(±SD) of 2 replicates, except for maximum sedimentation (max. sed.) which isthe highest sedimentation rate found in 1 replicate. Dominating photoplanktongroups were determined according to cells per litre in upper part of enclosures
Fig. 9. Daily sedimentation rates of chl a (mg m–2 d–1) in the enclosures
Mar Ecol Prog Ser 217: 67–80, 2001
theses 1 and 3) based on coagulationtheory for phytoplankton (McCave1984, Jackson 1990, Kiørboe 1997). Asexplained by the theory, coagulation ofdiatoms into aggregates by collision ofparticles is directly proportional to theshear rate, the size and the coagulationefficiency of the particles. This meansthat loss of particles from the euphoticzone by coagulation can be determinedby an upper limit of cell concentrationduring a bloom (e.g. Dam & Drapeau1995), and that this upper limit isdependent on the turbulence in the sys-tem. When the highest abundance ofdiatoms was found in the LTS repli-cates, we wanted to examine whetherthis was a result of different criticalconcentrations (Kiørboe et al. 1994,Tiselius & Kuylenstierna 1996) causedby the different turbulence regimes inLTS, HTS and NTS replicates (seeTable 2).
We calculated critical concentrationsfor the dominating diatom species,Chaetoceros socialis, at 2 m for all NPSenclosures according to the equationfirst given by Jackson (1990): Ccr =0.384 µ/αγd 3, where µ is net (accumula-tion – losses) particle growth rate (s–1),α is the particle stickiness, γ is the fluidshear rate (s–1) and d is the diameter(cm) of the particle. The growth ratewas calculated from the observed
changes in cell numbers in the LTS-Ienclosure from 9 to 19 April, because C.socialis appeared to grow exponentiallyduring this period. Shear rate was calcu-lated from turbulent energy dissipationrates (ε, m2 s–3) from the high, low andnon-turbulent enclosure(s), using theequation γ = (ε/ν)0.5 (Alldredge et al.1990), where ν is kinematic viscosity(10–6 m2 s–1). Particle diameter (C. socialis,
76
Fig. 10. Daily sedimentation rates (g m–2 d–1) ofparticulate organic carbon (POC) and contri-bution of phytoplankton carbon (PPC) and fae-cal pellet carbon (FPC) in LT-I, HT-I, LTS-I andHTS-I. Asterisks above bars indicate wherephytoplankton samples were not available for
calculation of PPC and FPC
Fig. 11. Daily sedimentation rates of dominating phytoplankton groups and faecal pellets in LT-I, HT-I, LTS-I and HTS-I

Svensen et al.: Can silicate and turbulence regulate the vertical flux of biogenic matter?
single cell) was estimated from particle volume,assuming spherical shape.
The calculated Ccr for Chaetoceros socialis showedthat this species never reached concentrations highenough to form aggregates in LTS-I, LTS-II and HTS-I(Table 5). A number of crude approximations weremade in the calculations, as for instance assuming astickiness of 0.15, although α may be species depen-dent and also variable in time (Dam & Drapeau 1995).Nevertheless, the result gives an indication that thebloom of C. socialis was probably not ended exclu-sively by aggregate formation followed by sedimenta-tion. Because this species dominated the developmentof the diatoms as a group, this conclusion is most likelyalso the case for the other diatoms in the experiment.However, it has been reported that fragile aggregatesof diatoms need energy dissipation rates of 10–7 to
>10–4 W kg–1 to disaggregate (Alldredgeet al. 1990). The highest energy dissipationrates measured in this experiment lie at thelower end of the reported range, and henceit is difficult to quantify the impact onaggregate break-up. However, since thedissipation rates reported here are averagevalues, it is possible to speculate that somedisaggregation could have occurred in theupper layer of all enclosures, for instanceon windy days. On the other hand, the tur-bulence generated in our enclosures wasprobably not strong enough to break apartany aggregates of detrital debris or aggre-gates of living bacteria, as they have beenreported to resist dissipation rates >> 10–4 Wkg–1 (Alldredge et al. 1990). The rather nar-row range of dissipation rates in all enclo-sures (Table 2) could also be the reasonwhy no statistically significant difference indiatom sedimentation was found betweenthe different turbulence regimes.
As the sedimentation rates of diatoms ingeneral were low and constant, the declineof the bloom around 17 April was probablycaused by grazing. The microzooplankton
community (mainly composed of dinoflagellates andciliates >30 µm equivalent spherical diameter, ESD)showed high grazing rates on phytoplankton (Nejst-gaard et al. unpubl. data). Both dinoflagellates(Hansen et al. 1994) and large ciliates (J. Nejstgaardpers. comm.) may feed on chains of diatoms, andspecific grazing experiments from one of the enclo-sures (LTS-I) demonstrated that the microzooplanktongrazed diatoms corresponding to 24–42% of the stand-ing stock per day (Nejstgaard et al. unpubl. data). Inthis experiment, total concentrations of zooplankton>90 µm increased from initial concentrations of about10 mg C m–3 to between 30 and 100 mg C m–3 in NPreplicates and between 40 and 60 mg C m–3 in NPSreplicates (Nejstgaard pers comm.). In all enclosuresCalanus finmarchicus was the dominating copepod,and fed selectively on the microzooplankton. It istherefore likely that the phytoplankton stock could beregulated indirectly by mesozooplankton predationthrough a trophic cascade effect as previously shownin 25-l bottle experiments (Nejstgaard et al. 1997). Asthe average concentration of mesozooplankton washigher in NP than in NPS, it is likely that phytoplank-ton were more heavily grazed by microzooplankton inNPS enclosures.
To summarise, the addition of DSi did favour thegrowth of diatoms as hypothesised, but did notincrease the vertical flux of biogenic matter. The dif-ferent levels of turbulence did not cause variation in
77
Fig. 12. Relative contribution (%) of sed-imentation rates of different phytoplank-ton groups and Phaeocystis pouchetiito phytoplankton carbon (PPC) in LT-I,
HT-I, LTS-I and HTS-I
Shear Growth Diameter Ccr Cmax
(s–1) rate (d–1) (µm) (106 cells l–1)
LTS-I 0.23 0.21 5.8 136 7LTS-II 0.23 0.21 5.8 136 6HTS-I 0.43 0.21 5.8 73 4NTS 0.17 0.21 5.8 191 4
Table 5. Calculated critical concentrations (Ccr) of Chaeto-ceros socialis and observed maximum concentrations (Cmax) in
the 4 silicate enriched enclosures

Mar Ecol Prog Ser 217: 67–80, 2001
vertical flux of diatoms, probably because the diatomsnever reached concentrations high enough to createrapidly sinking aggregates. It may seem that theeffects of turbulence are coupled to processes otherthan coagulation of diatom cells in this experiment.
Contribution of Phaeocystis pouchetii
The sedimentation rate of Phaeocystis pouchetii cellsin LT-I and HT-I (between 80 and 90 × 109 cells m–2 d–1)is, to our knowledge, among the highest reported forPhaeocystis sp., only exceeded by a previous meso-cosm experiment at the same locality with sedimenta-tion rates up to 400 × 109 cells m–2 d–1 (Christensen1998). None of our enclosures indicated increasedabundance or higher sedimentation rates of P. pou-chetii caused by elevated energy dissipation rates.However, other mesocosm studies have demonstratedthat Phaeocystis sp. obtained higher biomass in meso-cosms with a high mixing rate (Escaravage et al. 1998,Jacobsen 2000). The lack of difference in P. pouchetiibiomass among the treatments (both nutrients andturbulence) in our experiment could be a result ofpoor resolution in phytoplankton sampling (1 sampleat 2 m). The high sedimentation rates in the NP repli-cates and high chl a concentrations at 6 m (not found inNPS replicates) indicate a high biomass of P. pouchetiiin the deeper part of the enclosures, i.e. below themixed layer. Temperatures <10°C, incident irradiance<20 mol m–2 d–1 and N and P present in respective con-centrations of >5 and >0.2 µM are reported to be opti-mal conditions for colonial growth (Jacobsen 2000).These requirements were met at 6 m depth in the NPenclosures. Growth below 2 m depth is probably alsothe reason why calculated loss rates from the upperlayer are unrealistically high (and therefore highlyquestionable). A better spatial resolution of phyto-plankton sampling should therefore be considered infuture mesocosm studies.
Mass sedimentation of Phaeocystis sp. is not only amesocosm phenomenon, but has also been reportedin situ (Wassmann et al. 1990, Wassmann 1994, M.Reigstad et al. pers. comm.). Common to these studiesis the fact that Phaeocystis cells sank in relatively largenumbers (up to 7 × 10⁹ cells m–2 d–1 at 40 m in the Bar-ents Sea) in sediment traps in shallow water, while itscontribution rapidly declined with depth (Lutter et al.1989, Wassmann 1994). In a northern Norwegian fjord,<15% of the Phaeocystis found at 10 m was found tosink to 50 m depth or deeper (Lutter et al. 1989). Fre-quently suggested explanations for the disappearanceof Phaeocystis cells and colonies at greater depths arecell lysis and rapid remineralisation, so that Phaeocys-tis enters the microbial loop instead of the more classi-
cal food chain (Fernandez et al. 1992). Growth of P.pouchetii in the traps does not explain the increasedsedimentation rates observed towards the end of theexperiment. Neither does it explain differences insedimentation rates between NP and NPS enclosures.
It has recently been documented that ageing andpartly dissolved colonies of Phaeocystis produce trans-parent exopolymer particles (TEP, see Alldredge et al.1993, Passow 2000), attract bacteria and flagellatesand form dense aggregates scavenging the water col-umn (M. Reigstad et al. pers. comm.). TEP productionhas thus been suggested to be an important pathwayfor P. pouchetii carbon to reach deep waters (Reigstadet al. unpubl. data). Verity et al. (1988) also suggestedthat the gelatinous matrix of the colonies may be agood substrate for bacterial metabolism, and foundthat bacteria concentrations were elevated on ‘ghostcolonies’. This may provide attractive feeding groundsfor heterotrophic flagellates (Reigstad et al. submit-ted). When the flagellate abundance increases thedensity of particles, aggregate formation and probablyalso the sinking velocity increases (P. Wassmann, pers.comm.). This corresponds well with our data, as sedi-mentation rates of flagellates increased in concert withP. pouchetii in LT-I and HT-I (Fig. 11). Although TEPwas unfortunately not measured during this study, wesuggest that the mass-sedimentation observed in theNP enclosures at the end of the experiment was aresult of coagulation of senescent P. pouchetii coloniescombined with low degradation in the sediment traps.
Concluding remark
When the NP and NPS enclosures are comparedwith regard to DSi consumption, carbon fixation andcarbon export, it becomes evident that increased DSiconsumption does not necessarily increase the verticalexport of carbon (Table 3). Furthermore, by processesnot yet fully understood, Phaeocystis pouchetii maycontribute more than expected to the vertical flux, pos-sibly by involving turbulence-resistant aggregates.Thus, this study does not support the suggested posi-tive linear relationship between DSi consumption andcarbon export suggested by Wassmann et al. (1996). Itseems that for the time being, we do not have enoughknowledge about how DSi will affect the various path-ways in the food web.
Acknowledgements. The authors thank A. Sazhin and O.Sergeeva for phytoplankton analysis, S. Øygarden for C/Nanalysis, J. C. Nejstgaard for information on zooplankton andour co-workers on NAPP for stimulating co-operation. Thecriticism and comments of H. G. Dam, A.-S. Heiskanen, K.Olli, M. Reigstad and T. Tamminen are gratefully acknowl-edged. P. Wassmann contributed with valuable discussions,
78

Svensen et al.: Can silicate and turbulence regulate the vertical flux of biogenic matter?
comments and advice during various phases of this work. M.Mauritzen provided helpful advice with statistical analyses.This investigation was supported by the Norwegian ResearchCouncil (NFR) and is a contribution of the Norwegian Pro-gramme Nutrients and Pelagic Marine Production (NAPP).
LITERATURE CITED
Alldredge AL, Granata TC, Gotschalk CC, Dickey TD (1990)The physical strength of marine snow and its implicationsfor particle disaggregation in the ocean. Limnol Oceanogr35:1415–1428
Alldredge AL, Passow U, Logan BE (1993) The abundanceand significance of a class of large, transparent organicparticles in the ocean. Deep-Sea Res 40:1131–1140
Bienfang PK, Harrison PJ, Quarmby LM (1982) Sinking rateresponse to depletion of nitrate, phosphate and silicate infour marine diatoms. Mar Biol 67:295–302
Christensen G (1998) The effect of different nutrient regimeson phytoplankton community and vertical flux in a meso-cosm experiment. MSc thesis, University of Bergen (inNorwegian)
Dam HG, Drapeau DT (1995) Coagulation efficiency, organic-matter glues and the dynamics of particles during a phyto-plankton bloom in a mesocosm study. Deep-Sea Res II 42:111–123
Egge JK (1993) Nutrient control of phytoplankton growth:effects of macronutrient composition (N, P, Si) on speciessuccession. Dr Scient. thesis, University of Bergen
Egge JK, Aksnes DL (1992) Silicate as regulating nutrient inphytoplankton competition. Mar Ecol Prog Ser 83:281–289
Escaravage V, Prins TC, Wetsteyn LPMJ, Peeters JCH (eds)(1998) Effects of water column structure and nutrient load-ing on plankton development. The impact of marineeutrophication on phytoplankton, zooplankton and ben-thic suspension feeders. Progress report: effects of stratifi-cation on plankton dynamics. Rijksinstituut voor Kust enZee/RIKZ, Middelburg
Fernandez E, Serret P, de Madariaga I, Harbour DS, DaviesAG (1992) Photosynthetic carbon metabolism and bio-chemical composition of spring phytoplankton assem-blages enclosed in microcosms: the diatom-Phaeocystissp. succession. Mar Ecol Prog Ser 90:89–102
Gargas E (ed) (1975) A manual for phytoplankton primaryproduction studies in the Baltic, 2nd edn. Water QualityInstitute, Høsholm
Garrison DL, Buck KR (1989) Protozooplankton in the WeddelSea, Antarctica: abundance and distribution in the ice-edge zone. J Polar Biol 9:341–351
Hansen B, Bjørnsen PK, Hansen PJ (1994) The size ratio be-tween planktonic predators and their prey. LimnolOceanogr 39:395–403
Jackson G (1990) A model of the formation of marine algalflocs by physical coagulation processes. Deep-Sea Res 37:1197–1211
Jacobsen A (2000) New aspects of bloom dynamics of Phaeo-cystis pouchetii (Haptophyta) in Norwegian waters. DrScient. thesis, University of Bergen
Jacobsen A, Egge JK, Heimdal B (1995) Effects of increasedconcentration on nitrate and phosphate during a spring-bloom experiment in mesocosm. J Exp Mar Biol Ecol 187:239–251
Kiørboe T (1993) Turbulence, phytoplankton cell size, and thestructure of pelagic food webs. Adv Mar Biol 29:2–72
Kiørboe T (1997) Small-scale turbulence, marine snow forma-tion, and planktivorous feeding. Sci Mar 61:141–158
Kiørboe T, Lundsgaard C, Olesen M, Hansen JSL (1994) Ag-gregation and sedimentation processes during a springphytoplankton bloom: A field experiment to test coagula-tion theory. J Mar Res 52:297–323
Kraus NC, Lohrman A, Cabrera R (1994) New acoustic meterfor measuring 3D laboratory flows. J Hydraulic Eng 120:406–412
Lee C, Wakeham SG, Hedges JI (1988) The measurement ofoceanic particle flux — are ‘swimmers’ a problem? Ocean-ography 1:34–36
Lutter S, Taasen JP, Hopkins CCE, Smetacek V (1989) Phyto-plankton dynamics and sedimentation processes duringspring and summer in Balsfjord, northern Norway. PolarBiol 10:113–124
MacKenzie BR, Leggett WC (1993) Wind-based models forestimating the dissipation rates of turbulent energy inaquatic environments: empirical comparisons. Mar EcolProg Ser 94:207–216
Margalef R (1978) Life-forms of phytoplankton as survivalalternatives in an unstable environment. Oceanol Acta 1:493–509
Margalef R, Estrada M, Blasco D (1979) Functional morphol-ogy of organisms involved in red tides, as adapted todecaying turbulence. In: Taylor DL, Seliger HH (eds) Toxicdinoflagellate blooms. Elsevier, Amsterdam, p 89–94
McCave IN (1984) Size spectra and aggregation of suspendedparticles in the deep ocean. Deep-Sea Res 31:329–352
Nejstgaard JC, Gismervik I, Solberg PT (1997) Feeding andreproduction by Calanus fnimarchicus, and microzoo-plankton grazing during mesocosm blooms of diatoms andthe coccolithophore Emiliania huxleyi. Mar Ecol Prog Ser147:197–217
Nielsen TG, Kiørboe T (1991) Effects of a storm event on thestructure of the pelagic food web with special emphasis onplanktonic ciliates. J Plankton Res 13:35–51
Oakey NS, Elliott JA (1980) Dissipation in the mixed layernear Emerald Basin. In: Nihoul JCJ (ed) Marine turbu-lence. Elsevier, Amsterdam, p 123–133
Officer CB, Ryther JH (1980) The possible importance of sili-con in marine eutrophication. Mar Ecol Prog Ser 3:83–91
Parsons TR, Maita Y, Lalli CM (1984) A manual of chemicaland biological methods for seawater analysis. PergamonPress, Oxford
Passow U (2000) Formation of transparent exopolymer parti-cles, TEP, from dissolved precursor material. Mar EcolProg Ser 192:1–11
Passow U, Alldredge AL, Logan BE (1994) The role of partic-ulate carbohydrate exudates in the flocculation of diatomblooms. Deep-Sea Res 41:335–357
Peinert R, von Bodungen B, Smetacek VS (1989) Food webstructure and loss rate. In: Berger WH, Smetacek VS,Wefer G (eds) Productivity of the ocean: present and past.John Wiley & Sons, London, p 35–48
Petersen JE, Sanford LP, Kemp WM (1998) Coastal planktonresponses to turbulent mixing in experimental ecosys-tems. Mar Ecol Prog Ser 171:23–41
Ratkova TN, Wassmann P, Verity PG, Andreassen IJ (1999)Abundance and biomass of pico-, nano- and microplank-ton along a transect on Nordvestbanken, north Norwegianshelf, in 1994. Sarsia 84:213–225
Riebesell U, Reigstad M, Wassmann P, Noji T, Passow U(1995) On the trophic fate of Phaeocystis pouchetii(Hariot). VI. Significance of Phaeocystis-derived mucus forvertical flux. Neth J Sea Res 33:193–203
Rousseau V, Mathot S, Lancelot C (1990) Calculating carbonbiomass of Phaeocystis sp. from microscopic observations.Mar Biol 107:305–314
79
Mar Ecol Prog Ser 217: 67–80, 2001
Ruiz J (1996) The role of turbulence in the sedimentation lossof pelagic aggregates from the mixed layer. J Mar Res 54:385–406
Ryther JH, Officer CB (1981) Impact of nutrient enrichment onwater uses. In: Crowin NA (ed) Estuaries and nutrients.Humana Press, Totowa, NJ, p 247–261
Smayda TJ (1978) From phytoplankters to biovolume. In:Sournia A (ed) Phytoplankton manual. UNESCO Publica-tions, Paris, p 273–279
Smetacek V, von Bodungen B, Knoppers B, Peinert R,Pollehne F, Stegmann P, Zeitzschel B (1984) Seasonalstages characterizing the annual cycle of an inshorepelagic system. Rapp PV Reun Cons Int Explor Mer 183:126–135
Sommer U (1996) Marine food webs under eutrophic condi-tions: desirable and undesirable forms of nutrient richness.Dtsch Hydrogr Z (Suppl) 6:167–176
Sournia A (1978) Phytoplankton manual. UNESCO, ParisSteemann Nielsen E (1952) The use of radioactive (14C) for
measuring organic production in the sea. J Cons Int ExplorMer 18:117–140
Stiansen JE, Sundby S (2001) Improved methods for generat-ing and estimating turbulence in tanks suitable for fish lar-vae experiments. Sci Mar (in press)
Strathmann RR (1967) Estimating the organic carbon content
of phytoplankton from cell volume or plasma volume. Lim-nol Oceanogr 12:411–418
Tiselius P, Kuylenstierna M (1996) Growth and decline of adiatom spring bloom: phytoplankton species composition,formation of marine snow and the role of heterotrophicdinoflagellates. J Plankton Res 18:133–155
Utermöhl H (1931) Neue Wege in der quantitativen Erfassungdes Planktons (mit besonderer Berücksichtigung desUltraplanktons). Verh Int Ver Theor Angew Limnol 5:567–596
Verity PG, Villareal TA, Smayda TJ (1988) Ecological investi-gations of blooms of colonial Phaeocystis pouchetii. II. Therole of the life-cycle phenomena in bloom termination.J Plankton Res 10:749–766
Wassmann P (1994) Significance of sedimentaion for the ter-mination of Phaeocystis blooms. J Mar Syst 5:81–100
Wassmann P, Vernet M, Mitchell BG, Rey F (1990) Mass sed-imentation of Phaeocystis pouchetii in the Barents Sea.Mar Ecol Prog Ser 66:183–195
Wassmann P, Egge JK, Reigstad M, Aksnes DL (1996) Influ-ence of dissolved silicate on vertical flux of particulatebiogenic matter. Mar Pollut Bull 33:1–6
Welschmeyer NA (1994) Fluorometric analysis of chlorophylla in the presence of chlorophyll b and phaeopigments.Limnol Oceanogr 39:1985–1992
80
Editorial responsibility: Otto Kinne (Editor),Oldendorf/Luhe, Germany
Submitted: April 10, 2000; Accepted: November 23, 2000Proofs received from author(s): July 8, 2001