can mutual fund managers pick stocks? - nyu stern school of
TRANSCRIPT

JOURNAL OF FINANCIAL AND QUANTITATIVE ANALYSIS Vol. 45, No. 5, Oct. 2010, pp. 1111–1131COPYRIGHT 2010, MICHAEL G. FOSTER SCHOOL OF BUSINESS, UNIVERSITY OF WASHINGTON, SEATTLE, WA 98195doi:10.1017/S0022109010000426
Can Mutual Fund Managers Pick Stocks?Evidence from Their Trades Prior toEarnings Announcements
Malcolm Baker, Lubomir Litov, Jessica A. Wachter, andJeffrey Wurgler∗
Abstract
Recent research finds that the stocks that mutual fund managers buy outperform the stocksthat they sell (e.g., Chen, Jegadeesh, and Wermers (2000)). We study the nature of thisstock-picking ability. We construct measures of trading skill based on how the stocks heldand traded by fund managers perform at subsequent corporate earnings announcements.This approach increases the power to detect skilled trading and sheds light on its source.We find that the average fund’s recent buys significantly outperform its recent sells aroundthe next earnings announcement, and that this accounts for a disproportionate fraction ofthe total abnormal returns to fund trades estimated in prior work. We find that mutual fundtrades also forecast earnings surprises. We conclude that mutual fund managers are able totrade profitably in part because they are able to forecast earnings-related fundamentals.
I. Introduction
Can mutual fund managers pick stocks? This question has long interestedfinancial economists due to its practical implications for investors and for the lightit sheds on market efficiency. Two broad conclusions from the literature standout. Many studies since Jensen (1968) find that the average returns of mutualfund portfolios tend to underperform passive benchmarks, especially net of fees.
∗Baker, [email protected], Harvard Business School, Soldiers Field, Boston, MA 02163, andNBER; Litov, [email protected], Washington University in St. Louis, Olin Business School, CampusBox 1133, St. Louis, MO 63130; Wachter, [email protected], University of Pennsylvania,Wharton School, 3620 Locust Walk, Ste. SH-DH 2300, Philadelphia, PA 19104, and NBER; Wurgler,[email protected], New York University, Stern School of Business, 44 W. 4th St., Ste. 9-190,New York, NY 10012, and NBER. We thank Stephen Brown (the editor), Susan Christoffersen, MarcinKacperczyk, Andrew Metrick, Lasse Pedersen, Robert Stambaugh, Russell Wermers (the referee), LuZheng, and seminar participants at New York University, Yale University, the 2005 European FinanceAssociation Meeting, the 2005 University of Colorado Investment Conference, and the 2005 WesternFinance Association Meeting for helpful comments. We thank Christopher Blake, Russell Wermers,and Jin Xu for assistance with data. Baker gratefully acknowledges the Division of Research of theHarvard Business School for financial support, and all authors thank the Glucksman Institute at NYUStern School of Business.
1111

1112 Journal of Financial and Quantitative Analysis
At the same time, in recent results that are far more encouraging for active fundmanagers, Chen, Jegadeesh, and Wermers (2000) find that the individual tradesmade by mutual fund managers illustrate some stock-picking skill. In particular,the stocks that funds buy have higher returns than those that they sell over the nextfew quarters.1
Some of the gap between these 2 results simply reflects transaction costs andmanagement fees. Nonetheless, given the evidence of skilled trading by mutualfund managers, it is natural to turn to the question of how they manage to distin-guish winners from losers in their trades. We address this question. We build onthe findings of Chen et al. (2000) and other studies of the performance of mutualfund trades, such as Grinblatt and Titman (1989) and Wermers (1999), by con-structing an alternative method of identifying trading skill. We associate tradingskill with the ability to buy stocks that are about to enjoy high returns upon theirupcoming quarterly earnings announcement and to sell stocks that are about tosuffer low returns upon that announcement.
This approach is complementary to traditional tests using long-horizon re-turns, but it has some advantages. First, it may have more power to detecttrading skill, as it exploits segments of the returns data—returns at earningsannouncements—that contain the most concentrated information about a firm’searnings prospects. Second, taking as a given the results of Chen et al. (2000) andothers about the abnormal performance of trades over long horizons, the approachhelps identify the source of such abnormal returns—whether they are due to anability to forecast fundamental news released around earnings announcements or,say, proprietary technical signals. Of course, by definition, these benefits come atthe cost of not trying to measure the total returns to trading skill, so the approachis best seen as a complement to traditional tests.
The main data set merges a comprehensive sample of mutual fund portfolioholdings with the respective returns that each holding realized at its next quarterlyearnings announcement. The holdings are drawn from mandatory, periodic SECfilings tabulated by Thomson Financial. For each fund-date-stock holding obser-vation in these data, we merge in the stock return over the 3-day window aroundthe next earnings announcement. The sample of several million fund-report date-holding observations covers 1980 through 2005.
We begin the analysis by tabulating the earnings announcement returns re-alized by fund holdings, but as mentioned above, our main results involve fundtrades. Studying trades allows us to difference away unobserved risk premiumsby comparing the subsequent performance of stocks that funds buy with thosethey sell, thus reducing Fama’s (1970) joint hypothesis problem. Further, trading
1Obviously, the literature on mutual fund performance is vast and cannot be summarized here.An abbreviated set of other important studies includes: Ippolito (1989) and Carhart (1997), who con-clude that mutual fund managers have little or no stock-picking skill; Grinblatt and Titman (1993),Daniel, Grinblatt, Titman, and Wermers (1997), and Wermers (2000), who conclude that a significantdegree of skill exists; and Lehman and Modest (1987) and Ferson and Schadt (1996), who empha-size the sensitivity of results to methodological choices. More recently, Cohen, Coval, and Pastor(2005), Kacperczyk and Seru (2007), and Kacperczyk, Sialm, and Zheng (2008) have developedother measures of skill based on holdings, returns that are not observable from Securities andExchange Commission (SEC) filings, and the correlation between trades and changes in analystrecommendations.

Baker, Litov, Wachter, and Wurgler 1113
incurs costs and perhaps the realization of capital gains, so it is likelier to be drivenby new information than an ongoing holding is. One of our main findings is thatthe average mutual fund displays stock-picking skill in that the subsequent earn-ings announcement returns on its weight-increasing stocks are significantly higherthan those on its weight-decreasing stocks. The difference is about 10 basis points(bp) over the 3-day window around the quarterly announcement, or, multiplyingby 4, about 38 annualized bp. We also benchmark a stock’s announcement returnsagainst those earned by stocks with similar characteristics in that calendar quarter.The results are not much diminished, with the advantage of buys relative to sellsfalling to 9 bp and 34 bp, respectively. This gap reflects skill in both buying andselling: Stocks bought by the average fund earn significantly higher subsequentannouncement returns than matching stocks, while stocks sold earn lower returnsthan matching stocks.
There are interesting differences in performance across funds and acrosstime. Fund performance measured using earnings announcement returns tends topersist over time, and funds that do well are more likely to have a growth-orientedstyle. These patterns tend to match those from long-horizon studies of fund per-formance, supporting the view that they reflect information-based trading. Wealso consider the impact of SEC Regulation Fair Disclosure, which since October2000 has banned the selective disclosure of corporate information to a preferredset of investors. After the issuance of this regulation, funds have been less suc-cessful in terms of the earnings announcement returns of their trades, althoughthe performance of their holdings shows no clear trend.
These results support and extend the evidence of Chen et al. (2000) and oth-ers that fund trades are made with an element of skill. In addition, they stronglysuggest that trading skill derives in part from skill at forecasting earnings fun-damentals. To confirm this link, we test whether trades by mutual funds forecastquarterly earnings per share (EPS) surprises of the underlying stocks. They do. In22 of the 22 years in our sample of EPS surprise data, the EPS surprise of stocksthat funds are buying exceeds the EPS surprise of stocks that funds are selling.When put beside the results from returns, it seems very clear that some portion ofthe abnormal returns from fund trades identified in prior work can be attributed toskill at forecasting fundamentals.
The last question we address is one of economic significance. We ask whetherthe abnormal returns to trading around earnings announcements represent a dis-proportionate share of the estimated total abnormal returns earned by stocks thatfunds trade. Our analysis suggests that it does. The point estimates are that earn-ings announcement returns constitute between 18% and 51% of the total abnor-mal returns earned by stocks that funds trade. Or, expressed differently, earningsannouncement days are roughly 4–10 times more important than typical days interms of their contribution to the abnormal performance of stocks traded by mu-tual funds.
In summary, we present a new methodology that further confirms that theaverage mutual fund manager has some ability to pick winners and losers, whichsupports and extends prior results; more importantly, we find that a substantialfraction of the abnormal returns earned by fund trades derives from skill at fore-casting the economic fundamentals of firms (i.e., earnings). The paper proceeds
1114 Journal of Financial and Quantitative Analysis
as follows. Section II reviews some related literature. Section III presents data.Section IV presents empirical results. Section V concludes.
II. Related Literature on Trading around EarningsAnnouncements
We are not the first to recognize that earnings announcement returns may beuseful for detecting informed trading. Our contribution is to apply this approachto evaluate the trading skill of mutual funds.
Ali, Durtschi, Lev, and Trombley (2004) examine how changes in institu-tional ownership, broadly defined, forecasts earnings announcement returns. Asthis is the study most closely related to ours, it is worth noting some key differ-ences. First, our N-30D data allow us to study performance of individual mutualfunds; Ali et al. use SEC 13F data, which are aggregated at the institutional in-vestor level (e.g., fund family). Second, the 13F data do not permit a reliablebreakdown even among aggregates such as mutual fund families and other insti-tutions of perhaps less interest to retail investors: Many giant fund families, suchas Fidelity, Schwab, and Eaton Vance, are classified in an “other” category, alongwith college endowments, pension funds, private foundations, hedge funds, etc.Third, Ali et al. benchmark announcement returns against size only, while weuse a larger set of adjustments such as book-to-market (BM), an important differ-ence given that La Porta, Lakonishok, Shleifer, and Vishny (1997) find that suchcharacteristics are associated with higher earnings announcement returns. Theseand other differences mean that our approach is more revealing about the stock-picking abilities of individual mutual fund managers, while Ali et al.’s approachis more useful for an investor who wishes to predict future returns based on recentchanges in total institutional ownership.
The skill of other types of investors has also been assessed from the perspec-tive of earnings announcement returns. Seasholes (2004) examines this dimensionof performance for foreign investors who trade in emerging markets. Ke, Huddart,and Petroni (2003) track the earnings announcement returns that follow trading bycorporate insiders. Christophe, Ferri, and Angel (2004) perform a similar analysisfor short sellers.
III. Data
A. Data Set Construction
The backbone of our data set is the mutual fund holdings data from Thom-son Financial (also known as CDA/Spectrum S12). Thomson’s main source isthe portfolio snapshot contained in the N-30D form each fund periodically fileswith the SEC. Prior to 1985, the SEC required each fund to report its portfolioquarterly, but starting in 1985 it required only semiannual reports.2 The exact re-port dates are set by the fund as suits its fiscal year. At a minimum, the Thomson
2In February 2004, the SEC decided to return to a quarterly reporting requirement. See Elton,Gruber, and Blake (2010) for a study of the performance of fund holdings using a subset of mutual

Baker, Litov, Wachter, and Wurgler 1115
data give us semiannual snapshots of all equity holdings for essentially all mu-tual funds. A sample fund-report date-holding observation is as follows: FidelityMagellan, as of March 31, 1992, held 190,000 shares of Apple Computer.Wermers (1999) describes this data set in detail. We extract all portfolio hold-ings reported between the 2nd quarter of 1980 and the 3rd quarter of 2005. Again,to be clear, we are focused on the fund-level report dates found in the Thomsondata; the particular cut of the Thomson data, the “file date,” is not relevant for us.3
To these holdings data we merge in earnings announcement dates from theCRSP/Compustat merged industrial quarterly database. Specifically, for eachfund-report date-holding observation, we merge in the first earnings announce-ment date that follows that holding’s report date.4 We drop observations for whichwe can find no earnings announcement date within 90 days after the report date.
Next we add stock returns around each earnings announcement. From CRSP,we merge in the raw returns over the [–1,+1] trading day interval around eachannouncement. We define a market-adjusted event return (MAR) as the raw an-nouncement return minus the contemporaneous return on the CRSP value-weighted market index. We also define a benchmark-adjusted event return (BAR)as the raw return minus the average [–1, +1] earnings announcement return onstocks of similar BM, size, and momentum that also announced earnings in thesame calendar quarter as the holding in question. Our approach is similar to thatin Daniel et al. (1997).5 We exclude fund-report dates that do not have at least1 benchmark-adjusted earnings announcement return; our results are unchangedif we restrict attention to fund-report dates containing at least 10 or 20 suchreturns.
For a subset of the remaining observations, we can obtain fund charac-teristics data. Russell Wermers and Wharton Research Data Services (WRDS)provided links between the Thomson holdings data and the CRSP mutual funddatabase, as described in Wermers (2000). From the CRSP mutual fund data we
funds for which Morningstar requested and obtained monthly holdings data. Elton, Gruber, Blake,Krasny, and Ozelge (2010) find that defining trades based on changes in quarterly holdings misses20% of the trades revealed by changes in the Morningstar monthly data. The benefit of the quarterlyholdings data is that it covers a far broader set of funds than does Morningstar.
3The only reason to care about the file date is that Thomson’s practice is to report the number ofshares including the effect of any splits that occur between the fund’s report date and the file date. Torecover the correct number of shares as of the report date, we undo the effect of such splits using theCenter for Research in Security Prices (CRSP) share adjustment factors.
4Prior to this merge, we create place holder observations for “liquidating” observations in theholdings data set (i.e., situations in which no holdings of a given stock are reported for the currentreport date but positive holdings were reported at the prior report date). This allows us to examinewhether closing a position entirely portends especially poor earnings announcement returns.
5Specifically, we form the value-weighted average earnings announcement return for each of 125benchmark portfolios (5 × 5 × 5 sorts on BM, size, and momentum) in each calendar quarter. BMis defined following Fama and French (1995). Market value of equity is computed using the CRSPmonthly file as the close times shares outstanding as of December of the calendar year preceding thefiscal year data. The BM ratio is then matched from fiscal years ending in year (t – 1) to earningsannouncement returns starting in July of year (t) and from fiscal years ending in (t – 2) to earningsannouncement returns in January through June of year (t). Size is matched from June of calendaryear (t) to returns starting in July of year (t) through June of year (t + 1). Momentum is the returnfrom month t – 12 through month t – 2. The breakpoints to determine the quintiles on BM, size, andmomentum are based on the New York Stock Exchange (NYSE). The benchmark portfolios includeonly stocks with positive book equity that are ordinary common stocks (CRSP share codes 10 or 11).

1116 Journal of Financial and Quantitative Analysis
take investment objective codes as well as total net assets, turnover, and expenseratios.6 Christopher Blake shared the data on incentive fees, originally from theLipper TASS database, as studied in Elton, Gruber, and Blake (2003). Fee struc-tures are similar across the funds that use them, so we simply study whether thefund has an incentive fee in place.
Finally, we apply a set of screens to obtain an appropriate sample. Basedon key words in the name of the fund and on reported investment objectives, weexclude funds that cannot be predominantly characterized as actively managedU.S. equity funds, such as index, bond, international, and precious metals funds.We exclude funds with less than $10 million in net asset value. We also excludeeach fund’s first report date, as some of our analysis requires lagged portfolioweights.
B. Summary Statistics
Our final sample consists of several million fund-report date-holding obser-vations with associated earnings announcement returns, spread across 110,236fund-report dates. Table 1 presents summary statistics. In the first column, thenumber of funds has increased dramatically over the sample period. Almost halfof the usable fund-report dates occur in the last 5 years. The next 3 columns in-dicate the distribution of investment objectives. The subsequent 5 columns givefund holdings and trading activity. For the average fund-report date, we are ableto identify and benchmark 90.0 holdings. Portfolio breadth has increased steadilyover time. On average, 54.0 holdings receive an increase in weight in the portfolioover that in the prior report, of which 18.7 are first buys. We see that 53.1 holdingsreceive a decrease in weight, on average, and 17.0 of these decrease to 0. We alsodistinguish the performance of first buys and last sells, since it is particularly clearthat these reflect a deliberate trading decision.
The last columns summarize fund characteristics. Fund size is the total mar-ket value of the fund’s reported equity holdings for which we also have earningsannouncement return data. Average size peaks at $85.5 million in 1999. Turnoveris available for 71% of the sample, averages 96.6% per year for the subsamplefor which it is available, increases through 2000, and then falls somewhat. Theexpense ratio is available for about 76% of the sample, averages 1.27% per yearfor the subsample for which it is available, and increases by 42 bp over the pe-riod. The last column indicates the percentage of funds using incentive fees. In theaverage year, 1.9% of funds use fees. Elton et al. (2003) report that these fundsaccount for around 10% of all mutual fund assets. Some of these characteristicsdisplay trends, so we sort funds into quintiles within each reporting period insome analyses.
6Turnover data for 1991 are missing from the CRSP database. Also, CRSP sometimes reportsseveral classes of shares for a given fund, corresponding to different fee structures for the same port-folio of stocks (e.g., A, B, C, institutional, and no-load). In these cases, we take the highest reportedvalue for turnover across all classes to use as the value for turnover, and the value-weighted averageof expenses across all classes as the value for the expense ratio.

Baker, Litov, Wachter, and Wurgler 1117
TABLE 1
Summary Statistics (1980Q2–2005Q3)
The sample is the intersection of the Spectrum Mutual Fund holdings database, Compustat, and the Center for Research inSecurity Prices (CRSP). To be included in the sample, a mutual fund holding must have matched earnings announcementdate and book value from CRSP, and a valid return, market value of equity (price times shares outstanding), past momentum(return from months t−12 through t−2), and 3-day return in the earnings announcement window from CRSP. We computeterminal holdings for stocks that exit the portfolio. Where possible, we include the investment objective from the CRSPmutual fund database as determined by CDA Weisenberger or Standard & Poor’s (S&P). The investment objective growthincludes codes G, MCG, and LTG from CDA and codes LG and AG from S&P. The investment objective growth and incomeincludes G-I and GCI from CDA and GI and IN from S&P. The investment objective income includes I, IEQ, and IFL fromCDA and IN from S&P. We classify each holding as a weight increase or weight decrease. We also record those weightincreases that are first buys (from 0 to positive weight), and those weight decreases that are last sells (from positive weightto 0). We measure fund size as the total market value (price × shares outstanding) of its reported equity holdings; fundturnover and fund expense ratio from the CRSP mutual fund database; and incentive fees (whether or not the fund hassuch a structure) from Elton et al. (2003) and the Lipper TASS database. Turnover is missing in CRSP in 1991.
Fund-Report Average FundDate Observations Fund Activity Characteristics
Yea
r
All
Gro
wth
Gro
wth
and
Inco
me
Inco
me
Hol
din
gs
Wei
ght
Incr
ease
s
Wei
ght
Dec
reas
es
Firs
tBuy
s
Last
Sel
ls
Siz
e($
M)
Turn
over
(%)
Exp
ense
s(%
)
Inc.
Fees
(%Y
es)
1980 828 385 116 22 49.9 27.5 28.7 7.0 6.4 14.2 72.9 0.89 0.61981 1,107 480 148 23 50.0 29.8 27.2 6.7 7.0 13.7 68.4 0.84 1.31982 908 421 132 26 51.0 30.1 29.6 9.1 8.6 14.3 72.6 0.88 1.71983 1,082 507 153 47 57.2 32.1 34.4 10.5 9.3 20.1 75.0 0.88 1.81984 1,233 568 185 58 57.8 33.8 33.8 9.9 9.9 18.3 71.2 0.91 1.61985 1,375 647 211 81 58.7 34.6 34.2 11.1 10.1 21.2 80.5 0.92 1.81986 1,556 727 247 139 60.1 35.0 36.0 11.8 10.9 25.6 78.6 0.94 1.91987 1,753 843 285 155 62.2 36.2 37.7 12.7 11.7 31.3 94.5 1.00 2.31988 1,853 915 308 147 63.8 38.1 35.7 10.9 9.9 26.3 82.2 1.14 2.31989 1,892 954 284 140 64.2 37.9 37.1 11.9 10.7 28.9 77.5 1.14 1.71990 2,028 896 371 121 64.2 36.9 38.4 11.1 11.2 27.7 88.2 1.16 1.81991 2,253 1,025 400 118 67.1 37.9 40.8 12.9 11.6 32.4 — 1.06 1.71992 2,492 1,038 502 178 72.0 41.0 43.6 13.1 12.6 39.3 79.5 1.22 2.41993 2,688 1,144 454 148 79.9 45.1 49.3 16.2 14.5 45.6 79.4 1.22 2.41994 3,237 1,252 489 151 81.0 47.6 50.3 18.4 16.9 39.6 81.6 1.21 2.01995 3,428 1,371 519 143 85.4 51.1 53.7 21.5 19.4 49.8 88.5 1.24 2.01996 3,938 1,628 579 158 84.8 51.4 53.8 22.1 20.4 56.4 91.6 1.28 2.11997 4,819 2,087 659 182 87.0 54.4 53.1 23.1 20.5 66.6 91.2 1.27 1.71998 5,068 2,326 738 216 88.0 53.3 54.6 21.4 19.9 81.2 89.0 1.28 1.81999 6,168 2,619 756 222 85.9 50.2 53.5 20.6 17.8 85.5 87.1 1.30 1.62000 8,414 2,929 826 193 91.3 56.0 52.9 19.9 17.6 82.4 118.9 1.29 1.52001 8,608 2,819 796 150 96.3 60.1 55.1 21.8 18.8 60.8 117.0 1.32 1.62002 9,755 3,295 876 185 101.3 62.8 58.1 21.3 19.6 52.6 114.2 1.38 1.92003 10,913 3,912 995 464 103.6 61.3 61.0 20.3 18.7 51.1 112.5 1.39 2.02004 12,775 4,178 1,031 493 106.5 64.6 60.2 19.3 18.3 65.1 110.1 1.38 2.42005 10,065 3,130 792 350 108.0 62.6 63.0 18.9 17.5 67.6 86.8 1.31 1.5
All 110,236 42,096 12,852 4,310 90.0 54.0 53.1 18.7 17.0 56.6 96.6 1.27 1.9
IV. Results
A. Earnings Announcement Returns of Holdings
We start by summarizing the average performance of mutual fund holdingsaround earnings announcements. For reasons discussed in the Introduction, weare most interested in subsequent earnings announcement performance of stocksthat funds trade and do not just continue to hold, but starting with holdings allowsus to develop the methodology step by step.
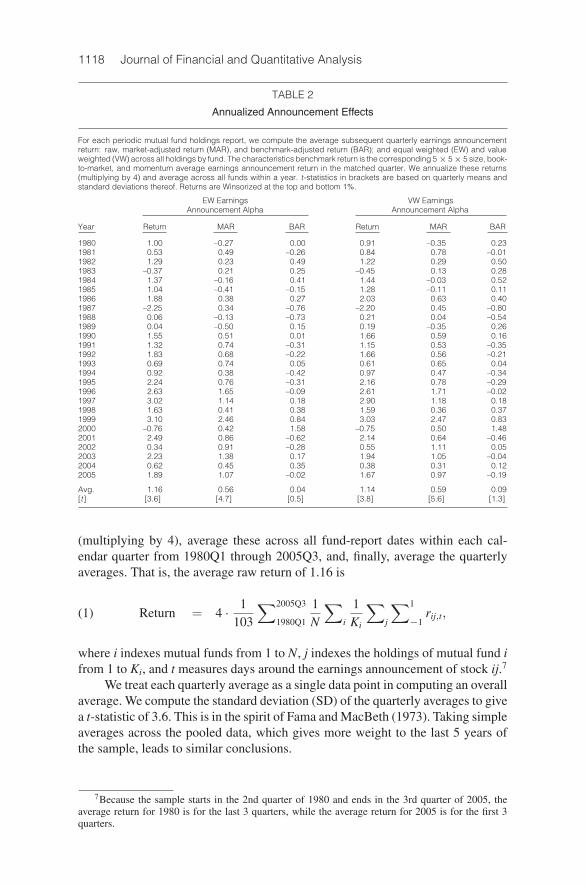
Column 1 of Table 2 reports the average raw return over the 3-day windowaround earnings announcement dates. Specifically, we take the equal-weightedaverage earnings announcement return for each fund-report date, annualize it
1118 Journal of Financial and Quantitative Analysis
TABLE 2
Annualized Announcement Effects
For each periodic mutual fund holdings report, we compute the average subsequent quarterly earnings announcementreturn: raw, market-adjusted return (MAR), and benchmark-adjusted return (BAR); and equal weighted (EW) and valueweighted (VW) across all holdings by fund. The characteristics benchmark return is the corresponding 5× 5× 5 size, book-to-market, and momentum average earnings announcement return in the matched quarter. We annualize these returns(multiplying by 4) and average across all funds within a year. t-statistics in brackets are based on quarterly means andstandard deviations thereof. Returns are Winsorized at the top and bottom 1%.
EW Earnings VW EarningsAnnouncement Alpha Announcement Alpha
Year Return MAR BAR Return MAR BAR
1980 1.00 –0.27 0.00 0.91 –0.35 0.231981 0.53 0.49 –0.26 0.84 0.78 –0.011982 1.29 0.23 0.49 1.22 0.29 0.501983 –0.37 0.21 0.25 –0.45 0.13 0.281984 1.37 –0.16 0.41 1.44 –0.03 0.521985 1.04 –0.41 –0.15 1.28 –0.11 0.111986 1.88 0.38 0.27 2.03 0.63 0.401987 –2.25 0.34 –0.76 –2.20 0.45 –0.801988 0.06 –0.13 –0.73 0.21 0.04 –0.541989 0.04 –0.50 0.15 0.19 –0.35 0.261990 1.55 0.51 0.01 1.66 0.59 0.161991 1.32 0.74 –0.31 1.15 0.53 –0.351992 1.83 0.68 –0.22 1.66 0.56 –0.211993 0.69 0.74 0.05 0.61 0.65 0.041994 0.92 0.38 –0.42 0.97 0.47 –0.341995 2.24 0.76 –0.31 2.16 0.78 –0.291996 2.63 1.65 –0.09 2.61 1.71 –0.021997 3.02 1.14 0.18 2.90 1.18 0.181998 1.63 0.41 0.38 1.59 0.36 0.371999 3.10 2.46 0.84 3.03 2.47 0.832000 –0.76 0.42 1.58 –0.75 0.50 1.482001 2.49 0.86 –0.62 2.14 0.64 –0.462002 0.34 0.91 –0.28 0.55 1.11 0.052003 2.23 1.38 0.17 1.94 1.05 –0.042004 0.62 0.45 0.35 0.38 0.31 0.122005 1.89 1.07 –0.02 1.67 0.97 –0.19
Avg. 1.16 0.56 0.04 1.14 0.59 0.09[t] [3.6] [4.7] [0.5] [3.8] [5.6] [1.3]
(multiplying by 4), average these across all fund-report dates within each cal-endar quarter from 1980Q1 through 2005Q3, and, finally, average the quarterlyaverages. That is, the average raw return of 1.16 is
Return = 4 · 1103
∑2005Q3
1980Q1
1N
∑i
1Ki
∑j
∑1
−1rij,t,(1)
where i indexes mutual funds from 1 to N, j indexes the holdings of mutual fund ifrom 1 to Ki, and t measures days around the earnings announcement of stock ij.7
We treat each quarterly average as a single data point in computing an overallaverage. We compute the standard deviation (SD) of the quarterly averages to givea t-statistic of 3.6. This is in the spirit of Fama and MacBeth (1973). Taking simpleaverages across the pooled data, which gives more weight to the last 5 years ofthe sample, leads to similar conclusions.
7Because the sample starts in the 2nd quarter of 1980 and ends in the 3rd quarter of 2005, theaverage return for 1980 is for the last 3 quarters, while the average return for 2005 is for the first 3quarters.

Baker, Litov, Wachter, and Wurgler 1119
Columns 2 and 3 adjust the raw returns. Column 2 reports market-adjustedreturns (MARs), where we subtract the CRSP value-weighted market return overthe earnings announcement window. The average MAR of 0.56 is
MAR = 4 · 1103
∑2005Q3
1980Q1
1N
∑i
1Ki
∑j
∑1
−1(rij,t − rm,t).(2)
Based on the SD of the quarterly averages, the t-statistic here is 4.7.Column 3 gives a BAR, where each holding is matched to 1 of 125 bench-
mark portfolios by quintiles of size, BM, and momentum. That is, the benchmarkportfolios contain the value-weighted, matched-firm average earnings announce-ment return in that calendar quarter. The average BAR of 0.04 is then
BAR = 4 · 1103
∑2005Q3
1980Q1
1N
∑i
1Ki
∑j
(∑1
t=−1rij,t(3)
−∑
lwl
∑1
sl=−1rl,sl
),
where l indexes the matched firms within the quarter where t equals 0, wl is themarket value weight of stock l in the characteristics-matched portfolio, and sl
measures days around the earnings announcement of stock l within the matchedquarter. Note that in equation (3) the earnings announcement return and the bench-mark do not overlap exactly.
BAR controls for the high average return in earnings announcement peri-ods documented by Beaver (1968) and studied recently by Frazzini and Lamont(2007). Also, this procedure removes some known associations between earn-ings announcement returns and firm characteristics. Chari, Jagannathan, and Ofer(1988) and La Porta et al. (1997) find that small, high-BM firms tend to havehigher announcement returns. BAR controls for these effects. In allowing thebenchmark return to vary from quarter to quarter, it also controls for a “goodearnings quarter for small value stocks,” for example, and thus may more pre-cisely pick up stock-selection skill. Obviously, it would also be valuable to beable to predict abnormal returns at the “style” level, or to recognize and exploitthe positive autocorrelation in abnormal announcement returns. BAR does notpick up these dimensions of skill, so it is conservative. But a conservative mea-sure of stock-picking ability seems appropriate given that one of our goals is toconfirm the existence of such skill.
Table 2 indicates that mutual funds earn, on an equal-weighted average ba-sis, 1.16% per year from the 12 trading days surrounding their holdings’ earningsannouncements. This exceeds the corresponding market return by 56 bp, and so isan outsize average return compared to nonannouncement days. The raw annual-ized announcement return earned by the average fund manager is not significantlylarger than that earned on a portfolio of firms with matching characteristics: Theaverage BAR is an insignificant 4 bp. Similar conclusions obtain when holdingsare value-weighted in each fund-report date.
To the extent that the BAR accurately measures the unexpected release ofinformation, the average mutual fund, as measured by all of its holdings, does notappear to possess stock-picking ability. This would be consistent with the mes-sage of Jensen (1968) and many other studies on portfolio-level returns. But the

1120 Journal of Financial and Quantitative Analysis
conclusion that mutual fund managers do not have any skill is clearly premature.A subset may have skill, even if the average does not. Or, funds may hold manystocks for which they once had good information but now retain because of trans-action costs or a capital gains tax overhang, an effect that would reduce the powerof the tests. We turn to these possibilities.
B. Cross-Sectional and Time-Series Patterns in EarningsAnnouncement Returns of Holdings
We next look for patterns in the cross-sectional distribution and time-seriesdistribution of holdings-based performance measures. Under the null hypothesisof no skill, no patterns should be apparent. The 1st dimension we sort funds onis past performance. The persistence of longer-horizon return performance hasbeen studied by Hendricks, Patel, and Zeckhauser (1993), Brown and Goetzmann(1995), Elton, Gruber, and Blake (1996), and others. Do funds that had high earn-ings announcement alphas in the past continue to have them in the future?
Panel A of Table 3 presents the results of tests for persistence. We sort fundseach year from 1983 to 2005 into quintiles based on the average announcementreturn, or the average BAR alpha, that they earned over their previous 8 announce-ments. We then compare the subsequent annualized announcement returns andBAR alphas of funds in the top quintile of prior performance to those in the bot-tom quintile. The 1st columns show the mean equal-weighted return and BARalpha, as well as t-statistics.
The earnings announcement alphas show some persistence both in raw re-turns and BARs. When sorted by prior equal-weighted BAR, the subsequent equal-weighted BAR rises monotonically. The difference between the top and bottomquintiles is a statistically significant 43 bp per year. The fact that persistence ispresent in BAR (i.e., even after adjustments are made for size, BM, and momen-tum) indicates that performance persistence cannot be explained by persistencein characteristics-adjusted announcement returns alone.8 Value-weighted resultsdisplay a similar but weaker pattern, suggesting, quite sensibly, that it is easier topick future earnings winners among smaller stocks.
The remaining panels of Table 3 look at how performance is correlatedwith fund characteristics or the regulatory environment. Panel B considers invest-ment objective, including growth, growth and income, and income styles. A clearpattern emerges. Growth funds earn higher earnings announcement returns thangrowth and income funds, which in turn earn higher returns than income funds.The same pattern is as strong, or stronger, in BAR alphas. Indeed, the BAR on theportfolio of growth funds is positive, while the BAR on income funds is negative.Wald tests (unreported) reject both that the average return for each category isequal to 0 and that the average return is equal across categories. Comparing eachstyle to the equal-weighted average of the other two reveals that income funds
8In an earlier draft, we formed benchmark portfolios where the “momentum” measure was earn-ings announcement return momentum, not total momentum as in Chen et al. (2000). This approachcontrols for the Bernard and Thomas (1989) finding of persistence in earnings announcement returns.In magnitude and statistical significance, the results from that approach are virtually identical to thosereported here.

Baker, Litov, Wachter, and Wurgler 1121
TABLE 3
Annualized Announcement Effects: Fund Characteristics
For each periodic mutual fund holdings report, we compute the average subsequent quarterly earnings announcementreturn: raw and benchmark-adjusted return (BAR); and equal weighted (EW) and value weighted (VW) across all holdingsby fund. The characteristics benchmark return is the corresponding 5 × 5 × 5 size, book-to-market, and momentumaverage earnings announcement return in the matched quarter. We annualize these returns (multiplying by 4) and averageacross all funds by past performance quintile (past returns), investment objective (style), total market value of reportedholdings (fund size), turnover, incentive fee structure, and before and after Reg FD for each report date. For past returns,size, and turnover, quintiles go from lowest to highest. Past performance is defined based on the previous 8 holdingsreports for the corresponding definition of performance. t-statistics are in brackets. Returns are Winsorized at the top andbottom 1%.
EW Earnings VW EarningsAnnouncement Alpha Announcement Alpha
Return [t] BAR [t] Return [t] BAR [t]
Panel A. Past Returns
1 1.02 [2.9] –0.15 [–1.7] 1.07 [3.3] –0.04 [–0.5]2 1.22 [3.7] –0.01 [–0.1] 1.14 [3.6] –0.05 [–0.7]3 1.27 [3.6] 0.11 [1.3] 1.22 [3.7] 0.12 [1.5]4 1.35 [3.8] 0.14 [1.4] 1.30 [3.9] 0.15 [1.7]5 1.41 [3.7] 0.28 [2.2] 1.30 [3.6] 0.24 [1.8]5 – 1 0.39 [3.9] 0.43 [4.2] 0.23 [1.8] 0.28 [2.4]
Panel B. Style
G 1.26 [3.6] 0.16 [1.4] 1.23 [3.8] 0.20 [2.0]G&I 1.19 [3.9] 0.00 [–0.0] 1.14 [3.8] –0.01 [–0.1]I 0.89 [3.0] –0.31 [–2.9] 0.89 [3.1] –0.26 [–2.5]G,<G&I,I> 0.22 [1.5] 0.32 [2.7] 0.22 [1.6] 0.33 [2.8]G&I,<G,I> 0.11 [1.7] 0.07 [1.2] 0.08 [1.2] 0.02 [0.4]I,<G,G&I> –0.34 [–2.6] –0.39 [–3.5] –0.30 [–2.4] –0.35 [–3.3]
Panel C. Size
1 1.07 [3.2] –0.07 [–1.0] 1.04 [3.4] –0.01 [–0.2]2 1.16 [3.6] 0.03 [0.3] 1.12 [3.8] 0.06 [0.9]3 1.16 [3.4] 0.05 [0.5] 1.16 [3.7] 0.12 [1.3]4 1.20 [3.6] 0.09 [0.9] 1.18 [3.8] 0.12 [1.3]5 1.24 [3.8] 0.10 [1.2] 1.24 [4.0] 0.14 [1.8]5 – 1 0.17 [3.0] 0.17 [3.0] 0.20 [3.0] 0.15 [2.4]
Panel D. Turnover
1 1.17 [3.7] 0.02 [0.3] 1.20 [4.0] 0.09 [1.3]2 1.17 [3.6] 0.06 [0.8] 1.16 [3.7] 0.09 [1.3]3 1.13 [3.2] 0.04 [0.4] 1.11 [3.4] 0.08 [0.9]4 1.23 [3.4] 0.14 [1.2] 1.20 [3.6] 0.16 [1.5]5 1.33 [3.5] 0.24 [1.7] 1.26 [3.6] 0.22 [1.7]5 – 1 0.16 [1.1] 0.22 [1.7] 0.07 [0.5] 0.14 [1.1]
Panel E. Incentive Fees
Yes 1.26 [3.6] 0.19 [1.6] 1.33 [3.9] 0.25 [2.0]No 1.16 [3.5] 0.04 [0.4] 1.15 [3.8] 0.08 [1.1]Yes – No 0.10 [1.0] 0.15 [1.8] 0.18 [1.5] 0.17 [1.6]
Panel F. Regulation FD
Pre 1.08 [3.2] 0.06 [0.7] 1.10 [3.4] 0.13 [1.6]Post 1.49 [1.7] –0.08 [–0.5] 1.32 [1.7] –0.10 [–1.0]Pre – Post –0.41 [–0.5] 0.15 [0.7] –0.22 [–0.3] 0.23 [1.3]
perform significantly worse than other categories. Similarly, growth funds per-form better. These results are consistent with Grinblatt and Titman (1989), (1993)and Daniel et al. (1997), who also find the strongest evidence of stock-selectionability among growth funds, and thus indicate that these earlier patterns fromlong-horizon studies can be attributed to information-based trading with someconfidence.
Panel C of Table 3 examines returns by fund size quintiles. There is a hintthat performance around earnings announcements increases with fund size: The

1122 Journal of Financial and Quantitative Analysis
smallest quintile does the worst. The finding that small funds make superior tradesis opposite to the arguments of Chen, Hong, Huang, and Kubik (2004), who studythe long-horizon returns of large and small funds.
So far, we have seen that funds with high earnings announcement alphas canbe identified from past performance (in this respect), style, and size. One possi-bility is that differential performance is associated with, or perhaps facilitated by,higher expenses. This is not the case. Expense ratios bear little relation to perfor-mance. We omit a tabular presentation for brevity, but our results are consistentwith, for example, Chevalier and Ellison (1999), who also find no positive rela-tionship between raw performance and expenses. However, Panel D of Table 3shows modest evidence that high earnings announcement alphas are associatedwith high turnover, consistent with the superior performance of short-term insti-tutions found in Yan and Zhang (2009).
Panel E of Table 3 considers the effect of incentive fees. By all measuresof the earnings announcement alpha, funds with incentive fees perform better.The statistical significance of the difference is marginal, but the results generallyreinforce the earlier long-horizon results of Elton et al. (2003), tying them moreclosely to information-based trading.
In Panel F of Table 3 we examine fund managers’ performance before andafter the introduction of “Reg FD.” In October 2000, SEC Regulation Fair Dis-closure banned selective disclosure (i.e., the practice of disclosing material infor-mation to preferred analysts and other institutional investors before the generalpublic).9 A motivation for Reg FD was the claim that “. . . those who were privyto the information beforehand were able to make a profit or avoid a loss at theexpense of those kept in the dark” (U.S. Securities and Exchange Commission(2000), p. 2). If selective disclosure contributed to fund managers’ ability to pickstocks, then we may expect that the returns earned around subsequent earnings an-nouncements will drop in the post-Reg FD era. The results based on all holdingsin Table 3, however, show no clear evidence of such an effect.
C. Earnings Announcement Returns Following Trades
Our central analysis involves the earnings announcement returns of stocksthat funds trade. Trading involves transaction costs and perhaps the realizationof capital gains, so it is a stronger signal than merely continuing to hold. Chenet al. (2000) study the longer-horizon returns of traded stocks. We are interestedin whether the abnormal returns that they document for stocks that funds tradeare disproportionately concentrated around earnings announcements. This wouldshed important light on the origins of fund managers’ trading skill.10
Table 4 repeats the analysis from Table 2 but computes announcement re-turns only for holdings whose portfolio weight changed between the current and
9See Gomes, Gorton, and Madureira (2007) for a fuller discussion of the debates surrounding RegFD, as well as empirical evidence that Reg FD increased analysts’ earnings forecast errors and thevolatility of stock returns around earnings announcements.
10Also note that if an earnings announcement event “risk premium” exists, it is differenced awayin the comparison of buys versus sells.

Baker, Litov, Wachter, and Wurgler 1123
TABLE 4
Annualized Announcement Effects: Mutual Fund Trades
For each periodic mutual fund holdings report, we compute the average subsequent quarterly earnings announcementreturns: raw and benchmark-adjusted return (BAR); and equal weighted across weight increases, weight decreases, longweight increases and short weight decreases, first buys, last sells, and long first buys and short last sells by fund. Thecharacteristics benchmark return is the corresponding 5 × 5× 5 size, book-to-market, and momentum average earningsannouncement return in the matched quarter. We annualize these returns (multiplying by 4) and average across all fundswithin a year. t-statistics in brackets are based on quarterly means and standard deviations thereof. Returns are Winsorizedat the top and bottom 1%.
Weight Weight Increases – First Buys –Increases Decreases Decreases First Buys Last Sells Last Sells
Year Return BAR Return BAR Return BAR Return BAR Return BAR Return BAR
1980 1.48 0.67 –0.28 –1.00 1.76 1.67 0.45 0.41 –0.98 –0.90 1.44 1.311981 0.77 0.12 0.28 –0.70 0.50 0.82 0.21 –0.34 –0.50 –1.25 0.71 0.921982 1.87 0.98 0.33 –0.30 1.54 1.28 3.01 2.12 0.40 –0.27 2.60 2.391983 –0.20 0.38 –0.56 0.00 0.36 0.38 0.04 0.48 –1.06 –0.74 1.10 1.231984 1.35 0.37 1.20 0.26 0.15 0.11 1.20 0.24 0.51 –0.40 0.69 0.651985 1.21 0.03 0.84 –0.40 0.37 0.43 1.01 –0.18 0.87 –0.41 0.14 0.231986 2.32 0.67 1.32 –0.18 1.00 0.86 2.21 0.67 1.46 0.10 0.75 0.571987 –2.21 –0.59 –2.17 –0.85 –0.03 0.26 –2.82 –1.12 –1.69 –0.17 –1.13 –0.951988 0.38 –0.40 –0.41 –1.23 0.79 0.83 1.23 0.34 –0.24 –1.11 1.47 1.451989 0.50 0.55 –0.78 –0.55 1.28 1.10 0.33 0.52 –0.94 –0.63 1.28 1.151990 1.86 0.24 0.93 –0.39 0.93 0.63 1.66 0.22 0.59 –0.58 1.07 0.811991 1.56 –0.09 1.20 –0.38 0.36 0.28 1.27 –0.31 1.50 –0.21 –0.22 –0.101992 1.79 –0.35 1.82 –0.10 –0.03 –0.25 2.39 0.22 1.63 –0.32 0.76 0.541993 0.59 –0.01 0.82 0.11 –0.23 –0.12 0.75 0.09 0.99 0.25 –0.24 –0.171994 0.97 –0.42 0.71 –0.56 0.26 0.14 0.80 –0.54 0.46 –0.78 0.34 0.241995 2.23 –0.30 2.18 –0.35 0.06 0.06 2.65 0.20 2.24 –0.19 0.41 0.401996 2.58 –0.19 2.61 0.05 –0.03 –0.24 2.12 –0.55 2.47 0.05 –0.35 –0.601997 3.06 0.18 2.81 0.05 0.25 0.13 2.82 0.01 2.66 –0.06 0.15 0.071998 1.64 0.41 1.62 0.39 0.02 0.02 2.03 0.82 1.67 0.55 0.36 0.271999 3.15 0.98 2.66 0.28 0.48 0.69 3.10 1.01 2.02 –0.38 1.07 1.392000 –0.18 1.87 –2.02 0.76 1.84 1.11 –0.52 2.10 –2.52 –0.26 2.00 2.352001 2.23 –0.64 2.82 –0.69 –0.58 0.05 2.79 –0.55 2.86 –0.54 –0.07 –0.012002 0.41 –0.20 0.06 –0.56 0.34 0.36 –0.40 –0.73 0.28 –0.36 –0.67 –0.372003 1.94 –0.08 2.69 0.61 –0.75 –0.69 2.08 0.22 2.81 0.88 –0.73 –0.662004 0.39 0.16 1.09 0.77 –0.69 –0.61 0.63 0.39 1.20 0.89 –0.57 –0.492005 1.71 –0.19 2.00 0.12 –0.29 –0.31 1.50 –0.37 1.92 0.14 –0.43 –0.52
Avg. 1.28 0.16 0.90 –0.19 0.38 0.34 1.25 0.21 0.78 –0.26 0.47 0.44[t] [4.0] [1.7] [2.7] [–1.9] [2.8] [2.6] [3.6] [1.6] [2.3] [–2.2] [3.3] [3.1]
the previous report dates. The first 3 pairs of columns give equal-weighted rawreturns and BARs for holdings whose weight increased or decreased. The second3 pairs of columns focus only on first buys (i.e., when a fund moves from 0 toa positive holding of the stock) and last sells (i.e., when a fund closes out theposition).
Table 4 contains the main results of the paper. Stocks in which funds havebeen increasing weight earn 16 annualized bp more around their next earningsannouncement than matched stocks. In addition, stocks in which mutual fundshave decreased their weight earn 19 annual bp less than matched stocks. Neithereffect is large in economic terms, reflecting both the strict matching adjustmentand the focus of the approach on a small event window. Nonetheless, the effectsare present even in the full sample, thus even the average mutual fund is at leastsomewhat successful both in buying subsequent outperformers and in selling sub-sequent underperformers. Reflecting the combined influence of the 2 effects, theBAR of weight increases minus decreases is positive in most years and statisti-cally significant.

1124 Journal of Financial and Quantitative Analysis
As expected, trades that are “first buys” and “last sells” give an even clearerindication of skilled trading. The average mutual fund’s first buys subsequentlyearn 21 bp more than matching stocks, while its last sells subsequently earn 26bp less. The former effect is marginally significant, while the latter effect, andthe difference between the two, is more robust. An interesting note is that thetable indicates that the difference in raw announcement returns between buysand sells is quite close to the difference in BARs, 0.38 versus 0.34. This is notjust a coincidence of the averages; the link is tight year after year. What thismeans is that the bulk of the total difference between buys and sells is due topicking winners and losers within characteristic groupings, not to rebalancing to-ward the characteristics that are associated with better subsequent announcementreturns.
D. Cross-Sectional and Time-Series Patterns in EarningsAnnouncement Returns of Trades
Table 5 looks for patterns in the performance of trades, following our earlieranalyses of holdings. Once again we start with persistence in Panel A. For eachof the 6 trade-based BAR alpha measures and the 6 raw return measures, we sortfunds into quintiles based on their previous performance over the past 2 years andthen tabulate their subsequent performance. The results in Panel A show evidenceof persistence, in particular for measures based on weight increases, weight de-creases, or the difference. The gap between the BAR of the highest and lowestweight increase quintiles is a significant 24 bp, and the gap for weight decreasesis an even larger 41 bp. (Recall that sorting across quintiles has the opposite in-terpretation for weight increases and decreases. For weight increases, a high BARindicates forecasting skill. For decreases, a low BAR indicates skill. Because thesorting variables differ, the difference between the weight increase and weight de-crease columns will not equal the column with weight increases minus decreases.)However, there is little evidence of persistence in relative performance of firstbuys, last sells, and first buys minus last sells, likely because both classificationsand outcomes based on first buys or last sells are much noisier, there being farfewer such trades than generic buys or sells.
The next several panels sort on other fund characteristics. The effects aretypically in the same direction as the results from holdings. In cases where thereis a performance difference, growth funds outperform income funds. Wald tests(unreported) usually reject the hypothesis of equality. Larger funds are better atbuying at the right time, while smaller funds have an edge in terms of pruningtheir portfolios of soon-to-be weak performers. Again, the patterns are harderto discern in the first buys and last sells, most likely due to greater noise. Highturnover funds may have a slight advantage, but as in the holding analysis, thepattern is quite weak. We have also confirmed that expense ratios do not mat-ter (unreported). Last, the point estimates are in the direction of incentive feesmotivating managers, but none is statistically significant.
We also look again at Reg FD. The trades-based performance is a sharpertest of the hypothesis that mutual fund managers tend to benefit from selectivedisclosure, and that Reg FD crimped this advantage. Funds generally hold dozens

Baker, Litov, Wachter, and Wurgler 1125
TABLE 5
Annualized Announcement Effects: Mutual Fund Trades and Fund Characteristics
For each periodic mutual fund holdings report, we compute the average subsequent quarterly earnings announcementreturns: raw and benchmark-adjusted return (BAR); and equal weighted across weight increases, weight decreases, longweight increases and short weight decreases, first buys, last sells, and long first buys and short last sells by fund. Thebenchmark return is the corresponding 5× 5× 5 size, book-to-market, and momentum average earnings announcementreturn in the matched quarter. We annualize these returns (multiplying by 4) and average across all funds by past per-formance quintile (past returns), investment objective (style), total market value of reported holdings (fund size), turnover,incentive fee structure, and before and after Reg FD for each report date. For past returns, size, and turnover, quintilesgo from lowest to highest. Past performance is defined based on the previous 8 holdings reports for the correspondingdefinition of performance. t-statistics are in brackets. Returns are Winsorized at the top and bottom 1%.
Weight Weight Increases – First Buys –Increases Decreases Decreases First Buys Last Sells Last Sells
Ret BAR Ret BAR Ret BAR Ret BAR Ret BAR Ret BAR
Panel A. Past Return
1 1.17 0.00 0.82 –0.25 0.22 0.11 1.13 0.07 1.08 0.06 0.83 0.772 1.25 0.01 1.17 –0.09 0.12 0.13 1.39 0.30 0.99 –0.19 0.24 0.433 1.32 0.13 1.14 0.06 0.16 0.09 1.23 0.01 0.98 –0.24 0.34 0.074 1.40 0.23 1.28 0.06 0.02 0.00 1.23 0.04 0.91 –0.16 –0.03 0.105 1.39 0.24 1.29 0.16 0.28 0.32 1.27 0.19 0.70 –0.35 0.17 0.145 – 1 [2.2] [2.3] [3.7] [3.8] [0.5] [1.6] [0.6] [0.5] [–1.6] [–1.9] [–1.9] [–1.8]
Panel B. Style
G 1.36 0.27 1.02 –0.06 0.35 0.33 1.30 0.25 0.86 –0.17 0.44 0.42G&I 1.25 0.05 1.06 –0.11 0.19 0.17 1.44 0.33 0.82 –0.32 0.62 0.65I 0.96 –0.29 0.83 –0.30 0.14 0.01 1.10 –0.13 0.91 –0.27 0.19 0.14G,<G&I,I> [1.8] [3.2] [0.4] [1.1] [1.7] [2.4] [0.1] [0.8] [–0.0] [0.6] [0.1] [0.1]G&I,<G,I> [1.0] [0.8] [1.6] [0.9] [–0.5] [–0.1] [1.2] [1.3] [–0.4] [–0.6] [1.1] [1.3]I,<G,G&I> [–2.3] [–3.3] [–1.3] [–1.5] [–0.8] [–1.5] [–0.9] [–1.4] [0.3] [–0.1] [–0.8] [–1.0]
Panel C. Size
1 1.17 0.02 0.87 –0.25 0.30 0.27 1.03 –0.07 0.77 –0.32 0.26 0.252 1.28 0.15 0.89 –0.22 0.38 0.37 1.22 0.16 0.85 –0.25 0.37 0.413 1.28 0.17 0.94 –0.16 0.34 0.33 1.39 0.33 0.96 –0.10 0.42 0.434 1.31 0.19 1.00 –0.09 0.30 0.28 1.42 0.38 0.89 –0.21 0.53 0.595 1.33 0.18 1.05 –0.06 0.28 0.25 1.35 0.22 0.79 –0.31 0.56 0.535 – 1 [2.1] [2.2] [2.7] [2.7] [–0.2] [–0.3] [1.8] [1.7] [0.1] [0.0] [1.4] [1.3]
Panel D. Turnover
1 1.28 0.13 1.08 –0.07 0.20 0.21 1.28 0.21 1.02 –0.09 0.26 0.292 1.25 0.14 0.98 –0.11 0.27 0.25 1.24 0.26 0.53 –0.48 0.70 0.743 1.25 0.16 1.01 –0.08 0.24 0.24 1.16 0.14 1.04 –0.03 0.12 0.174 1.34 0.23 0.90 –0.15 0.43 0.37 1.42 0.33 0.63 –0.39 0.79 0.725 1.39 0.30 0.99 –0.07 0.40 0.37 1.41 0.32 0.86 –0.18 0.55 0.505 – 1 [0.8] [1.2] [–0.6] [0.0] [1.9] [1.5] [0.5] [0.5] [–0.7] [–0.4] [0.9] [0.7]
Panel E. Incentive Fees
Yes 1.38 0.32 0.89 –0.18 0.49 0.50 1.20 0.23 0.67 –0.39 0.53 0.62No 1.27 0.14 0.95 –0.16 0.32 0.30 1.28 0.20 0.86 –0.24 0.43 0.44Yes – No [0.8] [1.4] [–0.5] [–0.2] [0.9] [1.1] [–0.3] [0.1] [–0.7] [–0.5] [0.3] [0.5]
Panel F. Regulation FD
Pre 1.27 0.24 0.72 –0.24 0.55 0.49 1.24 0.31 0.55 –0.37 0.69 0.67Post 1.32 –0.19 1.72 0.05 –0.40 –0.24 1.31 –0.20 1.81 0.20 –0.50 –0.41Pre – Post [–0.1] [1.8] [–1.1] [–1.1] [2.8] [2.7] [–0.1] [1.4] [–1.4] [–1.9] [3.5] [3.2]
of positions, and in any given quarter only a subset would be the subject of se-lectively disclosed information that might inspire trades. And, interestingly, theresults here suggest that Reg FD may indeed have had teeth.11 Since the introduc-tion of this regulation, mutual funds have been less successful in terms of both
11Barras, Scaillet, and Wermers (2010) also find evidence of decreasing active management skillsover the previous decade.
1126 Journal of Financial and Quantitative Analysis
buys and sells. Where the average BAR difference between weight increases anddecreases was 49 bp prior to 2001, the point estimate has actually turned negative,at –24 bp, since Reg FD, a statistically significant drop. Additional years of datawill determine whether the decline in performance is permanent or just samplingerror, but at this point the evidence is consistent with Reg FD having reduced fundmanagers’ ability to make profitable trades.
E. EPS Surprises Following Trades
Here we ask whether trades by mutual funds forecast quarterly EPS surprisesof the underlying stocks. This would provide further evidence that the nature offund managers’ apparent informational advantage derives, at least in part, froman ability to forecast earnings fundamentals. We define the earnings announce-ment surprise as the difference between the actual and consensus EPS, scaledby the share price prevailing at the beginning of the forecast period. Consensusand actual EPS are taken from the Institutional Brokers’ Estimate System (IBES)summary file. The first year for which we have sufficient data is 1984.
Note that in the setting of EPS surprises there is no benchmark or BAR-type adjustment that is natural or necessary. However, EPS surprise data involvecomplications of their own. The most important one to address is the optimismbias in consensus forecasts documented by, for example, Abarbanell and Lehavy(2003). We correct for this bias by differencing it away, comparing the EPS sur-prise performance of buys versus sells. This is analogous to our earlier approachof comparing the return performance of buys and sells and thereby differencingaway any rational risk premium during earnings announcement periods that mayotherwise contaminate estimates. A smaller issue with the EPS data is the pres-ence of outliers. We handle this by Winsorizing at the top and bottom percentile,following Abarbanell and Lehavy.
We repeat the analysis of Table 4 but use the EPS surprise as the depen-dent variable. Table 6 presents the results by trade type and year. Consistent withprior results on optimism in consensus EPS forecasts, the average stock held byfund managers experiences a negative EPS surprise: Both weight increases anddecreases, which together encompass all holdings, portend a negative EPS sur-prise on average. The meaningful comparison is the difference between buys andsells, and here the results are clear. In every year in our sample, the EPS sur-prise of stocks experiencing weight increases exceeds that of stocks experienc-ing decreases. The results are similarly strong in comparing first buys minus lastsells.
The EPS-based results provide a different perspective on trading skill, butthey are not orthogonal from the results based on returns. This is apparent fromthe strong positive correlation between these measures. The average EPS surpriseof weight increases relative to decreases (column 3 of Table 6) has a correlationof 0.37 ( p = 0.09, n = 22) with the returns of weight increases minus decreases(column 5 of Table 4) and a correlation of 0.52 ( p = 0.01, n = 22) with the relativeBAR returns of weight increases minus decreases (column 6 of Table 4). Theanalogous correlations involving first buys and last sells also exceed 0.35 ( p =0.10, n = 22). These correlations provide further evidence that the returns-based

Baker, Litov, Wachter, and Wurgler 1127
TABLE 6
Earnings Surprises (EPS)
For each periodic mutual fund holdings report, we compute the average subsequent earnings announcement surpriseequal weighted across weight increases, weight decreases, first buys, last sells, and the difference between weight in-creases and decreases and between first buys and last sells. We define the earnings announcement surprise as thedifference of the actual and consensus earnings per share (EPS), scaled by the share price at the beginning of the fore-cast period. Consensus and actual EPS comes from the IBES summary file. We annualize these surprises (multiplying by 4)and average across all funds within a year. t-statistics in brackets are based on quarterly means and standard deviations(SD) thereof. Earnings surprises are Winsorized at the top and bottom 1%.
Weight Weight Increases – First Last First Buys –Year Increases Decreases Decreases Buys Sells Last Sells
1984 –0.35 –1.26 0.91 –1.28 –1.87 0.591985 –1.19 –2.32 1.13 –1.24 –2.46 1.211986 –1.19 –2.06 0.87 –1.14 –2.55 1.411987 –0.66 –2.01 1.34 –0.74 –2.62 1.881988 0.44 –0.44 0.88 0.06 –1.65 1.711989 –0.09 –0.68 0.60 –0.04 –1.73 1.691990 0.13 –1.39 1.52 –0.33 –2.49 2.161991 –0.43 –1.22 0.79 –0.41 –1.80 1.401992 –0.31 –0.68 0.37 –0.25 –1.02 0.771993 –0.18 –0.61 0.43 –0.31 –1.23 0.921994 –0.10 –0.40 0.30 –0.26 –0.61 0.351995 –0.13 –0.44 0.31 –0.27 –0.77 0.491996 –0.25 –0.43 0.18 –0.31 –0.72 0.421997 –0.17 –0.51 0.33 –0.27 –0.60 0.331998 –0.39 –0.77 0.38 –0.47 –1.00 0.531999 –0.25 –0.80 0.55 –0.27 –1.09 0.822000 –0.05 –0.60 0.55 –0.08 –1.32 1.232001 –0.21 –1.00 0.79 –0.35 –1.50 1.162002 0.08 –0.43 0.51 –0.01 –0.80 0.792003 0.30 –0.03 0.34 0.27 –0.37 0.632004 0.11 –0.03 0.13 0.01 0.02 –0.012005 0.11 –0.01 0.12 0.08 –0.01 0.09
Avg. –0.22 –0.83 0.61 –0.35 –1.30 0.94SD 0.50 0.85 0.60 0.62 1.09 0.96[t] [–4.1] [–9.2] [9.5] [–5.3] [–11.1] [9.2]
results reflect skilled trading by mutual fund managers that is due to an ability toforecast earnings-related fundamentals.
F. Other Interpretations
Presumably mutual fund managers get the information that predicts earningsannouncement returns from many disparate sources. One interesting and nefari-ous possibility, suggested in Irvine, Lipson, and Puckett (2007), is that they are“tipped off” about forthcoming recommendation changes by analysts at the bro-kerage firms that benefit from fund managers’ trades. In unreported results, wefind that mutual fund trades indeed predict consensus recommendation changesin the same direction, although the economic magnitude is modest.12 However,we also find that fund trades predict earnings announcement returns even in asample where there are no recommendation changes in the meantime and thus no“tips.” If anything, our results are stronger in this subsample.
12While consistent with tipping, this result is also consistent with a simpler explanation that bothanalysts and fund managers are reacting to the same external source of value-relevant information,with some fund managers executing trades before analysts are able to revise their forecasts.

1128 Journal of Financial and Quantitative Analysis
Another related possibility is that fund managers are responding to (not justpredicting) some analysts’ forecasts. Brown, Wei, and Wermers (2007) show thatanalyst forecast revisions indeed generate mutual fund trades. If the stock marketunderreacts to forecast revisions, this would give rise to the appearance of fundmanager trading skill and potentially our results. (We would be inclined to classifysuch a story as skilled trading by fund managers in response to new information:New information has arisen, managers have recognized a market underreaction,and they have traded accordingly.) Analyst forecast revisions may indeed be onesource of fund managers’ information. But the fact that fund managers’ tradespredict earnings surprises relative to the prevailing-at-announcement consensusforecasts, as seen in Table 6, suggests that their trades embody incremental infor-mation that goes beyond anything analysts have produced.
G. Economic Significance: Earnings Announcement Window versusFull-Quarter Returns
We close with some remarks on economic significance. We ask whether theabnormal returns to skilled trading around earnings announcements represents adisproportionate fraction of the estimated total abnormal returns to those earnedby the stocks that funds trade. To measure the latter quantity, we adapt the method-ology of Chen et al. (2000). We repeat our prior tests but replace the average earn-ings announcement return with the average total return. As in our earlier tests, andas in Chen et al. (2000), we use the Daniel et al. (1997) size, BM, and momen-tum portfolios as benchmarks. Table 7 presents the earnings announcement returnperformance of trades, repeated for convenience from Table 4, beside their totalreturns.
We find moderate evidence of outperformance of fund trades in terms of to-tal returns. Chen et al. (2000) find stronger effects. The difference may be dueto our sample period (the Chen et al. (2000) sample begins in 1975 and ends in1995) and, relatedly, the fact that our sample includes the apparently deleteriouseffect of Reg FD. Also, Chen et al. (2000) divide stocks more finely into deciles ofchanges in mutual fund ownership and study the extreme deciles, while we definetrades more coarsely. However, even in our sample and using our definitions, thetotal return performance of first buys and last sells is noteworthy. In any event,for our purpose the main requirement is simply to assemble an apples-to-applescomparison between performance in total returns and returns around earningsannouncements.
The bottom rows of Table 7 make this comparison more formally. With 250total trading days per year and four 3-day earnings announcement windows, thenull hypothesis is that the annualized average earnings announcement abnormalreturns equals 12/250 or 5% of the annualized total abnormal return. The resultsindicate that the abnormal returns following fund trades are indeed disproportion-ately concentrated around earnings announcements. Depending on methodology,the earnings announcement return of fund trades constitutes between 18% and51% of the total return. Or, put differently, dividing these percentages by 5%, theestimates imply that earnings announcement days are roughly 4–10 times more

Baker, Litov, Wachter, and Wurgler 1129
TABLE 7
Economic Significance
For each periodic mutual fund holdings report, we compute the average total subsequent period return: raw andbenchmark-adjusted return (BAR); and equal weighted across weight increases, weight decreases, long weight increasesand short weight decreases, first buys, last sells, and long first buys and short last sells by fund. The characteristicsbenchmark return is the corresponding 5 × 5 × 5 size, book-to-market, and momentum return in the matched quarter.We annualize these returns (multiplying by 4) and average across all funds within a year. Returns are Winsorized at thetop and bottom 1%. t-statistics in brackets are based on quarterly means and standard deviations thereof, except for thelast row, where the t-statistics test the hypothesis that the difference between the annual average earnings announcementreturns and 0.05 times the annual average total returns is equal to 0.
Earnings Announcement Total ReturnsReturns (Annualized) (Annualized)
Increases – First Buys – Increases – First Buys –Decreases Last Sells Decreases Last Sells
Year Return BAR Return BAR Return BAR Return BAR
1980 1.76 1.67 1.44 1.31 –6.52 –6.19 6.62 6.261981 0.50 0.82 0.71 0.92 4.99 3.57 5.86 5.651982 1.54 1.28 2.60 2.39 11.04 9.40 13.83 12.551983 0.36 0.38 1.10 1.23 0.78 –0.98 3.69 4.021984 0.15 0.11 0.69 0.65 2.02 1.59 2.51 1.381985 0.37 0.43 0.14 0.23 2.42 2.50 1.33 1.271986 1.00 0.86 0.75 0.57 0.11 –0.19 –0.04 –0.791987 –0.03 0.26 –1.13 –0.95 –1.78 –1.25 1.00 1.621988 0.79 0.83 1.47 1.45 –1.05 –1.03 1.07 0.801989 1.28 1.10 1.28 1.15 5.18 4.27 7.19 6.131990 0.93 0.63 1.07 0.81 0.39 –0.90 1.59 0.091991 0.36 0.28 –0.22 –0.10 2.12 1.17 5.20 3.541992 –0.03 –0.25 0.76 0.54 –0.63 –1.34 3.55 3.461993 –0.23 –0.12 –0.24 –0.17 1.06 –0.04 1.27 0.391994 0.26 0.14 0.34 0.24 –0.51 –0.65 –0.46 –0.791995 0.06 0.06 0.41 0.40 1.46 0.99 2.31 1.631996 –0.03 –0.24 –0.35 –0.60 1.69 1.06 1.11 1.001997 0.25 0.13 0.15 0.07 –0.17 –0.04 2.82 2.321998 0.02 0.02 0.36 0.27 5.52 3.15 6.73 3.171999 0.48 0.69 1.07 1.39 13.66 12.90 14.93 13.172000 1.84 1.11 2.00 2.35 3.11 –0.61 –6.41 –1.292001 –0.58 0.05 –0.07 –0.01 –12.04 –9.75 –6.10 –6.912002 0.34 0.36 –0.67 –0.37 2.34 0.73 –0.34 –0.572003 –0.75 –0.69 –0.73 –0.66 –1.62 –2.41 –6.17 –4.762004 –0.69 –0.61 –0.57 –0.49 –0.33 –0.33 –0.06 0.102005 –0.29 –0.31 –0.43 –0.52 2.20 1.79 2.79 2.22
Avg. 0.38 0.34 0.47 0.44 1.35 0.66 2.53 2.14[t] [2.8] [2.6] [3.3] [3.1] [1.5] [0.9] [2.6] [2.7]
% of total return 27.88 50.96 18.47 20.61[t] [2.3] [2.8] [2.1] [2.3]
important than typical days in terms of their contribution to total outperformanceof stocks that funds trade.
V. Summary
We use the subsequent earnings announcement returns of stocks that fundshold and trade to measure mutual fund manager trading skill. We find that thestocks that U.S. equity funds buy perform better at future earnings announce-ments than control stocks, while the stocks that funds sell perform worse. Fundtrades predict not just earnings announcement returns but also EPS surprises. Thepoint estimates indicate that a meaningful fraction of the total abnormal returnperformance of fund trades documented by Chen et al. (2000), Grinblatt andTitman (1989), and Wermers (1999), among others, is concentrated around earn-ings announcement periods. Overall, the results provide additional evidence of

1130 Journal of Financial and Quantitative Analysis
the trading ability of mutual funds and shed new light on its source, namely, anability to forecast earnings fundamentals.
References
Abarbanell, J., and R. Lehavy. “Biased Forecasts or Biased Earnings? The Role of Reported Earningsin Explaining Apparent Bias and Over/Underreaction in Analysts’ Earnings Forecasts.” Journal ofAccounting and Economics, 36 (2003), 105–146.
Ali, A.; C. Durtschi; B. Lev; and M. Trombley. “Changes in Institutional Ownership and SubsequentEarnings Announcement Abnormal Returns.” Journal of Accounting, Auditing, and Finance, 3(2004), 221–248.
Barras, L.; O. Scaillet; and R. Wermers. “False Discoveries in Mutual Fund Performance: MeasuringLuck in Estimated Alphas.” Journal of Finance, 65 (2010), 179–216.
Beaver, W. “The Information Content of Annual Earnings Announcements.” Journal of AccountingResearch, 6 (1968), 67–92.
Bernard, V. L., and J. K. Thomas. “Post-Earnings-Announcement Drift: Delayed Price Response orRisk Premium?” Journal of Accounting Research, 27 (1989), 1–36.
Brown, N. C.; K. D. Wei; and R. Wermers. “Analyst Recommendations, Mutual Fund Herding, andOverreaction in Stock Prices.” Working Paper, University of Southern California (2007).
Brown, S. J., and W. N. Goetzmann. “Performance Persistence.” Journal of Finance, 50 (1995),679–698.
Carhart, M. M. “On Persistence in Mutual Fund Performance.” Journal of Finance, 52 (1997), 57–82.Chari, V. V.; R. Jagannathan; and A. R. Ofer. “Seasonalities in Securities Returns: The Case of
Earnings Announcements.” Journal of Financial Economics, 21 (1988), 101–121.Chen, H.-L.; N. Jegadeesh; and R. Wermers. “The Value of Active Mutual Fund Management: An
Examination of the Stockholdings and Trades of Mutual Fund Managers.” Journal of Financialand Quantitative Analysis, 35 (2000), 343–368.
Chen, J.; H. Hong; M. Huang; and J. D. Kubik. “Does Fund Size Erode Mutual Fund Performance?The Role of Liquidity and Organization.” American Economic Review, 94 (2004), 1276–1302.
Chevalier, J., and G. Ellison. “Are Some Mutual Fund Managers Better Than Others? Cross-SectionalPatterns in Behavior and Performance.” Journal of Finance, 54 (1999), 875–899.
Christophe, S. E.; M. G. Ferri; and J. J. Angel. “Short-Selling Prior to Earnings Announcements.”Journal of Finance, 59 (2004), 1845–1876.
Cohen R. B.; J. D. Coval; and L. Pastor. “Judging Fund Managers by the Company They Keep.”Journal of Finance, 60 (2005), 1057–1096.
Daniel, K.; M. Grinblatt; S. Titman; and R. Wermers. “Measuring Mutual Fund Performance withCharacteristic-Based Benchmarks.” Journal of Finance, 52 (1997), 1035–1058.
Elton, E. J.; M. J. Gruber; and C. R. Blake. “The Persistence of Risk-Adjusted Mutual Fund Perfor-mance.” Journal of Business, 69 (1996), 133–157.
Elton, E. J.; M. J. Gruber; and C. R. Blake. “Incentive Fees and Mutual Funds.” Journal of Finance,58 (2003), 779–804.
Elton, E. J.; M. J. Gruber; and C. R. Blake. “Holdings Data, Security Returns, and the Selection ofSuperior Mutual Funds.” Journal of Financial and Quantitative Analysis, forthcoming (2010).
Elton, E. J.; M. J. Gruber; C. R. Blake; Y. Krasny; and S. O. Ozelge. “The Effect of Holdings DataFrequency on Conclusions about Mutual Fund Behavior.” Journal of Banking and Finance, 34(2010), 912–922.
Fama, E. F. “Efficient Capital Markets: A Review of Theory and Empirical Work.” Journal of Finance,25 (1970), 383–417.
Fama, E. F., and K. R. French. “Size and Book-to-Market Factors in Earnings and Returns.” Journalof Finance, 50 (1995), 131–155.
Fama, E. F., and J. D. MacBeth. “Risk, Return, and Equilibrium: Empirical Tests.” Journal of PoliticalEconomy, 81 (1973), 607–636.
Ferson, W. E., and R. W. Schadt. “Measuring Fund Strategy and Performance in Changing EconomicConditions.” Journal of Finance, 51 (1996), 425–461.
Frazzini, A., and O. Lamont. “The Earnings Announcement Premium and Trading Volume.” WorkingPaper, NBER (2007).
Gomes, A.; G. Gorton; and L. Madureira. “SEC Regulation Fair Disclosure, Information, and the Costof Capital.” Journal of Corporate Finance, 13 (2007), 300–334.

Baker, Litov, Wachter, and Wurgler 1131
Grinblatt, M., and S. Titman. “Mutual Fund Performance: An Analysis of Quarterly PortfolioHoldings.” Journal of Business, 62 (1989), 393–416.
Grinblatt, M., and S. Titman. “Performance Measurement Without Benchmarks: An Examination ofMutual Fund Returns.” Journal of Business, 66 (1993), 47–68.
Hendricks, D.; J. Patel; and R. Zeckhauser. “Hot Hands in Mutual Funds: Short-Run Persistence ofRelative Performance, 1974–1988.” Journal of Finance, 48 (1993), 93–130.
Ippolito, R. A. “Efficiency with Costly Information: A Study of Mutual Fund Performance,1965–1984.” Quarterly Journal of Economics, 104 (1989), 1–23.
Irvine, P.; M. Lipson; and A. Puckett. “Tipping.” Review of Financial Studies, 20 (2007), 741–768.Jensen, M. C. “The Performance of Mutual Funds in the Period 1945–1964.” Journal of Finance, 23
(1968), 389–416.Kacperczyk, M., and A. Seru. “Fund Manager Use of Public Information: New Evidence on Manage-
rial Skills.” Journal of Finance, 62 (2007), 485–528.Kacperczyk, M.; C. Sialm; and L. Zheng. “Unobserved Actions of Mutual Funds.” Review of Financial
Studies, 21 (2008), 2379–2416.Ke, B.; S. Huddart; and K. Petroni. “What Insiders Know about Future Earnings and How They Use
It: Evidence from Insider Trades.” Journal of Accounting & Economics, 35 (2003), 315–346.La Porta, R.; J. Lakonishok; A. Shleifer; and R. Vishny. “Good News for Value Stocks: Further
Evidence on Market Efficiency.” Journal of Finance, 52 (1997), 859–874.Lehman, B., and D. Modest. “Mutual Fund Performance Evaluation: A Comparison of Benchmarks
and Benchmark Comparisons.” Journal of Finance, 42 (1987), 233–265.Seasholes, M. “Re-Examining Information Asymmetries in Emerging Stock Markets.” Working Paper,
University of California at Berkeley (2004).U.S. Securities and Exchange Commission. “Selective Disclosure and Insider Trading.” 17 CFR Parts
240, 243, and 249, Release Nos. 33-7881, 34-43154, IC-24599 (http://www.sec.gov/rules/final/33-7881.htm) (Aug. 10, 2000).
Wermers, R. “Mutual Fund Herding and the Impact on Stock Prices.” Journal of Finance, 54 (1999),581–622.
Wermers, R. “Mutual Fund Performance: An Empirical Decomposition into Stock-Picking Talent,Style, Transactions Costs, and Expenses.” Journal of Finance, 55 (2000), 1655–1695.
Yan, X. S., and Z. Zhang. “Institutional Investors and Equity Returns: Are Short-Term InstitutionsBetter Informed?” Review of Financial Studies, 22 (2009), 893–924.