can lockdown reduce infection growth in developing
TRANSCRIPT

Can Lockdown Reduce Infection Growth in
Developing Countries? Evidence from COVID-19
Cases
Shafiun N. Shimul, PhD1
Abstract Background:
When crippled with COVID-19 infection, a substantial number of countries
have adopted ‘lockdown’ or similar measures to suppress the spread. This
instrument is often considered as the only viable option for curbing
infection spread both in developed and developing countries; however,
some experts have a cynical view on its effectiveness. Exploiting cross-
country lockdown information, effectiveness of lockdown on slowing the
pace of COVID-19 can be elicited.
Methods:
The study intends to understand whether lockdown or similar measures can
suppress infection growth in developing countries. In this pursuit, the study
uses panel regression-based difference in difference and GMM estimation method.
Results:
This study finds that lockdown type measures are not as effective in developing
countries as in developed nations. Nevertheless, staying at home order, income
support programs, and other social distancing measures are found to be effective
for both developed and developing countries. Also, the timing of the lockdown
is found to be vital. One the one hand, enforcing a nationwide lockdown too
early, i.e., when cases are very low, may not yield expected outcome; on the
other hand, enforcing lockdown too late is also ineffective.
Conclusion:
Even though this study does not find strong evidence of the effectiveness of
lockdown in curbing infection growth in developing countries, these findings do
not necessarily suggest that lockdown should not be enforced in developing
countries. Rather it indicates that lockdown should be combined with other
complementary measures such as contact tracing, extensive testing, income
support for the poor, effective management of informal and migrant workers to
make the lockdown effective. Merely declaring lockdown, without accompanying
other must-have measures, will hurt the economy without contributing much to
reducing the growth of infection.
Keyword: Lockdown, COVID-19, Growth of Infection, Mobility, Social Distancing,
Govt. Response
JEL Codes: H2, H3, I1, I3
1 Associate Professor, Institute of Health Economics, University of Dhaka & Consultant, The World Bank; Email: [email protected];
ORCiD: 0000-0002-0628-1056

1
Background
To contain COVID-19, a significant number of countries have adopted
‘lockdown’ or similar measures. One view sees this type of instrument
as the only viable option of curbing infection spread both in developed
and developing countries. The countervailing view is that this will not
work well in developing countries for several reasons. First, the
cultural and institutional practice is much differing in developing
countries whenever it comes to the tendency to comply with laws and
regulations. Second, a vast majority of developing world has lower
literacy rates, which may be positively correlated with superstitious
beliefs that a contagious disease like COVID-19 will not target the pious
people rather the sinners. Third, millions of impoverished people, who
live hand to mouth, are hosted in the developing countries. They cannot
afford to confine themselves at home for a long time as not going out
of home is tantamount to no income and no food. Therefore, maintaining
social distancing—key objective of a lockdown--is not a choice for
millions of people in those countries. In addition, those countries
cannot afford to provide financial and food assistance at a scale that
can reach most of the poorest segment of the population, let alone to
the ones who are relatively well off. Be it for relapse of regulation
or lack of affordability, or economic structure; these countries cannot
afford lockdown for longer period. As a result, developing countries may
not be able to suppress the spread of the outbreak successfully with
‘lockdown’--a widely prescribed playbook of curbing the spread of
infection. This strategy, however, has been touted as the most, if not
the only, practical strategies to restraint the spread of infectious
diseases. This is even more true for COVID-19 since it is enormously
contagious.
By May 2020, more than one-third of the countries of the world have
adopted lockdown type measures with closings school colleges,
restricting the movement of the transports, and other draconian measures,
partly influenced by the prescriptions of many international
institutions or maybe just due to ‘following the crowd’ principle. For
instance, India and Bangladesh have also adopted this policy within few
days of first COVID-19; however, their cases, especially in India, have
been skyrocketing since then. This rocky rise has influenced many people
to believe that lockdown type measures are not an effective instrument
in those areas even though it has been showing promises in the western
world.
While lockdown itself is an essential tool, the timing of the lockdown
turns out to be crucial as well. For instance, Fiji is one of the
countries which adopted lockdown very early; the same is true for
Australia, and both were able to reduce the infection and keep total
tally very low. New Zealand, Sri Lanka have also shown some illuminating
success. On the other hand, many countries, including Italy and the US,
have adopted lockdown (or some form of it) in such a stage that it was
difficult to see any impact. Because it is the nature of the epidemic

2
that follows logistic type distribution, so when they are in an
exponential growth stage, it is incredibly difficult, if not impossible,
to reduce the infection significantly. The characteristics of having a
relatively long incubation period, being extremely contagious, having
the feature of asymptotic cases makes the fight against COVID-19 an
uphill battle. Though much debates as to the effectiveness of lockdown
are seen in the media talks and in political spheres, any rigorous study
in this issue is lacking which has left further debates to grow. Some
empirical exercises on the impact of non-pharmaceutical intervention
(NPI) is available for China(Lau et al., 2020) or for some specific
regions especially for Europe(Flaxman et al., 2020); and a few more
theoretical work are also evident that explains the impact of
misinformation(Bursztyn, Rao, Roth, & Yanagizawa-Drott, 2020) and
optimal timing of lockdown (Alvarez, Argente, & Lippi, 2020). In a recent
paper, Moghbelli et al., 2020 argued that an RCT can provide better
answer since countries are taking several intervention altogether which
makes it difficult to isolate the impact of any specific intervention.
While RCT can provide a better evidence on what works and what does not,
it is difficult or costly to implement such experiments in pandemic
condition.
While one group takes effectiveness of lockdown as granted, another group
is flooding the claims of its ineffectiveness—with both groups completely
without a strong evidence. In theory, it should work since lockdown means
an increase in social distancing, and so the virus will not find its
hosts, and its effort to grow will be thwarted. Nevertheless, in
practice, a lockdown--unless it can be enforced the way draconian
governments have recently executed--may not ensure a slower growth in
infections. Instead, it may create a public outcry if it persists for
long time, and as a result, people may violate the lockdowns limiting
its prowess to curb infection. Furthermore, in most of the developing
countries, many migrant workers live in the big cities; closure means
returning home and at a large number, and flocking together. It may
increase the spread of the virus, increasing the chance of community
transmission.
Using COVID-19 case data from all countries of the world, this study
attempted to answer this question—whether lockdown can tame the spread
of the growth of infection. To do so, this study employs a sophisticated
modeling approach---it uses both a panel version of difference-in-
difference (DiD) and a dynamic panel regression (GMM) modeling approach.
The study finds that lockdown does not necessarily reduce the infection
in developing countries even though it does a pretty good job in curbing
infections in the developed nations. Most importantly, the study finds
that it is the timing of lockdown that matters most rather than the
lockdown itself. The study does not necessarily imply that developing
countries should not enforce lockdown. Rather, this study deduces that
lockdown should be enforced along with other must-have measures to reap
the fruit of it.

3
The paper is organized as follows. After the introduction, the paper
provides an account of methods. Then it presents the findings with
discussions followed by a conclusion.
4
Methods
Data
The data includes the daily infection rates from December 29, 2019 until
May 9, 2020. This data is collected from the European Center for Disease
Control and Prevention (European Centre for Disease Prevention and
Control, 2020). Along with case data, this study also uses dataset from
three other sources. One is the google mobility data which provides
change in the mobility compared to base period (pre-COVID-19) in six key
areas: grocery and pharmacies, parks, transit stations, retail &
recreation, residential and workplace(Google, 2000). This dataset offers
a reasonable proxy measures of compliance to the lockdown which has
already been used in other COVID-19 related studies (Sampi, 2020;
Yilmazkuday, 2020b). And mobility data has been used in other studies
to understand the impact social distancing(Yilmazkuday, 2020a) . The
second data source is the stringency of lockdown collected from the
Blavatnik School of Government, University of Oxford (Hale, Petherick,
Phillips, & Webster, 2020). This dataset provides various levels of
closure and containment measures and economic responses of government
towards COVID-19 as well as a stringency index. In this study, I use
eight measures of closures and containments, stringency index and income
support measures. All are ordinal scale meaning the higher number, the
higher the extent, except stringency index which is measured as index
and normalized to 100. Third data set is from a Wikipedia page
(wikipedia, 2020) which lists the dates of when lockdown was enforced
in each countries. This dataset is cross-checked with other sources
including newspapers of the respective countries. Figures 1-8 provide
some visual explanation of the data and their relationship among the
variables used in this study.
Empirical strategy
Along with traditional difference in difference estimation method, two
broad empirical strategies are applied to understand the impact of
lockdown on the growth of COVID-19 Cases: Panel Regression-Based
Difference-in-Difference (DiD) estimation and GMM estimation.
Regression Based DID estimates Instead of a straight difference in difference estimates, the panel
regression-based estimation method is used. There are a few advantages
of regression difference in difference estimation in comparison with
straight DiD estimates: a) it is easy to calculate standard errors b)
other related control or confounding variable can be applied c) inclusion
of multiple period or trend is possible, d) it can capture the impact
under different level of intensities (Shimul, 2017), and in this study,
I used both lockdown and its intensity. A similar approach has been
applied to understand the impact of social mobility on COVID-19
spread(Yilmazkuday, 2020b). The following regression technique is used
to estimate the impact of lockdown:

5
𝐺𝑖𝑡 = 𝛽1 + 𝛽2𝑇𝑟𝑒𝑎𝑡𝑖 + 𝛽3𝑇𝑟𝑒𝑎𝑡𝑡 + 𝛽4(𝑇𝑟𝑒𝑎𝑡 ∗ 𝑃𝑜𝑠𝑡)𝑖𝑡 + 𝑍𝑖𝑡 + 𝜀𝑖𝑡 (1)
Here, 𝐺𝑖𝑡= daily growth of infection, Treatment=a dummy if the observation
is in the treatment group i.e. the country has adopted lockdown;
Post=post treatment dummy, 𝑍𝑖𝑡 = other controls or confounding variables,
𝑖 =country/panel, and 𝑡 =time(day)
GMM Estimates The estimation technique (1) can provide a good estimate under certain
assumptions: no serial autocorrelation, no unobserved heterogeneity, and
the regression equation does not include dynamic component (i.e., lag
of dependent variable). However, this estimation technique will not be
appropriate if any of these assumptions are violated. While some of the
problems can easily be tacked by using robust standard errors and fixed
effects (if there are time-invariant components), if any dynamic
components are used or if there is an endogeneity (reverse-causality),
then OLS or Panel Regression with fixed effects will not be ideal choice
of estimation. In that case, the coefficients will be biased; and either
Instrumental variables or GMM approach would be preferred. Since the
growth of infection will likely to be largely determined by the growth
of infection of previous periods, the inclusion of autoregressive
variables is necessary. Also, the inclusion of lag dependent variable
can capture many unobservable components. In this case, the specification
will be:
𝐺𝑖𝑡 = 𝛽1 + 𝛽1𝐺𝑖,𝑡−1 + 𝛽2𝑇𝑜𝑡𝑎𝑙 𝐶𝑎𝑠𝑒𝑠𝑖,𝑡−1 + 𝛽3𝑇𝑟𝑒𝑎𝑡𝑡 + 𝛽4(𝑇𝑟𝑒𝑎𝑡 ∗ 𝑃𝑜𝑠𝑡)𝑖𝑡 + 𝑍𝑖𝑡 + 𝑣𝑖𝑡 (2)
However, the inclusion of lag dependent variables introduces other
problems in the estimation. Now, if OLS or Panel Regression will be
biased and inconsistent since the error term will be correlated with 𝐺𝑖𝑡
due to the presence to lag dependent variable in the right-hand side of
the equation. Arellano and Bond (Arellano & Bond, 1991) offer an
estimation technique--difference GMM-- to deal with the problem
associated with heterogeneities. Taking a first difference of the
equation (2), we get-
∆𝐺𝑖𝑡 = 𝛽1∆𝐺𝑖,𝑡−1 + 𝛽2∆𝑇𝑜𝑡𝑎𝑙 𝐶𝑎𝑠𝑒𝑠𝑖,𝑡−1 + 𝛽3∆𝑇𝑟𝑒𝑎𝑡𝑡 + 𝛽4∆(𝑇𝑟𝑒𝑎𝑡 ∗ 𝑃𝑜𝑠𝑡)𝑖𝑡 + ∆𝑍𝑖𝑡 + ∆𝑣𝑖𝑡 (3)
The problem is in (3), ∆𝐺𝑖,𝑡−1 is still endogenous. Arellano and Bond show
that if this variable is instrumented with lags of their differences
under some sets of moment conditions, this estimation will be valid, and
this called difference GMM. However, Blundell and Bond(Blundell & Bond,
1998) show that if T is a small or dependent variable is highly
persistent, then difference GMM will pick weak instruments leading to
invalid results. Even though in this study, T is large for most
countries, time-persistency (i.e. this period’s value depend on its past
values) is extremely likely as this is the nature of infection. However,
Blundell and Bond (Blundell & Bond, 1998; Blundell, Bond, & Windmeijer,
2000) show the way to tackle the estimation problem posed by the
inclusion of lag dependent variables when there is time-persistency.
6
They show that instruments from both differences and lags can be used
to make the instruments stronger under some set of moment conditions,
and this method is called system GMM. It performs better than the
difference GMM in a condition that matches with this study (potential
time-persistency). Therefore, this study uses system GMM.
Results
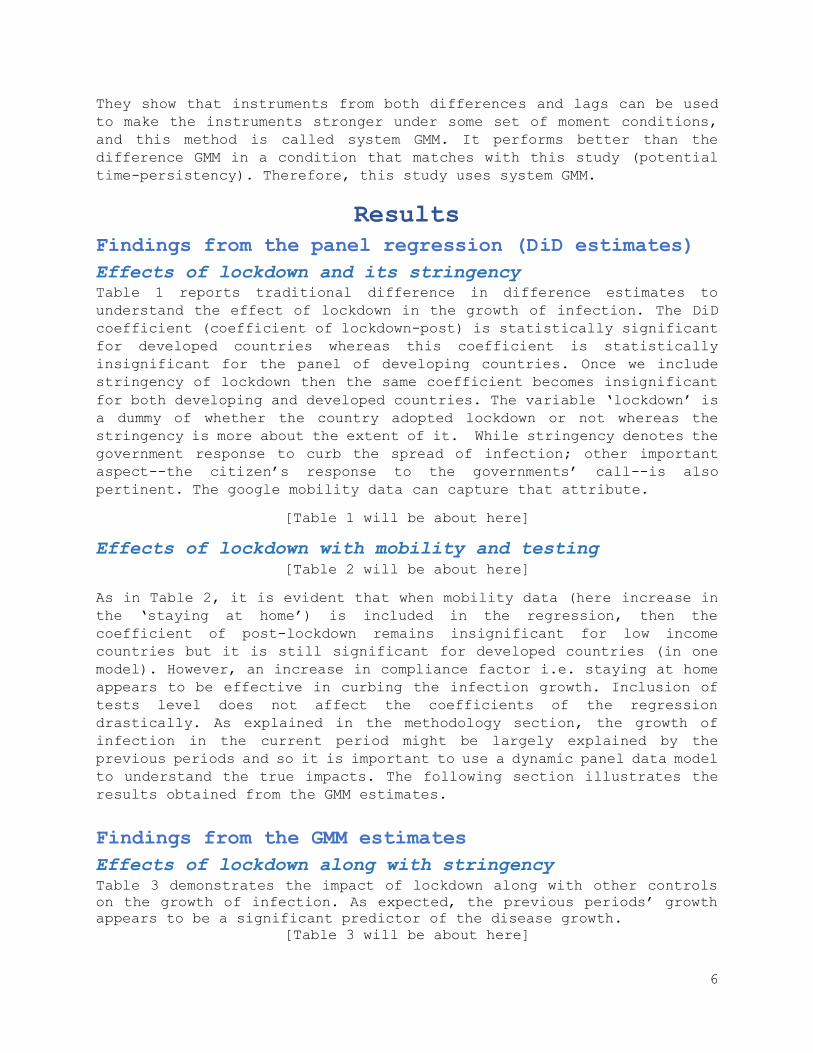
Findings from the panel regression (DiD estimates)
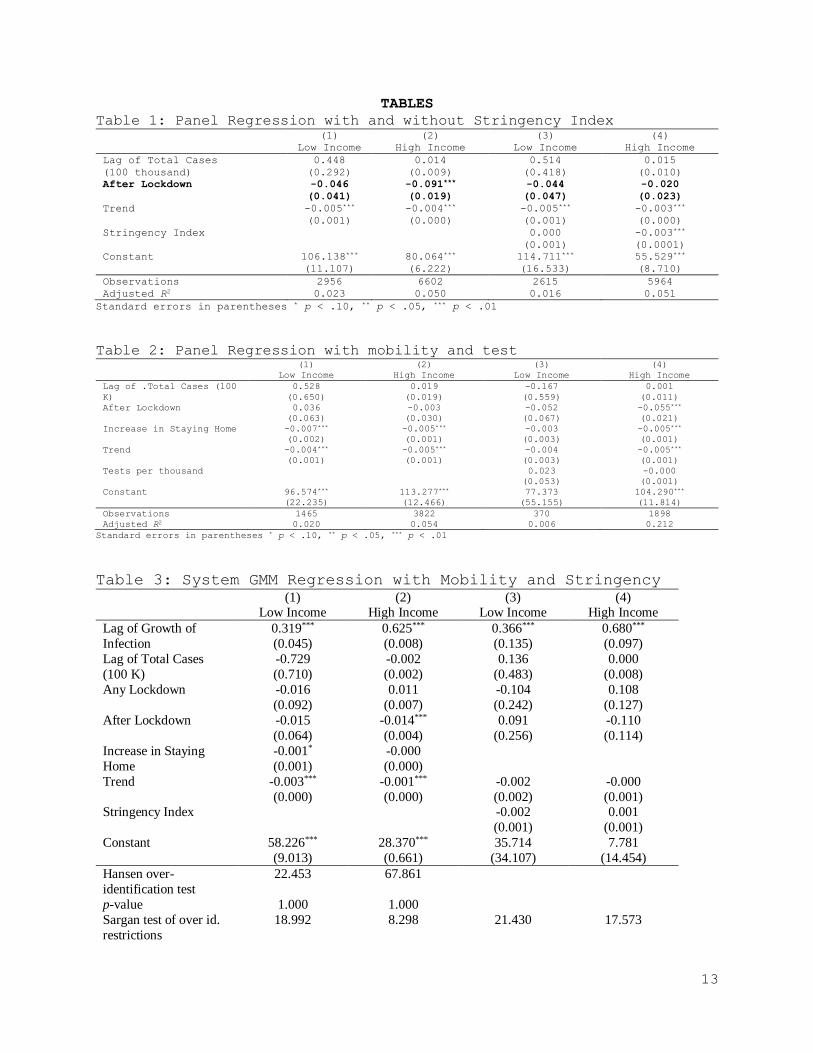
Effects of lockdown and its stringency Table 1 reports traditional difference in difference estimates to
understand the effect of lockdown in the growth of infection. The DiD
coefficient (coefficient of lockdown-post) is statistically significant
for developed countries whereas this coefficient is statistically
insignificant for the panel of developing countries. Once we include
stringency of lockdown then the same coefficient becomes insignificant
for both developing and developed countries. The variable ‘lockdown’ is
a dummy of whether the country adopted lockdown or not whereas the
stringency is more about the extent of it. While stringency denotes the
government response to curb the spread of infection; other important
aspect--the citizen’s response to the governments’ call--is also
pertinent. The google mobility data can capture that attribute.
[Table 1 will be about here]
Effects of lockdown with mobility and testing
[Table 2 will be about here]
As in Table 2, it is evident that when mobility data (here increase in
the ‘staying at home’) is included in the regression, then the
coefficient of post-lockdown remains insignificant for low income
countries but it is still significant for developed countries (in one
model). However, an increase in compliance factor i.e. staying at home
appears to be effective in curbing the infection growth. Inclusion of
tests level does not affect the coefficients of the regression
drastically. As explained in the methodology section, the growth of
infection in the current period might be largely explained by the
previous periods and so it is important to use a dynamic panel data model
to understand the true impacts. The following section illustrates the
results obtained from the GMM estimates.
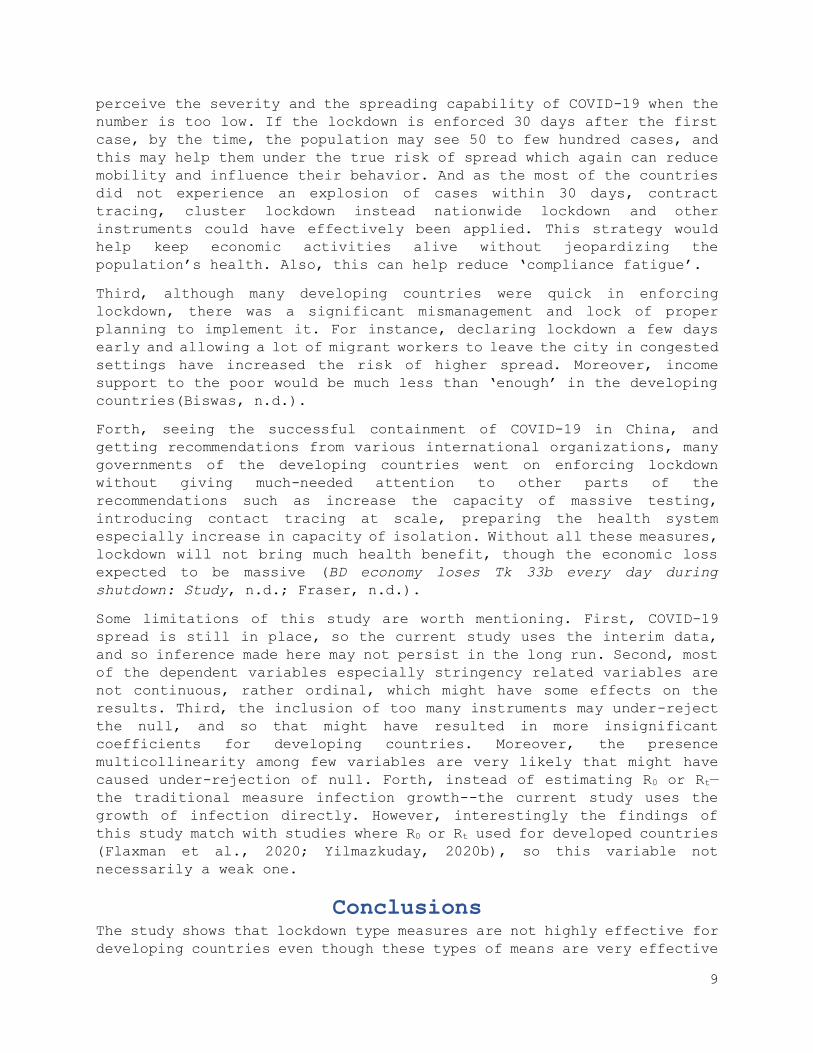
Findings from the GMM estimates
Effects of lockdown along with stringency Table 3 demonstrates the impact of lockdown along with other controls
on the growth of infection. As expected, the previous periods’ growth
appears to be a significant predictor of the disease growth.
[Table 3 will be about here]

7
The after-lockdown variable, which is included to understand the impact
of lockdown, assumes an unexpected sign for developing countries. The
same coefficient, however, is statistically highly significant (p-value
<0.01) for developed nations. Mobility has an expected sign but not
statistically discernable. The trend coefficient is negative for both
developed and developing countries though it is significant for
developing countries only. Instruments used in this regression appear
to be valid, as demonstrated through Sargan and Arellano-Bond, and Hansen
tests.
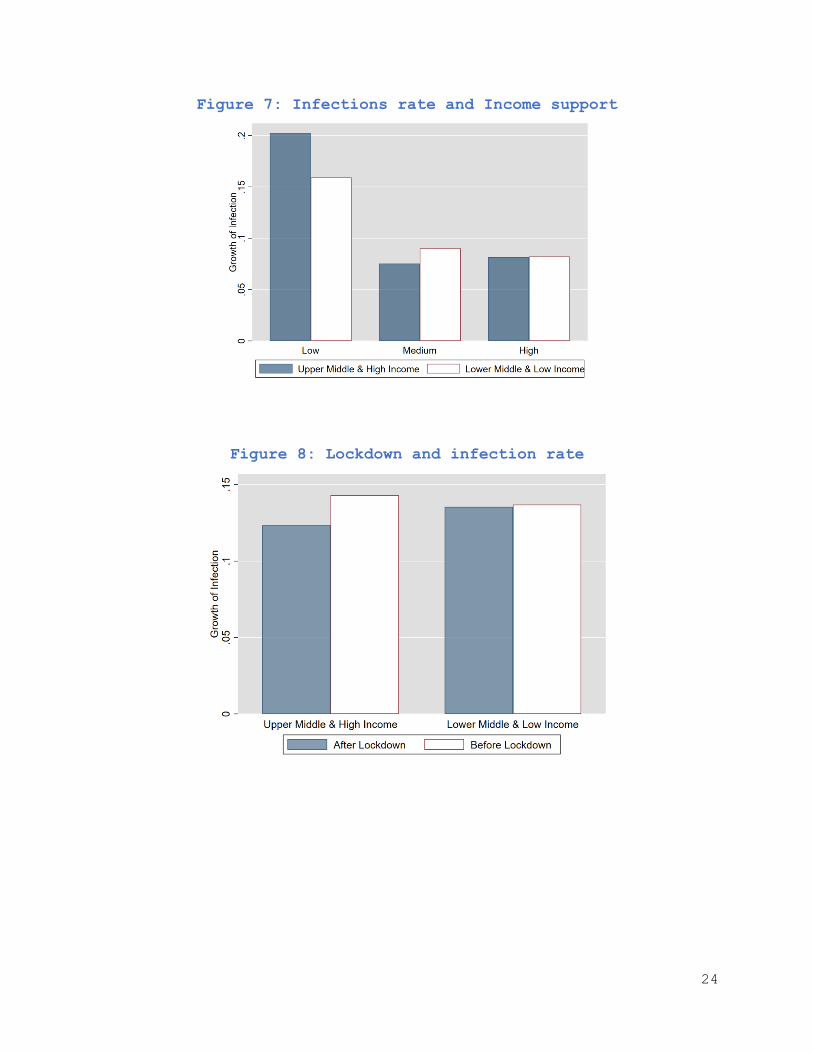
Effects of income support Although lock-down seems to have a little effect on curbing the spread
of infections in developing countries, income support shows a strong
impact. Table 4 shows that income support is statistically significant
(p value<0.01) in curbing the spread of infection. Interestingly, the
same variable is not statistically significant for developed countries.
[Table 4 will be about here]
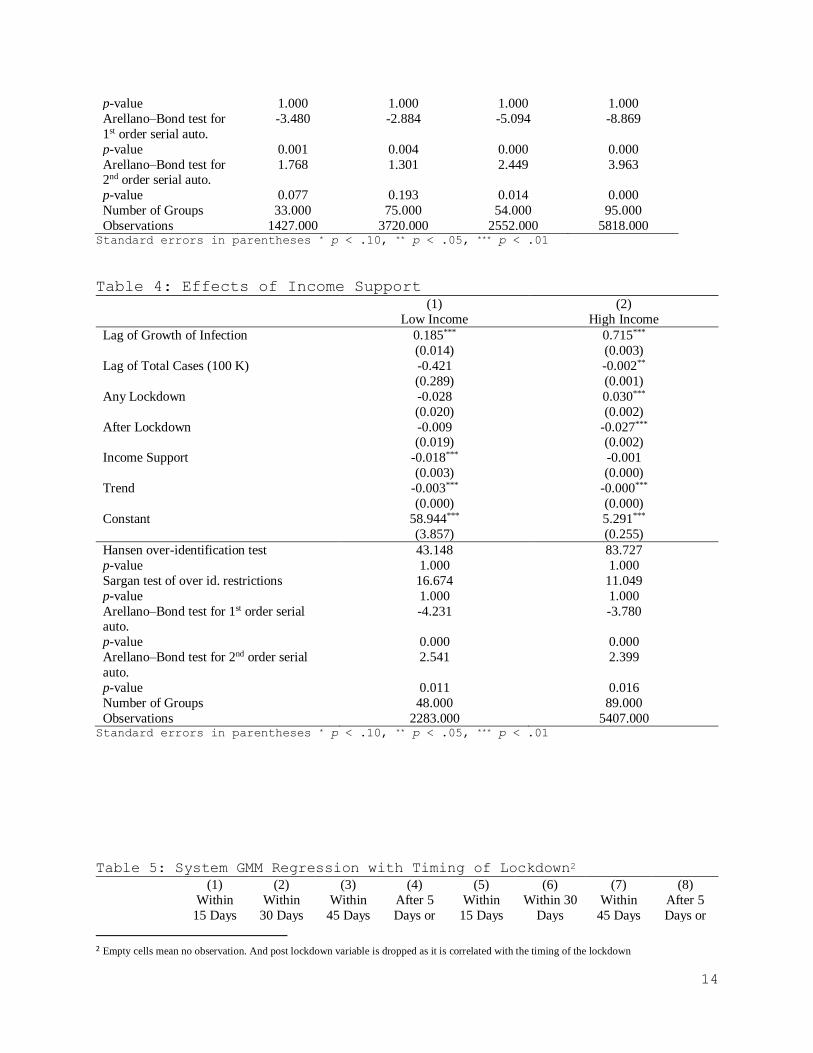
Timing of lockdown The timing of lockdown can play a significant role in curbing the spread
of infection. For instance, if a strict lockdown is enforced in the
beginning, it might be easier to stop the growth of infection. On the
other hand, enforcing lockdown too early may backfire if people do not
take it seriously as there could be a behavioral issue related to the
compliance.
[Table 5 will be about here]
For example, if cases are very low when lockdown is enforced, people may
underestimate the actual risk which may affect the compliance as well
the effectiveness of these non-pharmaceutical interventions. Moreover,
people in developing countries-- where the massive level of income
support is not possible to render--will not be able to comply with stay
home orders as a vast majority of them live hand to mouth, and they have
to come out of home for some income opportunities just to feed their
family. To understand whether the timing of lockdown is crucial, the
timing of lockdown (lockdown after how many days since first cases) is
categorized as lockdown within 15 days, within 30 days, within 45 days,
and after 45 days or never. Regression Table 5 shows that the timing of
lockdown does not seem to be important for developing countries as
lockdown does not affect the growth of infection at all; however, the
developed countries that enforced lockdown within 30 days of first case
detection were able to contain the spread of virus significantly.
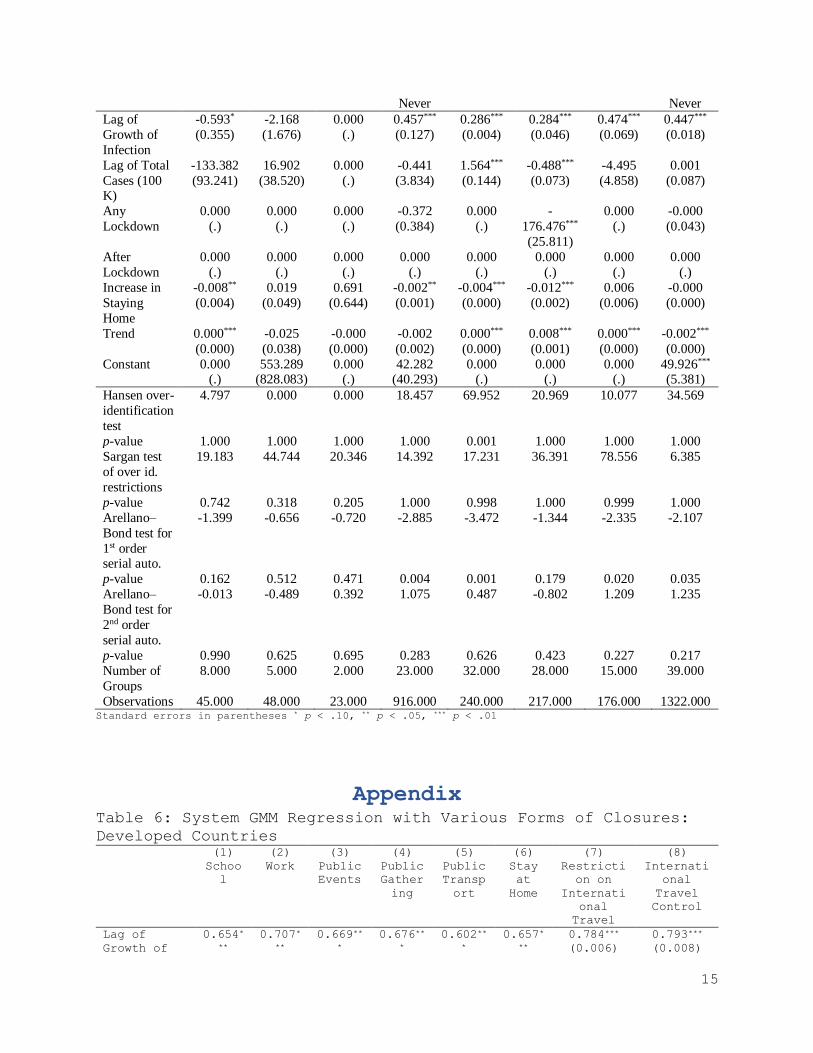
Type of closure and mobility Various forms of closures have been adopted in multiple countries ranging
from school closure to public event closure and almost complete shutdown
of the international passenger traveling. While the stringency index
provides an aggregate of all these measures, it is quite likely that all
measures would not be equally effective. For instance, when there is no
recorded infection, school closure may not be an optimal response;
rather, screening international traveler, identifying and isolating them

8
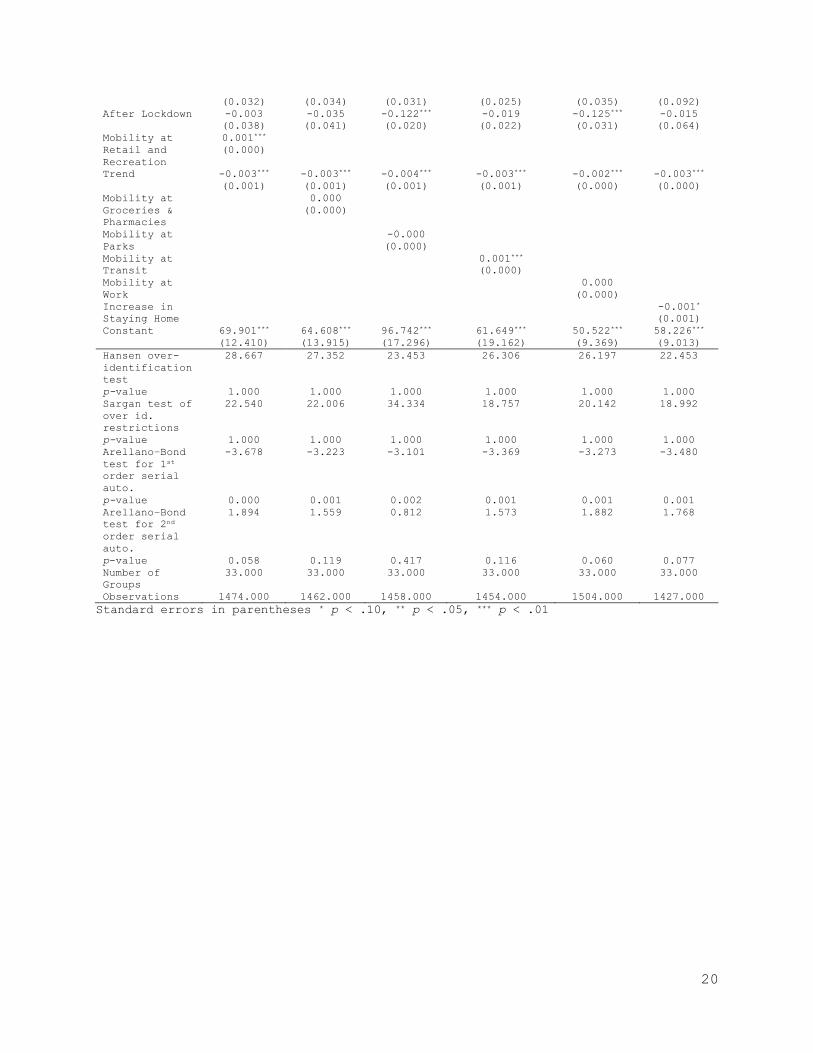
would be. Likewise, the types of mobility can also determine the impact
of lockdown. For instance, a substantial increase in staying at home and
a considerable reduction in public transports can help reduce the
infection and slow down its pace. While stringency index measures
government’s response, mobility can be treated as the citizens’
compliance in response to the government’s measures. Table 6-9 (shown
in the appendix) provide the effects of lockdown under various mobility
and stringency conditions. Again, it turns out that the lockdown reduces
the growth of infection in the developed countries no matter what
mobility variables are used as a control. For developing countries,
however, the coefficient of lockdown is significant only in a few
specifications, and so it is not robust. In the case of stringency
measures, similar findings are observed. Even some variables have
unexpected signs. For instance, school closure, in fact, does not help
reduce infection. For developed countries, all types of closings are
leaving expected impacts; but only a few variables have significant
coefficients for developing countries.
Discussion This study has shown that lockdown has been successful in reducing the
speed of infection spread in developed countries but not in developing
countries. In addition, not all government measures are equally
effective. While stringency has a little to do in curbing infection
growth, citizens’ response appears to be extremely useful in this regard.
In both developed and developing countries , staying at home is found
to be an effective measure to slow down the infection growth, and a
similar conclusion is drawn from other studies related to COVID-19
(Flaxman et al., 2020; Yilmazkuday, 2020b). Most interestingly, the
extent of income support has a substantial effect on reducing
transmission of diseases in the developing world.
Several key issues of discussion have spawned from this study. First,
government response teaming up with citizens’ responsibility turned out
to be instrumental in succeeding ‘flattering of the curve’. While most
of the draconian measures appear to have little or no effect in the
developing countries, staying at home help reduce the spread. Developing
countries cannot afford to provide continuous income support to the poor
for an extended period; if it can be done; a reduction of infection’s
growth can be possible.
Second, while the lockdown is essential, the timing is also equally
important. Surprisingly, developing countries that adopted lockdown
policies within 15 days of first case detection were not notably
successful in reducing infection compared to the countries that took
lockdown after 15 days. Though it may sound counterintuitive, it is quite
plausible. For instance, in Bangladesh, it was observed that people have
already reduced the mobility even before lockdown is enforced, and so
lockdown did not bring anything new in the table as far as the citizens’
response is concerned. On the other hand, many people may not fully
9
perceive the severity and the spreading capability of COVID-19 when the
number is too low. If the lockdown is enforced 30 days after the first
case, by the time, the population may see 50 to few hundred cases, and
this may help them under the true risk of spread which again can reduce
mobility and influence their behavior. And as the most of the countries
did not experience an explosion of cases within 30 days, contract
tracing, cluster lockdown instead nationwide lockdown and other
instruments could have effectively been applied. This strategy would
help keep economic activities alive without jeopardizing the
population’s health. Also, this can help reduce ‘compliance fatigue’.
Third, although many developing countries were quick in enforcing
lockdown, there was a significant mismanagement and lock of proper
planning to implement it. For instance, declaring lockdown a few days
early and allowing a lot of migrant workers to leave the city in congested
settings have increased the risk of higher spread. Moreover, income
support to the poor would be much less than ‘enough’ in the developing
countries(Biswas, n.d.).
Forth, seeing the successful containment of COVID-19 in China, and
getting recommendations from various international organizations, many
governments of the developing countries went on enforcing lockdown
without giving much-needed attention to other parts of the
recommendations such as increase the capacity of massive testing,
introducing contact tracing at scale, preparing the health system
especially increase in capacity of isolation. Without all these measures,
lockdown will not bring much health benefit, though the economic loss
expected to be massive (BD economy loses Tk 33b every day during
shutdown: Study, n.d.; Fraser, n.d.).
Some limitations of this study are worth mentioning. First, COVID-19
spread is still in place, so the current study uses the interim data,
and so inference made here may not persist in the long run. Second, most
of the dependent variables especially stringency related variables are
not continuous, rather ordinal, which might have some effects on the
results. Third, the inclusion of too many instruments may under-reject
the null, and so that might have resulted in more insignificant
coefficients for developing countries. Moreover, the presence
multicollinearity among few variables are very likely that might have
caused under-rejection of null. Forth, instead of estimating R0 or Rt—
the traditional measure infection growth--the current study uses the
growth of infection directly. However, interestingly the findings of
this study match with studies where R0 or Rt used for developed countries
(Flaxman et al., 2020; Yilmazkuday, 2020b), so this variable not
necessarily a weak one.
Conclusions The study shows that lockdown type measures are not highly effective for
developing countries even though these types of means are very effective

10
in developed nations. Nevertheless, staying at home order and income
support programs and other social distancing measures are found to be
effective for both developed and developing countries. In addition, the
timing of the lockdown also appears to matter. This study does not
suggest that lockdown should be enforced in the developing countries.
Rather, it suggests that lockdown should be combined with contact
tracing, extensive testing, income support for the poor, management of
informal or migrant workers—to make the lockdown effective. Merely
declaring lockdown, without other required measures, will hurt the
economy without contributing much to reducing the growth of infection.
Abbreviations:
GMM- Generalized Method of Moments
RCT- Randomized Control Trial
DiD- Difference -in – Difference
COVID-19- Coronavirsus Disease 2019
NPI- Non-Pharmaceutical Intervention
Declarations
Ethics approval and consent to participate: Only secondary and public
use data is used and so ethical approval and consent to participate
was required
Consent for publication: Author fully agree to publish it in the
journal. It is not funded project and single authored, no other
consent was required
Availability of data and material: All data, programme codes,
materials will be available on request
Competing interests: author declares no conflict of interest
Funding: No funding received for this work
Authors' contributions: SNS has done all article related work
Acknowledgements: Oxford University and Google for making data
available for public use

11
References Alvarez, F., Argente, D., & Lippi, F. (2020). A Simple Planning Problem for
COVID-19 Lockdown. SSRN Electronic Journal.
https://doi.org/10.2139/ssrn.3569911
Arellano, M., & Bond, S. (1991). Some Tests of Specification for Panel Data:
Monte Carlo Evidence and an Application to Employment Equations. The
Review of Economic Studies, 58(2), 277–297.
https://doi.org/10.2307/2297968
BD economy loses Tk 33b every day during shutdown: Study. (n.d.). Retrieved
from https://thefinancialexpress.com.bd/economy/bd-economy-loses-tk-33b-
every-day-during-shutdown-study-1587472624
Biswas, S. (n.d.). Coronavirus lockdown: Nobel prize economist says India
must do more for poor. Retrieved from https://www.bbc.com/news/world-
asia-india-52403589
Blundell, R., & Bond, S. (1998). Initial conditions and moment restrictions
in dynamic panel data models. Journal of Econometrics, 87(1), 115–143.
https://doi.org/https://doi.org/10.1016/S0304-4076(98)00009-8
Blundell, R., Bond, S., & Windmeijer, F. (2000). Estimation in dynamic panel
data models: Improving on the performance of the standard GMM estimator.
Advances in Econometrics, 15, 53–91. https://doi.org/10.1016/S0731-
9053(00)15003-0
Bursztyn, L., Rao, A., Roth, C., & Yanagizawa-Drott, D. (2020).
Misinformation During a Pandemic. SSRN Electronic Journal.
https://doi.org/10.2139/ssrn.3580487
European Centre for Disease Prevention and Control. (2020). No Title.
Retrieved from https://www.ecdc.europa.eu/en/publications-data/download-
todays-data-geographic-distribution-covid-19-cases-worldwide
Flaxman, S., Mishra, S., Gandy, A., Unwin, J. T., Coupland, H., Mellan, T.
A., … Bhatt, S. (2020). Estimating the number of infections and the
impact of non-pharmaceutical interventions on COVID-19 in 11 European
countries. Imperial College London, (March), 1–35.
https://doi.org/10.25561/77731
Fraser, D. (n.d.). Economic cost of coronavirus lockdown keeps on rising.
Retrieved from https://www.bbc.com/news/uk-scotland-scotland-business-
52307977
Google. (2000). Community Mobility Reports. Retrieved May 5, 2020, from 2020
website: https://www.google.com/covid19/mobility/
Hale, T., Petherick, A., Phillips, T., & Webster, S. (2020). Variation in
government responses to COVID-19. In Working Paper. Retrieved from
www.bsg.ox.ac.uk/covidtracker
Lau, H., Khosrawipour, V., Kocbach, P., Mikolajczyk, A., Schubert, J., Bania,
J., & Khosrawipour, T. (2020). The positive impact of lockdown in Wuhan
on containing the COVID-19 outbreak in China. Journal of Travel Medicine,
(March), 1–7. https://doi.org/10.1093/jtm/taaa037
12
Moghbelli, H., Ellithy, K., Eslami, Z., Vartanian, R., Wannous, D., El
Ghamrawy, A., … Nathan, G. J. (2020). Which interventions work best in a
pandemic? Block Caving – A Viable Alternative?, 21(1), 1–9.
https://doi.org/10.1016/j.solener.2019.02.027
Sampi, J. (2020). Nowcasting Economic Activity in Times of COVID-19 An
Approximation from the Google Community Mobility Report. (May).
Shimul, S. (2017). Public Policy , Firm Size Distribution , and Corruption.
University of Nebraska Lincoln.
wikipedia. (2020). National responses to the COVID-19 pandemic. Retrieved May
9, 2020, from
https://en.wikipedia.org/wiki/National_responses_to_the_COVID-19_pandemic
Yilmazkuday, H. (2020a). COVID-19 Deaths and Inter-County Travel: Daily
Evidence from the U.S. SSRN Electronic Journal, 1–28.
https://doi.org/10.2139/ssrn.3568838
Yilmazkuday, H. (2020b). Stay-at-Home Works to Fight Against COVID-19:
International Evidence from Google Mobility Data. SSRN Electronic
Journal. https://doi.org/10.2139/ssrn.3571708
13
TABLES
Table 1: Panel Regression with and without Stringency Index (1) (2) (3) (4)
Low Income High Income Low Income High Income
Lag of Total Cases
(100 thousand)
0.448
(0.292)
0.014
(0.009)
0.514
(0.418)
0.015
(0.010)
After Lockdown -0.046
(0.041)
-0.091***
(0.019)
-0.044
(0.047)
-0.020
(0.023)
Trend -0.005***
(0.001)
-0.004***
(0.000)
-0.005***
(0.001)
-0.003***
(0.000)
Stringency Index
0.000
(0.001)
-0.003***
(0.0001)
Constant 106.138***
(11.107)
80.064***
(6.222)
114.711***
(16.533)
55.529***
(8.710)
Observations 2956 6602 2615 5964
Adjusted R2 0.023 0.050 0.016 0.051
Standard errors in parentheses * p < .10, ** p < .05, *** p < .01
Table 2: Panel Regression with mobility and test (1) (2) (3) (4)
Low Income High Income Low Income High Income
Lag of .Total Cases (100
K)
0.528
(0.650)
0.019
(0.019)
-0.167
(0.559)
0.001
(0.011)
After Lockdown 0.036
(0.063)
-0.003
(0.030)
-0.052
(0.067)
-0.055***
(0.021)
Increase in Staying Home -0.007***
(0.002)
-0.005***
(0.001)
-0.003
(0.003)
-0.005***
(0.001)
Trend -0.004***
(0.001)
-0.005***
(0.001)
-0.004
(0.003)
-0.005***
(0.001)
Tests per thousand
0.023
(0.053)
-0.000
(0.001)
Constant 96.574***
(22.235)
113.277***
(12.466)
77.373
(55.155)
104.290***
(11.814)
Observations 1465 3822 370 1898
Adjusted R2 0.020 0.054 0.006 0.212
Standard errors in parentheses * p < .10, ** p < .05, *** p < .01
Table 3: System GMM Regression with Mobility and Stringency
(1) (2) (3) (4) Low Income High Income Low Income High Income
Lag of Growth of
Infection
0.319***
(0.045)
0.625***
(0.008)
0.366***
(0.135)
0.680***
(0.097)
Lag of Total Cases
(100 K)
-0.729
(0.710)
-0.002
(0.002)
0.136
(0.483)
0.000
(0.008)
Any Lockdown -0.016
(0.092)
0.011
(0.007)
-0.104
(0.242)
0.108
(0.127)
After Lockdown -0.015
(0.064)
-0.014***
(0.004)
0.091
(0.256)
-0.110
(0.114)
Increase in Staying
Home
-0.001*
(0.001)
-0.000
(0.000)
Trend -0.003***
(0.000)
-0.001***
(0.000)
-0.002
(0.002)
-0.000
(0.001) Stringency Index
-0.002
(0.001)
0.001
(0.001)
Constant 58.226***
(9.013)
28.370***
(0.661)
35.714
(34.107)
7.781
(14.454)
Hansen over-
identification test
22.453 67.861
p-value 1.000 1.000
Sargan test of over id.
restrictions
18.992 8.298 21.430 17.573
14
p-value 1.000 1.000 1.000 1.000
Arellano–Bond test for
1st order serial auto.
-3.480 -2.884 -5.094 -8.869
p-value 0.001 0.004 0.000 0.000
Arellano–Bond test for 2nd order serial auto.
1.768 1.301 2.449 3.963
p-value 0.077 0.193 0.014 0.000
Number of Groups 33.000 75.000 54.000 95.000
Observations 1427.000 3720.000 2552.000 5818.000 Standard errors in parentheses * p < .10, ** p < .05, *** p < .01
Table 4: Effects of Income Support
(1) (2)
Low Income High Income
Lag of Growth of Infection 0.185***
(0.014)
0.715***
(0.003)
Lag of Total Cases (100 K) -0.421
(0.289)
-0.002**
(0.001)
Any Lockdown -0.028
(0.020)
0.030***
(0.002)
After Lockdown -0.009 (0.019)
-0.027*** (0.002)
Income Support -0.018***
(0.003)
-0.001
(0.000)
Trend -0.003***
(0.000)
-0.000***
(0.000)
Constant 58.944***
(3.857)
5.291***
(0.255)
Hansen over-identification test 43.148 83.727
p-value 1.000 1.000
Sargan test of over id. restrictions 16.674 11.049
p-value 1.000 1.000
Arellano–Bond test for 1st order serial auto.
-4.231 -3.780
p-value 0.000 0.000
Arellano–Bond test for 2nd order serial
auto.
2.541 2.399
p-value 0.011 0.016
Number of Groups 48.000 89.000
Observations 2283.000 5407.000 Standard errors in parentheses * p < .10, ** p < .05, *** p < .01
Table 5: System GMM Regression with Timing of Lockdown2
(1) (2) (3) (4) (5) (6) (7) (8)
Within
15 Days
Within
30 Days
Within
45 Days
After 5
Days or
Within
15 Days
Within 30
Days
Within
45 Days
After 5
Days or
2 Empty cells mean no observation. And post lockdown variable is dropped as it is correlated with the timing of the lockdown
15
Never Never
Lag of
Growth of
Infection
-0.593*
(0.355)
-2.168
(1.676)
0.000
(.)
0.457***
(0.127)
0.286***
(0.004)
0.284***
(0.046)
0.474***
(0.069)
0.447***
(0.018)
Lag of Total
Cases (100 K)
-133.382
(93.241)
16.902
(38.520)
0.000
(.)
-0.441
(3.834)
1.564***
(0.144)
-0.488***
(0.073)
-4.495
(4.858)
0.001
(0.087)
Any
Lockdown
0.000
(.)
0.000
(.)
0.000
(.)
-0.372
(0.384)
0.000
(.)
-
176.476***
(25.811)
0.000
(.)
-0.000
(0.043)
After
Lockdown
0.000
(.)
0.000
(.)
0.000
(.)
0.000
(.)
0.000
(.)
0.000
(.)
0.000
(.)
0.000
(.)
Increase in
Staying
Home
-0.008**
(0.004)
0.019
(0.049)
0.691
(0.644)
-0.002**
(0.001)
-0.004***
(0.000)
-0.012***
(0.002)
0.006
(0.006)
-0.000
(0.000)
Trend 0.000***
(0.000)
-0.025
(0.038)
-0.000
(0.000)
-0.002
(0.002)
0.000***
(0.000)
0.008***
(0.001)
0.000***
(0.000)
-0.002***
(0.000)
Constant 0.000 (.)
553.289 (828.083)
0.000 (.)
42.282 (40.293)
0.000 (.)
0.000 (.)
0.000 (.)
49.926*** (5.381)
Hansen over-
identification
test
4.797 0.000 0.000 18.457 69.952 20.969 10.077 34.569
p-value 1.000 1.000 1.000 1.000 0.001 1.000 1.000 1.000
Sargan test
of over id.
restrictions
19.183 44.744 20.346 14.392 17.231 36.391 78.556 6.385
p-value 0.742 0.318 0.205 1.000 0.998 1.000 0.999 1.000
Arellano–
Bond test for
1st order serial auto.
-1.399 -0.656 -0.720 -2.885 -3.472 -1.344 -2.335 -2.107
p-value 0.162 0.512 0.471 0.004 0.001 0.179 0.020 0.035
Arellano–
Bond test for
2nd order
serial auto.
-0.013 -0.489 0.392 1.075 0.487 -0.802 1.209 1.235
p-value 0.990 0.625 0.695 0.283 0.626 0.423 0.227 0.217
Number of
Groups
8.000 5.000 2.000 23.000 32.000 28.000 15.000 39.000
Observations 45.000 48.000 23.000 916.000 240.000 217.000 176.000 1322.000 Standard errors in parentheses * p < .10, ** p < .05, *** p < .01
Appendix Table 6: System GMM Regression with Various Forms of Closures:
Developed Countries (1) (2) (3) (4) (5) (6) (7) (8)
Schoo
l
Work Public
Events
Public
Gather
ing
Public
Transp
ort
Stay
at
Home
Restricti
on on
Internati
onal
Travel
Internati
onal
Travel
Control
Lag of
Growth of
0.654*
**
0.707*
**
0.669**
*
0.676**
*
0.602**
*
0.657*
**
0.784***
(0.006)
0.793***
(0.008)

16
Infection (0.00
4)
(0.00
5)
(0.000
)
(0.002
)
(0.003
)
(0.00
3)
Lag of
Total Cases
(100 K)
-
0.004*
**
(0.00
1)
-
0.001
(0.00
1)
-
0.001**
*
(0.000
)
-
0.005**
*
(0.001
)
-
0.003**
(0.002
)
-
0.001
(0.00
1)
-0.001
(0.002)
-0.002
(0.002)
Any
Lockdown
0.219*
**
(0.00
4)
0.042*
**
(0.00
4)
0.093**
*
(0.001
)
0.050**
*
(0.004
)
-
0.011*
(0.006
)
-
0.009*
(0.00
5)
0.055***
(0.009)
0.066***
(0.005)
After
Lockdown
-
0.197*
**
(0.00
4)
-
0.050*
**
(0.00
3)
-
0.070**
*
(0.001
)
-
0.026**
*
(0.002
)
0.020**
*
(0.004
)
0.011*
**
(0.00
4)
-0.068***
(0.006)
-0.071***
(0.004)
C1_School
closing
0.038*
**
(0.00
1)
Trend 0.000*
*
(0.00
0)
-
0.000*
**
(0.00
0)
0.000**
*
(0.000
)
-
0.000**
*
(0.000
)
-
0.001**
*
(0.000
)
-
0.001*
**
(0.00
0)
0.000***
(0.000)
-0.000
(0.000)
C2_Workplac
e closing
0.002*
**
(0.00
0)
C3_Cancel
public
events
-
0.010**
*
(0.000
)
C4_Restrict
ions on
gatherings
-
0.002**
*
(0.000
)
C5_Close
public
transport
-
0.011**
*
(0.001
)
C6_Stay at
home
requirement
s
-
0.005*
**
(0.00
1)
C7_Restrict
ions on
internal
movement
0.011***
(0.001)
C8_Internat
ional
travel
controls
0.013***
(0.001)
Constant -
1.448*
*
(0.60
7)
5.210*
**
(0.36
8)
0.000
(.)
8.701**
*
(0.409
)
23.040***
(0.376
)
19.37
7***
(0.51
1)
-1.042***
(0.292)
0.204
(0.369)
Hansen 88.57 84.78 17485. 82.907 89.650 85.83 86.826 80.426

17
over-
identificat
ion test
5 4 186 1
p-value 1.000 1.000 0.000 1.000 1.000 1.000 1.000 1.000
Sargan test
of over id.
restriction
s
47.95
4
12.81
2
18.365 16.539 13.836 11.07
5
11.289 13.904
p-value 1.000 1.000 1.000 1.000 1.000 1.000 1.000 1.000
Arellano–
Bond test
for 1st
order
serial
auto.
-
3.972
-
3.974
-3.977 -3.903 -3.994 -
3.899
-3.950 -3.957
p-value 0.000 0.000 0.000 0.000 0.000 0.000 0.000 0.000
Arellano–
Bond test
for 2nd
order
serial
auto.
2.440 2.507 2.470 2.556 2.418 2.584 2.540 2.538
p-value 0.015 0.012 0.014 0.011 0.016 0.010 0.011 0.011
Number of
Groups
95.00
0
95.00
0
95.000 95.000 95.000 95.00
0
95.000 95.000
Observation
s
6039.
000
6027.
000
6033.0
00
5885.0
00
5992.0
00
5752.
000
6020.000 6009.000
Standard errors in parentheses * p < .10, ** p < .05, *** p < .01

18
Table 7: System GMM Regression with Various Forms of Closures:
Developing Countries
(1) (2) (3) (4) (5) (6) (7) (8)
School Work Public
Events
Public
Gatherin
g
Public
Transpor
t
Stay at
Home
Restriction
on
Internationa
l Travel
Internationa
l Travel
Control
Lag of Growth
of Infection
0.248***
(0.009)
0.282***
(0.013)
0.327**
*
(0.018)
0.207***
(0.015)
0.299***
(0.031)
0.292***
(0.018)
0.286***
(0.024)
0.292***
(0.018)
Lag of Total
Cases (100 K)
0.069***
(0.007)
0.099***
(0.007)
0.095
(0.542)
0.688
(0.458)
0.294
(0.355)
0.387
(0.384)
-0.756
(2.198)
-0.626
(0.492)
Any Lockdown 0.328***
(0.013)
-
0.121***
(0.016)
0.101**
*
(0.036)
-0.026
(0.038)
-0.049
(0.054)
-
0.142***
(0.041)
-0.019
(0.127)
0.000
(0.076)
After Lockdown -
0.400***
(0.014)
0.096***
(0.016)
-
0.130**
*
(0.039)
-0.044*
(0.027)
-0.009
(0.031)
0.120***
(0.036)
0.016
(0.038)
-0.108***
(0.038)
C1_School
closing
0.010***
(0.004)
Trend -
0.001***
(0.000)
-
0.003***
(0.000)
-0.001*
(0.001)
-
0.002***
(0.000)
-
0.002***
(0.000)
-
0.003***
(0.000)
-0.002**
(0.001)
-0.001**
(0.000)
C2_Workplace
closing
-
0.016***
(0.001)
C3_Cancel
public events
-0.035*
(0.019)
C4_Restriction
s on
gatherings
-0.007**
(0.003)
C5_Close
public
transport
-
0.027***
(0.005)
C6_Stay at
home
requirements
-
0.022***
(0.004)
C7_Restriction
s on internal
movement
-0.033
(0.021)
C8_Internation
al travel
controls
-0.058***
(0.007)
Constant 14.175**
*
(1.373)
67.626**
*
(2.389)
30.682*
(16.901
)
50.671**
*
(5.757)
45.294**
*
(8.855)
64.521**
*
(4.723)
43.439**
(21.475)
23.250**
(9.772)
Hansen over-
identification
test
49.105 48.903 49.820 49.578 46.202 52.378 50.460 40.388
p-value 1.000 1.000 1.000 1.000 1.000 1.000 1.000 1.000
Sargan test of
over id.
restrictions
48.690 15.531 28.647 26.323 15.614 22.304 21.093 20.658
p-value 1.000 1.000 1.000 1.000 1.000 1.000 1.000 1.000
Arellano–Bond
test for 1st
order serial
auto.
-4.568 -4.618 -4.652 -4.434 -4.830 -4.433 -4.714 -4.903
p-value 0.000 0.000 0.000 0.000 0.000 0.000 0.000 0.000
Arellano–Bond
test for 2nd
order serial
auto.
2.742 2.851 2.987 2.467 2.996 2.892 2.900 3.186
p-value 0.006 0.004 0.003 0.014 0.003 0.004 0.004 0.001
Number of
Groups
54.000 54.000 54.000 54.000 54.000 54.000 54.000 54.000
Observations 2645.000 2635.000 2621.00
0
2564.000 2613.000 2555.000 2620.000 2599.000
Standard errors in parentheses * p < .10, ** p < .05, *** p < .01

19
Table 8: System GMM Regression with Various Forms of Mobility:
Developed Countries
(1) (2) (3) (4) (5) (6)
Retail &
Recreation
Groceries Parks Transportation Workplace Stay at
Home
Lag of Growth
of Infection
0.720***
(0.010)
0.593***
(0.010)
0.572***
(0.010)
0.685***
(0.006)
0.656***
(0.009)
0.625***
(0.008)
Lag of Total
Cases (100 K)
-0.002
(0.001)
-0.004***
(0.000)
-0.005***
(0.001)
-0.003***
(0.001)
0.000
(0.002)
-0.002
(0.002)
Any Lockdown 0.033***
(0.008)
0.024***
(0.005)
0.031***
(0.003)
0.033***
(0.005)
0.018*
(0.009)
0.011
(0.007)
After Lockdown -0.042***
(0.007)
-0.025***
(0.003)
-0.033***
(0.003)
-0.029***
(0.003)
-0.025***
(0.008)
-0.014***
(0.004)
Mobility at
Retail and
Recreation
-0.000***
(0.000)
Trend -0.001***
(0.000)
-0.001***
(0.000)
-0.001***
(0.000)
-0.001***
(0.000)
-0.001***
(0.000)
-0.001***
(0.000)
Mobility at
Groceries &
Pharmacies
0.000***
(0.000)
Mobility at
Parks
-0.000***
(0.000)
Mobility at
Transit
-0.000**
(0.000)
Mobility at
Work
0.000***
(0.000)
Increase in
Staying Home
-0.000
(0.000)
Constant 11.832***
(1.193)
28.442***
(0.904)
30.938***
(1.318)
20.770***
(0.510)
24.502***
(0.805)
28.370***
(0.661)
Hansen over-
identification
test
65.803 69.481 68.680 66.346 70.397 67.861
p-value 1.000 1.000 1.000 1.000 1.000 1.000
Sargan test of
over id.
restrictions
8.865 10.384 10.898 10.198 10.917 8.298
p-value 1.000 1.000 1.000 1.000 1.000 1.000
Arellano–Bond
test for 1st
order serial
auto.
-3.170 -3.148 -2.884 -3.035 -3.146 -2.884
p-value 0.002 0.002 0.004 0.002 0.002 0.004
Arellano–Bond
test for 2nd
order serial
auto.
1.590 1.416 1.287 1.413 1.487 1.301
p-value 0.112 0.157 0.198 0.158 0.137 0.193
Number of
Groups
75.000 75.000 75.000 75.000 75.000 75.000
Observations 4029.000 3999.000 3787.000 3821.000 4124.000 3720.000
Standard errors in parentheses * p < .10, ** p < .05, *** p < .01
Table 9: System GMM Regression with Various Forms of Mobility:
Developing Countries (1) (2) (3) (4) (5) (6)
Retail &
Recreation
Groceries Parks Transportation Workplace Stay at
Home
Lag of Growth
of Infection
0.247***
(0.040)
0.239***
(0.039)
0.035
(0.029)
0.242***
(0.020)
0.302***
(0.052)
0.319***
(0.045)
Lag of Total
Cases (100 K)
0.254*
(0.143)
-0.011
(0.200)
0.323**
(0.160)
0.067
(0.283)
0.146*
(0.077)
-0.729
(0.710)
Any Lockdown -0.004 0.020 0.070** 0.022 0.081** -0.016
20
(0.032) (0.034) (0.031) (0.025) (0.035) (0.092)
After Lockdown -0.003
(0.038)
-0.035
(0.041)
-0.122***
(0.020)
-0.019
(0.022)
-0.125***
(0.031)
-0.015
(0.064)
Mobility at
Retail and
Recreation
0.001***
(0.000)
Trend -0.003***
(0.001)
-0.003***
(0.001)
-0.004***
(0.001)
-0.003***
(0.001)
-0.002***
(0.000)
-0.003***
(0.000)
Mobility at
Groceries &
Pharmacies
0.000
(0.000)
Mobility at
Parks
-0.000
(0.000)
Mobility at
Transit
0.001***
(0.000)
Mobility at
Work
0.000
(0.000)
Increase in
Staying Home
-0.001*
(0.001)
Constant 69.901***
(12.410)
64.608***
(13.915)
96.742***
(17.296)
61.649***
(19.162)
50.522***
(9.369)
58.226***
(9.013)
Hansen over-
identification
test
28.667 27.352 23.453 26.306 26.197 22.453
p-value 1.000 1.000 1.000 1.000 1.000 1.000
Sargan test of
over id.
restrictions
22.540 22.006 34.334 18.757 20.142 18.992
p-value 1.000 1.000 1.000 1.000 1.000 1.000
Arellano–Bond
test for 1st
order serial
auto.
-3.678 -3.223 -3.101 -3.369 -3.273 -3.480
p-value 0.000 0.001 0.002 0.001 0.001 0.001
Arellano–Bond
test for 2nd
order serial
auto.
1.894 1.559 0.812 1.573 1.882 1.768
p-value 0.058 0.119 0.417 0.116 0.060 0.077
Number of
Groups
33.000 33.000 33.000 33.000 33.000 33.000
Observations 1474.000 1462.000 1458.000 1454.000 1504.000 1427.000
Standard errors in parentheses * p < .10, ** p < .05, *** p < .01

21
Figure 1: Timing of lockdown (developing countries)
Figure 2: Timing of lockdown (developed countries)

22
Figure 3: Infections, various types of mobility and
stringency and their correlations (developed countries)
Figure 4: Infections, various types of mobility and stringency
and their correlations (developed countries)
23
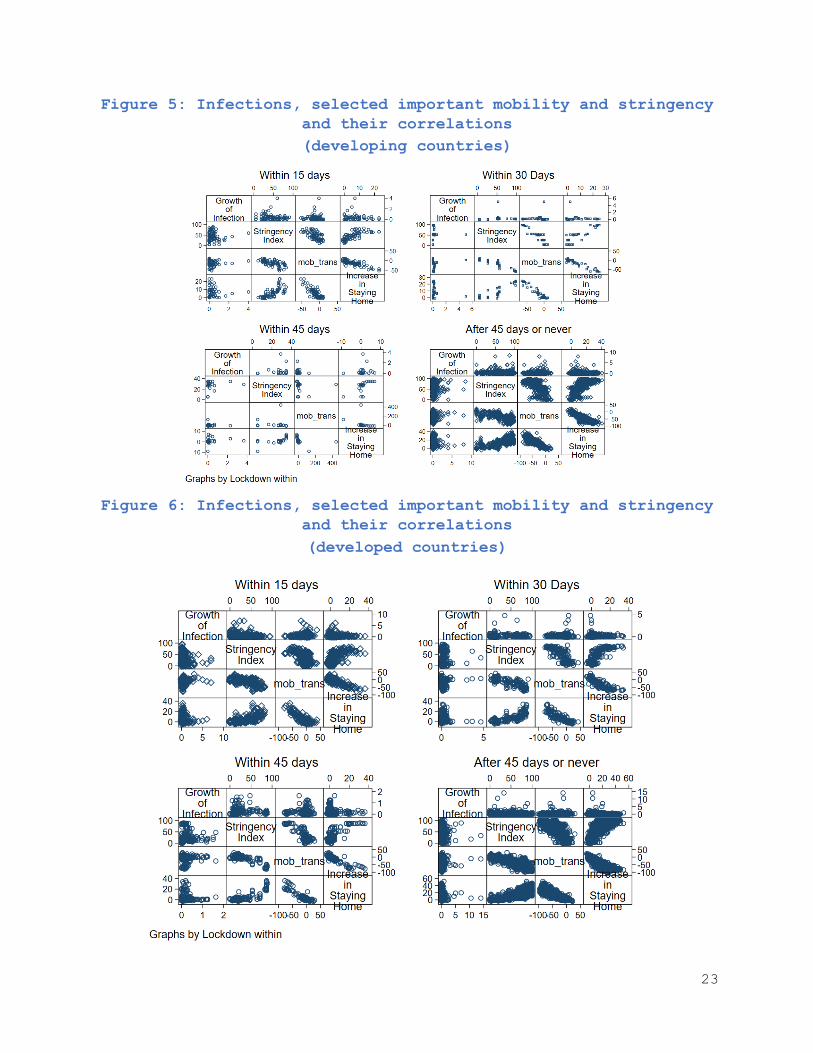
Figure 5: Infections, selected important mobility and stringency
and their correlations
(developing countries)
Figure 6: Infections, selected important mobility and stringency
and their correlations
(developed countries)
24
Figure 7: Infections rate and Income support
Figure 8: Lockdown and infection rate