can good politicians compensate for bad institutions
TRANSCRIPT

Can Good Politicians Compensatefor Bad Institutions?
Evidence from an original survey of Italian mayors∗
Maria Carreri†
First Draft: June 2017This Draft: January 2019
Abstract
Can competent political leaders bring significant policy changes to communitiesotherwise doomed by “bad” informal institutions? This question has remained unan-swered due to the lack of a convincing measure of politicians’ competence. I developa novel survey technique to overcome this challenge and apply it in interviews to 306Italian mayors. I study the impact of mayors’ competence on the policies they enactusing a difference-in-differences approach. Results show that more competent mayorsare associated with better policies but the association is only present in cases wherethe quality of informal institutions is low. In these municipalities, the election of morecompetent mayors translates into a more effective use of funds, an increase in long-terminvestments, and better service provision without an increase in taxes. Results holdacross different measures of institutional quality.
∗I am indebted to David Stasavage, Shanker Satyanath and Oeindrila Dube. I would also like to thank Alberto Alesina,Anthony Bertelli, Rachel Brule, Emine Deniz, Livio Di Lonardo, Vincenzo Galasso, Paola Giuliano, Miriam Golden, DorothyKronick, Horacio Larreguy, John Marshall, Tommaso Nannicini, Pablo Querubin, Cyrus Samii, Jacob Shapiro, Jeremy Spring-man, Edoardo Teso, Emily West and participants to the NYU Political Economy Workshop, the 2017 Midwest Political ScienceAssociation meeting, the 2017 Petralia Workshop, the 2017 Northeast Workshop in Empirical Political Science at Princeton, the2018 European Political Science Association meeting, and the 2018 American Political Science Association meeting for manyhelpful comments. I am grateful to Anci for their institutional support, to Francesco Porcelli at SOSE for sharing importantdata on the quality of service provision in Italian municipalities, and to Dr. Giancarlo Verde and Pasquale Recano at the ItalianMinistry of Interior. Beatrice Carella, Guido Deiana, Francesca Doniselli, Gloria Gennaro, Melissa Giorgio, Davide Laporta,Carlotta Piantieri and Alessandro Rossi provided excellent research assistance. All mistakes are my own.†Postdoctoral Fellow, Kellogg School of Management, Northwestern University,
1

1 Introduction
It is widely thought that the quality of institutions is a key determinant of the success orfailure of communities.1 Should we think of communities with poor institutions as doomedto poor policy outcomes? Or can competent individual leaders compensate for these deficien-cies? While the role of leaders has been studied in the corporate context, political leaders asdrivers of change have been largely overlooked in recent political economy literature.2 Theability of a government to achieve an efficient delivery of public goods might largely dependon the competence of its politicians. As is the case with firms’ managers, politicians mustset out clear objectives, monitor their implementation, and incentivize the bureaucracy toreach these objectives. Competent politicians who can achieve these goals might be able tomove their communities away from a “bad” governance equilibrium to a “good” one.
In this paper I use newly collected survey data to investigate whether competent politi-cians can compensate for low-quality institutions. I do this in three steps. First, I developan original survey instrument to measure a novel dimension of politicians’ competence: theirability as managers of their administration. I carry out a survey to collect data on thismeasure for a sample of 306 Italian mayors. Secondly, I examine whether more competentmayors make a more effective use of public funds and provide better services. Thirdly, I studyif the importance of politicians’ competence varies as a function of the quality of municipalinstitutions. Investigating the interaction between politicians’ competence and institutionalquality is at the center of this paper. The sign of this interaction is not ex-ante clear: politi-cians and institutions might be complements, i.e. it could be that competent politicianscan only make a difference if they work within a supportive institutional environment, orsubstitutes, i.e. it could be that competent politicians can make a difference exactly whereinstitutions are deficient. These two scenarios have very different implications and I try toadjudicate between them. I find that more competent mayors enact better policies - usefunds more efficiently thus increasing long-term investments and offering better services -where the quality of institutions at the local level is low.
One reason why the impact of politicians’ competence on policies has remained largelyunexplored is the difficulty in obtaining a convincing measure of competence. The existingliterature in political science and economics has measured competence with human capital.3
As a growing body of research suggests however, human capital is an insufficient measure1See Acemoglu and Robinson (2012), Algan and Cahuc (2010), Greif (1994), Khwaja (2009), Knack and
Keefer (1997), North and Thomas (1973), Tabellini (2010).2See Bertrand and Schoar (2003) and Bloom and Van Reenen (2007) for the role of corporate leaders. A
notable exception is Jones and Olken (2005)’s study of leaders’ deaths and their effect on economic growth,and more recently Berry and Fowler (2017) and Easterly and Pennings (2017).
3See for instance Besley and Reynal-Querol (2011), and Galasso and Nannicini (2011).
2

of political competence. Human capital can be confounded by class (Dal Bo et al. 2017)and, more importantly, there is little empirical evidence on its correlation with performance:more educated leaders are not less corrupt, do not pass more bills or govern wealthier nations(Carnes and Lupu 2015), and do not enact better policies (Lahoti and Sahoo 2017). More-over, education is only weakly correlated with politicians’ cognitive abilities and leadershipskills (Dal Bo et al. 2017).
In order to address these shortcomings, I designed a survey instrument to measure thecompetence of politicians. The survey methodology is inspired by Bloom and Van Reenen’s(2007) study of managerial competence in firms and evaluates how well each mayor: i) de-fines the objectives of her government mandate, ii) monitors the process of reaching theseobjectives, iii) knows the government’s daily operations, and iv) motivates and incentivizesthe bureaucracy. My measure specifically focuses on the managerial ability of executivepoliticians, i.e. their ability to perform the daily tasks involved in the planning and imple-mentation of their government mandate. The survey tries to obtain unbiased responses byusing a double-blind survey technique devised to minimize both interviewer and interviewee-induced bias.
With this measure, I explore the relationship between the competence of each mayor andthe policies she enacts, and I study how this relationship varies depending on the qualityof the informal institutions at the municipality level. I start by focusing on one of themain dimensions of an efficient use of public funds in Italy: the municipal surplus. Italianmunicipalities are expected to run a balanced budget and, while very few mayors run deficitsdue to sanctions, most mayors close the budget with a surplus. A large surplus, however,is undesirable because it entails leaving “on the table” unused revenues that often cannotbe budgeted in the following fiscal years, representing a waste of resources accrued throughcitizens’ taxation. Therefore we expect more competent mayors to run smaller surpluses.
To get causal traction on the effect of competence on the municipal budget, I build apanel of the municipalities in my sample exploiting the fact that data on the municipalsurplus is available both before and and after the interviewed mayor was elected. The panelnature of the data allows me to estimate a difference-in-differences model and establishthat municipalities that eventually elect a high vs. low-competence mayor exhibit similarlevels and trends of surplus in the years preceding the election. Results show that mayoralcompetence is significantly and sizeably correlated to the size of the municipal surplus onlyin Southern municipalities: a one point increase in the mean competence score (rangingfrom 1 to 5) is associated with a decrease in the surplus corresponding to 20 to 34 percentof its standard deviation. Mayoral competence is not associated with different levels ofsurplus outside of the South. Therefore, results suggest that competence only matters in
3

municipalities characterized by poor informal institutions. A long body of literature hasconsidered the Italian South as deficient in terms of informal institutions (Putnam 1993) dueto higher levels of corruption (Golden and Chang 2001), a stronger presence of organizedcrime (Pinotti 2015) and clientelism (Alesina et al. 2016, Chubb 1982).
Moreover, I show that the result on surplus is driven by an increase in capital expendi-tures, i.e. more competent mayors make more long-term investments, and this translates intoa better quality of service provision. Mayors in the right tail of the competence distributionin the South bridge the North-South gap (consisting of more than one standard deviation)in the quality of service provision.
Finally, I provide evidence that the differential impact of mayors’ competence betweenthe South and the rest of Italy is indeed driven by the difference in the quality of theirinformal institutions and not by any other South-specific characteristic. I show that resultsare robust to the use of three alternative measures of informal institutions at the local level:social capital, the presence of mafia organizations, and a behavioral measure of bureaucraticnorms.
By studying if competent politicians can compensate for bad institutions, this paperbrings two strands of literature closer together. On one hand, my paper builds on the liter-ature on the role of individual political leaders for policy (Berry and Fowler 2017, Easterlyand Pennings 2017, Jones and Olken 2005) and isolates the role played by politicians’ com-petence. One the other hand, much literature studies organizational capacity in the publicsector across developed (Bolton et al. 2016, Huber and McCarty 2004, Krause and Woods2014) and developing (Bertrand et al. 2018, Grindle 1997, Pepinsky et al. 2017) countries.In my paper, I establish how the role of politicians’ competence on policy can be moderatedby organizational capacity.
My paper also builds on studies employing Bloom and Van Reenen’s (2007) methodologyto assess managerial practices in different settings: bureaucrats (Rasul and Rogger 2017,Rasul et al 2017), school principals (Bloom et al. 2015, Di Liberto et al. 2015) and hospitalmanagers (McConnell et al. 2015).
Finally, by studying the ability of local politicians to affect policies, my paper can con-tribute to the larger debate on the role of local politicians, which suggests that local gov-ernments might be an ideal locus of policy change (Ferreira and Gyourko 2009, Gerber andHopkins 2011, Kirkland 2017).
The remainder of the paper is organized as follows. In the next section I briefly describethe institutional setting. In section 3, I present the survey methodology and the data col-lected. In Section 4, I describe the empirical analysis and present my results. Section 5concludes.
4

2 Institutional Framework
Each of the 8,003 Italian municipal governments is composed of an elected mayor (Sindaco),an executive body (Giunta) appointed by the mayor, and an elected city council (Consiglio).4
Municipal governments manage around 10 percent of Italian public expenditures and areresponsible for a vast array of services, such as municipal roads and infrastructure, thecreation and maintenance of school buildings, waste management, water supply, and socialservices. Here I describe the features of municipal governments that are represented in mysample, namely municipalities whose government was elected after the year 2000 and havingbetween 3,500 and 6,500 inhabitants.5
The mayor, elected with a single-round system to serve a 5-year mandate with a 2-termlimit for consecutive terms, holds executive power at the municipal level and is responsi-ble for the administration of the local government.6 One of the main responsibilities of eachmayor is to propose the annual budget to the municipal council that in turns approves it withmajority rule.7 The mayor enjoys a substantial amount of executive power and discretionover budget allocations (Bracco et al 2013, and Fabbrini 2001). Municipal revenues includetax revenues (municipalities can levy taxes on income and real estate, and for services suchas trash collection), transfer revenues (received from the national or regional governmentsor from the European Union) and a residual category encompassing revenues raised throughthe municipality’s assets or services (fees collected for services at the city hall, public trans-portation, touristic services, fines by the police, the use of municipal sport infrastructure).
On the expenditures side, current expenditures cover the municipality’s “operating costs”,such as wages and utilities, while capital expenditures refer to investments on projects thattypically span more than one budget year and are related to the building of infrastructure,such as roads and schools. Qualitative interviews carried out with a sub-sample of theinterviewed mayors show that there is consensus among mayors regarding two aspects ofcapital expenditures.8 First, spending more on capital rather than current expenditures is
4The number refers to the number of municipalities as of January 1, 2016. The number can vary marginallyyear by year as new municipalities are formed by merging or separating existing ones.
5The sample is representative of 84.3 percent of Italian municipalities in 2016.6Only mayors of municipalities with more than 100,000 inhabitants can appoint a separate managerial
figure (direttore generale), similar to a city manager.7The municipal council is responsible for overseeing the legislative activity of the mayor and approving
the proposed policies, most notably the annual budget proposed by the mayor, with majority rule. Twothirds of the seats in the municipal council are assigned to councilors in the mayoral coalition, and theremaining seats are assigned to the losing coalitions proportionally based on vote shares using the D’Hondtmethod.The size of the municipal council varies between 7 and 16 members depending on the year of theelection given several statutory changes mandating different municipal council sizes. The executive body iscomposed of a maximum of 4 members chosen by the mayor among the elected councilors.
8Qualitative interviews were carried out in the summer of 2017 with a sub-group of the interviewed
5

more challenging as it involves more planning on the side of the mayor: capital expendituresspan several years and require a series of permits and the presentation of a detailed project.Second, an increase in capital expenditures, conditional on being able to finance the necessaryservices, is desirable: 66 percent of the interviewed mayors list an investment project as oneof the top priorities of their government mandate. The evidence from qualitative interviewsis in line with trends found for U.S. mayors, who overwhelmingly list infrastructure projectas their mandate’s top priority (Einstein and Glick 2016).
Each municipality is expected to run a balanced budget.9 While deviations from a bal-anced budget towards a deficit (negative surplus) are subject to sanctions under certainconditions10, mayors do not face any restriction related to the size of the municipal surplus.Figure 1 shows that only a limited number of mayors incur in a deficit, while 85 percentof mayors close the budget with a positive surplus (with 60 percent of mayors incurring asurplus exceeding 10 percent of the budget, and 25 percent of mayors incurring a surplus ex-ceeding 20 percent of the budget). A large surplus however, is undesirable because it entailsleaving “on the table” unused revenues that cannot be budgeted in the following fiscal years.Qualitative interviews confirm that i) a vast majority of mayors considers achieving a mini-mal surplus a primary objective and “the clearest indicator of a virtuous administration”11,but ii) only some manage to deliver given the inherent challenges in obtaining a minimalsurplus, which requires a careful planning of revenues and expenditures for each budget yearand constant monitoring to ensure that expenditures are timely undertaken.12
mayors, drawing from both tails of the competence distribution across the South, North and Center.9The balanced budget principle is imposed by the Patto di Stabilità Interno (Internal Stability Pact)
regulating since 1999 the amount of debt that municipalities can reach through the yearly Financial Act.For instance, for the 2011-2013 period see Law 220/2010.
10See Law 220/2010 (1, 120).11Qualitative phone interview conducted by the author, July 2017.12The mean surplus is higher in Southern Italy with respect to Northern Italy by 14 per cent of a standard
deviation.
6

0
1
2
3
4
Density
-.75 -.5 -.25 0 .25 .5 .75Surplus
Figure 1: Distribution of the Municipal Surplus.
3 Measuring Competence
The competence of a politician is a complex concept encompassing a wide range of dimen-sions. The core of my survey is meant to measure the competence of executive politiciansas managers of their government, i.e. their ability to perform the daily tasks involved in theplanning and implementation of their government mandate. To the extent that acquiringskills requires effort, my measure captures both innate managerial skills and a politician’seffort to become a successful administrator by learning the tools necessary to manage herpolity. I do not claim that the competence score that my survey produces is a sufficient statis-tic of all the relevant characteristics that a high competence politician must possess. Forinstance, I neglect important characteristics that differentiate high from low quality politi-cians when running for office like, for instance, their ability to campaign and persuade voters.Similarly, my survey does not measure other relevant dimensions of politician’s quality suchas honesty (Besley 2005).
3.1 Survey Methodology
In order to obtain a reliable measure of politicians’ competence I carried out an original sur-vey of Italian mayors, with a methodology inspired by Bloom and Van Reenen (2007)’s studyof managerial competence in firms. Surveys that build on Bloom and Van Reenen (2007)have been used to evaluate the management practices of bureaucrats (Rasul and Rogger
7

2017, Rasul et al 2017)13, school principals (Bloom et al. 2015, Di Liberto et al 2015), andhospital managers (McConnell et al. 2015). This survey methodology has two fundamentalmerits. First, it is designed to address three critical issues in measuring individual compe-tence through a survey instrument: accurately scoring the competence of the interviewed,obtaining unbiased responses, and securing interviews. Second, it is not designed to mea-sure “outputs”, but rather the quality of the practices involved in producing said “outputs”.This is a crucial requirement to accurately measure politician’s competence, as the measureshould be independent of any external factor that contributes to the final policy outcomes.Bloom and Van Reenen (2007)’s survey focuses on a set of four practices in the managementof firms: target setting, performance monitoring, operations and incentives. This set of prac-tices is also important for a politician’s ability to implement good policies: a good politicianneeds to clearly set her objectives, constantly monitor the performance of the government inattaining these objectives, be knowledgeable of the daily operations of the government, andsuccessfully administer the bureaucracy. A contribution of this study is to formulate a setof survey questions that measure the competence of local politicians in these four areas. Inthe next sections, I describe the details of the survey questions and how interviewed mayorswere scored on the basis of their answers, as well as how the methodology addresses theimportant challenge of obtaining unbiased responses.
3.1.1 Scoring Interviews
The main goal of the survey is to measure the competence of politicians as administrators ofthe local government. This is achieved by posing questions that do not focus on the “output”of the mayors but rather deal with the practices involved in producing said output. Using ascoring grid, answers to each of the seven questions are scored from one (worst answer) tofive (best answer).
The seven practices are grouped in four categories, as in Bloom and Van Reenen (2007):target setting, performance monitoring, operations and incentives. The target setting sectionof the survey deals with the objectives that the mayor has set forth for her mandate. Re-spondents are evaluated on the basis of the clarity of their objectives (not the content of theobjectives), whether their objectives translate into practical targets, the interconnection andtime horizon of said targets, and the extent to which members of the administration and ofthe bureaucracy are given specific responsibilities in reaching the targets. The monitoringsection deals with tracking the performance of the government in attaining its objectives.In particular it asks whether the monitoring is informed by data, how often this monitoring
13Rasul and Rogger (2017) study civil servants across 63 organizations of the Federal Civil Service inNigeria and Rasul et al (2017) extend the study to Ghana’s civil service
8

takes place and down to which level of the government machinery are people involved in themonitoring process. The operations section investigates the mayor’s knowledge and over-sight over the procurement procedures of her municipality (one of the most important andtime consuming operations for municipal governments) and the efficiency in their implemen-tation. Finally, the incentives section deals with assessing how well the mayor incentivizesthe municipal bureaucracy, specifically by rewarding best performers and addressing/fixingworst performers among the bureaucrats.14 Each answer is evaluated in real time by theinterviewer who assigns a score ranging from one to five. The interviewer assigns the scorebased on a scoring grid containing the criteria that the mayor’s answer has to satisfy in orderto obtain each score. As a clarifying example, Table 1 shows the first question of the sur-vey, that falls under the target setting practice, with its scoring grid and three anonymizedexamples of three answers that were given a score of one, three and five respectively.15 Thefull survey instrument, with all questions divided by practice and relative scoring grid, is inthe appendix and reflects the order in which questions were asked during the survey. I usethe unweighted average across all individual scores assigned to each mayor as my measureof the mayor’s overall competence.
Finally, additional data is collected on the mayor’s party identification and years ofgovernment experience. These characteristics are collected at the end of the survey in orderto minimize the interviewer’s bias, as described in the next section.
3.1.2 Collecting Unbiased Responses
The data collected on politicians’ competence is potentially subject to both interviewee andinterviewer induced bias. The interviewee could answer untruthfully, systematically gearingher answer toward what she believes is the best answer. The interviewer might systematicallyunder or over score responses based on interviewees’ characteristics and preconceptions hemight have about the competence of the interviewee. In this section I describe how the useof a double-blind survey technique based on Bloom and Van Reenen (2007) minimizes thesetwo biases.
Interviewee bias, or bias from self-reporting, is minimized in two ways: mayors are un-aware of being scored and the questions they are posed are open (i.e. “What types of profes-sional development opportunities are provided for top performers?”) rather than being closed
14Mayors do not have the power to fire the bureaucrats working in the municipal government but they havea host of incentives at their disposal to address the performance of the bureaucrats, like a fund for monetaryincentives to be distributed among the top performers, disciplinary procedures against worst performers,and coaching methods. Moreover mayors can change bureaucrats’ assignment to specific offices with someappointments being more desirable than others.
15For the sake of clarity and comparability, Table 1 reports the anonymized answers of three mayors wholisted a similar objective.
9

Table 1: Example of question, scoring grid and anonymized answers
Score 1 Score 3 Score 5Scoring grid Objectives and targets are very
loosely defined. They do not cascade down throughout the administration.
Objectives are clearly defined and targets are defined for some of the objectives. They do cascade down but only to members of the administration.
Objectives have clearly defined associated targets. They cascade down to individual members of the admnistration and of the bureaucracy and increase in specificity as they cascade, defining individual expectations for each person.
Anonymized examples Defines objective as "Tourism". Does not identify practical targets.
Defines the objective as "Increasing Tourism". Identifies two practical targets (redecorating the old town; establishing an info point for tourists). Assigns responsibilities to a member of the executive.
Defines the objective as "Reaching x tourists per year". Identifies three practical targets (redecorating the main square of the old town; establishing an annual festival; creating a bike path through the municipality's national park). Assigns responsibilities to a member of the executive and one bureaucratic office through a timetable.
a) Could you describe the main objectives that you set for your term in office?b) Which practical targets are associated to each of these main objectives?c) How are these targets cascaded down to individual members of the government and of the bureaucracy?
(1) Target Inter-Connection
(i.e. “Do you provide professional development opportunities for top performers[yes/no]?”)so as not to clearly indicate a “best” and a “worst” answer.
Interviewer bias is limited by the fact that the interviewer has no information on theperformance of the municipality. Moreover, since the mayors interviewed represent smalland medium Italian municipalities, the interviewer is unlikely to have any information andtherefore preconceptions about the mayor or her municipality. Each interviewer reported,for each interviewed municipality, whether he i) had ever heard about it, ii) had visitedit, and iii) had any knowledge regarding its administration. Interviewers reported havingheard about 10 percent, having visited 1.4 percent and having prior knowledge about none ofthe municipalities whose mayors were interviewed. Finally, all interviewers went through atraining workshop during which much emphasis was placed on scoring each answer separately,based on the scoring grid rather than on the overall impression of the interviewee. I furthervalidated the reliability of the data collected by double scoring a random subset of theinterviews. The correlation coefficient between the quality scores assigned by 2 differentinterviewers on this subset of interviews is 67 percent.1617
16As a comparison, Bloom and Van Reenen (2007), obtain a correlation coefficient of 73 percent.17Moreover, each interviewer conducted an average of 40 interviews, allowing to account for interviewer
fixed effects in the analysis. This controls for an interviewer’s general tendency to over- or under-scoreresponses irrespective of the interviewees’ characteristics. Including interviewer fixed effects produces resultsthat are qualitatively similar to the ones presented here. These results are available upon request.
10

3.1.3 Obtaining Interviews
Obtaining a high response rate was key given the size of the target population yet challenginggiven the characteristics of the survey, such as the fact that mayors are busier and harderto reach than the average survey respondent, the interviewer has to pass a series of screens(telephone switchboard and secretary of the mayor), and participation was not compensated.The achieved response rate was of 50.2 percent, which is comparable to the response rate of54 percent obtained in a similar setting in Bloom and Van Reenen (2007). Several steps weretaken to maximize the response rate. Firstly, in order to encourage mayor’s responses weportrayed their participation as least controversial as possible by i) presenting the interviewas a “conversation” and without mentioning the word “interview” or “survey”, ii) nevermentioning or asking about the performance or fiscal soundness of the municipality, andiii) by stressing throughout that the project we were inviting the mayors to take part towas an academic endeavor. Moreover, questions were presented to the mayor with the leastcontroversial questions leading the interview (question on target setting: “Which objectivesdid you set for your mandate and which practical targets are these objectives associatedto? How are these targets cascaded down to the individual members of the administrationand the municipal bureaucracy?”). Finally, securing the institutional endorsement of Anci(Association of Italian Municipalities), an apolitical non-profit organization representingItalian Municipalities, was key in proving to the mayors that they were being invited toparticipate in a worthwhile project with official support.
Each interviewed mayor was contacted by phone an average of 5 times before the actualinterview. At the beginning of the process, each mayor was contacted by phone and receiveda short description of the project and an invitation to participate, followed by an emailpresenting the project in details and sharing the letter of support by the Association ofItalian Municipalities. The body of the email and the letter of support are shown in theappendix. All subsequent phone calls were necessary to set up a date and time for theinterview and to conduct the interview. Each mayor was contacted and interviewed by oneinterviewer only.
3.2 Competence Score and other data
The data on the competence of politicians was collected between March and September of2016 and it comprises phone interviews to 306 Italian mayors. I complement the survey datawith administrative records from the Italian Ministry of Interior on the budget outcomesof each municipality and on the demographic characteristics of the interviewed mayors. Iobserve budget outcomes for each year during which the interviewed mayor is in power as
11

well as for the four years preceding her first term in office. In this section I first describethe sampling frame and discuss the representativeness of the sample, secondly I describethe distribution of the measure of politicians’ competence, I then discuss the validity andreliability of my competence measure.
Table 2 presents summary statistics for all available characteristics of the interviewedmayors and of their municipalities and for budget outcomes of the municipalities. TablesA1-A3 present separate descriptive statistics for the same variables for the Italian North,South and Center separately. Mayors are classified as having had an high-skilled job asprevious employment if they were professionals (such as doctors and lawyers, engineers orarchitects), had a skill-intensive or administrative white collar occupation (such as highschool teachers) or were managers/self-employed. Jobs classified as having a low skill con-tent are blue collar occupations and low skilled white collar occupation. I further distinguishmayors who were, before taking office, unemployed or outside of the labor force, such aspensioners or students. The variable Mafia Presence is an indicator recording if any busi-ness, building or good was confiscated in 2015 by the Italian police forces because of mafiainvolvement. The variable was obtained from Agenzia Nazionale per l’Amministrazione e laDestinazione di Beni Sequestrati e Confiscati alla Criminalita Organizzata, the national au-thority in charge of assets confiscated from organized crime. The variable Low Social Capitalis an indicator taking value one for municipalities having a value of the social capital indexbelow the 25th percentile of the social capital index distribution, a value corresponding tothe 40th percentile in the Italian South. The social capital index is an inverse covarianceweighted index (Anderson 2008) constructed using data from Nannicini et al (2013) on blooddonations, number on non profit organizations, number of non-sport daily newspapers sold,answer to trust question in the World Value Survey, and turnout in the most recent referen-dum. The indicator Sent Letter Back is an original behavioral measure of the efficiency ofthe municipal postal office, as described in section 5.5.2. All budget variables are winsorizedat the one percent level to reduce the influence of outliers but results shown in the paperare insensitive to this choice. The municipal surplus is expressed as a function of the totalbudget size. All budget variables are expressed in per capita euros. Table 2 shows that whilebeing low on average, the municipal surplus shows a large variance.
12

Table 2: Summary statistics
Mean Std. Dev. Min. Max. N
Panel A: Cross-Sectional Variables
Mayor characteristicsMean Competence Score 3 0.84 1 5 306Age 52.37 10.33 28 81 306Female 0.13 0.34 0 1 306Job - High Skill 0.68 0.47 0 1 303Job - Low Skill 0.19 0.4 0 1 303Job - Unemployed/Pension 0.12 0.33 0 1 303Education - Less than Highschool 0.05 0.22 0 1 306Education - Highschool 0.42 0.49 0 1 306Education - University 0.53 0.5 0 1 306Years of Government Experience 13.02 7.9 0 41 306Year in Office 2.43 0.84 1 5 306Party - Left 0.17 0.37 0 1 306Party - Centre Left 0.39 0.49 0 1 306Party - Centre/Independent 0.22 0.41 0 1 306Party - Centre Right 0.21 0.41 0 1 306Party - Right 0.01 0.11 0 1 306
Municipality characteristicsPopulation 4946.29 770.03 3555 6468 306Low Social Capital 0.21 0.41 0 1 306No Letter 0.15 0.36 0 1 306Mafia Presence (in south) 0.07 0.25 0 1 75
Panel B: Panel VariablesSurplus 0.13 0.11 -0.13 0.36 2362Total Expenditures (euros per capita) 1185.81 554.29 473.45 3863.21 2362Total Revenues (euros per capita) 1183.96 556.25 463.43 3798.69 2362Current Expenditures (euros per capita) 569.31 217.37 269.42 1562.92 2362Capital Expenditures (euros per capita) 259.84 302.47 12.25 1990.57 2362Other Expenditures (euros per capita) 208.05 212.83 46.47 1119.35 2362Tax Revenues (euros per capita) 441.85 181.84 104.65 1165.12 2362Transfer Revenues (euros per capita) 150.86 129.06 9.56 644.35 2362Other Revenues (euros per capita) 578 442.45 130.28 2661.91 2362Quality of Service Provision Index 6.17 2 1 10 190
3.2.1 Sampling Frame and External Validity
In the survey, I focus on small and medium-sized municipalities as they make up for roughly90 percent of all Italian municipalities.18 From this population I extracted a random sam-ple of 610 municipalities and invited the respective mayors to participate to the study. Of
18In 2016, municipalities having a resident population between 3,500 and 6,500 inhabitants made up 84.3percent of all Italian municipalities.
13

these, 306 accepted to participate to the interview. While the sample of mayors who werecontacted was randomly selected, the subsample of those who accepted to participate wasnot. This raises the concern that the mayors surveyed and their municipalities might system-atically differ from those who declined to be interviewed, threatening the external validityof the results of this study. Table 3 shows t-tests for the difference in means between themayors who declined and those who accepted to be interviewed, for all available mayor andmunicipality-specific characteristics as well as municipality-level outcomes. Table 3 showsthat the interviewed mayors (and their municipalities) do not systematically differ fromthose mayors (and their municipalities) who declined the interview. Table ?? in the Ap-pendix shows balance across the two groups within the Italian South, North and Centreseparately.
Table 3: Balance between interviewed and non-interviewed mayors
Declined Accepted s.e. ofInterview Interview Difference Difference
Panel A: Mayor characteristicsFemale 0.16 0.13 -0.02 (0.03)
Age 51.46 52.37 0.91 (0.83)
Job - High Skill 0.72 0.68 -0.04 (0.04)
Job - Low Skill 0.14 0.19 0.06 (0.03)*
Job - Unemployed/Pensioner 0.12 0.12 0.00 (0.03)
Education - Less than Highschool 0.06 0.05 -0.01 (0.02)
Education - Highschool 0.38 0.42 0.05 (0.04)
Education - University 0.57 0.53 -0.04 (0.04)
Panel B: Municipality characteristicsTotal Revenues (euros per capita) 1205.82 1192.59 -13.22 (41.76)
Total Expenditures (euros per capita) 1182.11 1172.74 -9.37 (40.57)
Surplus 0.19 0.19 -0.00 (0.00)
Observations 304 306 310
Notes: The number of observations for the variables Job - High-skill, Job - Low-skill, and Job -Unemployed is 289 for the non-interviewed sample. *** is significant at the 1 percent level, ** issignificant at the 5 percent level, * is significant at the 10 percent level.
14

3.2.2 The distribution of mayors’ competence
Panel A of Figure 2 plots the distribution of the mean competence score for each mayor forthe entire sample. There is a large spread in competence, with a considerable number ofmayors being scored extremely poorly or extremely well. Overall, the variation is high, witha variance in the overall sample of .84 for the competence measure ranging from 1 to 5.
Panels B, C, and D show the distribution of the competence score across the three Ital-ian geographic macro-regions: South, North and Center. The mean value of the competencescore as well as the spread of the distribution are comparable across the three areas, suggest-ing that a large portion of the variation shown in the full sample is driven by variation withinthe three areas rather than across them. While the mean value of the competence score ishigher in Central Italy, followed by Northern and Southern Italy (corresponding to values of3.14, 2.99, and 2.92 respectively), most of the overall variation shown in Panel A (standarddeviation of .84) is coming from within-area variance (.83) rather than between-area variance(.11).
3.2.3 Validity of the Competence Score
My original measure of politicians’ competence is valuable if it meets a minimum of twoconditions: i) it meaningfully captures the competence of a politician, and ii) it explains adimension of politicians’ competence that is not captured by other readily available measures.In this section I provide two suggestive tests that my measure meets the two conditionsmentioned above.
If my variable satisfies condition i, it should correlate with politicians’ characteristics thatintuitively correlate with their competence. If my variable satisfies condition ii, a substantialportion of its variation should be unaccounted for by the alternative measures of politicians’competence employed in the literature. I test these claims in Table 4 which shows coefficientestimates and the R-squared for a set of OLS regressions of my original measure of politicianscompetence on a series of mayor and municipality-specific characteristics. Column (1) showsthat my measure of quality is negatively correlated with age and that female and malemayors do not seem to differ, on average, in terms of their managerial competence. Column(2) shows that both high school and university graduates have higher competence scores thanmayors who have not completed high school.19 Column (3) reports the correlation betweenthe quality score and the skill content of the previous job held by the mayor before takingoffice. We can see that mayors with a high-skilled or low-skilled job perform better in terms
19The coefficients on Education ´ HighSchool and Education ´ University are indistinguishable fromeach other. I cannot reject that their difference is different from zero, with a p-value of 0.76.
15

Figure 2: Distribution of the Competence Score across Italy.
0
.2
.4
.6
.8
1
Den
sity
1 2 3 4 5Competence Score
Panel A: Full Sample
0
.2
.4
.6
.8
1
Den
sity
1 2 3 4 5Competence Score
Panel B: South
0
.2
.4
.6
.8
1
Den
sity
1 2 3 4 5Competence Score
Panel D: Center
0
.2
.4
.6
.8
1
Den
sity
1 2 3 4 5Competence Score
Panel C: North
Notes: The plots above represent the distribution of the competence measure of mayors for the full sample,and only mayors in Southern, Northern and Central Italy respectively. The red vertical lines mark the meanvalue for each of the four samples. The sample size in the four plots is 306 in the full sample, 75 in theSouth, 180 in the North, and 51 in the centre. The mean value of the competence score is 2.99 in the fullsample, 2.92 in the South, 2.99 in the North, and 3.14 in the Centre.
of the quality score than those mayors who were unemployed or out of the labour force (likepensioners and students).20 Columns (4) shows that, conditional on educational attainmentand skill content of the previous job, the competence score is not correlated to the lengthof the mayor’s career as a local administrator. Columns (5) to (7) suggest no systematicassociation between the politicians’ self-declared party identification and their competencescore.
Looking at the R-squared in columns (1) through (7), we can see how the residual varia-tion in my measure of competence is sizeable. Columns (5) to (7) further include fixed effects
20The coefficients on Job´Highskill and Job´Lowskill are indistinguishable from each other. I cannotreject that their difference is different from zero with a p-values of 0.88.
16

for the party of the mayor, for the year of the term that the mayor is serving (one throughfive), and for the macro region where the mayor was elected (South, Centre, North). Column(7), in which the most comprehensive set of variables is included, shows that only 17 percentof the variation in the competence score is accounted for. Table 4 provides evidence that myoriginal measure of politicians’ competence is positively correlated to standard measures ofpoliticians’ human capital but at the same time the latter measures leave a sizeable portionof the politicians’ competence unexplained. This is not surprising in light of the evidencethat i) human capital is an insufficient measures of competence (Carnes and Lupu 2015,Lahoti and Sahoo 2017, Dal Bo et al. 2017) that ii) does not adequately capture at leasttwo relevant dimensions of my competence score: leadership (Dal Bo et al. 2017) and effort.
Table 4: Correlates of the Competence Score
Dependent Variable: Mean Competence Score(1) (2) (3) (4) (5) (6) (7)
Age -0.014*** -0.014*** -0.010** -0.012** -0.012** -0.013** -0.014**(0.005) (0.005) (0.005) (0.005) (0.005) (0.005) (0.005)
Female -0.052 -0.066 -0.077 -0.058 -0.104 -0.125 -0.108(0.139) (0.139) (0.137) (0.138) (0.139) (0.143) (0.150)
Education - Highschool 0.505** 0.527** 0.552** 0.510** 0.511** 0.466**(0.225) (0.226) (0.227) (0.228) (0.230) (0.231)
Education - University 0.476** 0.459** 0.488** 0.450* 0.445* 0.458*(0.223) (0.230) (0.231) (0.235) (0.236) (0.239)
Job - High Skill 0.428*** 0.403*** 0.397** 0.395** 0.428***(0.152) (0.154) (0.153) (0.154) (0.157)
Job - Low Skill 0.408** 0.401** 0.393** 0.403** 0.443**(0.182) (0.182) (0.182) (0.184) (0.187)
Years of Government Experience 0.007 0.007 0.006 0.006(0.006) (0.006) (0.007) (0.007)
Party - Left 0.249 0.253 0.269(0.154) (0.155) (0.163)
Party - Centre Left 0.229* 0.230* 0.188(0.127) (0.129) (0.134)
Party - Centre Right -0.009 -0.025 -0.066(0.146) (0.149) (0.158)
Party - Right 0.549 0.574 0.815*(0.422) (0.424) (0.431)
Observations 306 306 303 303 303 303 303R-squared 0.029 0.045 0.073 0.077 0.100 0.107 0.172Year of Term FE X XArea FE XNotes: The education variables refer to the highest completed educational level. The excluded category is “Less than High School”. Thejob variables refer to the last job held by the politician before taking office. I classify as high-skilled all professionals (lawyers, doctors,engineers, architects), self-employed and individuals holding administrative white collar jobs. Jobs classified as low skill are blue collarjobs and non-administrative white collar jobs. The excluded category includes individual who are unemployed or out of the labor force(pensioners, students, housewives). The excluded category for the party is an indicator taking value one if the mayor self-identifies as“centrist” or “independent”. Year of term fixed effects control for the year (1 to 5) of the current mandate that the mayor is serving.Areas are North, Centre and South. *** is significant at the 1 percent level, ** is significant at the 5 percent level, * is significant atthe 10 percent level.
17

3.2.4 Reliability of the Competence Score
My measure of politicians’ competence could suffer from measurement error. I present aseries of tests that lends support to the reliability of my competence score measure.
First, I validated the reliability of the data collected by double scoring a random subsetof 43 interviews. The inter-rater reliability, i.e. the correlation coefficient between thecompetence scores assigned by 2 different interviewers on this subset of interviews, is 0.675(p-value of 0.000). The relationship is shown graphically in Panel A of Figure 3. Moreover,as shown in Panel B of the same figure, there is no relationship between the degree ofmeasurement error in the scoring and the competence score: this means that high scores areas likely to be well measured as average and low scores.
Second, I show that the four components of the competence score are strongly positivelycorrelated. Table 5 shows the coefficients from a series of pairwise regressions of the compo-nents of the competence score: with an average coefficient of .432, these correlations suggestthat mayors who score high in one of the components of the competence score are likelyto score high also on the other components. Moreover, as an alternate measure of internalreliability consistency, I calculate the Cronbach’s alpha (Cronbach, 1951) of the competencescore which yields a value of .754.
Table 5: Reliability of competence: pairwise correlations of components
PerformanceTarget Setting Operations Monitoring
Operations .382***Performance Monitoring .405*** .456***Incentives .459*** .402*** .486***Notes: Each coefficient reported in the table is from a regression of the variable reported in the columnon the variable reported in the row and a constant term using the 306 observations in the cross-sectionaldataset. *** is significant at the 1 percent level, ** is significant at the 5 percent level, * is significant at the10 percent level.
Finally, the results presented in the rest of the paper are not driven by any single com-ponent of the mean competence score: as shown in Table A7 in the Appendix, results arerobust to excluding from the competence score, one at a time, i) each of the four managementpractices, or ii) each of the seven questions that compose the competence score.
18

Figure 3: Reliability of the Competence Score.
12
34
5C
ompe
tenc
e Sc
ore
Inte
rvie
wer
2
1 2 3 4 5Competence Score Interviewer 1
A: Inter-rater reliabiilty
0.5
11.
5M
easu
rem
emnt
Err
or
1 2 3 4 5Competence Score Interviewer 1
B: Measurement Error and Competence Score
Notes: Panel A shows the correlation between the competence scores assigned tothe same mayor by the two different interviewers. Panel B shows the correlationbetween the measurement error in the competence score (calculated as the ab-solute value of the difference of the two scores in Panel A) and the competencescore by interviewer 1.
4 Empirical Strategy and Results
In order to study the effect of the mayor’s competence on policies, I employ two empiricalstrategies. I first explore the relationship descriptively with a cross-sectional analysis con-trolling for a wide set of mayor-specific and municipality-specific characteristics. Second,
19

to address the concern about unobservable determinants of both mayoral competence andoutcomes, I use a difference-in-differences model exploiting the availability of the outcomesvariables for the years preceding the election of the interviewed mayors. Throughout, theeffect of mayoral competence is analysed as a function of the institutional environment inwhich the mayor operates.
4.1 Cross-Section
Using data on the quality of the mayors interviewed during the summer of 2016 and couplingit with administrative records on the budget of their municipality for all years during whichthe interviewed mayors were in power, I build an unbalanced panel of 306 municipalities overthe 2010-2015 period. Using this data, I estimate the following model:
yit “ βMeanCompetenceScorei ` αr ` γ1Xi ` εit (4.1)
where yit is a budget outcome of municipality i for year t of the mandate of the interviewedmayor, the variable of interest MeanCompetenceScorei records the mean competence scoreof the mayor of municipality i. The variable αr represent region fixed effects,21 while thematrix of controls Xi includes the party of the elected mayor, the mayor’s age, gender, educa-tional attainment, years of government experience and skill content of previous employment.Standard errors are clustered at the municipality level.
I start by studying the correlation between mayors’ competence and the relative size ofthe municipal surplus which is, as explained in the institutional background section, one ofthe main dimensions of an efficient use of public funds in the Italian context: we expectmore competent mayors to achieve a smaller surplus, all else constant.22 Panel A of Table 6presents results for the entire sample, while Panels B, C and D present results for the subsetof municipalities in the Italian South, North and Center respectively. Mayors with highercompetence scores are associated with a reduction in the municipal surplus in Southern Italyonly. The coefficient of interest is consistent across specifications and the effect is sizeable inmagnitude: a one point increase in the competence score ranging from 1 to 5 is associatedwith a decrease ranging from 1.9 to 3.2 percentage points in the surplus as a function ofthe overall budget size, an effect ranging between 20 percent to 34 percent of the dependentvariable’s standard deviation. Appendix Table A5 shows that the difference in the effect in
21Italy’s 8003 municipalities are divided among 20 regions. All regions are represented in the sample withthe exception of Valle d’Aosta.
22The variable is constructed as T otalRevenues´T otalExpendituresT otalExpenditures
20

the South vs. the rest of Italy is statistically significant.
Table 6: Competence Score and Budget Surplus
(1) (2) (3) (4)Surplus Surplus Surplus Surplus
Panel A: Full SampleMean Competence Score 0.001 0.001 0.002 0.002
(0.005) (0.005) (0.005) (0.005)
Observations 939 927 927 927Municipalities 306 303 303 303R-squared 0.069 0.073 0.081 0.093SD DV 0.0907 0.0911 0.0911 0.0911
Panel B: SouthMean Competence Score -0.019* -0.028** -0.033** -0.032**
(0.011) (0.014) (0.014) (0.014)
Observations 240 233 233 233Municipalities 75 73 73 73R-squared 0.138 0.180 0.211 0.230SD DV 0.0934 0.0939 0.0939 0.0939
Panel C: NorthMean Competence Score 0.008 0.009 0.010 0.011
(0.006) (0.006) (0.007) (0.007)
Observations 552 547 547 547Municipalities 180 179 179 179R-squared 0.090 0.096 0.111 0.118SD DV 0.0892 0.0895 0.0895 0.0895
Panel D: centerMean Competence Score 0.001 -0.014 -0.007 -0.004
(0.008) (0.011) (0.014) (0.015)
Observations 147 147 147 147Municipalities 51 51 51 51R-squared 0.099 0.222 0.246 0.262SD DV 0.0916 0.0916 0.0916 0.0916
Mayor Controls X X XParty FE X XYear of Term FE XNotes: The dependent variable is the value of the per-capita municipal surplus relative to the budget size(total revenues minus total expenditures) over total expenditures, winsorized at the 1 percent level. Thestandard deviation of the dependent variable is reported in the table. All specifications include fixed effectsfor the year, region, and interviewer. Mayor controls include: i) the gender of the mayor, ii) the age of themayor, iii) the mayor’s previous occupation, and iv) the mayor’s educational attainment. Standard errorsclustered at the municipality level are shown in parenthesis. *** is significant at the 1 percent level, ** issignificant at the 5 percent level, * is significant at the 10 percent level.
21

4.2 Difference-in-Differences
The results presented in the cross-sectional analysis are subject to two related potential con-cerns: municipalities that elect a more competent mayor might be more likely to experience,in the pre-election years, i) lower levels of surplus, or ii) a decreasing trend in surplus. In thissection I address these two concerns. Exploiting fact that information on each municipality’ssurplus is available also for the years preceding the election of the interviewed mayor and Ibuild a panel in which each municipality is observed for a maximum of four years precedingand four years following the election of the interviewed mayor. Because of the staggerednature of Italian local elections, the election year for the mayors in my sample ranges be-tween 2005 and 2015. First, I establish that municipalities that eventually elect a high vs.low-competence mayor exhibit similar levels of surplus in the years preceding the election.This is evident from Table 7 showing the average effect of mayoral competence on budgetoutcomes in each of the four years preceding the election of the mayor. Municipalities thateventually elect a high-competence mayor do not show on average any difference in the levelof surplus with respect to municipalities that eventually elect a low-competence mayor, inany of the pre-election years.
Table 7: No difference in pre-election surplus for high vs. low-competence mayors
(1) (2) (3) (4)Surplus Surplus Surplus Surplus
(Full Sample) (South) (North) (Centre)
Mean Competence Score ˆ year 1 -0.005 -0.003 -0.003 -0.016(0.007) (0.017) (0.011) (0.011)
Mean Competence Score ˆ year 2 0.008 0.021 0.003 -0.003(0.007) (0.016) (0.010) (0.017)
Mean Competence Score ˆ year 3 -0.007 0.000 -0.006 -0.021(0.007) (0.016) (0.009) (0.014)
Mean Competence Score ˆ year 4 -0.001 -0.003 0.000 -0.006(0.007) (0.013) (0.010) (0.014)
Observations 1,212 293 586 201Municipalities 305 74 147 51R-squared 0.075 0.109 0.066 0.129SD Surplus 0.106 0.115 0.104 0.0968Notes: the specification includes fixed effects for each year preceding the election year. Standard errorsclustered at the municipality level are shown in parenthesis. *** is significant at the 1 percent level, ** issignificant at the 5 percent level, * is significant at the 10 percent level.
Second, I use a difference-in-differences model to show that i) municipalities that eventu-ally elect a high-competence mayor exhibit similar trends in surplus in the years precedingthe election, and ii) the effect of the competence of the interviewed mayor on surplus mate-rializes only after her election. Intuitively, if the selection concern is valid, we would expectmunicipalities that elect better mayors to follow a different trend in terms of their surplus
22

even before the election. We rule out this concern by incorporating a placebo test in theanalysis shown above: I show that the quality of the mayor does not affect the municipalsurplus before her election. Specifically, I compare the differential change in surplus beforeand after the election of the interviewed mayor between municipalities where better andworse mayors are elected.23 I estimate:
yit “ αi ` βt ` γpMeanCompetenceScorei ˆ Posttq ` δy `
mÿ
k“1λkpxki ˆ Posttq ` εit (4.2)
where t represents a normalized measure of years, indexing the number of years since theinterviewed mayor of municipality i was elected, with t “ 0 being the election year. Mu-nicipality fixed effects, αi, control for any time-invariant municipality-specific characteristicthat has an effect on budget outcomes. Normalized year fixed effects, βt, control for po-litical budget cycles, addressing the possibility that the municipal surplus changes for allmunicipalities as the election approaches. The coefficient of interest, γ, captures the averagedifference in surplus for municipalities with better mayors after the mayor’s election relativeto before the election. The calendar year fixed effects, δy control for year-specific effects.The k controls xi are the ones in the matrix Xi in equation 4.1 and 4.2. Standard errors areclustered at the municipality level.
The crucial assumption of this design is that the budget of municipalities that elect bettermayors would have evolved similarly to the budget of municipalities that elect worse mayorsin absence of the treatment (i.e. the election of mayors with different competence levels).To provide evidence in support of this assumption, I analyze whether there are differentialpre-trends in surplus between municipalities that will elect mayors of different competencelevels by estimating a version of equation (4.2) where the effect of MeanCompetenceScorei
is allowed to vary flexibly over time:
yit “ αi ` βt `
`4ÿ
t“´4γtMeanCompetenceScorei ` δy `
`4ÿ
t“´4λ1tXi ` εit (4.3)
23This is similar to the approach used in Bandiera et al (2018) to evaluate the effect of CEO performance,measured cross-sectionally through a survey, on firm productivity.
23

Table 8: Competence Score and Budget Surplus - Diff-in-Diff
(1) (2) (3) (4)Surplus Surplus Surplus Surplus
Panel A: Full SampleMean Competence Score ˆ Post -0.001 -0.002 -0.002 -0.001
(0.004) (0.005) (0.005) (0.005)
Observations 2,362 2,362 2,339 2,339Municipalities 306 306 303 303R-squared 0.690 0.697 0.869 0.699SD Surplus Pre 0.109 0.109 0.109 0.109
Panel B: SouthMean Competence Score ˆ Post -0.024*** -0.024*** -0.036*** -0.036***
(0.007) (0.007) (0.009) (0.010)
Observations 588 588 571 571Municipalities 75 75 73 73R-squared 0.746 0.749 0.897 0.761SD Surplus Pre 0.120 0.120 0.120 0.120
Panel C: NorthMean Competence Score ˆ Post 0.010 0.010 0.009 0.008
(0.007) (0.007) (0.008) (0.008)
Observations 1,143 1,143 1,143 1,143Municipalities 147 147 147 147R-squared 0.668 0.676 0.851 0.680SD Surplus Pre 0.107 0.107 0.107 0.107
Panel D: centerMean Competence Score ˆ Post -0.002 -0.009 -0.017* -0.003
(0.009) (0.009) (0.010) (0.015)
Observations 382 382 382 382Municipalities 51 51 51 51R-squared 0.703 0.718 0.907 0.747SD Surplus Pre 0.0978 0.0978 0.0978 0.0978
Region FE X X XMayor Controls X XParty FE XNotes: See Table 6 for table notes. The variable Post is an indicator taking value one for each year of theinterviewed mayor’s first term. The standard deviation of the dependent variable in the pre-period is reported inthe table. All specifications include fixed effects for the municipality, the year since the mayor was elected, andthe calendar year. All controls, as well as region and party indicators, are interacted with the Post indicator.
Table 8 confirms the cross-sectional results reported in Table 6, i.e. we see that bettermayors are associated, in the Italian South only, with a reduction in the municipal surplus.The effect is consistent across specifications and economically meaningful: an increase inone unit of the competence score ranging between 1 and 5 leads to a reduction between 2.4and 3.6 percentage points in the municipal surplus as a function of the budget size, effects
24

corresponding to 20 percent and 30 percent of a standard deviation in the outcome in theperiod preceding the election of the interviewed mayor. Appendix Table A6 shows that thedifference in the effect in the South vs. the rest of Italy is statistically significant.24
Crucially, Figure 4 shows that the decrease in surplus observed in municipalities thatelect better mayors takes place precisely after the new mayor is elected, with no differentialpre-trends in surplus in the years leading up to the election. Intuitively, the change inthe surplus of each municipality in the years preceding the election does not predict thecompetence of the new mayor elected at time zero.
Figure 4: Timing of surplus reduction in the South
-.1
-.08
-.06
-.04
-.02
0
.02
.04
γ es
timat
es
-4 -3 -2 -1 0 1 2 3 4Years since mayor elected
Notes: The coefficient plot above represents the coefficient estimates γt from the difference-in-differencesmodel in equation (4.3). Dotted lines plot the 95 percent confidence intervals.
Table 4 has shown that the competence of the interviewed mayors is correlated to anumber of their characteristics. Leveraging the availability of some of these characteristics(age, education level and skill content of the previous job) for the previous mayors for eachmunicipality, Panel A of Table 9 shows that there is no correlation between the competenceof the interviewed mayor and any of the available characteristics (age, education and skillcontent of previous job) of the previous mayor. Moreover, Panel B of Table 9 shows that thereis no persistence over time in the characteristics of elected mayors. The evidence presented
24The results presented in the rest of the paper are not driven by any single component of the competencescore. Appendix Table A7 shows that results are robust to excluding from the competence score, one ata time, i) each of the four management practices, or ii) each of the seven questions that compose thecompetence score. Appendix Table A8 reports for the South the effect of each of the four components ofthe competence score, i.e. the scores received by the mayors for target setting, performance monitoring,operations, and people management, and shows that the four dimensions of competence contribute similarlyto the effect reported in Panel B of Table 8.
25

in Table 9 suggests that the competence of the interviewed mayor should be uncorrelated tothe competence of the previous mayor, further alleviating the selection concern.
Table 9: No Correlation with Previous Mayor’s Characteristics in the South
(1) (2) (3) (4) (5) (6) (7)Previous Mayor’s
Job Job Job Education Education EducationAge High Skill Low Skill Unemployed ăHighschool Highschool University
Panel AMean Competence Score 1.017 -0.003 0.003 -0.001 0.034 -0.061 0.027
(1.021) (0.068) (0.049) (0.059) (0.023) (0.064) (0.066)
Observations 73 73 73 73 73 73 73R-squared 0.014 0.000 0.000 0.000 0.030 0.013 0.002
Panel BDependent Variable 0.121 0.105 0.220* 0.283 - -0.104 -0.141for interviewed Mayor (0.083) (0.160) (0.123) (0.302) - (0.122) (0.125)
Observations 73 71 71 71 73 73 73R-squared 0.029 0.006 0.044 0.013 0.000 0.010 0.018Notes: See the data section for a description of the variables. The unit of observation is the municipality. The coefficient incolumn (5) of Panel B is missing because no previous mayor had completed less than highschool. *** is significant at the 1percent level, ** is significant at the 5 percent level, * is significant at the 10 percent level.
In light of Table 4 showing the correlation between competence and other characteristicsof the mayor such as education and previous occupation, one might wonder if these char-acteristics have an effect on the budget surplus conditional on the competence score of themayor. Table A9 in the Appendix rules out this concern.
The estimates shown in Table 8 are calculated using an unbalanced sample. For instance,if an interviewed mayor was elected for the first time in 2013, her municipality would appearin the dataset for the years 2009-2015, i.e. for all four years preceding the election but foronly two years following it. In order to rule out the concern that results are driven by thesample composition in the pre and post election years, I estimate equation (4.2) for thesubset of municipalities whose budget data is available for the full ˘4 years window aroundthe mayor’s election. Appendix Table A10 shows robustness to this sample restriction.
Finally, we want to rule out the possibility that the negative effect of competence onsurplus is driven the small number of municipalities with a budget deficit, i.e. a negativesurplus. Appendix Table A11 shows that results are virtually unchanged if the absolutevalue of the surplus is used as a dependent variable.
4.3 Better mayors and more long-term investments
Results show that more competent mayors manage the budget more efficiently by closingthe gap between revenues and expenditures. In this section, I investigate how better mayors
26

attain this reduction in surplus. Better mayors may affect the expenditure side of thebudget, by raising capital or current expenditure of the municipality, or they may affect therevenue side, through taxation and transfers from the central government. The first columnof Table 10 shows that mayors with a higher competence score are especially able to raisetotal expenditures. Columns (2) to (4) further show that the increase in total expendituresis explained by an increase in capital rather than current expenditures, i.e. better mayorsare spending more in long term investments such as infrastructure building and multi-yearprojects. An increase of one unit in the Mean Competence Score is associated to an increasein capital expenditures of 92 euros per capita, corresponding to 26 percent of the meanvalue of capital expenditures in the South over the four pre-election years. The effect ofcompetence on the ability to raise capital expenditures is consistent with evidence frommy survey showing that 66 percent of the interviewed mayors listed at least one capitalinvestment among the main objectives of their mandate. The higher likelihood of competentmayors to deliver capital investments might stem from a longer time-horizon or from agreater ability to put together the necessary bureaucratic and monetary resources to approvemore complicated projects. These results are in line with the evidence for U.S. mayors whooverwhelmingly identify an increase in infrastructure investment projects as their top priority(Einstein and Glick 2016).
Importantly, competent mayors increase capital investments without increasing taxes(column 6). While there is a small increase in total revenue, which is marginally significantat the 10 percent level (p-value 0.09), this is not driven by an increase in taxes, but ratherby a modest increase in the residual component of budget revenues, mostly consisting offees collected for municipal services (among others fees collected for services at the cityhall, public transportation, touristic services, fines by the police, the use of municipal sportinfrastructure).
Table 10: Competence Score and Surplus Components in the South
Expenditures RevenuesTotal Current Capital Other Total Taxes Transfer Other(1) (2) (3) (4) (5) (6) (7) (8)
Mean Competence Score ˆ Post 150.244** 18.039 78.813** 54.462* 91.614* -9.529 16.309 77.107(57.575) (13.058) (33.795) (32.048) (53.166) (10.704) (11.202) (48.377)
Observations 571 571 571 571 571 571 571 571Municipalities 73 73 73 73 73 73 73 73R-squared 0.610 0.875 0.347 0.672 0.610 0.929 0.897 0.545SD Surplus Pre 551.8 184.3 385.1 230.6 552.4 164.8 151.9 496.2Notes: See Table 8 for table notes. The dependent variables are expressed in per capita terms and are winsorized at the 1 percentlevel.
27

4.4 Better mayors and better service provision
Do the lower surplus and higher capital expenditures associated with more competent mayorstranslate into better public goods for the municipality’s citizens? In order to investigate thisquestion I use data on the quality of service provision in each municipality in my sample.It is key to investigate the effect of competence on policies by coupling the data on publicspending presented so far with data on the quality of service provision, since it is welldocumented that the cost of public investment does not directly translate into the value ofexisting capital (Golden and Picci 2005, Olken 2007, Pritchett 2000). Starting in 2010, theItalian Ministry of Economic Affairs and Finance, appointed a task force that gathered andanalyzed data for each municipality on its expenditures and on the quantity and qualityof services provided.25 The resulting measure, available for the years 2010 and 2013 only,is a municipality-level index ranging between 1 and 10, which measures how virtuous eachmunicipality is by weighting i) the quality of its services vis-a-vis the quality of servicesprovided by comparable municipalities, and ii) the amount spent on these services vis-a-visthe expenditure of comparable municipalities.26 Coefficients in Table 11 shows the effect ofan increase in the quality of the elected mayor on the index of services quality in the ItalianSouth (column 1), North (column 2) and Center (column3). While the small sample sizelimits the external validity of the results, Table 11 shows that, in line with results presentedso far, the election of a high-quality mayor translates into better services provision onlywhere the quality of institutions is lower. An increase of one unit in the Mean CompetenceScore of the elected mayor in the South leads to an increase, after the election, of .74 in theindex of quality of service provision ranging from 1 to 10. The magnitude of the effect issizeable as it roughly corresponds to .4 of a standard deviation in the dependent variable.Effectively, competent mayors in the South bridge the North-South gap in the quality ofservice provision. This can be seen in Figure 5. Here the North-South gap is represented bythe vertical distance between the two red lines. Southern mayors lying in the right tail of thecompetence distribution partly bridge this gap by achieving levels of the quality of serviceprovision index that are within one standard deviation of the average level in the North (redline in Panel A).
25The reliability of the measure of service quality is subject to the caveat that performance measurementsystems could be used as political discipline mechanisms even when performance measures are compiled byformally independent administrative agencies (Bertelli and John 2010).
26For a detailed methodological note on the index construction see Porcelli et al. (2016) and http://www.mef.gov.it/ministero/commissioni/ctfs/.
28

Table 11: Competence Score and Quality of Service Provision
(1) (2) (3)Quality Quality Quality
of Services of Services of Services(South) (North) (Centre)
Mean Competence Score ˆ Post 0.744** 0.389 -0.386(0.347) (0.313) (0.496)
Observations 48 101 28Municipalities 25 54 15R-squared 0.794 0.752 0.725SD DV Pre 1.862 1.714 1.875Sample South North CenterNotes: The dependent variable is an index of service provision quality ranging from 1 to 10.All specifications include fixed effects for the municipality and the year since the mayor waselected. *** is significant at the 1 percent level, ** is significant at the 5 percent level, * issignificant at the 10 percent level.
Figure 5: Competent southern mayors bridge the North-South service provision gap
4
5
6
7
Qua
lity
of S
ervi
ce P
rovi
sion
1 2 3 4 5Competence Score
Panel A: North
4
5
6
7
Qua
lity
of S
ervi
ce P
rovi
sion
1 2 3 4 5Competence Score
Panel B: South
Notes: The binned scatter plots above displays the relationship between the mean competence score and thequality of service provision index in 2013, when the interviewed mayors were in office. I construct 5 equallysized bins of the competence scores given to each mayor and, for each bin, plot the value of the serviceprovision index of the mayor’s municipality. The horizontal red lines represent the mean quality of serviceprovision in the pre-election period, i.e in 2011, in the North (Panel A) and in the South (Panel B).
29

4.5 Alternative measures of institutions
It is theoretically ambiguous whether the quality of institutions and that of politicians arecomplements or substitutes. On one hand, if better institutions enhance the ability of goodmayors to operate, institutions and mayoral quality will act as complements. On the otherhand, mayoral competence may play an increasingly significant role as the quality of insti-tutions becomes worse. Intuitively, competent politicians could have a larger impact wherelow quality institutions leave more room for improvement, while high quality institutionsmight impose a ceiling effect on the marginal impact of a politician.27
Results presented so far seem to provide evidence in favour of the substitutability betweenpoliticians’ and institutions’ quality, showing that more competent politicians are effectivein the Italian South only. I have so far attributed this heterogeneity to the lower qualityof institutions in the South vis-a- vis the rest of Italy. However, the different effect ofpoliticians competence in the South vis-a-vis the rest of Italy could be due to any otherSouth-specific characteristics that moderates the effect of competence. In this section, Istrengthen my interpretation by employing three alternate municipality-level measures ofinstitutional quality as an alternative to the crude North-South distinction and I show thatresults are consistent across these three measures.
I focus on informal institutions, since formal institutions are constant across Italy. Whileformal political institutions (such as the mayoral powers, the rules governing the bureaucracy,the budgetary rules) are the same throughout Italy, their proper functioning is conditionalon the presence of the appropriate informal institutions (Stokes 2006), intended here ascreating or strengthening incentives to comply with formal institutions (Helmke and Levitsky2004). A long body of literature has emphasized that the South is more deficient in terms ofinformal institutions, due to the inherent difficulties presented by a setting with lower socialcapital (Putnam 1993) more corruption (Golden and Picci 2005), clientelism (Alesina et al.2016, Chubb 1982), and a stronger presence of organized crime (Pinotti 2015). Measuringinformal institutions is empirically challenging, given their unwritten nature (Helmke andLevitsky 2004). I focus here on three alternative aspects of informal institutions that canbe measured in a meaningful way at the municipality level in Italy and each of the threemeasures of institutional quality, I estimate the equation below.
27Institutions have been found to operate as ceiling effects in a wide variety of contexts, such as economicreform (Acemoglu et al 2008), the effectiveness of hereditary rule (Besley and Reynal-Querol 2017), anddevelopment projects design (Khwaja 2009).
30

yit “ αi ` βt ` γpMeanCompetenceScorei ˆ Postt ˆ PoorInstitutionsiq`
` δpMeanCompetenceScorei ˆ Posttq ` λpPoorInstitutionsi ˆ Posttq`
` κy `
mÿ
k“1ρkpxki ˆ Posttq ` εit
(4.4)
where PoorInstitutionsi is an indicator taking value one for every municipality i character-ized by a low-level of institutional quality as measured by, respectively, social capital, mafiapresence and bureaucratic norms. I describe each of these three measures in detail below.
4.5.1 Social Capital
I test whether the effect of mayoral competence is heterogenous with respect to the levelof social capital in a municipality. Social capital is intended to capture the unwritten rulesof trust and reciprocity in a community that can affect the functioning of democratic in-stitutions (Fukuyama 1995, Gambetta 1988, Knack and Keefer 1997, La Porta et al 1997,Putnam 1993). I use data on social capital at the municipality level from Nannicini et al(2013). I construct an inverse covariance weighted index of social capital (Anderson 2008) foreach municipality in my sample based on the following variables: blood donations, numberon nonprofit organizations, number of non-sport daily newspapers sold, answer to the trustquestion in the World Value Survey, and turnout in the most recent referendum. Based onthis measure, I construct an indicator of low social capital, taking value one for all munic-ipalities in the sample whose social capital is below the 25th percentile of the distribution,a value corresponding to the 40th percentile in the Italian South. Column (1) of Table 12shows that a one unit increase in the mayor’s competence score in municipalities character-ized by low social capital decreases the municipal surplus by 2.8 percentage points, an effectequivalent to 28 percent of a standard deviation in the pre-election surplus, while we see noeffect for the remaining municipalities. However, since social capital is lower in Southernmunicipalities as shown in Appendix Tables A1 to A3, it could be the case that Southernmunicipalities are driving the effect of the Low Social Capital indicator. To address thisconcern, column (2) presents a horserace between the South and the Low Social Capitalindicators and shows that the effect of low social capital is not entirely driven by Southernmunicipalities. As expected, the coefficient in column (2) is smaller than in column (1),since social capital is only one dimension of the overall quality of informal institutions. Theremaining dimensions are captured by the South indicator.
31

4.5.2 Mafia Presence
I look at the presence of mafia organizations as an additional dimension of informal insti-tutions (Gambetta 1993, Lauth 2000). The presence of organized crime can affect the jobof a mayor through several channels, such as making the procurement operations more del-icate given the threat of corruption. I employ a municipality-level measure of the numberof businesses, goods and buildings confiscated for mafia involvement by the Italian policethat however, given the distribution of organized crime in Italy, has a meaningful variationacross and within regions in the South only.28 Column (3) of Table 12 shows that the effectof more competent mayors on the budget surplus is stronger in municipalities with mafiapresence, where a one-point increase in the Mean Quality Score leads to an average reduc-tion in surplus of about 46 percent of a standard deviation, while the average reduction inmunicipalities without mafia presence is of 25 percent of a standard deviation.
4.5.3 Letters experiment
Finally, I collect a behavioral measure of bureaucratic norms from a group of bureaucratswho are not under the mayor’s supervision: postal office workers. While the rules governingthe bureaucracy are formal institutions, their efficacy is affected by the informal normsof bureaucratic behavior (Hamilton-Hart 2000). I send to each of the municipality in mysample a letter addressed to a fictitious recipient at a fictitious address but bearing thecorrect municipality name and postal code.29 Italian municipal postal offices are responsiblefor returning to the sender any letter mailed to an incorrect address. As in Chong et al(2014), I record whether each letter is returned and use it as a proxy for the quality ofbureaucratic norms. This measure presents two advantages. First, it is available for thewhole sample. Second, postal offices operate in each municipality but do not depend fromthe mayor or the municipal government.30 Note that this measure of institutional quality isorthogonal to the North-South divide, with the median return rate of my letters being similaracross the North, South and Center. The analysis performed in column (4) is underpoweredin light of the fact that for only 15 percent of municipalities the letter was not returned to thesender. However, results presented in column (4) of Table 12 are qualitatively in line withthose presented in columns (1) to (3) and confirm the substitutability between the qualityof mayors and that of the local institutions by showing that the effect of high-competencemayors in the whole sample is driven by those municipalities whose postal office did not
28More details in the additional data section in the Appendix.29All letters were addressed to Giovanni Verde in Via Atlante 36 and were all sent from the same zip code
on the same day.30As required by the DDL 261/1999, all municipalities in my sample have a postal office.
32

comply with the rule of sending back the letter.
Table 12: Heterogeneous effect with alternative measures of institutional quality
(1) (2) (3) (4)Surplus Surplus Surplus Surplus
(in South)
Mean Competence Score ˆ Post ˆ Low Social Capital -0.028*** -0.018*(0.010) (0.010)
Mean Competence Score ˆ Post ˆ South -0.022**(0.011)
Mean Competence Score ˆ Post ˆ Mafia Presence -0.056**(0.023)
Mean Competence Score ˆ Post ˆ No Letter -0.014(0.014)
Mean Competence Score ˆ Post 0.006 0.008 -0.030*** 0.000(0.005) (0.006) (0.011) (0.005)
Observations 2,011 2,011 571 2,339Municipalities 262 262 73 303R-squared 0.689 0.689 0.898 0.870SD DV Pre 0.110 0.110 0.120 0.109Notes: See table 8 for table notes.
5 Conclusion
In this paper, I ask to what extent politicians’ competence as managers of the public admin-istration matters for policy and if it can compensate for low-quality informal institutions.I develop a survey instrument to measure the competence of executive politicians and Iadminister it to a representative sample of Italian mayors.
The election of more competent mayors translates into a more effective use of funds, anincrease in long-term investments, and better service provision without an increase in taxes,only where the quality of institutions is low. This is true across a series of different measuresof institutional quality: Southern versus Northern Italy, presence of organized crime, socialcapital, and a behavioral measure of the efficiency of local bureaucratic norms.
The results of my paper point to the fact that the quality of elected politicians andthe quality of informal institutions act as substitutes rather than complements. Mayoralcompetence plays an increasingly significant role as the quality of institutions become worse.In light of these findings, efforts to increase the managerial competence of local politiciansmay represent a cost-effective way of increasing the quality of public goods provision.
While the focus of this paper is on Italian mayors, its findings are likely to be rele-vant across different settings. The role of local governments and their executive politicianshas recently drawn considerable attention in the U.S. context (Arnold and Carnes 2012,
33

Tausanovich and Warshaw 2014), with local policies representing an increasing share of gov-ernment activities (Trounstine 2009). Recent evidence suggests that local governments mightbe the very place where significant policy change can take place, given the lower relevanceof partisan polarisation in this context (Ferreira and Gyourko 2009). Applying the method-ology that I developed in this paper to the study of politicians managing U.S. municipalgovernments represents a promising area of future research.
34

References
Acemoglu, Daron, Simon Johnson, Pablo Querubin, and James A. Robinson.2008. “When Does Policy Reform Work - The Case of Central Bank Independence.” Brook-ings Papers on Economic Activity 1: 351-418.Acemoglu, Daron, and James A. Robinson. 2012. Why Nations Fail? New York:Crown Publishers.Alesina, Alberto, Salvatore Piccolo, and Paolo Pinotti. 2016. “Organized Crime,Violence, and Politics.” NBER Working Paper No. 22093, National Bureau of EconomicResearch. https://www.nber.org/papers/w22093.Algan, Yann, and Pierre Cahuc. 2010. “Inherited Trust and Growth.” American Eco-nomic Review 100(5): 2060-2092.Anderson, Michael L. 2008. “Multiple Inference and Gender Differences in the Effects ofEarly Intervention: A Reevaluation of the Abecedarian, Perry Preschool, and Early TrainingProjects.” Journal of the American Statistical Association 103(484): 1481-1495.Arnold, Douglas R., and Nicholas Carnes. 2012. “Holding Mayors Accountable: NewYork’s Executives from Koch to Bloomberg.” American Journal of Political Science 56(4):949-963.Bandiera, Oriana, Stephen Hansen, Andrea Prat, and Raffaella Sadun. 2018.“CEO Behavior and Firm Performance.” NBER Working Papers 23248. https://www.nber.org/papers/w23248.Banfield, Edward C. 1958. The Moral Basis of a Backward Society. New York: FreePress.Berry, Christopher R., and Anthony Fowler. 2017. “Leadership or Luck? Random-ization Inference for Leader Effects (RIFLE).” Working Paper. https://drive.google.com/file/d/1fK_Am8haumSrPxwt7CntuQniu_lE2X64/view.Bertrand, Marianne, and Antoinette Schoar. 2003. “Managing with Style: The Ef-fect of Managers on Firm Policies.” The Quarterly Journal of Economics 118(4): 1169-1208.Bertrand, Marianne, Robin Burgess, Arunish Chawla, and Guo Xu. 2018.“The Glittering Prizes: Career Incentives and Bureaucrat Performance.” Working Paper.http://www.guoxu.org/docs/ias.pdf.Besley, Timothy. 2005. “Political Selection.” Journal of Economic Perspectives 19(3):43-60.Besley, Timothy, and Marta Reynal-Querol. 2011. “Do Democracies Select MoreEducated Leaders?” American Political Science Review 105(3): 552-66.——– 2017. “The logic of hereditary rule: theory and evidence.” Journal of Economic
35

Growth 22(2): 123-144.Bloom, Nicholas, and John Van Reenen. 2007. “Measuring and Explaining Man-agement Practices Across Firms and Countries.” Quarterly Journal of Economics 122(4):1351-1408.Bloom, Nicholas, Carol Propper, Stephan Seiler, and John Van Reenen. 2015.“The Impact of Competition on Management Quality: evidence from public hospitals.” TheReview of Economic Studies 82(2): 457-489.Bolton, Alexander, Rachel Augustine Potter, and Sharece Thrower. 2016. “Or-ganizational Capacity, Regulatory Review, and the Limits of Political Control.” The Journalof Law, Economics, and Organization. 32(2): 242-271.Bracco, Emanuele, Francesco Porcelli, and Michela Redoano. 2013. “PoliticalCompetition, Tax Salience and Accountability: Theory and Some Evidence from Italy.” CE-Sifo Working Paper No. 4167. http://www.cesifo-group.de/ifoHome/publications/docbase/DocBase_Content/WP/WP-CESifo_Working_Papers/wp-cesifo-2013/wp-cesifo-2013-03/12012013004167.html.Carnes, Nicholas, and Noam Lupu. 2015. “What Good is a College Degree? Educa-tion and Leader Quality Reconsidered.” The Journal of Politics 78(1): 35-49.Chubb, Judith. 1982. Patronage, power, and poverty in southern Italy. A tale of twocities. Cambridge: Cambridge University Press.Chong, Alberto, Rafael La Porta, Florencio Lopez-se-Silanes, and Andrei Shleifer.2014. “Letter Grading Government Efficiency.” Journal of the European Economic Associ-ation 12(2): 277-299.Dal Bo, Ernesto, Frederico Finan, Olle Folke, Torsten Persson, and JohannaRickne. 2017. “Who Becomes a Politician?” NBER Working Papers 23120, NationalBureau of Economic Research. https://www.nber.org/papers/w23120.Di Liberto, Adriana, Fabiano Schivardi, and Giovanni Sulis. 2015. “ManagerialPractices and Students’ Performance.” Economic Policy 30(84): 683-728.Einstein, Katherine L., and David M. Glick. 2016 “2015 Menino Survey of Mayors.”Boston: Initiative on Cities, Boston University.Fabbrini, Sergio. 2001. “Features and Implications of Semi-Parliamentarism: The DirectElection of Italian Mayors.” South European Society and Politics 6(2): 47-70.Fukuyama, Francis. 1995. Trust. New York: Free Press.Galasso, Vincenzo, and Tommaso Nannicini. 2011. “Competing on Good Politi-cians.” American Political Science Review 105(1): 79-99.Gambetta, Diego. 1993. The Sicilian Mafia: The Business of Private Protection. Cam-bridge, MA: Harvard University Press.
36

Gambetta, Diego. (ed.) 1988. Trust: Making and breaking cooperative relations. Cam-bridge: Blackwell.Gerber, Elisabeth R., and Daniel J. Hopkins. 2011. “When Mayors Matter: Esti-mating the Impact of Mayoral Partisanship on City Policy.” American Journal of PoliticalScience 55(2): 326-339.Golden, Miriam A., and Eric C. C. Chang. 2001. “Competitive corruption: factionalconflict and political malfeasance in postwar Italian Christian Democracy.” World Politics53: 588-622.Golden, Miriam A., and Lucio Picci. 2005. “Proposal for a new Measure of Corrup-tion, illustrated with Italian Data.” Economics and Politics 17(1): 37-75.Greif, Avner. 1994. “Cultural Beliefs and the Organization of Society: A Historical andTheoretical Reflection on Collectivist and Individualist Societies.” Journal of Political Econ-omy 102 (5): 912-950.Grindle, Merilee 1997. “Divergent cultures? When public organizations perform well indeveloping countries.” World Development 25:481?95Guiso, Luigi, Paola Sapienza and Luigi Zingales. 2006 “Does Culture Affect Eco-nomic Outcomes?” Journal of Economic Perspectives 20(2): 23-48.Hamilton-Hart, Natasha. 2000. “The Singapore state revisited.” Pacific Review 13(2):195-216.Helmke, Gretchen, and Steven Levitsky. 2004. “Informal Institutions and Compara-tive Politics: A Research Agenda.” Perspectives on Politics 2(4): 725-740.Huber, John D., and Nolan McCarty. 2004. “Bureaucratic Capacity, Delegation, andPolitical Reform.” American Political Science Review. 98-3: 481-494.Jones, Benjamin F., and Benjamin A. Olken. 2005. “Do Leaders Matter? NationalLeadership and Growth Since World War II.” The Quarterly Journal of Economics 120 (3):835-864.Khwaja, Asim Ijaz. 2009. “Can Good Projects Succeed in Bad Communities?” Journalof Public Economics 93(7-8): 899-916.Kirkland, Patricia A. 2017. “The Business of Being Mayor: Mayors and Fiscal Policies inU.S. Cities.” Working Paper. https://patriciaakirkland.files.wordpress.com/2016/05/business_mayors_0517.pdfKnack, Stephen, and Philip Keefer. 1997. “Does social capital have an economicpayoff? A cross-country investigation.” Quarterly Journal of Economics 112 (4): 1251-1288.Krause, George A., and Neal D. Woods. 2014. “Policy Delegation, ComparativeInstitutional Capacity, and Administrative Politics in the American States.” in The OxfordHandbook of State and Local Government. Donald P. Haider-Markel, ed. New York: Oxford
37

University Press.Lahoti, Rahul, and Soham Sahoo. 2017. “Are Educated Leaders Good for Educa-tion? Evidence from India.” Working Paper. https://papers.ssrn.com/sol3/papers.cfm?abstract_id=2851895La Porta, Rafael, Florencio Lopez-de-Silanes, Andrei Shleifer, and Robert WVishny. 1997. “Trust in Large Organizations.” American Economic Review Papers andProceedings 87(2): 333-338.Lauth, Hans-Joachim. 2000. “Informal institutions and democracy.” Democratization7(4): 21-50.Nannicini, Tommaso, Andrea Stella, Guido Tabellini, and Ugo Troiano. 2013.“Social Capital and Political Accountability.” American Economic Journal: Economic Pol-icy 5(2): 222-250.North, Douglass C. 1990. “Institutions, Institutional Change, and Economic Perfor-mance.” Cambridge: Cambridge University Press.North, Douglas C., and Robert Paul Thomas. 1973. The Rise of the Western World:A New Economic History Cambridge: Cambridge University Press.Pepinsky, Thomas B., Jan H. Pierskalla, and Audrey Sacks. 2017. “Bureaucracyand Service Delivery.” Annual Review of Political Science. 20: 249-268.Pinotti, Paolo. 2015. “The Economic Costs of Organised Crime: Evidence from SouthernItaly.” The Economic Journal 125: 203-232.Porcelli, Francesco, Francesco Vidoli, Roberto Dispotico, and Danilo Ballanti.2016. “Measuring Public Sector Performance: A Four Quadrants Model to Monitor LocalGovernments’ Efficiency” in Philippopoulos, Apostolis (ed.) Public Sector Economics andthe Need for Reforms. Cambridge: The MIT Press.Pritchett, Lant. 2000. “The tyranny of concepts: CUDIE (cumulated, depreciated, in-vestment effort) is not capital.” Journal of Economic Growth 5: 361-384.Putnam, Robert D., Robert Leonardi, and Raffaella Y. Nanetti. 1993. MakingDemocracy Work: Civic Traditions in Modern Italy. Princeton: Princeton University Press.Rasul, Imran, and Daniel O. Rogger. 2017. “Management of Bureaucrats and PublicService Delivery: Evidence from the Nigerian Civil Service.” The Economic Journal forth-coming.Rasul, Imran, Daniel O. Rogger, and Martin J. Williams. 2017. Management andBureaucratic Effectiveness: a Scientific Replication. (Reference No. S33301GHA1) London,UK: IGC, LSE.Stokes, Susan. 2006. “Do Informal Institutions Make Democracy Work? Accounting forAccountability in Argentina.” In Helmke, Gretchen, and Steven Levitsky (eds.) Informal
38

Institutions and Democracy: Lessons from Latin America. Baltimore: Johns Hopkins Uni-versity Press.Tabellini, Guido. 2010. “Culture and Institutions: Economic Development in the Re-gions of Europe.” Journal of the European Economic Association. 8(4): 677-716.Tausanovich, Chris, and Christopher Warshaw. 2014. “Representation in MunicipalGovernment.” American Political Science Review 108(3): 605-641.Trounstine, Jessica. 2009. “All Politics Is Local: The Reemergence of the Study of CityPolitics.” Perspectives on Politics 7(3): 611-18.
39

Appendix
Table A1: Summary statistics for Southern Italy
Mean Std. Dev. Min. Max. N
Panel A: Cross-Sectional Variables
Mayor characteristicsMean Competence Score 2.92 0.85 1 4.5 75Age 53.59 10.21 31 81 75Female 0.07 0.25 0 1 75Job - High Skill 0.84 0.37 0 1 73Job - Low Skill 0.14 0.35 0 1 73Job - Unemployed/Pension 0.03 0.16 0 1 73Education - Less than Highschool 0.01 0.12 0 1 75Education - Highschool 0.25 0.44 0 1 75Education - University 0.73 0.45 0 1 75Years of Government Experience 13.24 6.82 0 31 75Year in Office 2.63 1.09 1 5 75Party - Left 0.16 0.37 0 1 75Party - Centre Left 0.43 0.5 0 1 75Party - Centre/Independent 0.29 0.46 0 1 75Party - Centre Right 0.09 0.29 0 1 75Party - Right 0.03 0.16 0 1 75
Municipality characteristicsPopulation 4811.07 784.64 3622 6462 75Low Social Capital 0.41 0.5 0 1 75No Letter 0.12 0.33 0 1 75
Panel B: Panel VariablesSurplus 0.13 0.12 -0.13 0.36 588Total Expenditures (euros per capita) 1276.95 589.80 473.45 3863.21 588Total Revenues (euros per capita) 1287.35 596.41 463.43 3798.69 588Current Expenditures (euros per capita) 528.59 190.94 269.42 1516 588Capital Expenditures (euros per capita) 342.83 379.73 12.25 1990.57 588Other Expenditures (euros per capita) 249.11 245.14 61.24 1119.35 588Tax Revenues (euros per capita) 391.93 176.66 104.65 1165.12 588Transfer Revenues (euros per capita) 208.44 159.81 9.56 644.35 588Other Revenues (euros per capita) 674.95 524.02 130.28 2661.91 588Quality of Service Provision Index 4.75 1.78 1 8.80 48
A-1

Table A2: Summary statistics for Northern Italy
Mean Std. Dev. Min. Max. N
Panel A: Cross-Sectional Variables
Mayor characteristicsMean Competence Score 2.99 0.83 1 5 180Age 51.7 10.26 28 76 180Female 0.17 0.38 0 1 180Job - High Skill 0.63 0.49 0 1 179Job - Low Skill 0.23 0.42 0 1 179Job - Unemployed/Pension 0.14 0.35 0 1 179Education - Less than Highschool 0.07 0.26 0 1 180Education - Highschool 0.51 0.5 0 1 180Education - University 0.42 0.49 0 1 180Years of Government Experience 12.89 8.26 2 41 180Year in Office 2.39 0.78 1 5 180Party - Left 0.15 0.36 0 1 180Party - Centre Left 0.34 0.48 0 1 180Party - Centre/Independent 0.22 0.41 0 1 180Party - Centre Right 0.28 0.45 0 1 180Party - Right 0.01 0.11 0 1 180
Municipality characteristicsPopulation 4988.85 783.71 3555 6468 180Low Social Capital 0.1 0.3 0 1 180No Letter 0.11 0.32 0 1 180
Panel B: Panel VariablesSurplus 0.12 0.11 -0.13 0.36 1143Total Expenditures (euros per capita) 1053.65 510.59 473.45 3863.21 1143Total Revenues (euros per capita) 1044.53 504.23 463.43 3798.69 1143Current Expenditures (euros per capita) 548.22 222.68 269.42 1562.92 1143Capital Expenditures (euros per capita) 206.17 236.91 12.25 1990.57 1143Other Expenditures (euros per capita) 169.81 166.19 46.47 1119.35 1143Tax Revenues (euros per capita) 443.03 186.95 117.31 1165.12 1143Transfer Revenues (euros per capita) 120.33 104.9 9.56 644.35 1143Other Revenues (euros per capita) 463.49 327.68 130.28 2661.91 1143Quality of Service Provision Index 7.13 1.63 2.8 10 101
A-2

Table A3: Summary statistics for Central Italy
Mean Std. Dev. Min. Max. N
Panel A: Cross-Sectional Variables
Mayor characteristicsMean Competence Score 3.14 0.85 1 4.88 51Age 52.94 10.78 34 77 51Female 0.1 0.3 0 1 51Job - High Skill 0.67 0.48 0 1 51Job - Low Skill 0.14 0.35 0 1 51Job - Unemployed/Pension 0.2 0.4 0 1 51Education - Less than Highschool 0.02 0.14 0 1 51Education - Highschool 0.35 0.48 0 1 51Education - University 0.63 0.49 0 1 51Years of Government Experience 13.16 8.22 2 41 51Year in Office 2.29 0.58 2 5 51Party - Left 0.24 0.43 0 1 51Party - Centre Left 0.49 0.5 0 1 51Party - Centre/Independent 0.12 0.33 0 1 51Party - Centre Right 0.16 0.37 0 1 51Party - Right 0 0 0 0 51
Municipality characteristicsPopulation 4994.92 686.05 3819 6332 51Low Social Capital 0.31 0.47 0 1 51No Letter 0.35 0.48 0 1 51
Panel B: Panel VariablesSurplus 0.13 0.1 -0.13 0.36 382Total Expenditures (euros per capita) 1453.32 613.56 623.31 3863.21 382Total Revenues (euros per capita) 1455.75 621.07 629.54 3798.69 382Current Expenditures (euros per capita) 642.94 219.49 269.42 1562.92 382Capital Expenditures (euros per capita) 327.38 354.83 12.25 1990.57 382Other Expenditures (euros per capita) 282.78 281.99 55.51 1119.35 382Tax Revenues (euros per capita) 480.46 167.2 169.78 1078.65 382Transfer Revenues (euros per capita) 167.39 129.61 9.56 644.35 382Other Revenues (euros per capita) 798.33 556.04 130.28 2661.91 382Quality of Service Provision Index 5.23 1.88 1 8.19 28
A-3

Table A4: Balance between interviewed and non-interviewed mayors
Declined Accepted s.e. ofInterview Interview Difference Difference
Panel A: SouthAge 52.20 53.59 1.39 (1.45)Female 0.10 0.07 -0.04 (0.04)Job - High Skill 0.82 0.84 0.02 (0.06)Job - Low Skill 0.09 0.14 0.05 (0.05)Job - Unemployed/Pensioner 0.09 0.03 -0.06 (0.04)Education - Less than Highschool 0.03 0.01 -0.01 (0.02)Education - Highschool 0.30 0.25 -0.05 (0.07)Education - University 0.67 0.73 0.06 (0.07)Total Revenues (euros per capita) 1425.05 1412.17 -12.88 (84.27)Total Expenditures (euros per capita) 1378.61 1375.84 -2.77 (82.13)Surplus 0.20 0.20 0.00 (0.01)
Observations 106 75 181
Panel B: NorthAge 51.81 51.58 -0.23 (1.33)Female 0.19 0.13 -0.06 (0.04)Job - High Skill 0.70 0.66 -0.04 (0.06)Job - Low Skill 0.16 0.20 0.05 (0.05)Job - Unemployed/Pensioner 0.13 0.14 0.00 (0.04)Education - Less than Highschool 0.09 0.08 -0.01 (0.03)Education - Highschool 0.44 0.50 0.05 (0.06)Education - University 0.47 0.42 -0.04 (0.06)Total Revenues (euros per capita) 957.04 998.73 41.69 (48.65)Total Expenditures (euros per capita) 950.43 988.71 38.27 (47.90)Surplus 0.19 0.19 -0.00 (0.01)
Observations 120 147 267
Panel C: CenterAge 49.92 52.67 2.74 (1.54)*Female 0.18 0.20 0.02 (0.06)Job - High Skill 0.62 0.59 -0.03 (0.08)Job - Low Skill 0.18 0.23 0.05 (0.06)Job - Unemployed/Pensioner 0.15 0.18 0.03 (0.06)Education - Less than Highschool 0.05 0.02 -0.03 (0.03)Education - Highschool 0.37 0.44 0.07 (0.08)Education - University 0.58 0.54 -0.04 (0.08)Total Revenues (euros per capita) 1,290.61 1,335.79 45.18 (79.10)Total Expenditures (euros per capita) 1,271.49 1,313.44 41.95 (77.10)Surplus 0.19 0.19 0.00 (0.01)
Observations 78 84 162Notes: The number of observations for the variables Job - High-skill, Job - Low-skill, and Job - Unemployedis 176 (103 not interviewed and 73 interviewed) in Panel A, 261 (114 not interviewed and 147 interviewed)in Panel B, and 155 (72 not interviewed and 83 interviewed) in Panel C. *** is significant at the 1 percentlevel, ** is significant at the 5 percent level, * is significant at the 10 percent level.
A-4

Table A5: Competence Score and Surplus: south vs. rest of Italy
(1) (2) (3) (4)Surplus Surplus Surplus Surplus
Mean Competence Score ˆ South -0.024** -0.031** -0.028** -0.029**(0.012) (0.013) (0.013) (0.013)
Mean Competence Score 0.007 0.007 0.008 0.008(0.005) (0.005) (0.005) (0.005)
Observations 939 927 927 927Municipalities 306 303 303 303R-squared 0.077 0.085 0.091 0.103SD DV 0.0907 0.0911 0.0911 0.0911
Mayor Controls X X XParty FE X XYear of Term FE XNotes: The dependent variable is the value of the per-capita municipal surplus relative to the budget size(total revenues minus total expenditures) over total expenditures, winsorized at the 1 percent level. Thevariable South is an indicator taking value one for all municipalities in southern Italy and value zero formunicipalities in northern and central Italy. All specifications include year and region fixed effects. TheSouth indicator is absorbed by region fixed effects. The standard deviation of the dependent variable isreported in the table. Mayor controls include: i) the gender of the mayor, ii) the age of the mayor, iii) themayor’s previous occupation, iv) the mayor’s educational attainment, and v) fixed effects for the year of themayor’s current mandate (1-5). Standard errors clustered at the municipality level are shown in parenthesis.*** is significant at the 1 percent level, ** is significant at the 5 percent level, * is significant at the 10percent level.
A-5

Table A6: Competence Score and Surplus (Diff-in-Diff): south vs. rest of Italy
(1) (2) (3) (4)Surplus Surplus Surplus Surplus
Mean Competence Score ˆ Post ˆ South -0.030*** -0.027*** -0.030*** -0.030***(0.008) (0.009) (0.010) (0.010)
Mean Competence Score ˆ Post 0.006 0.004 0.005 0.005(0.005) (0.005) (0.005) (0.005)
Post ˆ South 0.084***(0.024)
Observations 2,362 2,362 2,339 2,339Municipalities 306 306 303 303R-squared 0.693 0.699 0.870 0.700SD Surplus Pre 0.109 0.109 0.109 0.109
Region FE X X XMayor Controls X XParty FE XNotes: The dependent variable is the value of the per-capita municipal surplus (total revenues minus total expenditures)relative to the budget size, winsorized at the 1 percent level. The variable Post is an indicator taking value one for eachyear of the interviewed mayor’s term following the mayor’s first election. The variable South is an indicator taking valueone for all municipalities in southern Italy and value zero for municipalities in northern and central Italy. In columns (2)-(3)the variable Post ˆ South is absorbed by region fixed effects interacted with the Post dummy. The standard deviation ofthe dependent variable in the pre-period is reported in the table. All specifications include fixed effects for the municipality,the year since the mayor was elected and the calendar year. Mayor controls include the mayor’s age, gender, educationalattainment, years of government experience and skill content of previous employment. All controls, as well as region andparty indicators, are interacted with the Post indicator. Standard errors clustered at the municipality level are shown inparenthesis. *** is significant at the 1 percent level, ** is significant at the 5 percent level, * is significant at the 10 percentlevel.
A-6

Tabl
eA
7:R
elia
bilit
yof
Com
pete
nce
Scor
ein
the
Sout
h
Dep
ende
ntVa
riabl
e:
Surp
lus
Targ
etPe
rfor
man
ceP
anel
A-
Mea
nC
ompe
tenc
eSc
ore
excl
udes
prac
tice:
Sett
ing
Ope
ratio
nsM
onito
ring
Ince
ntiv
es
Mea
nC
ompe
tenc
eSc
ore
(exc
ludi
ngon
epr
actic
e)ˆ
Post
-0.0
35**
*-0
.033
***
-0.0
27**
*-0
.035
***
(0.0
10)
(0.0
11)
(0.0
09)
(0.0
10)
Obs
erva
tions
571
571
571
571
R-s
quar
ed0.
762
0.76
10.
758
0.76
2SD
Surp
lus
Pre
0.12
00.
120
0.12
00.
120
Pan
elB
-M
ean
Com
pete
nce
Scor
eex
clud
esqu
estio
n:(1
)(2
)(3
)(4
)(5
)(6
)(7
)
Mea
nC
ompe
tenc
eSc
ore
(exc
ludi
ngon
equ
estio
n)ˆ
Post
-0.0
37**
*-0
.036
***
-0.0
35**
*-0
.032
***
-0.0
34**
*-0
.037
***
-0.0
37**
*(0
.010
)(0
.010
)(0
.010
)(0
.010
)(0
.010
)(0
.010
)(0
.011
)
Obs
erva
tions
571
571
571
571
571
571
571
R-s
quar
ed0.
762
0.76
20.
761
0.76
00.
760
0.76
20.
762
SDSu
rplu
sPr
e0.
120
0.12
00.
120
0.12
00.
120
0.12
00.
120
Not
es:
The
tabl
eab
ove
repl
icat
esre
sults
show
nin
Tabl
e8
(for
the
Ital
ian
sout
hon
ly)
usin
gal
tern
ate
defin
ition
sof
the
Com
pete
nce
Scor
e.Pa
nelA
show
sre
sults
for
four
alte
rnat
eC
ompe
tenc
eSc
ores
,eac
hca
lcul
ated
asth
eav
erag
eof
thre
eou
tof
the
four
prac
tices
used
toca
lcul
ate
the
Com
pete
nce
Scor
eus
edth
roug
hout
the
pape
r.Pa
nelB
show
sre
sults
for
seve
nal
tern
ate
Com
pete
nce
Scor
es,e
ach
calc
ulat
edas
the
aver
age
ofal
lbut
one
ofth
e7
ques
tions
used
toca
lcul
ate
the
Com
pete
nce
Scor
eus
edth
roug
hout
the
pape
r.A
llco
lum
nssh
owre
sults
for
the
full
spec
ifica
tion
incl
udin
gpa
rty
and
regi
onfix
edeff
ects
and
may
orco
ntro
ls(i.
e.pa
rty
indi
cato
rs,r
egio
nin
dica
tors
and
may
orco
ntro
lvar
iabl
esin
tera
cted
with
thePost
indi
cato
r).
***
issig
nific
ant
atth
e1
perc
ent
leve
l,**
issig
nific
ant
atth
e5
perc
ent
leve
l,*
issig
nific
ant
atth
e10
perc
ent
leve
l.
A-7

Table A8: Competence Score components (in South)
(1) (2) (3) (4)Surplus Surplus Surplus Surplus
Panel ATarget Setting ˆ Post -0.012* -0.011 -0.019** -0.017*
(0.007) (0.007) (0.010) (0.010)Observations 588 588 571 571R-squared 0.741 0.745 0.894 0.756
Panel BPerformance Monitoring ˆ Post -0.019*** -0.020*** -0.027*** -0.028***
(0.006) (0.007) (0.007) (0.009)Observations 588 588 571 571R-squared 0.747 0.751 0.897 0.762
Panel COperations ˆ Post -0.014*** -0.014** -0.017** -0.018**
(0.005) (0.006) (0.007) (0.007)Observations 588 588 571 571R-squared 0.743 0.747 0.895 0.758
Panel DIncentives ˆ Post -0.013* -0.012 -0.016** -0.013
(0.007) (0.007) (0.008) (0.008)Observations 588 588 571 571R-squared 0.742 0.746 0.894 0.755
Municipalities 75 75 73 73SD Surplus Pre 0.120 0.120 0.120 0.120Region FE X X XMayor Controls X XParty FE XNotes: Each panel replicates Panel B table 8 using one of the four management practices or componentsof the Mean Competence Score in lieu of the Mean Competence Score. *** is significant at the 1 percentlevel, ** is significant at the 5 percent level, * is significant at the 10 percent level.
A-8

Table A9: Competence Score and Human Capital Measures
(1) (2) (3)Surplus Surplus SurplusSouth North Centre
Mean Competence Score ˆ Post -0.036*** 0.010 -0.005(0.011) (0.007) (0.013)
Female ˆ Post -0.043 -0.005 0.038(0.027) (0.015) (0.027)
Age ˆ Post -0.001 0.000 0.000(0.001) (0.001) (0.001)
Job - High Skill ˆ Post -0.021 -0.003 -0.028(0.022) (0.012) (0.020)
Education - University ˆ Post 0.013 0.005 0.021(0.019) (0.012) (0.020)
Years of Government Experience ˆ Post -0.001 0.000 -0.000(0.001) (0.001) (0.001)
Observations 571 1,143 382Municipalities 73 147 51R-squared 0.759 0.679 0.728SD Surplus Pre 0.120 0.107 0.0978Region FE X X XParty FE X X XNotes: See Table 8 for table notes. *** is significant at the 1 percent level, ** is significant at the 5percent level, * is significant at the 10 percent level.
A-9

Table A10: Robustness to Balanced Sample
(1) (2) (3) (4)Surplus Surplus Surplus Surplus
Panel A: Full SampleMean Competence Score ˆ Post 0.002 0.001 -0.000 -0.000
(0.005) (0.005) (0.006) (0.006)
Observations 1,296 1,296 1,287 1,287Municipalities 144 144 143 143R-squared 0.731 0.739 0.846 0.742SD Surplus Pre 0.0844 0.0844 0.0845 0.0845
Panel B: SouthMean Competence Score ˆ Post -0.013** -0.014** -0.028*** -0.030**
(0.006) (0.007) (0.009) (0.011)
Observations 333 333 324 324Municipalities 37 37 36 36R-squared 0.811 0.814 0.904 0.829SD Surplus Pre 0.0935 0.0935 0.0942 0.0942
Panel C: NorthMean Competence Score ˆ Post 0.013 0.011 0.009 0.007
(0.009) (0.009) (0.011) (0.011)
Observations 639 639 639 639Municipalities 71 71 71 71R-squared 0.684 0.696 0.809 0.700SD Surplus Pre 0.0842 0.0842 0.0842 0.0842
Panel D: CentreMean Competence Score ˆ Post -0.007 -0.008 -0.018* -0.021*
(0.007) (0.007) (0.010) (0.011)
Observations 189 189 189 189Municipalities 21 21 21 21R-squared 0.786 0.787 0.895 0.804SD Surplus Pre 0.0705 0.0705 0.0705 0.0705
Region FE X X XMayor Controls X XParty FE XNotes: The Table replicates Table 8 using a balanced panel sample. See Table 8 for additional table notes.
A-10
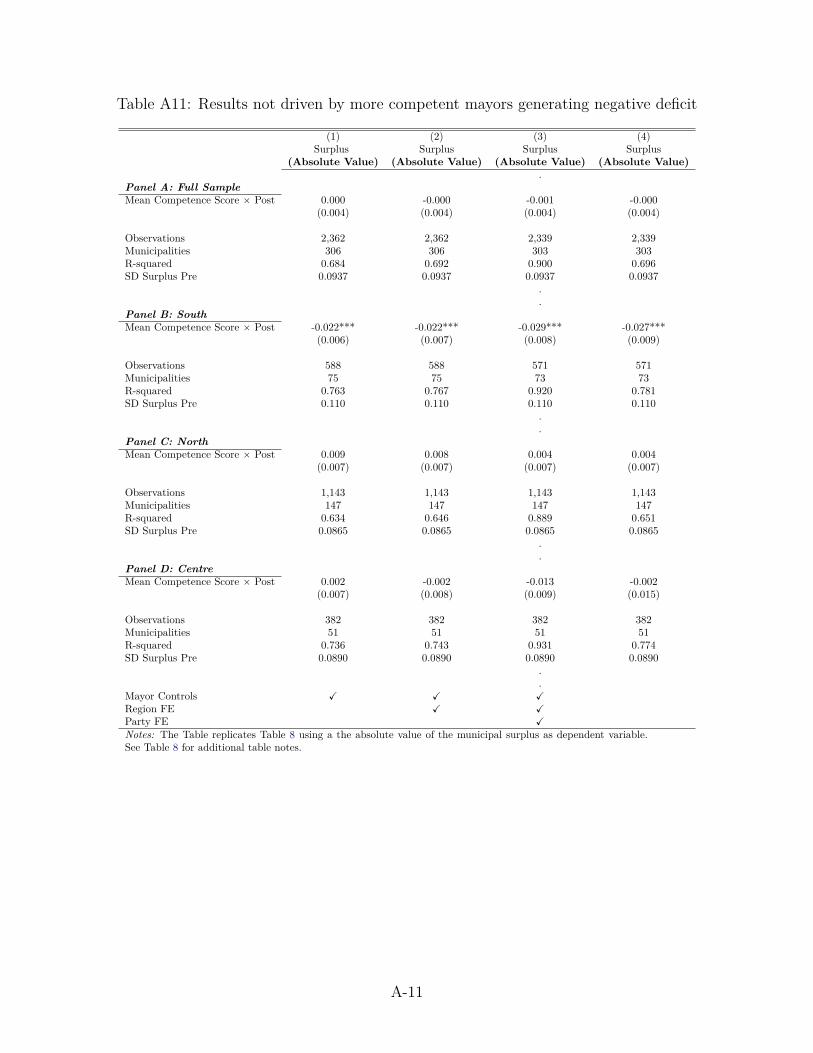
Table A11: Results not driven by more competent mayors generating negative deficit
(1) (2) (3) (4)Surplus Surplus Surplus Surplus
(Absolute Value) (Absolute Value) (Absolute Value) (Absolute Value).
Panel A: Full SampleMean Competence Score ˆ Post 0.000 -0.000 -0.001 -0.000
(0.004) (0.004) (0.004) (0.004)
Observations 2,362 2,362 2,339 2,339Municipalities 306 306 303 303R-squared 0.684 0.692 0.900 0.696SD Surplus Pre 0.0937 0.0937 0.0937 0.0937
.
.Panel B: SouthMean Competence Score ˆ Post -0.022*** -0.022*** -0.029*** -0.027***
(0.006) (0.007) (0.008) (0.009)
Observations 588 588 571 571Municipalities 75 75 73 73R-squared 0.763 0.767 0.920 0.781SD Surplus Pre 0.110 0.110 0.110 0.110
.
.Panel C: NorthMean Competence Score ˆ Post 0.009 0.008 0.004 0.004
(0.007) (0.007) (0.007) (0.007)
Observations 1,143 1,143 1,143 1,143Municipalities 147 147 147 147R-squared 0.634 0.646 0.889 0.651SD Surplus Pre 0.0865 0.0865 0.0865 0.0865
.
.Panel D: CentreMean Competence Score ˆ Post 0.002 -0.002 -0.013 -0.002
(0.007) (0.008) (0.009) (0.015)
Observations 382 382 382 382Municipalities 51 51 51 51R-squared 0.736 0.743 0.931 0.774SD Surplus Pre 0.0890 0.0890 0.0890 0.0890
.
.Mayor Controls X X XRegion FE X XParty FE XNotes: The Table replicates Table 8 using a the absolute value of the municipal surplus as dependent variable.See Table 8 for additional table notes.
A-11

Open Questions
Operations
2) Time Horizon of Targets
Tests whether the administration has a rational approach to planning and setting targets
Score:1☐ 2☐ 3☐ 4☐ 5☐ .☐
a) What kind of time scale are you looking at with your targets? b) Which goals receive the most emphasis?c) Are the long-term and short-term goals set independently?
Score 1: The administration's main focus is on short-term targets
Score 3: There are short and long- term goals for every area; as they are set independently, they are not necessarily linked to each other
Score 5: Long-term goals are translated into specific short-term targets so that short-term targets become a ‘staircase’ to reach long- term goals
Target Setting
1) Target Inter-Connection
Tests whether objectives are associated to practical and measurable targets and how well they cascade down to each member of the government and bureaucracy
Score:1☐ 2☐ 3☐ 4☐ 5☐ .☐
a) Could you describe which main objectives you set for your mandate and what are the practical targets associated to each of these main objectives?b) How are these targets cascaded down to individual members of the government and of the bureaucracy?
Score 1: Objectives and targets are very loosely defined; They do not cascade down throughout the administration
Score 3: Objectives are defined and targets are defined but only for some objectives; They do cascade, but only to members of the government.
Score 5: Objectives have clearly defined associatedtargets; Cascade to individual members of government and bureaucracy and increase in specificity as they cascade
3) Efficiency of Procurement
Tests knowledge of procurement and efforts to ensure law conformity and avoid cost duplication
Score:1☐ 2☐ 3☐ 4☐ 5☐ .☐
a) Could you talk me through the process of writing a call for tender in your administration?b) How early do you typically issue a call for tender?c) How standardized is this procedure across different areas of the administration? In particular, how standardized is the procedure to make sure that the call for tender is law-compliant?Score 1: Mayor has vague understanding of the process.
Score 3: Mayor know the process well and call for tender are programmed in advance.
Score 5: Mayor knows the process very well; call for tender are programmed in advance; there are common official guidelines.
A-12

7) Removing Poor Performers
Score:1☐ 2☐ 3☐ 4☐ 5☐ .☐
a) If you had a staff member who was struggling or who could not do his/ her job, what would you do? Can you give me a recent example?
Score 1: Poor performance is not addressed.
Score 3: Poor performance is addressed, but only with formal complaints that d not translate into action or with limited coaching methods.
Score 5: Repeated poor performance is frequently addressed, beginning with targeted interventions using a variety of methods (coaching; change of assignments)
Monitoring
5) Performance Review
Tests whether performance is reviewed with appropriate frequency and follow-up
Score:1☐ 2☐ 3☐ 4☐ 5☐ .☐
a) How often do you review the performance of the municipality-formally or informally - with staff (executives, legislators, bureaucrats)?b) Tell me about a recent meeting.c) Who is involved in these meetings? Who gets to see the results of this review?d) What sort of follow-up plan would you leave these meetings with?
Score 1: Performance is not reviewed or reviewed infrequently and in an unstructured way.
Score 3: Performance is reviewed periodically with successes and failures identified; results are only communicated to main government members; no clear follow up/ action plan is adopted
Score 5: Performance is continually reviewed, based on indicators; all aspects are followed up to ensure continuous improvement; results are communicated to both government and bureaucracy.
Score 1: No appraisal system. Staff members cannot coompare their performance. No type of reward for top-performers
Score 3: There is an evaluation system which allows comparison and awards good performance but awards are never awarded or are not based on performance.
Score 5: Formal evaluation system with public evaluations rewarding individuals based on performance; rewards are awarded as a consequence of well-defined achievements
People Management
6)Building a High-Performance Culture through Incentives and Appraisals
Tests systematic approach to identifying and rewarding good/bad performers
Score:1☐ 2☐ 3☐ 4☐ 5☐ .☐
a) Do you have an appraisal system?b) How can the members of your staff evaluate their performance against that of the other members?c) Are there any rewards for the best performers across all staff groups? How does it work?
4) Performance Tracking
Tests whether municipality performance is measured with the right methods and frequency
Score:1☐ 2☐ 3☐ 4☐ 5☐ .☐
a) What kind of main indicators do you use to track your performance in reaching your mandate objectives? What sources of information are used to inform this tracking?b) How frequently are these measured? Who gets to see this performance data?
Score 1: Tracking does not happen Score 3: Some performance indicators are tracked formally; Data is gathered for some objectives; tracking is overseen by the government leadership only.
Score 5: Performance is tracked systematically; data is measured and communicated, both formally and informally to a large number of members.
A-13

Gentile Sindaco, siamo un team di ricerca della New York University (NYU) che sta lavorando a un progetto di ricerca, diretto da Maria Carreri e supportato dall’Anci, sulle pratiche e stili amministrative nelle amministrazioni locali in Italia. Crediamo fermamente che gli amministratori giochino un ruolo di fondamentale importanza per il successo di un comune e per il benestare dei suoi cittadini. È proprio per questa convinzione che siamo interessati a comparare diverse pratiche e stili amministrativi in Italia e il suo contributo sarà prezioso. La invitiamo a partecipare attraverso una conversazione telefonica sulla sua esperienza nelle amministrazioni locali in Italia. Benefici per lei includono:
• Una copia dei risultati della nostra ricerca accademica, prima che vengano resi pubblici.
• L’opportunità di contribuire a uno studio accademico che ha il potenziale di informare e suggerire best practices nelle amministrazioni locali.
• Altri sindaci hanno apprezzato la nostra intervista e l’hanno considerata un’ottima opportunità per discutere di e riflettere sul loro stile e pratiche amministrative in un ambiente confidenziale.
La nostra conversazione toccherà 4 macro tematiche relative alle pratiche amministrative: targets, monitoraggio della performance, gestione delle operazioni e gestione del personale. Inoltre le faremo delle brevi domande sul suo carattere. La conversazione sarà di 25 minuti. Non è prevista una ricompensa e né il sindaco né il comune incorreranno in alcuna spesa relativa alla partecipazione al progetto. Infine, tutte le sue risposte saranno confidenziali per garantire l’assenza di alcun rischio legato alla sua partecipazione a questo studio accademico. Né la sua identità né quella del suo comune potranno essere menzionate nel nostro studio accademico. Saremo felici di rispondere a ogni sua domanda in ogni momento. La invitiamo anche a contattare Maria Carreri, che supervisiona il progetto. Ovviamente, lei ha il diritto di cancellare il nostro appuntamento telefonico e la sua partecipazione al nostro studio in qualunque momento. La contatteremo telefonicamente ma qualora fosse più conveniente per lei saremmo felici le lei volesse contattarci via mail a [email protected] oppure telefonicamente (recapito della dottoressa Carreri qui sotto) per fissare un appuntamento telefonico o anche per porci qualunque domanda sul progetto. La ringraziamo ancora per la sua disponibilità,
Maria Carreri Telefono: +1 (857) 445-2367 Email: [email protected]
English Translation: Dear Mayor, we are a research team working on an academic research project on the different managerial
practices and styles employed in local governments across Italy. We believe that mayors play a fundamental role for the success
of their city and the well-being of its citizens. It is based on this conviction that we are interested in understanding the different
practices and managerial styles employed across the country, and your input would be extremely valuable in making this project
successful. We invite you to take part in our study through a brief and confidential phone conversation revolving around your
experience as mayor. Potential benefits to you include: a copy of the results of our academic research prior to their publication;
an opportunity to contribute to an academic study with the potential to identify best practices across city governments; other
mayors have enjoyed our phone conversation and have considered it a great opportunity to discuss and reflect upon their
managerial practices in a confidential environment. The phone conversation will touch upon four macro areas related to your
government practices: targets, performance monitoring, operations and people management. We will also pose a few questions
on your background. The conversation is expected to last 25 minutes. No compensation will be provided and neither the mayor
nor the city will incur any expense as a result of the study. The conversation will be confidential to guarantee that no risk will
be associated to your participation to this academic study. Your identity and the name of the city will be kept confidential and
not mentioned by name in the study. We will be delighted to answer any questions you might have at any time. You have the
right to cancel your participation and the phone conversation at any time. We will be in touch by phone in the coming days.
Should it be more convenient for you to contact us directly, we will be grateful to receive an email or a phone call. Thank you
for your consideration.
A-14

English Translation: Rome, May 16th 2106. To the attention of the mayor. Subject: endorsement letter for the academic
research project on managerial practices and styles across Italian local governments by New York Univeristy. Dear mayor, as
Director of Research at Anci, I certify the value of the research conducted by Maria Carreri at New York University and I
confirm Anci’s endorsement. The study by New York University, whose description is attached, starts from the belief that
local governments play a fundamental role for the success of their communities and the wellbeing of their citizens. For this
reason, the academic study intends to learn about and compare the different managerial practices and styles that are today
present across Italian local governments. I encourage you to take part to this academic study by making yourself available for
a 25-minutes phone conversation on your experience in local governments.
A-15