campus power: tapping local energy toward a sustainable future
TRANSCRIPT

CAMPUS POWERTapping local energy toward a sustainable future

CHEAPNESS

RESOURC-ISM

SILENCE

STORIES

$20 billion

Total Economic Impact
Locally Owned Renewable Energy


10-11% ROI

Utility Electricity Sales 1950-2040

Least Cost Energy

Meg
awat
ts
0
17,500
35,000
52,500
70,000
1999 2000 2001 2002 2003 2004 2005 2006 2007 2008 2009 2010 2011 2012
Installed Wind Power

Meg
awat
ts
0
2,000
4,000
6,000
8,000
1999 2000 2001 2002 2003 2004 2005 2006 2007 2008 2009 2010 2011 2012
Installed Solar Power

0¢
3¢
6¢
9¢
12¢
2000 2002 2004 2006 2008 2010 2012
Residential (c/kWh)Commercial (c/kWh) Industrial (c/kWh) ¢ per kilowatt-hour
Rapidly Rising Average Retail Electricity Prices in Minnesota
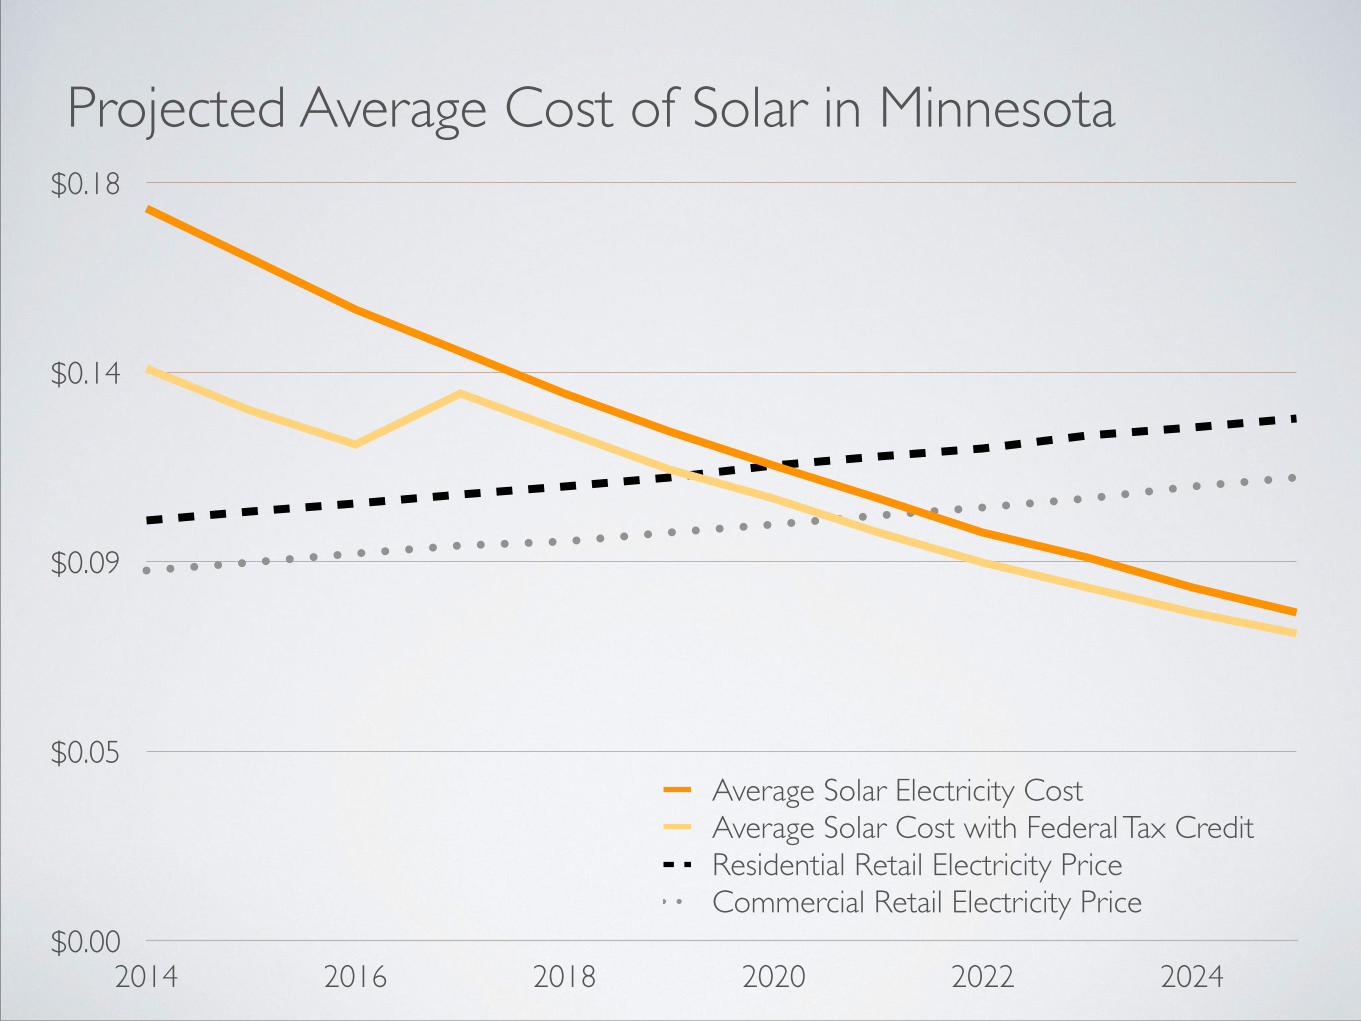
$0.00
$0.05
$0.09
$0.14
$0.18
2014 2016 2018 2020 2022 2024
Average Solar Electricity CostAverage Solar Cost with Federal Tax CreditResidential Retail Electricity PriceCommercial Retail Electricity Price
Projected Average Cost of Solar in Minnesota

Solar Could Power Millions of Homes and Businesses
2012 2017 2022
38 million
21 million
3 million
...at a lower price than electricity from the utility
Within 10 years

Distributed Solar Potential at Parity with Utility Prices (megawatts of residential and commercial solar)
8500
590
750
30,000
16,000
7200
11,000
1800
990
360012,000
780
7000
8200
510011,000
190026,0002400
7300
5100
360
26001100
1200
800
14004800
1800
32,000
5000
580
970
2300
4100
4400
2900
7200
6800
2800
7100
11,000
11,000
550010,000
12,000
20
1140700
4000
Percent of Sales
1-5%5-10%10% or more
2022


If God had wanted us to live sustainably, she’d have given us brains

Thank
ou