cameroon economic update public ... - the world...
TRANSCRIPT

CAMEROON ECONOMIC UPDATE
July 2012 l Issue No.4
STEPPING OUT INTO THE WORLD
With a Focus on Trade Facilitation
Cameroon Country Office
Pub
lic D
iscl
osur
e A
utho
rized
Pub
lic D
iscl
osur
e A
utho
rized
Pub
lic D
iscl
osur
e A
utho
rized
Pub
lic D
iscl
osur
e A
utho
rized
Pub
lic D
iscl
osur
e A
utho
rized
Pub
lic D
iscl
osur
e A
utho
rized
Pub
lic D
iscl
osur
e A
utho
rized
Pub
lic D
iscl
osur
e A
utho
rized

July 2012
Stepping Out Into the World
An Economic Update on Cameroon
With a focus on trade facilitation
Cameroon Country Office

July 2012, Issue No. 4 / Page 1
Table of Contents
ABBREVIATIONS AND ACRONYMS ........................................................................................... 2
STEPPING OUT INTO THE WORLD ............................................................................................ 4
INTRODUCTION ..................................................................................................................................... 4
RECENT ECONOMIC DEVELOPMENTS ........................................................................................................ 6
2012 OUTLOOK ................................................................................................................................... 7
TRADE FACILITATION: OPPORTUNITIES AND CHALLENGES .......................................................................... 12
REFERENCES ............................................................................................................................ 29
Table of Figures
Figure 1 : Selected Price Increases, 2007-11......................................................................................... 6
Figure 2 : Oil Production, 2002-12 ........................................................................................................ 8
Figure 3 : LPI Performance: A Comparison, 2012 ............................................................................... 17
Figure 4 : ETI Performance: A Comparison, 2012 ............................................................................... 17
Figure 5 : Average Transport Costs: A Comparison, 2007 .................................................................. 23
Figure 6 : Average Transport Prices: A Comparison, 2007 ................................................................. 23
Figure 7 : Intra Regional Trade, 2010 .................................................................................................. 25
Table of Boxes
Box 1 : External Developments ............................................................................................................. 9
Box 2 : Evolving Trade Patterns .......................................................................................................... 13
Box 3 : Trade and Poverty: A Discussion of the Literature ................................................................. 15
Box 4 : (Un)ease to Trade: International Comparison, 2012 .............................................................. 16
Box 5 : Individual Performance Contracts in Cameroon Customs: A World Premiere ....................... 20

July 2012, Issue No. 4 / Page 2
ABBREVIATIONS AND ACRONYMS
AMU Arab Maghreb Union
ASYCUDA Automated System for Customs Data
ATM Automated Teller Machine
AVI Attestation de Vérification à l’Importation (Certificate of Import
Verification)
BGFT Bureau de Gestion du Fret Terrestre (Management Office of Land Freight)
BEAC Banque des Etats d’Afrique Centrale (Central Bank of Central African
States)
BESC Bordereau Electronique du Suivi des Cargaisons (Electronic Cargo Tracking
Note)
CAR Central African Republic
CEMAC Communauté Economique et Monétaire de l’Afrique Centrale (Economic
and Monetary Community of Central Africa)
CET Common External Tariff
CFAF CFA Franc
CMR Customs Management Regulations
CNCC Conseil National des Chargeurs du Cameroun (National Shippers’ Council
of Cameroon)
COMESA Common Market for Eastern and Southern Africa
CPI Consumer Price Index
CTN Common Tariff Nomenclature
CU Customs Union
DGD Direction Générale des Douanes (Directorate General of Customs)
DGTCM Direction Générale du Trésor et de la Coopération Monétaire (General
Department of Treasury and the Monetary Cooperation)
DRC Democratic Republic of Congo
DSCE Document de Stratégie pour la Croissance et l’Emploi (Growth and
Employment Strategy)
ECB European Central Bank
ECCAS Economic Community of Central African States
ECOWAS Economic Community of West African States
e-GUCE Electronic GUCE
EITI Extractive Industries Transparency Initiative

July 2012, Issue No. 4 / Page 3
ETI Enabling Trade Index
GDP Gross Domestic Product
GUCE Guichet Unique des Opérations du Commerce Extérieur (Single Window of
Foreign Trade Operations)
IMF International Monetary Fund
LPI Logistics Performance Index
LVI Lettre de Voiture Internationale (International Consignment Note)
MINCOMMERCE Ministère du Commerce (Ministry of Commerce)
MINFI Ministère des Finances (Ministry of Finance)
PAD Port Autonome de Douala (port of Douala)
POS Point-Of-Sale terminal
TSA Treasury Single Account
SADC Southern African Development Community
SONARA Société Nationale de Raffinage (national refinery)
SSATP Sub-Saharan Africa Transport Policy Program
US United States
USD United States Dollar
VAT Value-Added Tax
WAEMU West African Economic and Monetary Union
WEO World Economic Outlook

July 2012, Issue No. 4 / Page 4
STEPPING OUT INTO THE WORLD
Introduction
With this Cameroon Economic Update, the
World Bank is pursuing a program of short,
crisp and frequent country economic
reports. These Economic Updates provide an
analysis of the trends and constraints in
Cameroon’s economic development. Each
issue, produced bi-annually, provides an
update of recent economic developments,
as well as a special focus on a topical issue.
The Economic Updates aim to share
knowledge and stimulate debate among
those interested in improving the economic
management of Cameroon and unleashing
its enormous potential. The notes thereby
offer another voice on economic issues in
Cameroon, and an additional platform for
engagement, learning and change.
This fourth issue of the Cameroon Economic
Update is entitled “Stepping out into the
World – A Special Focus on Trade
Facilitation”. It reviews the challenges and
opportunities related to trade facilitation in
Cameroon. The coverage is not meant to be
exhaustive, but puts an emphasis on
particular areas that would require the
country’s sustained attention: a
transformative trade facilitation agenda
around which all stakeholders could be
mobilized.
Fostering greater trade both at the regional
and international levels would assist
Cameroon achieving its goal of becoming an
emerging economy by 2035. Seizing trade
opportunities in the regional context would
provide a good learning ground for
becoming competitive on the international
scene.
Photo credit: Raju Jan Singh

July 2012, Issue No. 4 / Page 5
In Cameroon, traders are, however, still
faced with burdensome procedures both for
exports and imports. Port efficiency needs
to be improved and movements of freight
inland should be made easier and cheaper.
The latter would require, in addition to
better roads, a more competitive transport
sector and fewer roadblocks.
The CEMAC Customs Union (CU) should
become a reality through the adoption of a
harmonized tariff nomenclature, standards,
common customs regulations, and a
regional payment system. Beyond CEMAC,
there would be a need to facilitate trade
between CEMAC countries and the
Democratic Republic of Congo (DRC), as well
as the rest of the ECCAS.1 Cameroon could
also capitalize on the trading potential with
the vast consumer market in Nigeria and,
through Nigeria, access the entire ECOWAS
regional market.2
The Cameroon Economic Updates are
produced by the World Bank Country Office
in Cameroon by a Team led by Raju Jan
1 CEMAC refers to the Economic and Monetary Community
of Central Africa. Member countries include Cameroon, Chad, the Central African Republic, Equatorial Guinea, Gabon, and the Republic of Congo. ECCAS (the Economic Community of Central African States) is a wider grouping of Central African States and includes, in addition to the CEMAC countries, Angola, Burundi, the Democratic Republic of Congo, Rwanda, and Sao Tome and Principe. 2
ECOWAS (the Economic Community of West African States) includes Benin, Burkina Faso, Cape Verde, Côte d’Ivoire, Gambia, Ghana, Guinea, Guinea-Bissau, Liberia, Mali, Niger, Nigeria, Senegal, Sierra Leone and Togo.
Singh. Dominique Njinkeu coordinated the
work for the chapter on trade facilitation.
Other Team members included Gilberto de
Barros, Paul Brenton, Maximilien Tiogang
Djomo, Patrick Eozenou, Abib Gaye, Olivier
Hartman, Mombert Hoppe, Faustin Ange
Koyassé, Ranga Rajan Krishnamani, Taye
Alemu Mengistae, Sylvie Ndze, Victoire
Ngounoue, Carlo del Ninno, Peter Osei, and
Gael Raballand. Greg Binkert (Country
Director for Cameroon), Eric Bell (Acting
Sector Manager), and Cia Sjetnan (Senior
Country Officer) provided guidance and
advice, and have been an invaluable source
of encouragement.
The Team also benefited greatly from
consultations with Cameroon’s key policy
makers and analysts, who provided
important insights, in particular the
following institutions: the BEAC, the
Ministry of Finance, the Ministry of
Economy and Planning, and the National
Institute of Statistics. The Team is also
grateful to their colleagues at the
International Monetary Fund.

July 2012, Issue No. 4 / Page 6
Recent Economic Developments
Growth
Most recent estimates confirm the
expectations for economic growth in 2011
that we had presented in the January issue
of our Cameroon Economic Updates (see
text Table below). Cameroon’s economic
recovery gained greater momentum in
2011, after a slowdown of two years
following the global economic and financial
crisis. It is estimated to have reached 4.2
percent (compared with 2.9 percent in
2010) on the back of continued strong
performance in non-oil activities, oil
production pursuing its decline.
Inflation
Initiatives to boost agricultural production,
subsidize food imports, and improve
distribution seem to have contained
pressure on food prices in 2011 (Figure 1).
These pressures were gaining momentum
over the summer (increasing at their peak
by 5.8 percent year-on-year in July), but
subsided in the later part of the year. Food
inflation is estimated to have reached 3.9
percent (year-on-year) in 2011. As a result
the headline inflation rate reached 2.7
percent (year-on-year), stable compared
with the 2.6 percent observed last year over
the same period. The stability of retail prices
for petroleum products has also contributed
in containing inflationary pressures.
Figure 1 : Selected Price Increases, 2007-11 (year-on-year)
Fiscal performance
While revenue performance over the last
quarter of 2011 turned out to be broadly in
line with our expectations, spending was
much higher. Pressure on current spending
could not be contained and ended 2.3
percentage points of GDP above its
budgeted level, mainly on the back of higher
expenditure on goods and services (0.6
percentage point of GDP), as well as greater
spending on subsidies (1.4 percentage
points of GDP). Capital outlays accelerated
in the last quarter, reaching 6.4 percent of
GDP. As a result, the overall fiscal deficit on
a cash basis (including grants and before
% contribution towards GDP growth 2009 2010 2011
Primary sector 0.6 1.2 0.9
Secondary sector (excl. oil) 0.1 0.9 0.8
Oil -0.8 -0.6 -0.3
Tertiary sector 2.0 1.4 2.8
GDP Growth 2.0 2.9 4.2
Sources: Cameroonian authori ties and Staff ca lculations
-6-4-202468
101214
Sources: Cameroonian authorities and staff calculations
Total (Headline) CPI Food Price Index Fuel Price Index

July 2012, Issue No. 4 / Page 7
payment of arrears) turned out to be a
percentage point and a half of GDP wider
than budgeted (see text Table below).
Meeting this larger financing requirement
has substantially drawn down government
deposits at the regional central bank, the
BEAC. In addition, the central government
seems to have been tempted to delay the
transfer to municipalities of local revenue
transiting through the Treasury Single
Account (TSA). Since the introduction of a
single declaration for taxpayers paying VAT,
income tax, and patents (above a certain
level), the share of the proceeds of these
taxes that should go to municipalities are
transferred to the TSA. With cash-strapped
local governments, such delays may lead to
arrears and a further weakening of the
budget process.
Furthermore, despite securitization and
some cross-compensation, fewer payment
obligations could be settled than budgeted
and new ones could not be prevented from
being accumulated, particularly with the
SONARA, the national oil refinery. The
company is benefitting from assistance to
compensate it for its revenue shortfalls
stemming from the government’s policy to
freeze retail prices of petroleum products.
This continued high stock of unsettled
payment obligations will weigh on the
liquidity position of the government and on
the execution of the 2012 budget.
2012 Outlook
The economic momentum observed in
Cameroon in 2010 and 2011 is expected to
carry over into 2012 with the construction
of large infrastructure projects and
continued efforts to improve agriculture
productivity. Furthermore, oil production is
expected to rebound (although only
temporarily), expanding by 8 percent in
2012 (Figure 2). Private operators account
for this increase, their production expanding
to 10.1 million barrels (up from 6 million
barrels in 2011), on the back of significant
exploration in the past years and a more
2010 2011 2011 2011
Jan.
Est. Budget Proj. Est.
Revenue and Grants 17.5 17.6 19.4 18.9
Oil Revenue 4.5 3.5 5.2 5.4
Non-oil Revenue 12.4 13.2 13.3 13.0
Grants 0.6 0.9 0.9 0.5
Total Spending 18.6 18.9 18.9 21.7
Current Spending 14.5 13.1 13.6 15.4
Capital Spending 4.1 5.7 5.4 6.4
Overall Balance -1.1 -1.3 0.4 -2.8
Arrears -1.1 -1.3 -1.3 -0.5
Overall Balance on a cash basis -2.3 -2.6 -0.9 -3.4
Sources: Cameroonian authorities and staff calculations
Fiscal Performance, 2009-11
(in percent of GDP)

July 2012, Issue No. 4 / Page 8
intense exploitation to take advantage of
the current high international oil prices.
Figure 2 : Oil Production, 2002-12 (Millions of barrels)
However, the continued unfolding of the
sovereign debt crisis in advanced
economies, particularly in the Euro zone,
clouds the economic outlook. And at the
time of writing, these clouds seem to have
grown larger and darker. The potential
transmission channels of this crisis to
Cameroon’s economy are expected to be
similar to those observed during the
2008/09 global financial crisis, namely
finance, trade, and remittances. As a result,
economic growth in Cameroon could
amount to about 5 percent in 2012.
The global linkages of the financial system of
the CEMAC region are still limited and the
banking sector remains sufficiently liquid to
meet the credit needs of the government
and the private sector. Furthermore, the
budget of Cameroon does not rely heavily
on aid flows, hence any adverse impact from
lower aid following fiscal austerity measures
in the Euro zone should be limited.
As discussed in the January issue of the
Cameroon Economic Updates, the main
transmission channel would thus be through
exports and remittances. The Euro zone is
still the largest market for Cameroon’s
exports. With slower economic growth,
demand for products using Cameroonian
inputs such as housing (wood) or cars
(rubber) could decline. In this regard, the
recent dip in economic sentiment observed
in the Euro zone and the continuous
downward revisions in growth forecasts are
sources of concern (Box 1).
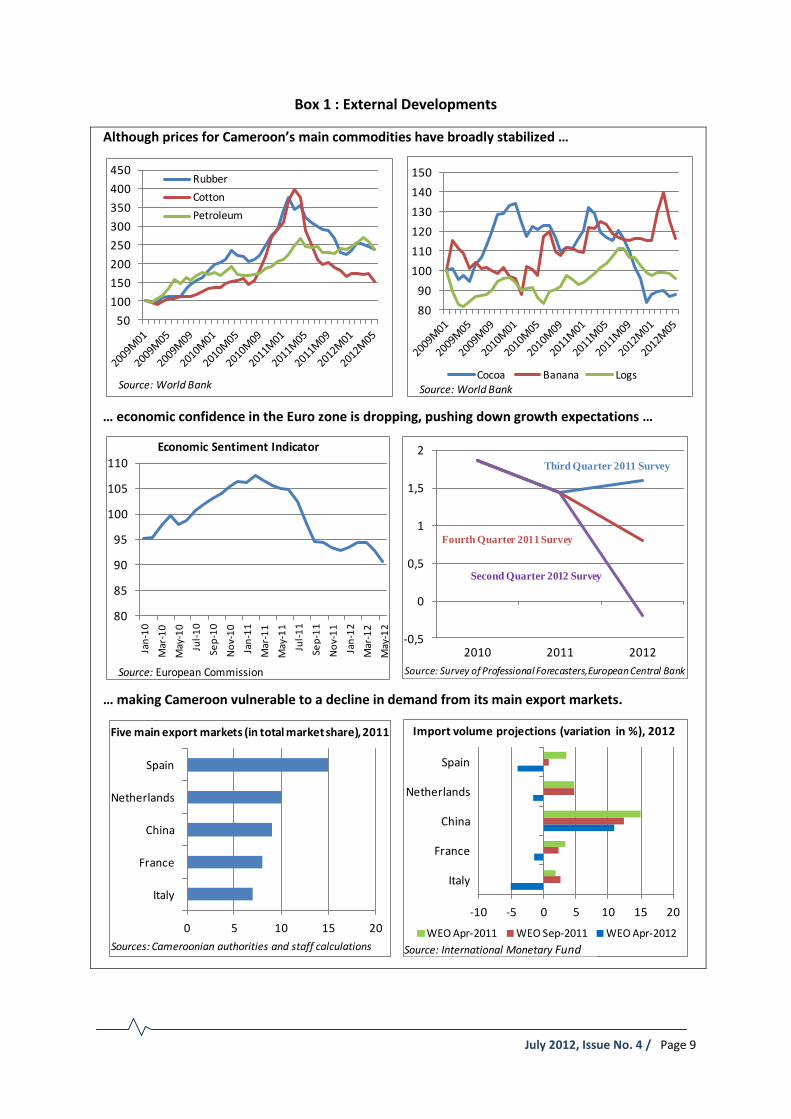
The European Commission’s index of
consumer sentiment for the Euro Area
showed in May a deep decline to a two-and-
a half year low. Weak economic confidence
is likely to translate into a more cautious
behavior by consumers and businesses,
postponing investments for instance,
thereby further depressing demand.
15
20
25
30
35
40
2002 2003 2004 2005 2006 2007 2008 2009 2010 2011 2012*
Sources: SNH and staff calculations
July 2012, Issue No. 4 / Page 9
Box 1 : External Developments
Although prices for Cameroon’s main commodities have broadly stabilized …
… economic confidence in the Euro zone is dropping, pushing down growth expectations …
… making Cameroon vulnerable to a decline in demand from its main export markets.
50
100
150
200
250
300
350
400
450Rubber
Cotton
Petroleum
Source: World Bank
80
90
100
110
120
130
140
150
Cocoa Banana LogsSource: World Bank
80
85
90
95
100
105
110
Jan
-10
Mar
-10
May
-10
Jul-
10
Sep
-10
No
v-1
0
Jan
-11
Mar
-11
May
-11
Jul-
11
Sep
-11
No
v-1
1
Jan
-12
Mar
-12
May
-12
Economic Sentiment Indicator
Source: European Commission
-0,5
0
0,5
1
1,5
2
2010 2011 2012
Source: Survey of Professional Forecasters,European Central Bank
Third Quarter 2011 Survey
Fourth Quarter 2011 Survey
Second Quarter 2012 Survey
0 5 10 15 20
Italy
France
China
Netherlands
Spain
Five main export markets (in total market share), 2011
Sources: Cameroonian authorities and staff calculations
-10 -5 0 5 10 15 20
Italy
France
China
Netherlands
Spain
WEO Apr-2011 WEO Sep-2011 WEO Apr-2012
Source: International Monetary Fund
Import volume projections (variation in %), 2012

July 2012, Issue No. 4 / Page 10
The regular quarterly surveys of professional
forecasters, carried out by the European
Central Bank, capture this growing gloom.
Their average 2012 growth forecast for the
Euro zone has continuously declined over
the past quarters, indicating now the
expectation of an economic contraction.
More worrisome, the latest vintages of the
IMF’s World Economic Outlook indicate
continuous downward revisions for
projected imports for Cameroon’s main
export markets, with demand in most
markets now expected to decline. Although
remaining in positive territory, even demand
in China is slowing.
Concerning fiscal performance, on the basis
of the first quarter, the projections for 2012
would indicate that slippages in current
spending (particularly because of an under-
estimation of the cost of keeping retail fuel
prices frozen) would offset higher-than-
expected oil revenue (see text Table below).
As a result, the overall deficit on a cash basis
is expected to reach 2.7 percent of GDP. As
in past years, the budgeted amount for
compensating SONARA for its revenue
shortfall is expected to fall short: an
estimated CFAF 400 billion being needed in
2012 instead of the CFAF 170 billion
budgeted.
Inflation is expected to remain below the
regional convergence criterion of 3 percent.
Despite the recent decision to adjust
electricity prices, the ongoing initiatives to
boost agricultural production and subsidize
the import of food are likely to continue
having a moderating effect on price
pressures.
Photo credit: Raju Jan Singh
2012 2012 2012
LF Q1 Proj.
Revenue and Grants 2273 573 2411
Revenue 2207 572 2345
Oil revenue 557 104 699
Non-oil Revenue 1650 468 1646
Grants 66 2 66
Total Spending 2552 528 2727
Current Spending 1760 380 1945
Capital Spending 792 148 782
Overall Balance -279 46 -316
Arrears -26 -2 -26
Overall Balance on a cash basis -305 44 -342
Sources: Cameroonian authorities, Staff's estimates
(in CFAF Billions)
Fiscal Performance, 2012

July 2012, Issue No. 4 / Page 11
Against this backdrop, efforts to increase
the economy’s resilience to shocks should
be strengthened. The reduced level of
remaining government deposits at the
regional central bank will only provide a
limited buffer, should matters become
worse than currently projected. In this
regard, the nascent domestic capital market
offers alternative sources of temporary
financing, complementing any possible
shortfall in fiscal savings.
Efforts to create a liquid secondary market
for government bonds would help sustain
investors’ interest in future bond issues.
Improvements in fiscal reporting would also
foster investors’ confidence, since it will
make the government’s fiscal position more
transparent.
Too often, people perceive the oil sector as
surrounded by opacity and related to poor
governance. In this regard, a law on the
implementation of the Extractive Industries
Transparency Initiative (EITI) and the
introduction of a budget line dedicated to
this activity would be a strong signal of the
country’s willingness to report in a
transparent manner payments and income
from its natural resources.
The composition of public spending could
also be examined. The need for subsidies,
particularly for food and fuel, should be
openly and candidly discussed. Data show
that these subsidies mostly favor the rich
and are largely ineffective in protecting the
incomes of those most affected by price
variations, as well as the incomes of the
poorest. As mentioned in the January issue
of our Cameroon Economic Updates, the
richest 20 percent of the population
captures most the subsidies on gasoline and
diesel, and over 40 percent of the subsidies
on rice, wheat, and fish.
A comprehensive and carefully planned
approach is necessary to reform the current
system, and decide how much and when to
change prices, and about who to
compensate. These decisions should be
made based on an analysis of the country’s
context. Alternative programs and measures
that target specific vulnerable groups and
those categories vulnerable to price
increases will be more effective if
accompanied by the introduction of a
targeted social safety net program. Policy
changes should be discussed with a broad
range of stakeholders, and communicated
effectively to the public in a way that takes
into consideration the perceptions and
expectations of different segments of
society.

July 2012, Issue No. 4 / Page 12
Finally, Cameroon could also think about
diversifying even further its export markets
away from its traditional partners. A more
diversified product base, as well as more
diversified markets, would increase the
resilience of the economy and reduce its
vulnerability to external shocks. In this
regard, trade facilitation – the topic of our
special focus – plays a critical role.
Trade Facilitation: Opportunities and Challenges
Recent Trade Patterns
Cameroon is ideally positioned to take
advantages of the economic opportunities
offered by greater trade. Due to its strategic
location neighboring Nigeria and Gabon, and
potential crossing point to the landlocked
countries of Central Africa (Chad and the
CAR), Cameroon is a natural hub for the
region with the port of Douala as the main
entrance.
In addition, the country is diverse with a
geography that ranges from Sahelian semi-
desert in the north through grassland to
equatorial forest in the south, favoring
varied economic and agricultural activities.
Furthermore, Cameroon is endowed with
significant natural resources, including oil,
high value timber species, and agricultural
products (coffee, cotton, cocoa). Untapped
resources include natural gas, bauxite,
diamonds, gold, iron, and cobalt.
Despite this diversity, Cameroon’s export
base remains narrow. Although the
economy is fairly diversified (with services
representing about 48 percent of GDP in
2011), the country remains a commodity
exporter (Box 2), focused on very few
products. Five products accounted for about
¾ of all its exports in value in 2011: crude
and petroleum products, cocoa, logs and
processed wood.
Photo credit: Raju Jan Singh

July 2012, Issue No. 4 / Page 13
Box 2 : Evolving Trade Patterns (in percent of market share)
Although Cameroon remains heavily dependent … and the European Union is still its main on commodity exports trading partner …
… trade to Asia and Africa has been expanding … and within Africa CEMAC has grown …
… into Cameroon’s largest African market … while Nigeria remains its main import source.
Sources: Cameroonian authorities and staff calculations
Oil & petroleum products
39%
Cocoa 19%
Wood products
12%
Cotton 2%
Rubber 3%
Bananas 3%
Others 22%
European Union 42%
United States
5% China &
India 13%
Africa 25%
Others Countries
15%
Total trade, 2010 (in percent of market share)
-20
-15
-10
-5
0
5
10
15
European Union
United States
China & India
Africa Others Countries
Variation in market share, 2000-10 (in %)
-20
-15
-10
-5
0
5
10
15
CEMAC Nigeria South Africa
Mauritania Others Africa
Variation in African market share, 2000-10 (in %)
CEMAC 60%
Nigeria 8%
Congo (DRC)
8%
Benin 7%
Others Africa 17%
Exports, 2010
CEMAC 10%
Nigeria 58%
South Africa
7%
Mauritania 5%
Others Africa 20%
Imports, 2010

July 2012, Issue No. 4 / Page 14
The European Union remains the country’s
main trading partner, buying in 2011 about
half of its exports in value (mainly crude to
Spain and Italy, cocoa to the Netherlands,
processed wood to Belgium and Italy, and
aluminum to France). The Union also
provides a third of Cameroon’s imports.
The importance of Europe as trading partner
has, however, been declining with the
emergence of China, India, and African
economies. China has become, for instance,
Cameroon’s most important market for
cotton and logs, buying more than half of
the country’s exports of these products.
Photo credit: Raju Jan Singh
According to reported data, Nigeria has
become Cameroon’s main import source,
representing a bit less than a quarter of all
imports in value in 2011 (ahead of France,
representing 13 percent of the Cameroon’s
imports). Within Africa, CEMAC has grown
to be Cameroon’s main export market,
mainly petroleum products to Chad.
Seizing trade opportunities in the regional
context would provide a good learning
ground for becoming competitive on the
world scene. The region seems to offer
promising markets for Cameroonian
products, especially agriculture, and may be
easier to enter, as their standards would be
closer to those of Cameroon. For Cameroon,
this would mean consolidating its position in
the CEMAC market and then capturing
opportunities in the wider regional market
through the ECOWAS.
For countries to take advantage of the
opportunities offered by freer trade and for
these benefits to be more inclusive, greater
openness to trade should be accompanied
by a number of policies that would ensure
factor mobility (Box 3). This chapter will,
however, focus only on the trade facilitation
aspect.

July 2012, Issue No. 4 / Page 15
Box 3 : Trade and Poverty: A Discussion of the Literature
A number of recent studies emphasize the importance of complementary policies in determining
the benefits or costs of trade for developing countries. The way greater trade openness affects
poverty depends on a variety of structural characteristics that may help or hamper a country’s
ability to take advantage of international competition. Trade liberalization should therefore not
be seen in isolation and additional policies are needed to enhance its beneficial impact,
including on poverty.
In its simplest form, trade theory suggests that the abundant factor should see an increase in its
real income when a country opens up to trade. If the abundant factor in developing countries is
unskilled labor, then this framework suggests that the poor (unskilled) in developing countries have
the most to gain from trade. Krueger (1983) has used this insight to argue that trade reforms in
developing countries should be pro-poor, since these countries are most likely to have a
comparative advantage in producing goods made with unskilled labor.
From a dynamic perspective, economic growth plays an important role in reducing poverty and
trade is argued to lead to the needed increases in productivity to sustain growth. Freer trade
provides greater incentives for investment, benefits of scale and competition, limitation on rent-
seeking activities favored by trade restrictions, and openness to new ideas and innovations
(Grossman and Helpman, 1991; Lucas, 1988).
However, should the re-allocation of factors be hampered, the expected benefits from freer trade
may not materialize. For incomes of the unskilled to increase, labor needs to be able to move out of
contracting sectors and into expanding ones. Davis and Mishra (2006), Goh and Javorcik (2006) and
Topalova (2006) suggest that labor in the real world may not be as mobile: there are too many
barriers to entry and exit for firms, and too many barriers to labor mobility for workers.
Against this backdrop, Winters et al. (2004) suggested that freer trade should be combined with
other policies encouraging investment, allowing effective conflict resolution, and promoting
human-capital accumulation. Bolaky and Freund (2008) show that trade reforms actually lead to
income losses in highly regulated economies. Excessive regulations restrict growth because
resources are prevented from moving into the most productive sectors and to the most efficient
firms within sectors. Le Goff and Singh (2012) suggest that trade openness tends to reduce poverty
in African countries, as their financial sector grows deeper, their education level higher, and their
governance stronger.
Challenges
In a world characterized by trade in tasks
rather than products undertaken by firms
located all over the world, there is a need
to reduce barriers along the entire supply
chain and take into account the fact that
during the manufacturing process
intermediate products cross many borders.
In this regard, the trading across border
component of the World Bank’s Doing

July 2012, Issue No. 4 / Page 16
Business Indicators provides an insight on
the level of challenges faced by Cameroon.
The procedural requirements for importing/
exporting are a reflection of the regulatory
environment facing traders. These are far
greater in Cameroon than in the other
countries (Box 4).
Box 4 : (Un)ease to Trade: International Comparison, 2012
Source: World Bank
Cameroon
Ghana
Malaysia
Mozambique
Senegal
Thailand
Vietnam
0 5 10 15
Documents to import (number)
0 5 10 15
Cameroon
Ghana
Malaysia
Mozambique
Senegal
Thailand
Vietnam
Documents to export (number)
0 20 40
Cameroon
Ghana
Malaysia
Mozambique
Senegal
Thailand
Vietnam
Time to import (days)
0 5 10 15 20 25
Cameroon
Ghana
Malaysia
Mozambique
Senegal
Thailand
Vietnam
Time to export (days)
0 500 1 000 1 500 2 000 2 500
Cameroon
Ghana
Malaysia
Mozambique
Senegal
Thailand
Vietnam
Cost to import (US$ per container)
0 500 1 000 1 500
Cameroon
Ghana
Malaysia
Mozambique
Senegal
Thailand
Vietnam
Cost to export (US$ per container)

July 2012, Issue No. 4 / Page 17
It takes 12 documents to import a
commodity and 11 documents to export a
commodity in Cameroon (as compared to an
average of about 6 to 8 in a sample of
emerging economies and other African
countries aspiring to the emerging economic
status). With few exceptions, the time taken
for importing is more than in the selected
countries (23 days in Cameroon as
compared to an average of 16 days in the
other selected countries). It costs three
times more to import a commodity in
Cameroon than in Malaysia, Vietnam or
Thailand.
A wider measure of the trade and logistics
environment of countries is the World
Bank’s Logistics Performance Index (LPI).
The LPI covers the entire supply chain,
based on a survey of nearly 1,000 logistics
professionals (international freight
forwarders) across 155 countries. The
results may be considered to represent the
experience of a large number of logistics
providers and logistics buyers. The overall
LPI score is based on performance on six
aspects of logistics performance. These are:
customs efficiency, infrastructure quality,
ability to track and trace shipments,
timeliness in reaching a destination,
competence of the domestic logistics
industry in the country, and the ease of
arranging and managing international
shipments. Cameroon’s performance is here
again lagging (Figure 3).
Figure 3 : LPI Performance: A Comparison, 2012
Finally, the Enabling Trade Index (ETI)
summarizes the situation. In 2012,
Cameroon was ranked 118 out of 132
countries on the basis of the ETI score
(Figure 4). Cameroon’s rank is lagging and
substantial effort would be needed to catch
up.
Figure 4 : ETI Performance: A Comparison, 2012 (out of 132 countries)
This index has four components. The first
measures the extent to which the policy
framework welcomes foreign goods into the
country and enables access to foreign
markets for its exporters. The second is the
0
0.5
1
1.5
2
2.5
3
3.5
4
4.5
Source: World Bank
0
20
40
60
80
100
120
140
Source: World Bank

July 2012, Issue No. 4 / Page 18
extent to which the administration at the
border facilitates the entry and exit of goods
and services. The third is the availability of
transport and communication necessary to
facilitate the movement of goods within the
country, and across the border. The fourth is
the quality of governance, as well as the
overarching regulatory and security
environment facing importers and
exporters.
Trade Facilitation and Logistics
From a trade facilitation perspective,
efficient movement of freight along the
corridor from the port to the inland
commercial centers is crucial for the region’s
external competitiveness. This in turn
depends on the efficiency of the port and
the inland movement of road freight from
the port to final inland destinations. Reform
of both the physical aspects (transport
infrastructure) and the non-physical aspects
(regulatory and documentation processes of
transit trade) are essential for an efficient
movement of freight – with efficiency
assessed in terms of the cost, time and
predictable movement of freight along the
corridor.
Port Efficiency
Improved port procedures at the gateway
provide great opportunities for a country
aspiring to assume an emerging economy
status. Maritime gateways are at the
interface between the region and the rest of
the world. They are the locations in which
several complex processes take place,
including the physical transfer of cargo
between shipping and inland road transport.
Ports are also the locations where
information and financial exchanges
between the wide range of operators
involved in trade and transport facilitation
processes take place. Time is a key element
of each of these processes.
Container dwell time – the amount of time a
shipment waits at port – is an indicator of
port efficiency. Data based on the Douala-
N’Djamena corridor show that port delays
account for more than half of the delivery
time from arrival at the port to final inland
destinations. Recent statistics from the
container terminals indicate an average
dwell time at Douala of 18.6 days in 2010 as
compared to average dwell time of 4 days in
Durban (South Africa), 11 days in Mombasa
(Kenya) and 14 days in Dar es Salaam
(Tanzania), and about 3 to 4 days in most
international ports3.
3 G. Raballand et al. (2012), Why does Cargo Spend
Weeks in Sub-Saharan African Ports?

July 2012, Issue No. 4 / Page 19
The container dwell time depends on three
factors:
Operational dwell time which depends
on the performance of physical
operations at the port;
Transactional dwell time which depends
on the performance of cargo clearance
activities by customs and other
regulatory agencies; and finally
Storage dwell time which depends on
the voluntary storage of cargo in the
container yard, as well as other
environmental factors such as lack of
finance, availability and efficiency of
transport services.
In the port clearance process, customs play
an important role, and they have generally
been perceived as the most important
source of delays. Accordingly, most efforts
to reduce port dwell-time in Cameroon has
focused on improving the efficiency of
customs, through the introduction of
automated systems, or an electronic single
window. Customs officers have also been
encouraged to sign idividual performance
contracts with the twin goals of enforcing
compliance and expediting cargo clearance
(Box 5). These efforts have led to both
improvements in revenue collection at
customs and in import clearance time.
Photo credit: Raju Jan Singh
A sequential analysis of delays at the port
shows, however, that the time taken
between the arrival of the vessel and
customs declaration lodging (operational
dwell time) and the time taken between the
payment of customs duties and gate exit
(storage dwell time) together account for
three-quarters of the container dwell time
at Douala. In contrast, the time taken by
customs (transactional dwell time) accounts
for just about a quarter of the container
dwell time.

July 2012, Issue No. 4 / Page 20
Box 5 : Individual Performance Contracts in Cameroon Customs: A World Premiere
As in many developing countries,
Customs revenue is an important
component of fiscal revenue. About a
quarter of government revenue is
collected by Customs. Hence it is
important for Cameroon to reconcile the
goal of enforcing compliance with the
trade facilitation goal of expediting cargo
clearance of traders deemed to be usually
compliant.
Cameroon’s Customs administration has
suffered from corruption and struggled to
identify options for improving
governance. A customs reform program
was introduced, seeking to reduce
corruption, while simultaneously raising
revenue collection. The reform included
the installation of ASYCUDA (an
automated customs clearance system)
which would enable the administration to
not only track the processing of each
consignment, but also measure
performance against a number of criteria
relevant to the reform.
A continuation of these efforts has been the introduction in 2009 of individual performance
contracts – making Cameroon the first country in the World to adopt such an approach. These
performance contracts use objective and quantifiable data from the automated computer
system. The objectives of customs administration (facilitation and enforcement) are
complemented by specific objectives, which aim at abolishing bad practices. The results are
encouraging: higher revenue collection, shorter clearance times, and lower corruption
(measured through systematic firm surveys of a representative sample of customs brokers
undertaken before, during, and after the experimentation).
This suggests that customs is just one of the
many regulatory agencies. An approach
focused only on customs reforms needs,
therefore, to be replaced by a more
comprehensive one involving the complete
operations from the port to final inland
destinations for notable improvement to
traders. Only a comprehensive approach to
the problems encountered at the gateway
can lead to improvement of efficiency that
18.0
18.2
18.4
18.6
18.8
19.0
19.2
19.4
19.6
19.8
2008 2009 2010
Source: Cameroonian authorities
Dwell Time (Days)

July 2012, Issue No. 4 / Page 21
would enable the Cameroonian traders to
compete with their African and international
counterparts.
While Cameroon through targeted
interventions has been improving the
physical operations of the Douala port, the
critical mass of needed reforms is still
lacking. Attention should be on streamlining
the documentation process at the port
through adequate coordination of the many
actors (shippers, trade auxiliaries, border
management agencies, facilities operators,
and logistics services providers).
One framework for that is an operational
Single Window. Cameroon created in 1999
the “Guichet Unique des opérations du
Commerce Extérieur” (GUCE) in the form of
a joint association between the government
(including Customs, Ministry of Trade, Port
of Douala) and the private stakeholders
involved in the clearance process of
imported goods. Although the infrastructure
of the electronic version of the GUCE had
been in place by 2007, the implementation
is still in progress (see text Table below,
presenting the expected automation
schedule by procedure).
Photo credit: Raju Jan Singh
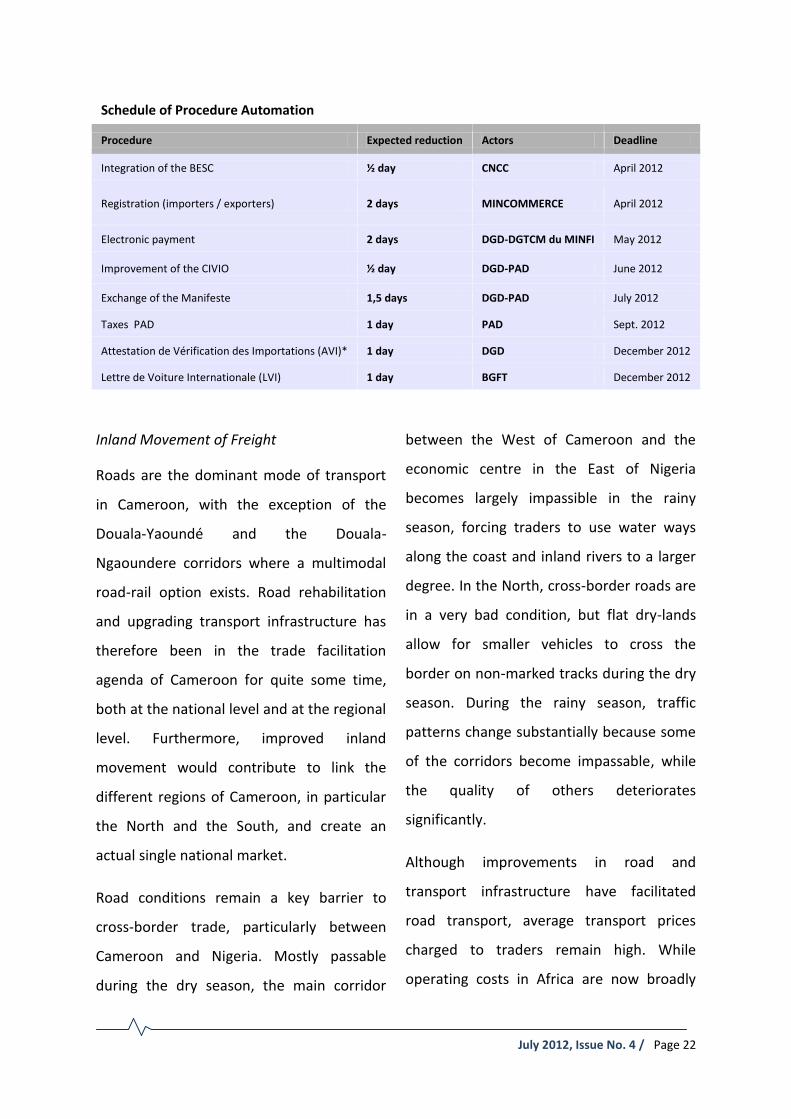
The main objective of the electronic version
of the GUCE is to replace paper-based cargo
clearance with automated procedures at the
Port of Douala (PAD) to reduce clearance-
related time and costs, and foster trade and
economic activity in Cameroon (and in the
CEMAC region). 2012 will be marked by a
move from a physical to an electronic single
window as indicated by the schedule in the
text Table below.
July 2012, Issue No. 4 / Page 22
Schedule of Procedure Automation
Procedure Expected reduction Actors Deadline
Integration of the BESC ½ day CNCC April 2012
Registration (importers / exporters) 2 days MINCOMMERCE April 2012
Electronic payment 2 days DGD-DGTCM du MINFI May 2012
Improvement of the CIVIO ½ day DGD-PAD June 2012
Exchange of the Manifeste 1,5 days DGD-PAD July 2012
Taxes PAD 1 day PAD Sept. 2012
Attestation de Vérification des Importations (AVI)* 1 day DGD December 2012
Lettre de Voiture Internationale (LVI) 1 day BGFT December 2012
Inland Movement of Freight
Roads are the dominant mode of transport
in Cameroon, with the exception of the
Douala-Yaoundé and the Douala-
Ngaoundere corridors where a multimodal
road-rail option exists. Road rehabilitation
and upgrading transport infrastructure has
therefore been in the trade facilitation
agenda of Cameroon for quite some time,
both at the national level and at the regional
level. Furthermore, improved inland
movement would contribute to link the
different regions of Cameroon, in particular
the North and the South, and create an
actual single national market.
Road conditions remain a key barrier to
cross-border trade, particularly between
Cameroon and Nigeria. Mostly passable
during the dry season, the main corridor
between the West of Cameroon and the
economic centre in the East of Nigeria
becomes largely impassible in the rainy
season, forcing traders to use water ways
along the coast and inland rivers to a larger
degree. In the North, cross-border roads are
in a very bad condition, but flat dry-lands
allow for smaller vehicles to cross the
border on non-marked tracks during the dry
season. During the rainy season, traffic
patterns change substantially because some
of the corridors become impassable, while
the quality of others deteriorates
significantly.
Although improvements in road and
transport infrastructure have facilitated
road transport, average transport prices
charged to traders remain high. While
operating costs in Africa are now broadly

July 2012, Issue No. 4 / Page 23
similar to those in France, average transport
prices are much higher (Figures 5 and 6).
The average transport price on the Douala-
N’Djamena corridor, for instance, is about
11 cents per ton Km. These road freight
rates are almost double than that of China,
three times higher than in Brazil, and more
than five times higher than in Pakistan.4
Figure 5 : Average Transport Costs: A Comparison, 2007 (USD per veh Km)
Figure 6 : Average Transport Prices: A Comparison, 2007 (US cents per ton Km)
Why is that? The system is, first of all,
largely inefficient in matching demand for
with supply of transport services. Trucks
wait for long periods for a contract. This
4 Teravaninthorn, S. and G. Raballand (2009),
Transport Prices and Costs in Africa: A Review of the International Trade Corridors.
adds to lengthy immobilization of trucks at
the extremities of the corridors, in terminals
and gateways, lengthening truck rotations
and reducing the number of paid trips a
truck can make in a year. As a consequence,
transport prices charged to shippers are
high to make up for this inefficient use of
trucks.
More importantly, however, over-regulation
plagues the transport systems with road
travel being the most afflicted. The
mechanisms linking over-regulation and
high transport costs have been analyzed in a
study. 5 It shows that in the absence of
adequate market regulation for road
transport, gains linked to better roads are
not likely to be passed on to shippers and
consumers in the form of reduced transport
prices.
For instance, road transport on the Douala
corridors is regulated through bilateral
agreements which restrict competition.
Agreements between Cameroon and Chad
and between Cameroon and CAR cover
cargo-sharing and enforcement
mechanisms, and have kept transport prices
high.
5 Ibidem. The greatest disconnect between costs and
prices was along the Ngoundere-Moundou corridor.
0
0.5
1
1.5
2
2.5
Central Africa East Africa West Africa Southern Africa France
Source: World Bank
0 2 4 6 8 10 12
Pakistan
Brazil
United States
China
West Europe Long Distance (France)
Africa: Durban-Lusaka
Africa: Lome-Ouagadougou
Africa: Mombasa-Kampala
Africa: Douala-N'Djamena
Source: World Bank

July 2012, Issue No. 4 / Page 24
Transport prices charged to shippers in
Central Africa tend, therefore, to be
disconnected from the actual vehicle
operating costs. The system seeks to protect
existing transport operators at the expense
of encouraging competition. Inefficient
operators are thus kept afloat, pushing
down the quality of road transport services
to the lowest level possible, since there is no
incentive to offer better services. Worse,
shippers are even reported to have to pay
bribes in order to access the limited pool of
operators.
The existing regulatory system is justified on
the grounds of fairness, since transport
profits could be shared with small-sized
trucking operators. In many cases in Central
Africa, however, the benefits of market
regulation are captured by a few people at
the expense of the whole economy.
A reform of the trucking industry would
therefore be necessary to address these
issues and must not be limited to liberalizing
freight access. Rather it must aim at
transforming the industry itself to
encourage the provision of high-quality
transport services.
Finally, a large number of roadblocks and
high informal payments along the major
corridors add to transport costs, especially
for small traders. Recent research has
tended to show that traders are likely to
encounter a roadblock by a government
agency (such as customs, gendarmerie, the
police, or the army) every 10-20 km in some
areas in Cameroon, interrupting the flow of
goods and causing major delays. For
instance, the costs of transporting goods
from the Nigerian border in Ekok to
Bamenda are estimated to increase by
about 100-150 percent. Initial analysis
suggests that in the area of the Western
corridor, removing these additional charges
could reduce consumer prices for products
imported from Nigeria by roughly 4 to 6
percent.
Deepening Market in CEMAC
Beyond improving port efficiency and inland
transport, a priority for Cameroon should be
to make CEMAC an effective Customs Union
(CU). At the moment, policies and
procedures at the regional level are little
harmonized and very limited trade is taking
place among member countries (Figure 7).
CEMAC accounts only for 2 percent of trade
of its member countries (as compared to 8
percent in ECOWAS, 10 percent in the SADC
region and over 15 percent in the WAEMU

July 2012, Issue No. 4 / Page 25
region).6 To become an effective CU, tariff
nomenclature and product standards would
need to be harmonized, common Customs
Management Regulations adopted and an
efficient regional payment system put in
place.
Figure 7 : Intra Regional Trade, 2010
Tariff Nomenclature
The Common Tariff Nomenclature (CTN) is a
harmonized system for goods classification
that would be applicable to all CEMAC
member states. The system is designed for
classifying goods with the same
characteristics and similar duty
requirements. This system is known to
reduce delays, decrease transactions costs,
and make the Common External Tariff (CET)
easier to implement.
The specific activities necessary for CEMAC
to achieve this goal would be to (i) develop
and update the CTN, and prepare guidelines
6 Brenton, P. et al. (2012), Defragmenting Africa:
Deepening Regional Trade Integration in Goods and Service.
to promote standardized interpretation; (ii)
conduct a gap analysis of the differences
between the nomenclature currently used
by each member state and the CTN; (iii)
develop a national strategy and work plan
for implementing the CTN, and (iv) establish
a mechanism for maintaining a standardized
interpretation of CTN across the CEMAC
region.
Photo credit: Raju Jan Singh
Common Customs Management Regulations
In any customs union, member states must
adopt a uniform set of trade requirements
and formalities, including customs
procedures. Adoption of common standards
0
2
4
6
8
10
12
14
16
Source: African Development Bank

July 2012, Issue No. 4 / Page 26
helps to streamline bureaucratic procedures
and reduce time and trade costs. Common
Customs Management Regulations (CMR)
provide for these standardized customs
procedures.
For the CMR to be effective, CEMAC
member states would need to align their
national legislation and regulatory
frameworks with the CMR. Aligning national
legislation and regulatory framework would
simplify regional trade customs procedures,
reduce red tape and prevent opportunities
for corruption.
Regional Payments System
The cost, speed, reliability, and accessibility
of payment systems have a major impact on
transactions costs. An efficient payment
system is therefore essential for any country
to participate in international trade.
Cross-border payments in the CEMAC region
are, however, still characterized by the
predominance of cash. This is partly
explained by the low acceptance of non-
cash payment instruments. Costly, slow,
unreliable, and difficult to access payments
systems encourage the use of cash over
electronic payments.
Efforts are ongoing to integrate payment
systems in CEMAC with a view to extend
coverage and usage of these forms of
payment services. Such initiatives will
contribute to improve the flow of resources
through formal transmittal channels, and
extend access to a variety of payment
services.
There are currently, however, a limited
number of delivery channels and access
points (automated teller machines (ATM)
and point-of-sale (POS) terminals). Use of
mobile banking or branchless banking
techniques by financial sector institutions in
CEMAC is also lacking.
Efforts at the regional and at the national
levels to develop the payment system
should thus be strengthened by improving
access points and delivery channels. The
focus should be on meeting user needs and
delivering accessible services through cost-
efficient channels.
Widening market opportunities to Nigeria
and ECOWAS
Cameroon and Nigeria share a common
border of nearly 1,700km, as well as strong
historical and cultural ties. According to
official statistics, the bulk of the current
trade between Nigeria and Cameroon is
dominated by oil and fuel. However, these
official statistics do not reflect the
substantial commercial exchanges between

July 2012, Issue No. 4 / Page 27
the two countries, with goods and services
being traded both through legal and
informal channels.
Nigeria is the biggest economy in the region
with a GDP in 2009 of over USD 173 billion.
With over 150 million people, it represents a
vast consumer market, nearly five times
larger than the combined markets of the
other CEMAC countries (excluding
Cameroon). Improving the linkages with
Nigeria would also give Cameroonian
producers better access to all of West Africa.
This should create trading prospects for
larger companies from Cameroon, as well as
chances for smaller niche producers.
Cameroon is significantly smaller with
around 20 million people and a GDP in 2009
of about USD 22 billion. But despite the
difference in the market size both countries
can benefit from better market access and
reduced trading costs. Preliminary estimates
suggest that official trade flows from
Cameroon to Nigeria are only at about four
percent of the potential trade flows. While
informal export flows from Cameroon to
Nigeria are estimated to be significantly
above official statistics, the results of the
analysis still suggest that substantial
additional gains remain. This means that
exports could expand significantly, possibly
generating additional employment.
Recent analytical work has assessed the key
barriers that small- and medium-sized
traders face when engaging in cross-border
trade. While barriers differ somewhat
depending on the location along the border,
road conditions and roadblocks, as
discussed in the previous section, remain
key barriers to cross-border trade.
Photo credit: Raju Jan Singh
Administrative requirements further
increase trading costs or generate delays.
These include the negotiation of fees and
duties at the border, visa fees, and meeting
product standards for distribution across
borders. Administrative and informal
payment arrangements relating to cross-

July 2012, Issue No. 4 / Page 28
border trucking result in trucks generally not
crossing borders, and goods being unloaded
and re-loaded at borders, complicating the
logistics chain and raising costs.
To reduce barriers to trade and allow
citizens on both sides of the border to
benefit from differences in production
patterns, a comprehensive agenda of
infrastructure investment, reduction of
informal road blocks and payments, and
improving border procedures is central.
While to date investment in infrastructure in
border areas particularly in the North seems
to have been neglected and should be
pursued, investment in the important
corridor between Bamenda and Enugu is
under way. It will be critical to supplement
the investment in physical infrastructure,
such as roads, by policy initiatives to reduce
the number of road blocks substantially,
foster competition among transport
providers, and ensure compliance with
existing regulations. Increasing transparency
at borders will be important to minimize the
opportunities for rent extraction.
Current procedures, requirements, and legal
fees and payments should be clearly
indicated, and to keep trading costs low for
small- and medium-sized traders, the
introduction of a simplified customs scheme
for these groups could be considered. Such
a scheme would streamline procedures,
reduce illegal payments by traders, and
make payments more predictable. If
carefully tailored and implemented, such a
scheme would ensure that effective trade
costs for small- and medium-sized traders
would not increase. It would reduce or keep
constant the overall amount of payments
made by traders, while increasing official
receipts for the government and reducing
the time and uncertainty linked to crossing
the border. If formal fees were reduced,
traders would be less likely to make informal
payments and prefer paying the lower
formal fees to avoid subsequent
harassments. Official receipts would also
increase, as traders currently avoiding
official border-crossings because of
administrative delays would start using
them and pay formal duties.
July 2012, Issue No. 4 / Page 29
REFERENCES
Bolaky, B. and Freund, C. (2008), “Trade, Regulations, and Income”, Journal of Development
Economics, Vol. 87(2), pp. 309-21
Brenton, P. and G. Isik (2012), De-Fragmenting Africa: Deepening Regional Trade Integration
in Goods and Services, The World Bank, Washington, DC.
Chauffour, J.-P. and J.-C. Maur (2012), Preferential Trade Agreement: Policies for
Development. A Handbook, The World Bank, Washington, DC.
Davis, D. and Mishra, P. (2006), “Stopler-Samuelson Is Dead and Other Crimes of Both
Theory and Data”, in Harrison, A. (ed.), Globalization and Poverty, University of
Chicago Press for NBER, Chicago, IL
Goh, C. and Javorcik, B.S. (2006), “Trade Protection and Industry Wage Structure in Poland”,
in Harrison, A. (ed.), Globalization and Poverty, University of Chicago Press for NBER,
Chicago, IL
Grossman, G. and E. Helpman (1991), Innovation and Growth in the Global Economy,
Cambridge, MA and London: MIT Press.
Krueger, A. (1983), Trade and Employment in Developing Countries, 3: Synthesis and
Conclusions, University of Chicago Press, Chicago, IL
Le Goff, M. and R. Singh (2012), “Does Trade Reduce Poverty? A View From Africa”, paper
presented at the Annual Conference of the Center for the Study of African
Economies, Oxford, March 18-20, 2012.
Likeng, M., M. Djeuwo, and S. Bilangna (2011), Gazing Into the Mirror II: Performance
Contracts in Cameroon Customs, Good Practice Paper No 1, Sub-Saharan Transport
Policy Program and World Bank, Washington, DC.
Lucas, R. (1988), “The Mechanics of Economic Development,” Journal of Monetary
Economics, Vol. 22, pp. 3–42.
Raballand, G., S. Refas, M. Beuran, and G. Isik, (2012), Why Does Cargo Spend Weeks in Sub-
Saharan African Ports? The World Bank, Washington, DC
Teravaninthorn, S. and G. Raballand (2009), Transport Prices and Costs in Africa: A Review of
the International Corridors, The World Bank, Washington, DC
Topalova, P. (2006), “Trade Liberalization, Poverty and Inequality: Evidence From Indian
Districts” in Harrison, A. (ed.), Globalization and Poverty, University of Chicago Press
for NBER, Chicago, IL

July 2012, Issue No. 4 / Page 30
Winters A., McCulloch, N. and McKay, A. (2004), “Trade Liberalization and Poverty: The
Evidence So Far”, Journal of Economic Literature, Vol XLII, pp. 72-115.
World Bank (2012), “Connecting to Compete: Trade Logistics in the Global Economy. The
Logistics Performance Index and its Indicators”, Washington, DC.
World Bank (2012), “Doing Business in a More Transparent World,” Washington, DC.