cameroon | displacement report, far north region rd 12... · internally displaced individuals both...
TRANSCRIPT

Cameroon | Displacement Report, Far North Region Round 12 | 27 November – 08 December 2017

Cameroon | Displacement Report, Far North Region, Round 12| 27 November – 08 December 2017
23 December 2017 1
The opinions expressed in the report are those of the authors and do not necessarily reflect the views of the International Organization for Migration (IOM). The designations employed and the presentation of material throughout the report do not imply the expression of any opinion whatsoever on the part of IOM concerning the legal status of any country, territory, city or area, or of its authorities, or concerning its frontiers or boundaries.1
IOM is committed to the principle that humane and orderly migration benefits migrants and society. As an intergovernmental organization, IOM acts with its partners in the international community to assist in meeting the operational challenges of migration, advance understanding of migration issues, encourage social and economic development through migration and uphold the human dignity and well-being of migrants. This report was not reviewed by IOM’s Publications Unit. International Organization for Migration UN House Comice Maroua Far North Region Cameroon Cecilia Mann Tel.: +237 694 495 023 E-mail: [email protected] Website: www.globaldtm.info/cameroon/ All rights reserved. No part of this publication may be reproduced, stored in a retrieval system, or transmitted in any form or by any means, electronic, mechanical, photocopying, recording or otherwise without the prior written permission of the publisher.

Cameroon | Displacement Report, Far North Region, Round 12| 27 November – 08 December 2017
23 December 2017 2
Cameroon | Displacement Report,
Far North Region, Round 12 | 27 November – 08
December 2017

Cameroon | Displacement Report, Far North Region, Round 12| 27 November – 08 December 2017
23 December 2017 3
Table of Contents METHODOLOGY ............................................................................................................................................. 5 CONTEXT ........................................................................................................................................................ 6 CHALLENGES .................................................................................................................................................. 7
KEY INFORMATION ............................................................................................................................................. 8 INTERNALLY DISPLACED PEOPLE (IDPS) ............................................................................................................ 17
Overview of Movements Between Departments ......................................................................................... 19 DIAMARÉ ...................................................................................................................................................... 20 LOGONE-ET-CHARI ....................................................................................................................................... 20 MAYO DANAY ............................................................................................................................................... 20 MAYO KANI .................................................................................................................................................. 20 MAYO SAVA ................................................................................................................................................. 21 MAYO TSANAGA .......................................................................................................................................... 21
OUT OF CAMP REFUGEES ................................................................................................................................. 22 DIAMARÉ ...................................................................................................................................................... 24 LOGONE-ET-CHARI ....................................................................................................................................... 25 MAYO DANAY ............................................................................................................................................... 25 MAYO KANI .................................................................................................................................................. 25 MAYO SAVA ................................................................................................................................................. 25 MAYO TSANAGA .......................................................................................................................................... 26
RETURNEES ....................................................................................................................................................... 27 DIAMARÉ ...................................................................................................................................................... 30 LOGONE-ET-CHARI ....................................................................................................................................... 30 MAYO DANAY ............................................................................................................................................... 31 MAYO KANI .................................................................................................................................................. 31 MAYO SAVA ................................................................................................................................................. 31 MAYO TSANAGA .......................................................................................................................................... 31
APPENDIX I ....................................................................................................................................................... 36 DISPLACED POPULATIONS............................................................................................................................ 36
APPENDIX II ...................................................................................................................................................... 38 REASONS FOR DISPLACEMENT ..................................................................................................................... 38
APPENDIX III ..................................................................................................................................................... 40 NEWLY EVALUATED VILLAGES ..................................................................................................................... 40
APPENDIX IV ..................................................................................................................................................... 41 VARIATION SINCE ROUND 11 ....................................................................................................................... 41

Cameroon | Displacement Report, Far North Region, Round 12| 27 November – 08 December 2017
23 December 2017 4
SUMMARY The International Organization for Migration (IOM) developed a displacement tracking system, the Displacement Tracking Matrix (DTM) to track and monitor displacement and population mobility. DTM’s tools gather information on various levels and of various kinds, including information on where displacements occur, why they occur, the length of displacement, and the conditions of migrants and internally displaced individuals both on site and in transit. This information is shared with relevant stakeholders, including humanitarian and government actors, to enhance understanding of movements of population and of affected peoples’ needs. This report aims to provide an overview of the situation in Cameroon’s Far North region, where displacements are primarily caused by insecurity (largely due to acts of violent extremist groups) and, to a lesser extent, climatic phenomena. The information presented in this report was collected directly from displaced populations in the region in close collaboration with local and national authorities between 27 November and 8 December 2017.
The displaced population is estimated at 342,416 individuals: 241,030 internally displaced people (IDPs), 29,337 out of camp refugees, and 63,692 returnees.
747 villages were assessed, including four new villages. 69 of the villages were uninhabited.1
91% of the target population is displaced due to the armed conflict in the region.
9% of the target population is displaced due to flooding and other climatic factors.
51% of the displaced population is comprised of men and boys.
49% of the displaced population is comprised of women and girls.
65% of the target population is aged 0-18 years old.
3% of the target population is aged 60 years or older.
45% of displaced households live with host families, 22% live in spontaneous sites, 15% live in rented homes, 14% returned to their original dwelling, 2% live in collective centers and 1% in the open air without shelter.
1 The number of villages hosting members of at least one of the target populations (IDPs, out of camp refugees, returnees) is estimated at 683.

Cameroon | Displacement Report, Far North Region, Round 12| 27 November – 08 December 2017
23 December 2017 5
METHODOLOGY AND CONTEXT
METHODOLOGY
DTM data collection was carried out by 100 enumerators who were deployed in 6 departments of the Far North Region: Mayo-Kani, Mayo-Danay, Diamaré, Logone-et-Chari, Mayo-Tsanaga, and Mayo-Sava. To facilitate coordination and data collection, the enumerators were separated into three categories: focal points, team leaders and enumerators.
During this round of data collection, 747 sites2 were evaluated, with the objective of gathering up-to-date data on displacement in the region. In addition, 4,339 households were surveyed, including 1,967 IDP households, 705 out of camp refugee households (living in host communities as opposed to refugee camps) and 1,667 returnee households. 140 spontaneous sites were included in the data collection.3
The enumerators involved in the implementation of this tool are regularly trained on DTM methodology in Maroua. This capacity building exercise, conducted several times a year, is intended to strengthen local data collection and analysis capacity.
Electronic tablets were used during data collection to facilitate analysis and to improve data accuracy and validity. Four different forms were saved on the tablets, enabling a tailored line of questioning for each level of the exercise. These levels included the departmental level, the district level, the village level and the household level. The tablets were formatted to ensure coherent and complete information, thus minimizing human error.
Four levels of questioning were conducted as follows:
1. The departmental evaluation was carried out by focal points who work in close coordination with the prefects of their respective districts. At this level, the sample size for the ensuing household survey is established.
2. The district evaluation was carried out by the team leaders in coordination with the sub prefects. At this stage, the village lists are updated.
3. The village evaluation was carried out by the basic enumerators in coordination with the village chiefs and representatives of the displaced community. 4. The fourth and final layer of data collection is the household survey, which is based on the household sample defined in the departmental evaluation and the list of villages established in the district evaluation in coordination with the village chief.
2 Sur ces 747 localités, 69 se sont avérées détruites ou inhabitées, expliquant donc le chiffre de 678 localités cité dans les parties analytiques de ce rapport. Veuillez également noter que nos équipes ne vont pas dans chacun de ces villages, mais choisissent plutôt un échantillonnage représentatif pour effectuer leurs descentes terrain. Les autres villages sont évalués à partir des informateurs clés au niveau de l’arrondissement. Sur la base des informations dont nous disposons aujourd’hui, la DTM couvre 100% des villages abritant les trois populations ciblées et présentées dans ce rapport. 3 Des sites de personnes déplacées ont été identifié dans cinq des six départements évalués (il existe 4 sites spontanés dans le Diamaré, 92 dans le Logone-Et-Chari, 22 dans le Mayo-Danay, 10 dans le Mayo-Sava, et 12 dans le Mayo-Tsanaga). Les récents déplacements n’auraient pas considérablement influencé sur le nombre total de site spontanés.

Cameroon | Displacement Report, Far North Region, Round 12| 27 November – 08 December 2017
23 December 2017 6
Traditional and religious authorities were involved in every step and all information was validated by the Regional Governor prior to publication.
CONTEXT
Since 2014, Cameroon has been affected by attacks perpetrated by the violent insurgent group Boko Haram. The frequent threats and attacks on towns and populations continue to provoke significant displacement throughout the Far North Region. Due to its geographic position and cultural links (including proximity to Chad and Nigeria), the region has experienced significant material and human loss.
The International Organization for Migration (IOM) established the Displacement Tracking Matrix (DTM) in the Far North region in November 2015 to gain insight into the profiles and movements of internally displaced people (IDPs), out of camp refugees and returnees, as well as their needs and vulnerabilities. The information collected is intended to provide both the Government of Cameroon and the humanitarian community with a better understanding of population movement and displacement in the Far North Region.
In order to ensure a common understanding of the populations targeted in this report, the following definitions are used:
• An internally displaced person (IDP) is a person who is forced to leave his or her place of origin and move to another location within the same country. These movements are generally caused by external circumstances, including natural disasters and conflict.
• An out of camp refugee is a person who is a national of a country other than the one he or she is currently in and who fled his or her country of origin, but is not living in an official refugee camp.
• A returnee is a person who had been living in an area other than his or her area of origin (within the same country or abroad) and has returned to his/her area of origin. A distinction is therefore made between former IDPs and returnees from abroad.
This report contains information collected between 27 November and 8 December 2017 and presents data on the following questions: demographic information, comparative evolution of trends since the last report, geographical distribution of displacement, places of origin and destination, reasons for displacements, length/frequency of displacement, types of shelter that displaced populations occupy, livelihoods that displaced populations engage in, and intentions (including return intentions).
The data was collected in six departments, 37 districts, and 747 villages. Of the 69 uninhabited villages, 53 are located in the Logone-et-Chari department.

Cameroon | Displacement Report, Far North Region, Round 12| 27 November – 08 December 2017
23 December 2017 7
CHALLENGES The volatile security situation in the region and several related incidents pose the primary challenge
in terms of access in the area. In fact, DTM coordinators decided to temporarily halt operations in the
field three days before the planned ending of the data collection exercise, following abduction threats
against humanitarian workers in the areas covered by the survey. After re-evaluating the situation two
days later, the implementation of the survey was able to continue.
In addition, at the planned starting date for data collection, several armed group incursions and suicide attacks were reported in some of the departments and localities in which investigations were planned. Keeping safety as a top priority, enumerators were able to complete data collection remotely for those risk areas.
A second difficulty arises with the rainy season, as floods restrict the access by land to the different localities. To cope with this limitation, the teams set up a system of communication with key informants in so-called "at risk" areas in order to obtain information through means, such as by phone.

Cameroon | Displacement Report, Far North Region, Round 12| 27 November – 08 December 2017
23 December 2017 8
DISPLACED POPULATION
KEY INFORMATION
A total of 342,416 individuals, including 241,030 IDPs (40,507 displaced households), 31,656 out of camp refugees (5,126 households) and 69,730 returnees (10,915 households) were identified during round 12.
Displacement by Department
Department Evaluated
Villages Total
Population4 Displaced
Population % Displaced Population
Diamaré 46 642 227 5 912 1%
Logone-et-Chari 457 486 997 179 758 37%
Mayo-Danay 37 529 061 16 862 3%
Mayo-Kani 22 404 646 816 0%
Mayo-Sava 60 348 890 76 634 22%
Mayo-Tsanaga 125 699 971 62 434 9%
4 Les chiffres de ‘population totale’ sont tirés de l’annuaire statistique du Cameroun, publié par l’Institut National de la Statistique (INS) en 2015, mentionnant la population départementale en 2005, et estimant la population cumulée de la région de l’Extrême Nord à 3 897 577 en 2014 pour un taux de croissance annuel de 2,4%. Comme cité dans ce document de référence, ces chiffres ne prennent pas en considération la dynamique crée par les flux migratoires.
70.4%
9.2%
20.4%
Displaced population by Target Population
Internally displaced persons
Out of camp refugees
Returnees

Cameroon | Displacement Report, Far North Region, Round 12| 27 November – 08 December 2017
23 December 2017 9
Demographic Profile
Among the identified population, 33% of head of households were women with an average age of 40 years old. The average age of the 67% male head of households was 43 years old. The majority of the population is younger than 18 years old (64%).
According to the household survey, which covered 4,339 households in the region, the distribution of female headed households (FHH) by department is as follows:
Department IDP FHH Refugee FHH Returnee FHH Total FHH Diamaré 128 4 132 Logone-Et-Chari 147 122 124 393 Mayo-Danay 86 5 93 184 Mayo-Kani 6 1 32 39 Mayo-Sava 180 109 289 Mayo-Tsanaga 137 79 178 394 Total 684 207 540 1431
Table 1- Proportion of female headed households by department and target population.
The average household size was 7 persons with 95% of households including children. The average age of the children was 5 years old.
11%
18%
24%
15%
29%
3%
0- 2 yrs
3-5 yrs
6-12 yrs
13-17 yrs
18-59 yrs
60 yrs +
10%
18%
22%
13%
35%
2%
Displaced population, by Sex and Age
Male 51% Female 49%

Cameroon | Displacement Report, Far North Region, Round 12| 27 November – 08 December 2017
23 December 2017 10
Map 1: Distribution of the three target populations in the Top3 Department of the region.

Cameroon | Displacement Report, Far North Region, Round 12| 27 November – 08 December 2017
23 December 2017 11
Reasons for Displacement
91% of the target population was displaced due to the Boko Haram conflict, whereas 9% were displaced due to flooding and other climatic factors. 555 people were displaced due to inter-communal tensions, which represents less than 1% of the total target population. These figures do not indicate any significant changes when compared with data collected from round 11.
The table below illustrates the primary displacement reasons for the surveyed sample of the IDP households and out of camp refugees, explaining the multiple successive displacements.
Reason for Displacement Among IDPs and Refugees Climatic event Conflict Total
Primary displacement 10% 57% 67%
Secondary displacement 4% 20% 24%
Tertiary displacement 3% 4% 7%
More than three displacements 1% 1% 2%
Total 17% 83% 100% Distinguishing between secondary or tertiary displacement caused by climatic factors and which follow a primary displacement caused by conflict, and secondary or tertiary displacement caused by conflict and which follow a primary displacement caused by climatic factors, is a difficult exercise.
On the whole, among surveyed IDPs and out of camp refugees, primary displacements5 caused by conflict were far more prevalent than primary displacements caused by climatic factors.
Although the majority of the target population was displaced due to security related issues, the level and nature of the impact on individuals and households varied. The results of household surveys showed that in most cases, people left their areas of origin after their area of origin (83%) or nearby villages (31%) were attacked. Please note that multiple responses were possible and the results are not exclusive.
5 This refers to IDPs and out of camp refugees that have been displaced once or twice, respectively.

Cameroon | Displacement Report, Far North Region, Round 12| 27 November – 08 December 2017
23 December 2017 12
6
Distribution of Shelter Types
In terms of shelter types, no significant variations were observed between rounds 10 and 11. 45% of displaced households lived with host families, 22% lived in spontaneous sites, 15% lived in rented homes, 14% were able to return to their original dwellings, 2% lived in collective centres and less than one per cent lived in the open air without shelter.7
6 Please note that these reasons are not exclusive. 7 Please note that these figure refer to the entire target population. The nuances by type of population are presented below. The only population group concerned by the return to place of origin are returnees.
83%
41%
31%
21% 20%
7% 6%
0%
10%
20%
30%
40%
50%
60%
70%
80%
90%
1Frequency at which the element is mentioned as displacement reasons
Reasons for displacement (For Conflicts-Affected Households)
After incursions insidevillage of origin
Houses burned/damaged byclashes
After incursion inside nearbyvillage
After military interventions
By fear
Economic impact of conflict
On military/nationalauthorities order

Cameroon | Displacement Report, Far North Region, Round 12| 27 November – 08 December 2017
23 December 2017 13
Livelihoods
The most common livelihood activities amongst the target population was agriculture: 54% of the displaced population lived off subsistence farming, while 21% were herders. Casual work (31%) and agricultural employment (21%) also constituted important livelihood activities.
Comparison of round 11 and round 12 data shows an increase in the livelihood activities for which no
initial capital is required (casual work, agricultural employment, wood gathering) and a decrease of
livelihood activities necessitating tools, equipment or capital input (agriculture, fishing, herding).
Livelihoods of households before and after displacement
22%
15%
2%1%
45%
14%
Shelter types
Spontaneous sites
Rental
Collective
Open air
Host Families
Back Home
Livelihoods Rd 12 Rd 11 Evolution
Agriculture for personnal Capacity 43% 54% -11%
Daily worker 31% 26% 5%
Agricultural Employee 21% 21% 0%
Breeding 13% 21% -8%
Independent trade 15% 16% -1%
collecting wood 13% 12% 1%
Fishering 10% 12% -2%
Nothing 9% 7% 2%
Sale of Family property 4% 4% 0%
craft 3% 4% -1%
Private employee 2% 4% -2%
Resale of agricultural goods 5% 4% 1%
Services offering 3% 3% 0%
Begging 3% 3% 0%
Other 3% 0% 3%
Public administration employee 0% 0% 0%

Cameroon | Displacement Report, Far North Region, Round 12| 27 November – 08 December 2017
23 December 2017 14
Displacement Periods
The graphs below illustrate the displacement period as well as the frequency of displacement. 30% of the target population were displaced in 2016, while 24% were displaced in 2017, including 20% between January and October 2017 and 4% between October and December. The decline in the number of attacks by armed groups and the weakening of militant groups in the region more generally provides an explanation for the decrease in the number of IDPs observed in 2017. 24% of the displaced population has been displaced more than once. For example, individuals may have been initially displaced by conflict and then displaced again due to flooding of their displacement site or shelter, or their chosen area of destination may be attacked, provoking further displacement.
Travel Duration and Means of Transportation
Most of the target population (48%) indicated having had to travel less than a day from their area of origin to their area of destination, while 38% travelled between one and three days, and 10% travelled between three and seven days. Less than two per cent of the target population have had to travel more than a week to reach their area of destination.
5%
15%
26%
30%
20%
3%
Displaced population by displacement Period
Before 2014
2014
2015
2016
Jan-Oct 2017
Oct-Dec 2017
67%
24%
7%
2%Frequency Displacement
First displacement
2nd displacement
3th displacement
4 or moredisplacements

Cameroon | Displacement Report, Far North Region, Round 12| 27 November – 08 December 2017
23 December 2017 15
It was also found that most displaced people (75%) travelled by foot. This can be explained by the fact that many displaced persons tend to stay in areas that are relatively close to their place of origin and which can be reached by foot. Economic constraints and little availability of alternative means of transportation also play a role.
48%
38%
10%
3% 1% 0%
One day Two to threedays
One week Two weeks One month Many months
Length of journey
1%
5%
6%
10%
12%
7%
18%
75%
0% 10% 20% 30% 40% 50% 60% 70% 80% 90% 100%
Military transport
Canoe
Animal back
By car
Common/Public transport
Bicycle
Motorbike
On foot
Transportation means of Displaced Households

Cameroon | Displacement Report, Far North Region, Round 12| 27 November – 08 December 2017
23 December 2017 16
Items Transported:
The results of the household surveys showed that the primary items brought along during displacement are consistent with information collected during previous data collections: personal objects (66%), clothes (64%) and cooking utensils (29%). In addition, 25% of surveyed households also brought sleeping materials and 18% brought food.
Visits to Area of Origin
Among the IDP and unregistered refugee populations, 21% indicated having returned to their areas of origin since their initial displacement8. These visits had various purposes: to evaluate a possible return (27%), check on the condition of homes left behind (26%), visit family (18%) and to cultivate crops (17%). Conversely, 78% of those questioned have not returned to their areas of origin since their initial displacement, which can largely be explained by the continued insecurity in their areas of origin and restricted access to these areas.
Return Intentions9
Among the IDP and out of camp refugee populations, 26% indicated a desire to displace again, including 31% who expressed the wish to return to their areas of origin. Those planning on displacing again, be it a return or a second displacement, cited livelihood opportunities as their primary motive (60%).
8 Returnees are not included in these figures. 9 Returnees are not included in the numbers of this section.
74% 26%
Return Intentions
No Yes
78.22%
21.78% No
Yes
Cameroon | Displacement Report, Far North Region, Round 12| 27 November – 08 December 2017
23 December 2017 17
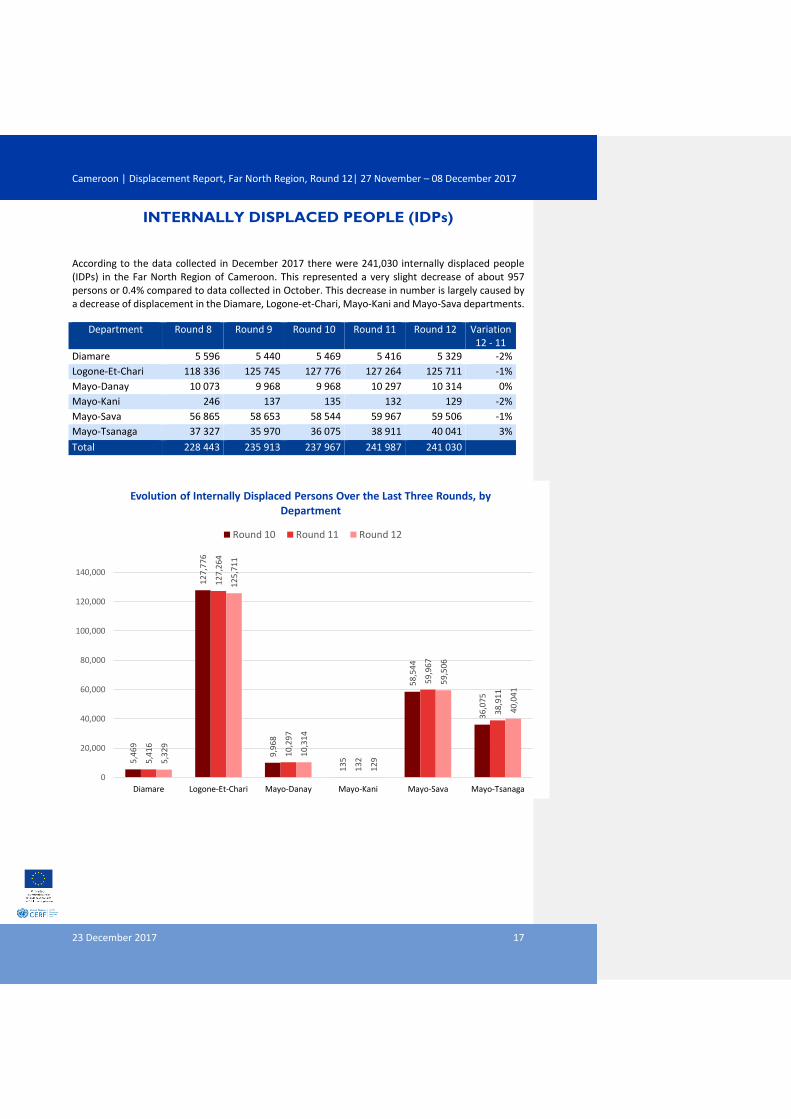
INTERNALLY DISPLACED PEOPLE (IDPs)
According to the data collected in December 2017 there were 241,030 internally displaced people (IDPs) in the Far North Region of Cameroon. This represented a very slight decrease of about 957 persons or 0.4% compared to data collected in October. This decrease in number is largely caused by a decrease of displacement in the Diamare, Logone-et-Chari, Mayo-Kani and Mayo-Sava departments.
Department Round 8 Round 9 Round 10 Round 11 Round 12 Variation 12 - 11
Diamare 5 596 5 440 5 469 5 416 5 329 -2%
Logone-Et-Chari 118 336 125 745 127 776 127 264 125 711 -1%
Mayo-Danay 10 073 9 968 9 968 10 297 10 314 0%
Mayo-Kani 246 137 135 132 129 -2%
Mayo-Sava 56 865 58 653 58 544 59 967 59 506 -1%
Mayo-Tsanaga 37 327 35 970 36 075 38 911 40 041 3%
Total 228 443 235 913 237 967 241 987 241 030
5,4
69
12
7,7
76
9,9
68
13
5
58
,54
4
36
,07
5
5,4
16
12
7,2
64
10
,29
7
13
2
59
,96
7
38
,91
1
5,3
29
12
5,7
11
10
,31
4
12
9
59
,50
6
40
,04
1
0
20,000
40,000
60,000
80,000
100,000
120,000
140,000
Diamare Logone-Et-Chari Mayo-Danay Mayo-Kani Mayo-Sava Mayo-Tsanaga
Evolution of Internally Displaced Persons Over the Last Three Rounds, by Department
Round 10 Round 11 Round 12

Cameroon | Displacement Report, Far North Region, Round 12| 27 November – 08 December 2017
23 December 2017 18
Map 2: Distribution of Internally Displaced People (IDPs) in the Far North Region of Cameroon.

Cameroon | Displacement Report, Far North Region, Round 12| 27 November – 08 December 2017
23 December 2017 19
Displacement of IDPs within and between departments
Department Diamare Logone-Et-
Chari Mayo-Danay
Mayo-Kani Mayo-Sava
Mayo-Tsanaga Total
Diamare 2 222
2 834 273 5 329
Logone-Et-Chari 124 733
978
125 711
Mayo-Danay
9 736
578
10 314
Mayo-Kani 36
77 16
129
Mayo-Sava
512
58 994
59 506
Mayo-Tsanaga
9 335 30 706 40 041
Total 2 222 125 281 9 736 77 72 735 30 979 241 030
In Logone-Et-Chari, which holds 52% of all IDPs in the Far North Region, almost all displacement is
internal. Similarly, 81% of IDPs from Mayo-Tsanaga were displaced in that department with only 19%
of them being displaced in other departments of the region, mainly in Mayo-Tsanga (13%) and
Diamaré (4%). 1% of the displaced persons from Mayo-Tsanaga are in Diamaré, while the remaining
99% are displaced within the department. The current trend of IDPs is their internal movement within
each department, with the exception of Mayo-Sava which has very diverse movements.
An overwhelming majority of IDPs displaced in the Far North Region of Cameroon (92%) were
displaced by armed conflict. Climatic events led to the displacement of 8% of IDPs. Only 70 people
were displaced for another reason, namely the search for humanitarian assistance.
All of the IDPs displaced in the Diamare, Mayo-Kani, Mayo-Sava and Mayo-Tsanaga departments were
displaced by conflict. In Logone-et-Chari, 94% of IDPs were displaced as a result of conflict, and 6%
were displaced because of climatic events. Mayo-Danay is the only department of the Far North
Region where climatic factors accounted for the majority of displacement (94% of IDPs).
5,329
118,207
578
129
57,411
40,041
7,434
9,736
0% 10% 20% 30% 40% 50% 60% 70% 80% 90% 100%
Diamare
Logone-Et-Chari
Mayo-Danay
Mayo-Kani
Mayo-Sava
Mayo-Tsanaga
Reasons for displacement of Internally Displaced Persons
Conflicts Climate related Other

Cameroon | Displacement Report, Far North Region, Round 12| 27 November – 08 December 2017
23 December 2017 20
DIAMARÉ There were 5,329 IDPs in Diamaré, representing 2% of the region’s total IDP population and a 1% decrease in the number of IDPs displaced in the department round 11. The greatest concentration of IDPs in the department were in the districts of Maroua III (2,239 people) and Pette (2,040 people). 56% of them were displaced from Mayo-Sava.
The decrease is due to the returns of 42 IDPs from Maroua III to Limani in Mayo-Sava, their place of origin, where the security situation had improved. In addition, 46 other IDPs went from Meri to other localities in hopes to find an activity for their survival and occupation.
In Diamaré, the vast majority of households (566) live in rented homes, 309 live with host
families, and 60 live in spontaneous shelters. No significant variation between rounds 11
and 12 were noted in terms of shelter types.
LOGONE-ET-CHARI
There were 125,711 IDPs in Logone-Et-Chari, representing 52% of the Region’s total and a decrease of 1% since round 11. The majority of this population was in the districts of Makary (50,477 people), Kousseri (19,975 people), Fotokol (16,857 people), Logone-Birni (12,345 people) and Blangoua (7,153 people). Overall, this decrease in numbers can be explained by the high number of returns of IDPs to their original villages which have improved in terms of security situation. This has for instance been the case for the returns to Sagme, thanks to the strengthening of security and the return of the army to this location.
747 new IDPs were noted in the Waza district. These new arrivals were displaced by attacks by armed groups in their areas of origin or out of fear of retaliation.
In Logone-Et-Chari, 13,027 households live with host families, 3,397 live in rental homes, 4,378 live in spontaneous sites, and 107 live in the open air. This represented an increase in IDP households living in spontaneous sites and under the open air and a decrease of households that live with host families and in rented houses.
MAYO-DANAY 10 314 PDI live in this department, representing 4% of the region’s total IDP population. No significant changes were noted since the last round of data collection in October 2017. The districts that hosted the majority of the displaced population were Maga (5,256 people), Gueme (1,618 people), Gobo (1,523 people) and Yagoua (1,310 people).
In Mayo-Danay, 754 households live in spontaneous sites, 87 live in rental homes, 184 live in collective centers, 2 live in the open air and 460 live with host families. This represented an increase in IDP households living in host families and collective centers and a decrease in IDPs living in spontaneous sites and in houses.
MAYO-KANI
Mayo-Kani is the department that hosted the fewest IDPs, with 129 people (3 people fewer than in round 11). Its geographical distance from insecure areas largely explains this fact. The majority of the variation observed in terms of IDPs in this department is seasonal, especially since the department has a significant amount of arable lands.

Cameroon | Displacement Report, Far North Region, Round 12| 27 November – 08 December 2017
23 December 2017 21
In Mayo Kani, 5 households live in rental homes and 14 live with host families. No major changes were noted since round 9.
MAYO-SAVA With 59, 506 IDPs (25% of the regional total), this department hosted the second largest proportion of IDPs. The districts of Kolofata (14,521 IDPs) and Mora (43,257 IDPs) are regularly affected by security incidents, explaining the intensity of IDP movements.
A decrease pf 440 IDPs was noted in the Mora District, as individuals chose to return to their places of origin, namely the village of Doulo, located in the same district and the village of Amchidé in the Kolofata district.
5,244 households in Mayo-Sava live in spontaneous sites. 3,168 in rented homes and 2,085 in host families.
MAYO-TSANAGA
Mayo Tsanaga hosted 40,041 IDPS, representing 16% of the regional total. These people are mainly concentrated in the districts of Koza (16,314 people), Mokolo (10,638 people) and Mozogo (11,736 people).
The number of IDPs has increased by 3% since to round 11. This increase is mainly a result of the DTM accessing for the first time the Assighasia village in Mozogo district where 1,957 IDPs were registered. In addition, during this round of data collection, 285 individuals arrived in the village of Zamai Venus in Mozogo. The majority of these households are ex hottages of Boko Haram.
In Mayo Tsanaga, 121 households live in spontaneous sites, 1,094 live in rental homes, 533 live in collective centers, and 4,641 live with host families. Compared to round 11, this represents an increase of IDP households living in collective centers, and a decrease in the number of IDP households living in host families, spontaneous sites and rented houses.
6%21%
51% 50%
2%
61%16%
6%
26%
30%
16%
12%
8%
33%
62%
31%
74%
20%
70%
Diamare Logone-Et-Chari Mayo-Danay Mayo-Kani Mayo-Sava Mayo-Tsanaga
Shelter types of Internally Displaced Persons
Spontaneous sites Rental Collective Open air Host Families

Cameroon | Displacement Report, Far North Region, Round 12| 27 November – 08 December 2017
23 December 2017 22
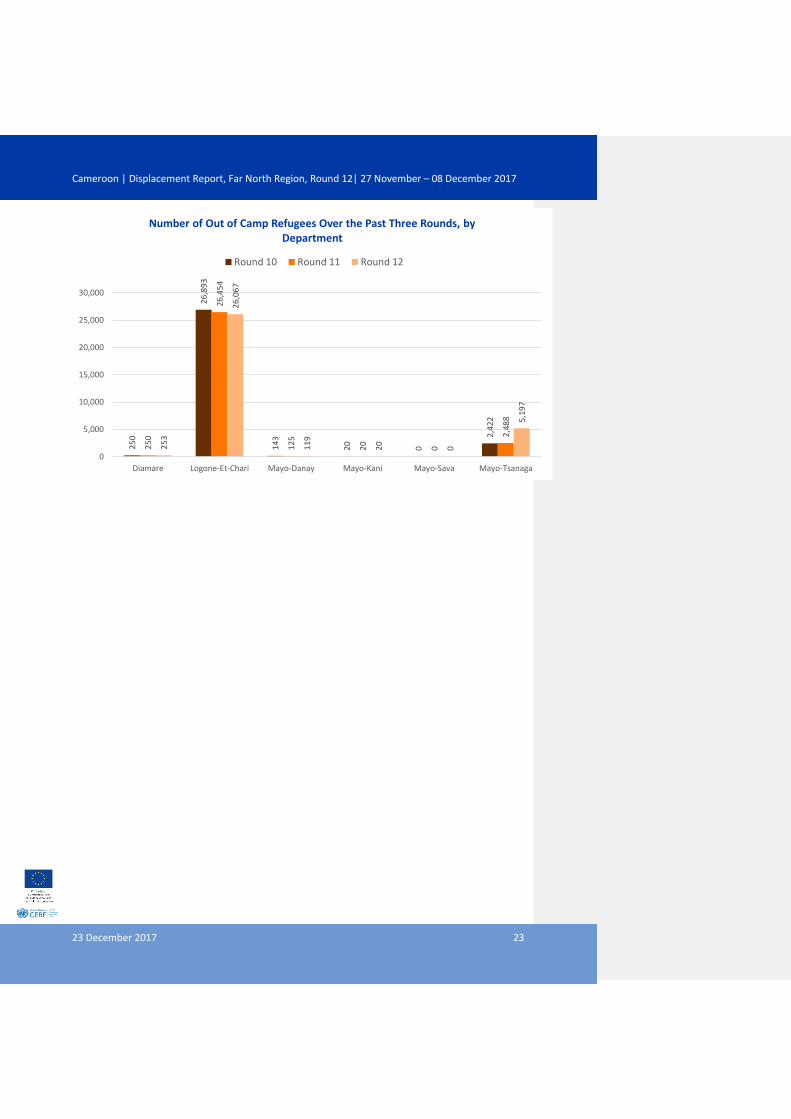
OUT OF CAMP REFUGEES 10 According to the information collected in December 2017, the Far North Region of Cameroon counted 31,656 out of camp refugees. This represents an increase of 8% since the last data collection in October 2017 (2,319 more people). This increase is mainly a result of the DTM accessing for the first time the Assighasia village where 2,748 refugees were registered. In spite of this, the continued return of out of camp refugees to Nigeria, which began in August 2017, is ongoing.
This increase in the number of out of camp refugees between DTM rounds 11 and 12 does therefore not automatically mean an increase in out of camp refugees but rather of the geographical coverage of the exercise (see chart below). All unregistered refugees came from Nigeria, with the exception of 31 refugees in the Mayo Danay and 11 in the Pette departments, who came from Chad. All of these people came to Cameroon in search of a more stable environment.
The distribution of out of camp refugees since DTM round 8 is as follows:
Departments Round 8 Round 9 Round 10 Round 11 Round 12 Change 12 - 11
Diamare 166 271 250 250 253 1%
Logone-Et-Chari 28 773 27 655 26 893 26 454 26 067 -1%
Mayo-Danay 143 140 143 125 119 -5%
Mayo-Kani 11 20 20 20 20 0%
Mayo-Sava 204 0 0 0 0 NA
Mayo-Tsanaga 3 162 2 192 2 422 2 488 5 197 109%
Total 32 459 30 278 29 728 29 337 31 656
10 UNHCR is conducting registration for this population in the region. At the moment of the publication of this report, 21,189 out of camp refugees have been registered in the Logone-et-Chari and Mayp-Tsanaga departments. This exercise is expected to take place in the weeks to come in the Mayo-Sava.
Cameroon | Displacement Report, Far North Region, Round 12| 27 November – 08 December 2017
23 December 2017 23
25
0
26
,89
3
14
3
20
0
2,4
22
25
0
26
,45
4
12
5
20
0
2,4
88
25
3
26
,06
7
11
9
20
0
5,1
97
0
5,000
10,000
15,000
20,000
25,000
30,000
Diamare Logone-Et-Chari Mayo-Danay Mayo-Kani Mayo-Sava Mayo-Tsanaga
Number of Out of Camp Refugees Over the Past Three Rounds, by Department
Round 10 Round 11 Round 12

Cameroon | Displacement Report, Far North Region, Round 12| 27 November – 08 December 2017
23 December 2017 24
Map 3: Distribution of Out of Camp Refugees in the Far North Region of Cameroon

Cameroon | Displacement Report, Far North Region, Round 12| 27 November – 08 December 2017
23 December 2017 25
DIAMARÉ Diamare hosts 253 out of camp refugees, which represents 1% of the regional total. No change in the number of refugees was noted since round 11, apart from the arrival of 3 non-accompanied minors coming from Banki (Nigeria) to Haoussare in the Pette district.
In Diamaré, the majority of out of camp refugee households (24) live in spontaneous sites and 6 households live with host families. No significant change was noted since round 11.
LOGONE-ET-CHARI Logone-Et-Chari hosts a total of 26,067 out of camp refugees, representing 83% of the total out of camp refugee population in the region. This reflects a decrease of 387 people, or 1.5%, compared to October 2017. The majority of this population lives in the districts of Makary (13,645 people) and Fotokol (5,542 people).
In Logone-et-Chari, 2 213 out of camp refugee households live with host families, 1,851
live in spontaneous sites and 110 in rental homes.
MAYO-DANAY 119 out of camp refugees live in Mayo Danay, representing less than one per cent of the regional total. This number reflects a decrease of 6 persons, or 5% since the last data collection in October 2017, due to the voluntary return of refugees and of third country nationals, notably from Chad).
In Mayo-Danay, 15 out of camp refugee households live in rental homes and 10 live with host families. No major variation was noted in type of shelter was noted cvompared with
round 11.
MAYO-KANI 20 out of camp refugees live in this department. The total number of out of camp refugees stayed constant compared to round 11, showing that the displacement of out of camp refugees in other departments did not impact Mayo-Kani.
Two out of camp refugee households live in Mayo-Kani live with host families and one
household lives in a rented house.
MAYO-SAVA In line with the information collected since DTM round 9, no out of camp refugees were noted in Mayo Sava. Aucun réfugié hors camp n’a été signalé dans le Mayo-Sava, constat fait depuis le round 9. The absence of this target population in the department is in part explained by the refugee repatriation campaigns to Banki, Nigeria, that took place in June 2017, and by the voluntary return of refugees to Nigeria.
There were no unregistered refugees in Mayo-Sava.

Cameroon | Displacement Report, Far North Region, Round 12| 27 November – 08 December 2017
23 December 2017 26
MAYO-TSANAGA
Mayo Tsanaga hosts 5,197 out of camp refugees, the majority of which (1,309) live in the Mogode district. This represents an increase of 109% (2,709 people) since the previous round of data collection. The increase is mainly due to the newly evaluated village of Assighasia in the district of Mozogo which included 2,748 refugees.
32 refugees left Mokolo in Zileng and 26 refugees left Mogodo to return to their villages of origin in Nigeria.
In Mayo-Tsanaga, 476 out of camp refugee households in Assighasia live in collective
centers. For the other places in this department, a total of 409 out of camp refugee
households live with host families and 37 in rented homes. This represented an increase
in the number of households living in collective centers and with host families, and a
decrease in the number of persons living in rented homes. No refugee household lives in
a spontaneous site.
80%
44%
0%
3%
60%
33%
4%
20%
53%40%
67%
44%
Diamare Logone-Et-Chari Mayo-Danay Mayo-Kani Mayo-Sava Mayo-Tsanaga
Out of camp shelter types by Department
Spontaneous sites Rental Collective Open air Host Families

Cameroon | Displacement Report, Far North Region, Round 12| 27 November – 08 December 2017
23 December 2017 27
RETURNEES According to the data collected in December 2017, the Far North Region hosted 69,730 returnees. This
represented an increase of 9% compared to round 11 (6,038 additional people). This increase is
primarily noted in the Logone-et-Chari and Mayo-Sava departments.
Department Round 8 Round 9 Round 10 Round 11 Round 12 Change 12 - 11
Diamare 241 316 334 415 330 -20% Logone-Et-Chari 25 990 24 177 25 243 25 496 27 980 10%
Mayo-Danay 5 096 5 282 5 286 6 901 6 429 -7%
Mayo-Kani 633 755 726 668 667 0%
Mayo-Sava 12 265 13 065 13 437 13 467 17 128 27%
Mayo-Tsanaga 13 802 15 803 16 064 16 745 17 196 3%
Total 58 027 59 398 61 090 63 692 69 730 9%
Origin of returnees (former IDPs)
Department Diamare Logone-Et-Chari
Mayo-Danay
Mayo-Kani
Mayo-Sava
Mayo-Tsanaga Autre Total
Diamaré 19 19 Logone-Et-Chari 26 357 498 26 855 Mayo-Danay 352 6 036 6 388 Mayo-Kani 110 110 Mayo-Sava 190 8 644 4 843 76 13 753 Mayo-Tsanaga 10 3 072 7 655 1 098 11 835
200 26 709 6 534 0 11 845 12 498 1 174 58 960
The majority of returnees (85%) are former IDPs who
had been displaced within Cameroon and who
returned to their place of origin. Other returnees
came from neighboring countries, notably Nigeria
(15%), CAR and Chad.
Most former IDPs (48,692 or 83%) were previously
displaced within their department of origin. Returns
of IDPs displaced in other departments mainly
consisted of returns of IDPs from Mayo-Tsanaga to
Mayo-Sava as well as from Mayo-Sava and Mayo-
Tsanaga. Mayo-Sava and Mayo-Tsanaga witnessed a
few returns from other regions.
Cameroun 58 960
Nigéria 10 351
RCA 406
Tchad 13
Figure 2 Origin of Returnees

Cameroon | Displacement Report, Far North Region, Round 12| 27 November – 08 December 2017
23 December 2017 28
33
4
25
,24
3
5,2
86
72
6
13
,43
7 16
,06
4
41
5
25
,49
6
6,9
01
66
8
13
,46
7
16
,74
5
33
0
27
,98
0
6,4
29
66
7
17
,12
8
17
,19
6
0
5,000
10,000
15,000
20,000
25,000
30,000
Diamare Logone-Et-Chari Mayo-Danay Mayo-Kani Mayo-Sava Mayo-Tsanaga
Number of Returnees Over the Last Three Rounds, by Department
Round 10 Round 11 Round 12
Commented [MC1]: The numbers fr tound 11 are wrong. Please change
Commented [JRD2R1]: There was a mistake in the reporting for the First above table. It has been updated. We don’t need any changes for this graph

Cameroon | Displacement Report, Far North Region, Round 12| 27 November – 08 December 2017
23 December 2017 29
Map 3: Distribution of returnees in the Far North Region of Cameroon

Cameroon | Displacement Report, Far North Region, Round 12| 27 November – 08 December 2017
23 December 2017 30
DIAMARÉ Diamaré hosted 330 returnees, representing less than 1% of the regional total. This however represents a decrease of 20% compared to the data collection of October 2017. The majority of the target population in the department live in the village of Dargala, where they have lived since 2014 after returning from CAR for economic reasons.
In Diamaré, the majority of households (25) live with host families and 5 households live
in their own homes. An increase in the number of households that live in their own homes
as well as a decrease in the number of households living with host families has been
noted, compared to data collected in October 2017.
LOGONE-ET-CHARI Logone-et-Chari hosted 27,980 returnees, which represents 40% of returnees in the region. This
reflected an increase of 10% since the October round of data collection. The majority of the returnee
population in the department lived in the village of Fotokol, located in the district of the same name
(7,763 people), and in the village of Afadé, located in the Makary district (6,367 people).
The increase in returns during this round is related to the increase of returnees in Fotokol (1,325
additional persons), Makary (886 additional persons), Hile-Alifa (587 additional people) and Zina (498
additional people). Overall, this is due to the improved security in the areas of return and economic
recovery in the urban centers such as Fotokol ville.
In Logone-et-Chari, 3,814 households returned to their original dwelling, whereas 181 lived with host families, 72 in spontaneous sites, 8 in the open air, and 12 in rented homes. The increase in the number of returnees signifies an increase in the number of people able to return to their home as well as an increase in the number of people living with host families and in spontaneous sites.
23,551
572
17,128
17,086
4,416
6,388
311
95
Diamare
Logone-Et-Chari
Mayo-Danay
Mayo-Kani
Mayo-Sava
Mayo-Tsanaga
Reasons for Return
Conflicts Climate related Other
Commented [GL3]: Same numbers are provided as for Round 11 but in the next paragraph it states that more persons were observed in Fotokol and Makary than during the last round : better to re-check these numbers.
Commented [JRD4R3]: Checked, and These numbers are right for mentioned villages.

Cameroon | Displacement Report, Far North Region, Round 12| 27 November – 08 December 2017
23 December 2017 31
MAYO-DANAY 6 429 returnees live in Mayo-Danay, representing 10% of the regional total and a decrease of 7% compared to Round 11. This decrease is due to the 498 returns from the village of Tekel (in Maga) to Alvakai in Zina (Logone-et-Chari) where they engaged in fishing activities, as they were not able to receive assistance in shelters following their displacement in October 2017 caused by the floods.
In Mayo-Danay, 778 households returned to their original dwelling, 179 live with host
families, 2 in rental homes and 105 in spontaneous sites. This reflect a decrease in the
number of returnee households in spontaneous sites compared to round 11.
MAYO-KANI 668 returnees live in Mayo-Kani, representing 1% of the regional total and a slight decrease by 15 individuals, compared to data collection in October 2017. This decrease concerns mainly the village of Moulvoudaye Centre from where these returnees left to Garoua in search of employment.
In Mayo-Kani, the vast majority of identified households (102 households) live with a host
family. In addition, 5 households live in their original home and two live in a rented house.
MAYO-SAVA With 17,128 returnees, (25% of the regional total), Mayo-Sava hosts the third greatest portion of
returnees in the region and an increase of 27% compared to the last round of data collection. 3,446
additional returnees were registered in Kolofata Centre. The on-going kidnappings and Kamikaze
attacks push the populations out of villages such as Gouderi, Kordo, Gakara and towards Kolofata
Center. A part of the population still remains in these villages to cultivate the field crops. An increase
in returns to Kolofata center can be expected for the next assessment given that it is the most
secured/protected city of the district.
1,704 households in Mayo-Sava returned to the original housing and 895 live with host
families. A net increase of the number of individuals returning to their original dwelling
and living with host families is observed, compared to round 11.
MAYO-TSANAGA Mayo Tsanaga hosted 17,196 people, representing 26% of the regional total and an increase of 2.6% (or 451 additional people) since the last round of data collection. The majority of this population is located in the districts of Mokolo (6,268 people), Mozogo (5,726 people) and Koza (2,182 people). Zileng, in the Mokolo district, hosts the greatest concentration of returnees with 1,448 people. The village of Assighasia, which was evaluated for the first time during this round of data collection, hosted 580 people.
In Mayo-Tsanaga, 1,859 households returned to their original dwelling, 911 lived with
host families, and 259 in rented houses. This reflects an increase in the number of people
able to return to their home as well as an increase in the number of people living with
host families, compared to round 11.
Cameroon | Displacement Report, Far North Region, Round 12| 27 November – 08 December 2017
23 December 2017 32
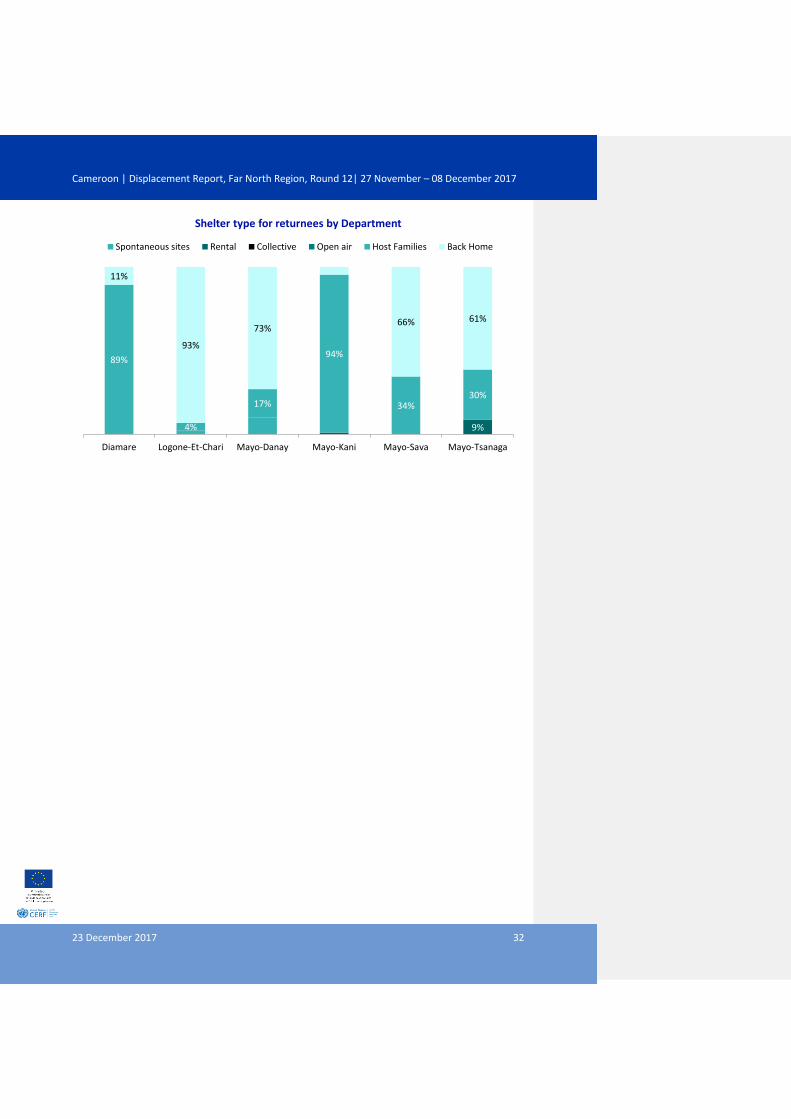
9%
89%
4%
17%
94%
34%30%
11%
93%
73%66% 61%
Diamare Logone-Et-Chari Mayo-Danay Mayo-Kani Mayo-Sava Mayo-Tsanaga
Shelter type for returnees by Department
Spontaneous sites Rental Collective Open air Host Families Back Home

Cameroon | Displacement Report, Far North Region, Round 12| 27 November – 08 December 2017
23 December 2017 33
TRENDS
This section is intended to highlight general trends since October 2017 in the administrative areas
covered by the DTM. A sample of 747 localities (including uninhabited ones) were included in this
assessment. The four newly identified villages have not been taken into consideration in this final
section in order to facilitate the comparison and to avoid attributing some trends to a simple increase
in the geographic coverage of the DTM.
This 12th round of data collection is marked by the closure of IDP camps in Logone-et-Chari and Mayo-
Sava, in addition to the large return movements of these displaced people to the own villages or pre-
displacement homes.
• The entire population living at Blamé camp resettled to Blamé village, due to more security
that is not provided in the area following the opening of a military camp in the town of Blamé.
• Doulo camp is uninhabited. Its population returned to Amchidé and the Masaré de Mora
neighbourhood. Securitzizaing measures have taken place as well as large awareness raising
campaign organized by the traditional and administrative authorities in Limani and Kerewa,
leading to a mass return movements tp those two towns. Some returns of IDPs have been
noted in Amticholé as military actor teach at the schools (27 households so far).
A crucial event during this round was the remote access to information on displaced people in
Asshigasia village in Mayo-Tsanaga obtained through telephone interviews with a key informant on
site (despite the restricted access to this area). This way, the DTM was able to identify 1,957 IDPs,
2,448 out of camp refugees and 580 returnees.
In terms of the evolution of movements of the internally displaced population, the DTM observes an
overall decrease of 1.5% in the number of IDPs in the Far North Region compared to round 11 (3,610
fewer people). The number of IDPs decreased in all departments with the exception of Mayo-Danay
where the variation is not significant compared to the previous round. This downward trend in IDP
numbers confirms the phenomenon of mass returns of IDPs following the closure of IDP camps
observed in the departments of Logone-et-Chari and Mayo-Sava. The districts of Fotokol and Makary
in the Mayo-Sava department registered departures of 1,490 and 969 IDPs respectively. In Mayo Sava,
the IDP population in the district of Mora in Mayo-Sava decreased by 440 people.
Department Round 12 Round 11 Change (%) Change (#)
Diamare 5 329 5 416 -2% -87
Logone-Et-Chari 125 015 127 264 -2% -2 249
Mayo-Danay 10 314 10 297 0% 17
Mayo-Kani 129 132 -2% -3
Mayo-Sava 59 506 59 967 -1% -461
Mayo-Tsanaga 38 084 38 911 -2% -827
Total 238 377 241 987 -1.5% -3 610 Table 2 – Comparative change in the number of IDPs, based on the same localities evaluated during round 11.

Cameroon | Displacement Report, Far North Region, Round 12| 27 November – 08 December 2017
23 December 2017 34
Overall, the out of camp refugee population in the region decreased by 2%. The only exception to this
is the department of Logone-et-Chari where an overall decrease of 566 individuals (93% of the total
decrease of the refugee population) was noted. The refugees left in particular the districts of Makary
(-219) and Darak (-201).
Department Round 12 Round 11 Change (%) Change (#)
Diamare 253 250 1% 3
Logone-Et-Chari 25 888 26 454 -2% -566
Mayo-Danay 119 125 -5% -6
Mayo-Kani 20 20 0% 0
Mayo-Sava 0 0 0
Mayo-Tsanaga 2 449 2 488 -2% -39
Total 28 729 29 337 -2% -608 Table 3- Comparative change in the number of out of camp refugees, based on the same localities evaluated during round 11.
The population who returned to the region increased by 9% compared to the last data collection, with
5,458 additional people. Mayo-Sava witnessed a particularly high increase with 3,661 additional
people, representing an increase of 27% in the number of returnees since round 11. The second most
important increase took place in the Logone-Et-Chari department with 2,484 returnees, representing
an increase of 10%.
Department Round 12 Round 11 Change (%) Change (#)
Diamare 330 415 -20% -85
Logone-Et-Chari 27 980 25 496 10% 2 484
Mayo-Danay 6 429 6 901 -7% -472
Mayo-Kani 667 668 0% -1
Mayo-Sava 17 128 13 467 27% 3 661
Mayo-Tsanaga 16 616 16 745 -1% -129
Total 69 150 63 692 9% 5 458 Table 4- Comparative change in the number of returnees, based on the same localities evaluated during round 11.
Commented [GL5]: This number to be checked ( based on the published number from Round 11 – 26,346 – the increase would be of 6.2% )
Commented [JRD6R5]: Checked, the number is correct. The mistakes were in the upper table giving the general number of Returnees in Logone-Et-Chari (First Table on Returnee section).

Cameroon | Displacement Report, Far North Region, Round 12| 27 November – 08 December 2017
23 December 2017 35
APPENDICES
Appendix I: Displaced Populations (table)
Appendix II: Reasons for Displacement (table)
Appendix III: New Villages Evaluated in Round 12 (table)
Appendix IV: Variation since Round 10 (table)
Cameroon | Displacement Report, Far North Region, Round 12| 27 November – 08 December 2017
23 December 2017 36
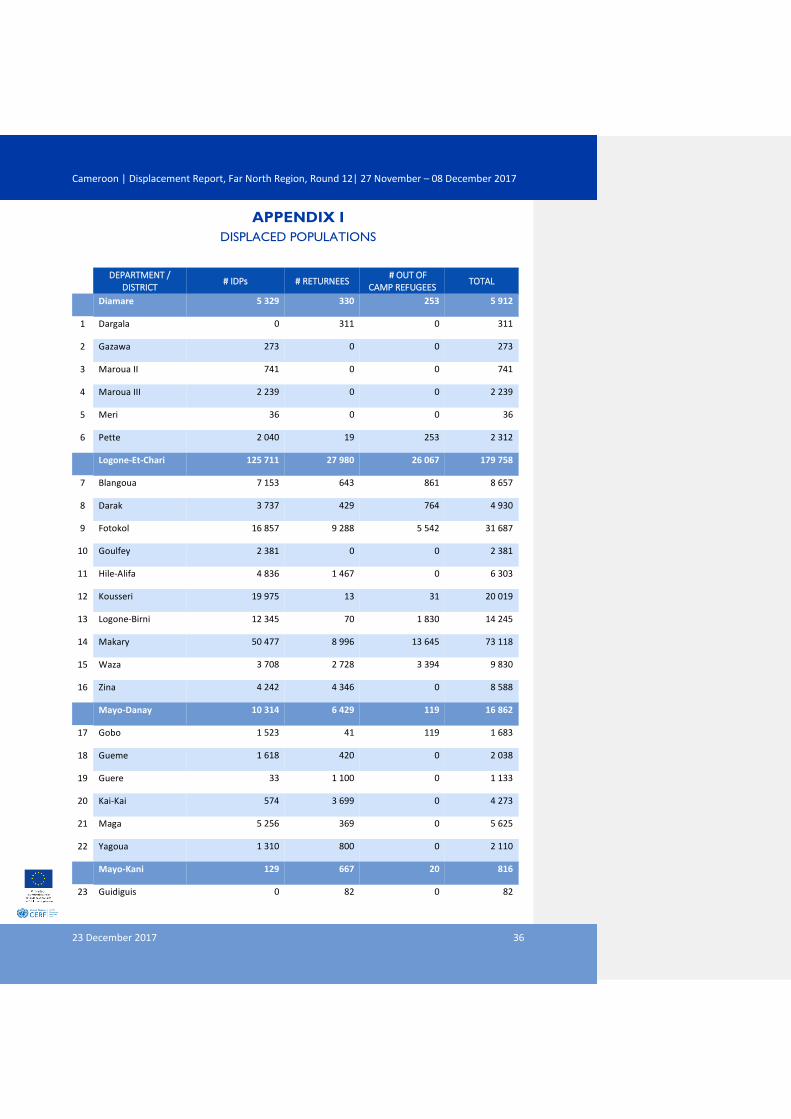
APPENDIX I
DISPLACED POPULATIONS
DEPARTMENT /
DISTRICT # IDPs # RETURNEES
# OUT OF CAMP REFUGEES
TOTAL
Diamare 5 329 330 253 5 912
1 Dargala 0 311 0 311
2 Gazawa 273 0 0 273
3 Maroua II 741 0 0 741
4 Maroua III 2 239 0 0 2 239
5 Meri 36 0 0 36
6 Pette 2 040 19 253 2 312
Logone-Et-Chari 125 711 27 980 26 067 179 758
7 Blangoua 7 153 643 861 8 657
8 Darak 3 737 429 764 4 930
9 Fotokol 16 857 9 288 5 542 31 687
10 Goulfey 2 381 0 0 2 381
11 Hile-Alifa 4 836 1 467 0 6 303
12 Kousseri 19 975 13 31 20 019
13 Logone-Birni 12 345 70 1 830 14 245
14 Makary 50 477 8 996 13 645 73 118
15 Waza 3 708 2 728 3 394 9 830
16 Zina 4 242 4 346 0 8 588
Mayo-Danay 10 314 6 429 119 16 862
17 Gobo 1 523 41 119 1 683
18 Gueme 1 618 420 0 2 038
19 Guere 33 1 100 0 1 133
20 Kai-Kai 574 3 699 0 4 273
21 Maga 5 256 369 0 5 625
22 Yagoua 1 310 800 0 2 110
Mayo-Kani 129 667 20 816
23 Guidiguis 0 82 0 82

Cameroon | Displacement Report, Far North Region, Round 12| 27 November – 08 December 2017
23 December 2017 37
24 Kaele 77 115 0 192
25 Mindif 0 37 9 46
26 Moulvoudaye 0 429 0 429
27 Moutourwa 52 4 11 67
Mayo-Sava 59 506 17 128 0 76 634
28 Kolofata 14 521 9 128 0 23 649
29 Mora 43 257 8 000 0 51 257
30 Tokombere 1 728 0 0 1 728
Mayo-Tsanaga 40 041 17 196 5 197 62 434
31 Bourha 201 1 566 90 1 857
32 Hina 404 253 0 657
33 Koza 16 314 2 182 30 18 526
34 Mogode 0 983 1 309 2 292
35 Mokolo 10 638 6 368 431 17 437
36 Mozogo 11 736 5 726 3 318 20 780
37 Soulede-Roua 748 118 19 885
Total 241 030 69 730 31 656 342 416

Cameroon | Displacement Report, Far North Region, Round 12| 27 November – 08 December 2017
23 December 2017 38
APPENDIX II
REASONS FOR DISPLACEMENT
DEPARTMENT
CONFLICT CLIMATIC EVENTS OTHER TOTAL
# % # % # % # %
Diamaré 5 601 1,64% 0 0,00% 311 0,09% 5 912 1,73%
1 Dargala 0 0,00% 0 0,00% 311 0,09% 311 0,09%
2 Gazawa 273 0,08% 0 0,00% 0 0,00% 273 0,08%
3 Maroua II 741 0,22% 0 0,00% 0 0,00% 741 0,22%
4 Maroua III 2 239 0,65% 0 0,00% 0 0,00% 2 239 0,65%
5 Meri 36 0,01% 0 0,00% 0 0,00% 36 0,01%
6 Pette 2 312 0,68% 0 0,00% 0 0,00% 2 312 0,68%
Logone-Et-Chari 167 825 49% 11 850 3,46% 83 0,02% 179 758 52,50%
7 Blangoua 6 531 1,91% 2 126 0,62% 0 0,00% 8 657 2,53%
8 Darak 4 423 1,29% 507 0,15% 0 0,00% 4 930 1,44%
9 Fotokol 31 687 9,25% 0 0,00% 0 0,00% 31 687 9,25%
10 Goulfey 2 381 0,70% 0 0,00% 0 0,00% 2 381 0,70%
11 Hile-Alifa 6 303 1,84% 0 0,00% 0 0,00% 6 303 1,84%
12 Kousseri 19 896 5,81% 40 0,01% 83 0,02% 20 019 5,85%
13 Logone-Birni 13 656 3,99% 589 0,17% 0 0,00% 14 245 4,16%
14 Makary 73 118 21,35% 0 0,00% 0 0,00% 73 118 21,35%
15 Waza 9 830 2,87% 0 0,00% 0 0,00% 9 830 2,87%
16 Zina 0 0,00% 8 588 2,51% 0 0,00% 8 588 2,51%
Mayo-Danay 707 0% 16 124 4,71% 31 0,01% 16 862 4,92%
17 Gobo 129 0,04% 1 523 0,44% 31 0,01% 1 683 0,49%
18 Gueme 0 0,00% 2 038 0,60% 0 0,00% 2 038 0,60%
19 Guere 0 0,00% 1 133 0,33% 0 0,00% 1 133 0,33%
20 Kai-Kai 0 0,00% 4 273 1,25% 0 0,00% 4 273 1,25%
21 Maga 578 0,17% 5 047 1,47% 0 0,00% 5 625 1,64%
22 Yagoua 0 0,00% 2 110 0,62% 0 0,00% 2 110 0,62%
Mayo-Kani 721 0% 0 0,00% 95 0,03% 816 0,24%

Cameroon | Displacement Report, Far North Region, Round 12| 27 November – 08 December 2017
23 December 2017 39
23 Guidiguis 0 0,00% 0 0,00% 82 0,02% 82 0,02%
24 Kaele 187 0,05% 0 0,00% 5 0,00% 192 0,06%
25 Mindif 38 0,01% 0 0,00% 8 0,00% 46 0,01%
26 Moulvoudaye 429 0,13% 0 0,00% 0 0,00% 429 0,13%
27 Moutourwa 67 0,02% 0 0,00% 0 0,00% 67 0,02%
Mayo-Sava 74 539 22% 2 095 0,61% 0 0,00% 76 634 22,38%
28 Kolofata 21 554 6,29% 2 095 0,61% 0 0,00% 23 649 6,91%
29 Mora 51 257 14,97% 0 0,00% 0 0,00% 51 257 14,97%
30 Tokombere 1 728 0,50% 0 0,00% 0 0,00% 1 728 0,50%
Mayo-Tsanaga 62 324 18% 75 0,02% 35 0,01% 62 434 18,23%
31 Bourha 1 857 0,54% 0 0,00% 0 0,00% 1 857 0,54%
32 Hina 657 0,19% 0 0,00% 0 0,00% 657 0,19%
33 Koza 18 526 5,41% 0 0,00% 0 0,00% 18 526 5,41%
34 Mogode 2 292 0,67% 0 0,00% 0 0,00% 2 292 0,67%
35 Mokolo 17 437 5,09% 0 0,00% 0 0,00% 17 437 5,09%
36 Mozogo 20 670 6,04% 75 0,02% 35 0,01% 20 780 6,07%
37 Soulede-Roua 885 0,26% 0 0,00% 0 0,00% 885 0,26%

Cameroon | Displacement Report, Far North Region, Round 12| 27 November – 08 December 2017
23 December 2017 40
APPENDIX III
NEWLY EVALUATED VILLAGES
Arrondissement
Village # IDPs # IDP
Households #
Refugees # Refugee
Households # Returnees
# Returnee Households
1 Makary
HEREDIBE
MOUSSA 43 5 94 11 0 0
2 Makary MOGNOKO 170 20 0 0 0 0
3 Waza WERA 483 58 85 17 0 0
4 Mozogo ASSIGHASSIA 1957 287 2748 476 580 90

Cameroon | Displacement Report, Far North Region, Round 12| 27 November – 08 December 2017
23 December 2017 41
APPENDIX IV
VARIATION SINCE ROUND 11
DEPARTMENT CHANGE IDPs (#) CHANGE OUT OF CAMP
REFUGEES CHANGE RETURNEES
Diamaré -87 3 -85
1 Dargala 0 0 -10
2 Gazawa -6 0 0
3 Maroua II 0 0 0
4 Maroua III -50 0 -79
5 Meri -46 0 0
6 Pette 15 3 4
Logone-Et-Chari -2 249 -566 2 484
7 Blangoua 148 0 0
8 Darak 163 -201 -64
9 Fotokol -1 490 0 1 325
10 Goulfey -4 0 0
11 Hile-Alifa -277 0 587
12 Kousseri -154 0 0
13 Logone-Birni 70 -70 0
14 Makary -969 -219 886
15 Waza 264 -76 -748
16 Zina 0 0 498
Mayo-Danay 17 -6 -472
17 Gobo 0 -6 -9
18 Gueme 0 0 0
19 Guere 0 0 31
20 Kai-Kai 0 0 0
21 Maga 17 0 -494
22 Yagoua 0 0 0
Mayo-Kani -3 0 -1
23 Guidiguis 0 0 5

Cameroon | Displacement Report, Far North Region, Round 12| 27 November – 08 December 2017
23 December 2017 42
24 Kaele -3 0 9
25 Mindif 0 0 0
26 Moulvoudaye 0 0 -15
27 Moutourwa 0 0 0
Mayo-Sava -461 0 3 661
28 Kolofata 73 0 3 446
29 Mora -440 0 215
30 Tokombere -94 0 0
Mayo-Tsanaga -827 -39 -129
31 Bourha -7 0 0
32 Hina 0 0 -5
33 Koza 70 0 0
34 Mogode 0 -26 3
35 Mokolo 341 -32 136
36 Mozogo 3 0 0
37 Soulede-Roua -1 234 19 -263
Total -3 610 -608 5 458