cambridge office/lab marketview -...
TRANSCRIPT
Q2 2014 Current Y-o-Y Q-o-Q
Office
Vacancy 6.8%
Lease Rate (Gross) $47.87
Net Absorption 139,211 sq. ft.
Hot Topics (Office)
• Blackstone Group has brought 125/150 Cambridgepark Drive to market as they look to further reduce their greater Boston portfolio
• Tech titans like Kayak (Priceline), Facebook and Apple all engaged the office market this quarter.
• Early-stage activity continued to flurry in the second quarter, with eight deals done in the 4,000-9,000 sq. ft. range.
Cambridge Office/Lab MarketView
CBRE Global Research and Consulting Q2 2014
Office Market
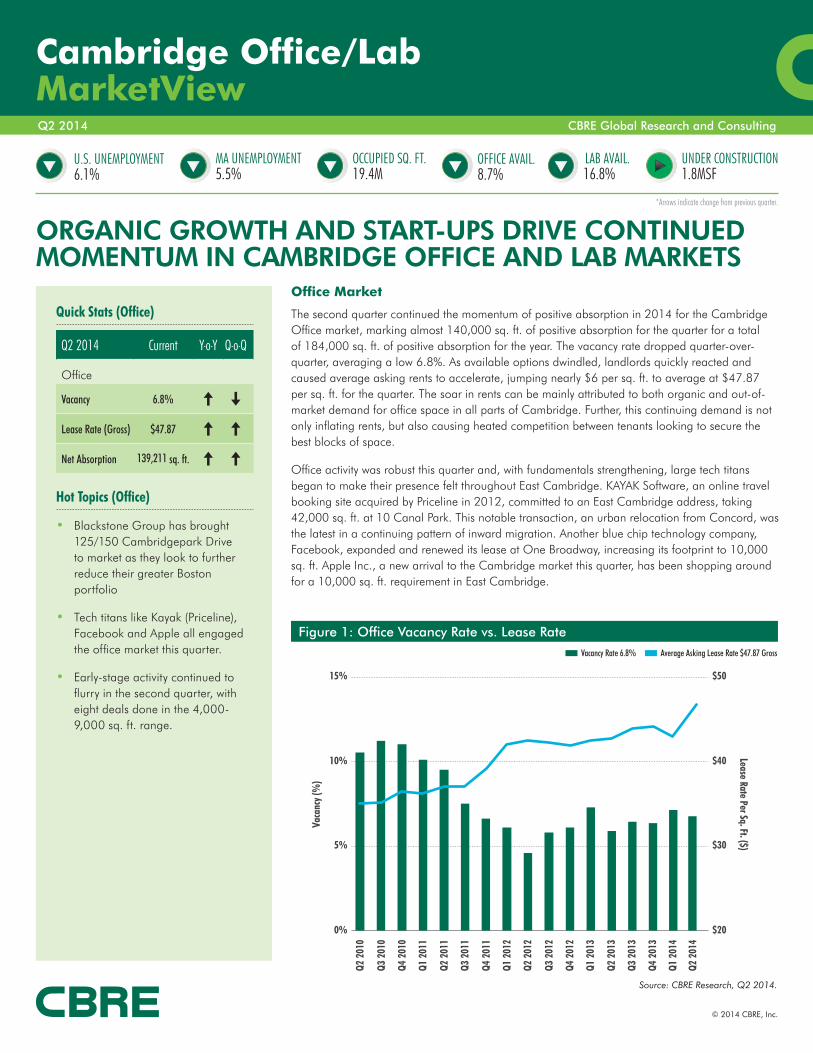
The second quarter continued the momentum of positive absorption in 2014 for the Cambridge Office market, marking almost 140,000 sq. ft. of positive absorption for the quarter for a total of 184,000 sq. ft. of positive absorption for the year. The vacancy rate dropped quarter-over-quarter, averaging a low 6.8%. As available options dwindled, landlords quickly reacted and caused average asking rents to accelerate, jumping nearly $6 per sq. ft. to average at $47.87 per sq. ft. for the quarter. The soar in rents can be mainly attributed to both organic and out-of-market demand for office space in all parts of Cambridge. Further, this continuing demand is not only inflating rents, but also causing heated competition between tenants looking to secure the best blocks of space.
Office activity was robust this quarter and, with fundamentals strengthening, large tech titans began to make their presence felt throughout East Cambridge. KAYAK Software, an online travel booking site acquired by Priceline in 2012, committed to an East Cambridge address, taking 42,000 sq. ft. at 10 Canal Park. This notable transaction, an urban relocation from Concord, was the latest in a continuing pattern of inward migration. Another blue chip technology company, Facebook, expanded and renewed its lease at One Broadway, increasing its footprint to 10,000 sq. ft. Apple Inc., a new arrival to the Cambridge market this quarter, has been shopping around for a 10,000 sq. ft. requirement in East Cambridge.
Figure 1: Office Vacancy Rate vs. Lease Rate
ORGANIC GROWTH AND START-UPS DRIVE CONTINUED MOMENTUM IN CAMBRIDGE OFFICE AND LAB MARKETS
Quick Stats (Office)
© 2014 CBRE, Inc.
0%
5%
10%
15%
Q2 2
010
Q3 2
010
Q4 2
010
Q1 2
011
Q2 2
011
Q3 2
011
Q4 2
011
Q1 2
012
Q2 2
012
Q3 2
012
Q4 2
012
Q1 2
013
Q2 2
013
Q3 2
013
Q4 2
013
Q1 2
014
Vaca
ncy (
%)
$20
$30
$40
$50
Lease Rate Per Sq. Ft. ($)
Q2 2
014
Vacancy Rate 6.8% Average Asking Lease Rate $47.87 Gross
*Arrows indicate change from previous quarter.
Source: CBRE Research, Q2 2014.
OCCUPIED SQ. FT.19.4M
LAB AVAIL.16.8%
UNDER CONSTRUCTION1.8MSF
U.S. UNEMPLOYMENT6.1%
MA UNEMPLOYMENT5.5%
OFFICE AVAIL.8.7%

Cam
brid
ge O
ffice/La
b | M
arketV
iewQ
2 2
014
2
© 2014 CBRE, Inc.
Start-up and new-economy tenant activity also flourished during 2Q14, with a number of early-stage companies planting a flag or expanding in the 4,000–9,000 sq. ft. range. Notable transactions include Luminoso’s 8,100 sq. ft. commitment at 675 Massachusetts Avenue; CarGurus expansion by 7,200 sq. ft. at 486 Green Street; and NuoDB expansion into 7,000 sq. ft at 215 First Street. On the whole, activity in the second quarter proved that the Cambridge market is highly valued by the tech community and companies will continue to invest capital and recruit in the area.
Lab Market
The Cambridge Lab market continued its positive momentum in 2Q14. Overall, the lab market experienced 160,000 sq. ft. of positive absorption for the quarter, which brings the year-to-date total to approximately 275,000 sq. ft. The vacancy rate grew to 13.8% for the quarter as a result of the available Vertex and Pfizer space finally registering as vacant. Lab rents remained flat, averaging $48.77 per sq. ft. NNN, down slightly year-over-year and quarter-over-quarter.
The second quarter saw existing Cambridge lab tenants expand their current footprint in the market. Pfizer, one of the largest users in Cambridge, expanded by 140,000 sq. ft. into 610 Main Street (North). This expansion follows the recent completion of 610 Main Street (South) in which Pfizer will occupy the entire 230,000 sq. ft. lab building, bringing their total occupancy to nearly one million sq. ft. in the Cambridge market alone. Alnylam Pharmaceuticals renewed its lease at 300 Third Street for 129,000 sq. ft. BIND Biosciences continues to expand financially and physically, taking on an additional 18,000 sq. ft. of lab space at 325 Vassar Street. ModeRNA also has expanded by 17,000 sq. ft. at 200 Technology Square. The continued expansion and organic growth of life science companies continues to positively impact lab market fundamentals; these fundamentals are poised to remain strong into 2015.
Figure 2: Market Statistics
MarketRentable Area
(Sq. Ft.)Availability
Rate %Vacancy
Rate %Sublease
Rate %Quarterly Net
Absorption (Sq. Ft.)Avg. Asking Rent
($/Sq. Ft./YR)
Cambridge – East 7,204,204 8.1% 6.0% 1.0% 61,941 $56.11
Cambridge – Mid 1,870,936 6.1% 4.9% 3.0% 10,031 $47.49
Cambridge – West 1,927,834 13.9% 11.7% 7.2% 67,239 $30.22
Cambridge Office 11,002,974 8.7% 6.8% 2.5% 139,211 $47.87
Cambridge – East 8,633,061 14.1% 10.7% 9.5% 90,946 $51.06
Cambridge – Mid 593,817 16.4% 15.8% 0.0% 68,803 $47.02
Cambridge – West 812,480 46.3% 44.7% 0.4% 0 $41.60
Cambridge Lab 10,039,358 16.8% 13.8% 8.2% 159,749 $48.77
Q2 2014 Current Y-o-Y Q-o-Q
Lab
Vacancy 13.8%
Lease Rate (NNN) $48.77
Net Absorption 159,749 sq. ft.
Hot Topics (Lab)
• Following another expansion, Pfizer will now occupy more than one million sq. ft. in Cambridge
• The Broad Institute opened a newly constructed 375,000 sq. ft. research facility at 75 Ames Street in the heart of Kendall Square
Quick Stats (Lab)
Source: CBRE Research, Q2 2014.

Cam
brid
ge O
ffice/La
b | M
arketV
iewQ
2 2
014
3
© 2014 CBRE, Inc.
Figure 5: Transactions of Note
Tenant Address Sq. Ft. Submarket Type
Office
KAYAK Software 10 Canal Park 41,739 East Cambridge New
Kleinfelder/SEA 215 First Street 29,532 East Cambridge Renewal
Thinking Phone Networks 10 Wilson Road 25,500 West Cambridge Sublease
Vecna 35 CambridgePark Drive 20,500 West Cambridge Expansion
Lab
Pfizer 610 Main Street (North) 140,000 East Cambridge Expansion
Alnylam 300 Third Street 129,000 East Cambridge Renewal
BIND Biosciences 325 Vassar Street 18,396 East Cambridge Extension
ModeRNA 200 Tech Square 17,357 East Cambridge Expansion
Office Vacancy/Availability & Rent
The Cambridge Office market still remains one of the tightest markets nationally as vacancy decreased by 30 basis points quarter-over-quarter to 6.8%. Availability decreased by 130 basis points to 8.7% as a lack of viable options for large office tenants continuing to be a trend. As available options dwindled, landlords quickly reacted and caused average asking rents to accelerate, jumping nearly $6 per sq. ft. to average at $47.87 per sq. ft. for the quarter. The most notable increase was in East Cambridge where asking rents soared nearly $7.50 per sq. ft. to average at $56.11 per sq. ft.
Lab Vacancy/Availability & Rent
Cambridge lab availability decreased to 16.8% for the quarter, down 160 basis points from last quarter, but still up marginally year-over-year. Vacancy is up significantly quarter-over-quarter, from 8.0% to 13.8% as several large availabilities have gone dark specifically in West Cambridge. Average asking rents for the quarter were down slightly quarter-over-quarter to $48.77 per sq. ft.
Figure 3: Lab Vacancy/Availability & Rent
Q2 2
012
Q3 2
012
Q4 2
012
Q1 2
013
Q2 2
013
Q3 2
013
Q4 2
013
Q1 2
014
$40
$42
$44
$46
$48
$50
$52
$54
$56
$58
Leas
e Ra
te P
er S
q. F
t. ($
)
5%
7%
9%
11%
13%
15%
17%
19%
21%
23%
Vacancy/Availability (%)
Q2 2
014
Vacancy 13.8% Availability 16.8% Lease Rate $48.77 NNN
Source: CBRE Research, Q2 2014.
Figure 4: Office Vacancy/Availability & Rent
$0
$10
$20
$30
$40
$50
Q2 20
12
Q3 20
12
Q4 20
12
Q1 20
13
Leas
e Ra
te P
er S
q. F
t. ($
)
0%
4%
8%
12%
16%
20%
Vacancy/Availability (%)
Q2 20
13
Q3 20
13
Q4 20
13
Q1 2
014
Q2 2
014
$60 20%
Vacancy 6.8% Availability 8.7% Lease Rate $47.87 Gross
Source: CBRE Research, Q2 2014.
Source: CBRE Research, Q2 2014.

Cam
brid
ge O
ffice/La
b | M
arketV
iewQ
2 2
014
4
© 2014 CBRE, Inc.
DEFINITIONS
Average Asking Lease RateRate determined by multiplying the asking gross lease rate for each building by its available space, summing the products, then dividing by the sum of the available space with net leases for all buildings in the summary.
Net LeasesIncludes all lease types whereby the tenant pays an agreed rent plus estimated average monthly costs of the operating expenses and taxes for the property, including utilities, insurance and/or maintenance expenses.
Market CoverageIncludes all competitive buildings in CBRE’s survey set.
Net AbsorptionThe change in occupied sq. ft. from one period to the next, as measured by available sq. ft..
Net Rentable AreaThe gross building square footage minus the elevator core, flues, pipe shafts, vertical ducts, balconies and stairwell areas.
Occupied Area (Sq. Ft.)Building area not considered vacant.
Under ConstructionBuildings that have begun construction as evidenced by site excavation or foundation work.
Available Area (Sq. Ft.)Available building area that is either physically vacant or occupied.
Availability RateAvailable sq. ft. divided by the net rentable area.
Vacant Area (Sq. Ft.)Existing building area that is physically vacant or immediately available.
Vacancy RateVacant building feet divided by the net rentable area.
NormalizationDue to a reclassification of the market, the base, number and square footage of buildings of previous quarters have been adjusted to match the current base. Availability and vacancy figures for those buildings have been adjusted in previous quarters.
Cambridge, MassachusettsPhoto by iStockphoto, www.istockphoto.com
Cam
brid
ge O
ffice/La
b | M
arketV
iewQ
2 2
014
5
© 2014 CBRE, Inc.
CONTACT
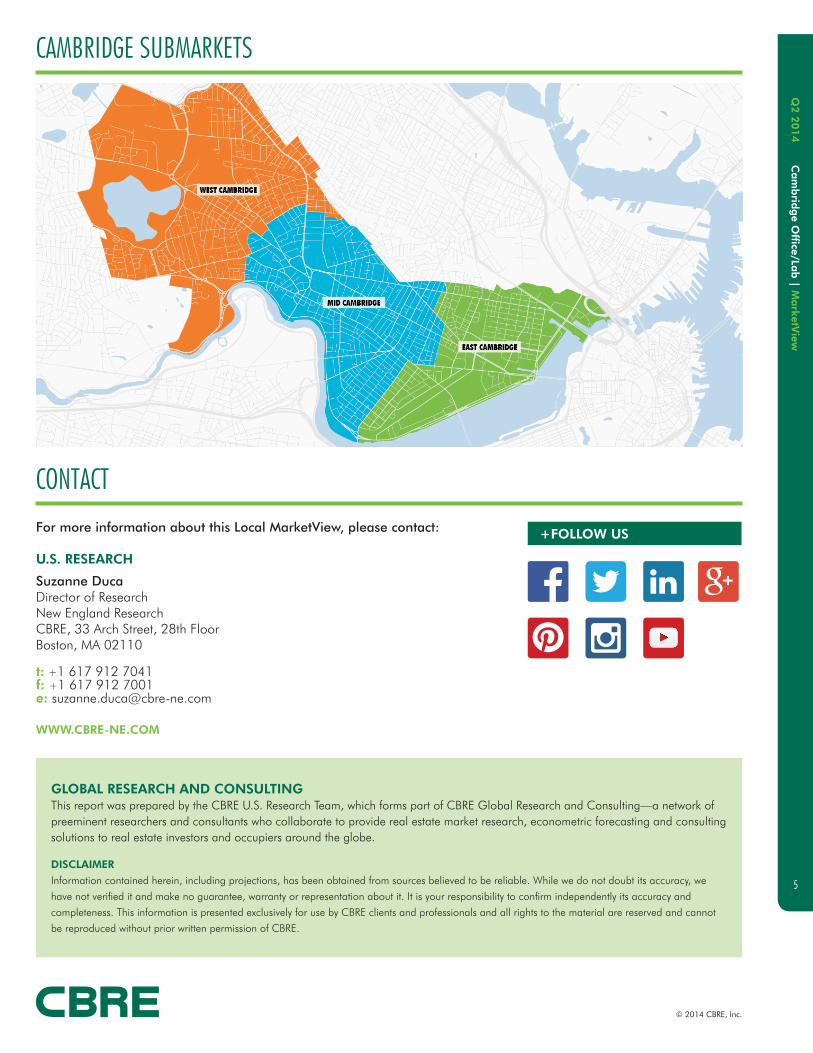
CAMBRIDGE SUBMARKETS
For more information about this Local MarketView, please contact:
WWW.CBRE-NE.COM
+FOLLOW US
U.S. RESEARCH
Suzanne Duca Director of Research New England Research CBRE, 33 Arch Street, 28th Floor Boston, MA 02110 t: +1 617 912 7041 f: +1 617 912 7001 e: [email protected]
GLOBAL RESEARCH AND CONSULTING This report was prepared by the CBRE U.S. Research Team, which forms part of CBRE Global Research and Consulting—a network of preeminent researchers and consultants who collaborate to provide real estate market research, econometric forecasting and consulting solutions to real estate investors and occupiers around the globe.
DISCLAIMER
Information contained herein, including projections, has been obtained from sources believed to be reliable. While we do not doubt its accuracy, we
have not verified it and make no guarantee, warranty or representation about it. It is your responsibility to confirm independently its accuracy and
completeness. This information is presented exclusively for use by CBRE clients and professionals and all rights to the material are reserved and cannot
be reproduced without prior written permission of CBRE.