caltrain business planmodernization+program/...2019/03/28 · technical team contracting board...
TRANSCRIPT

Caltrain BusinessPlan
MARCH 2019
Local Policy Maker Group
March 2019

Starting to Build a Business Case

What
Why
What isthe Caltrain Business Plan?
Addresses the future potential of
the railroad over the next 20-30
years. It will assess the benefits,
impacts, and costs of different
service visions, building the case
for investment and a plan for
implementation.
Allows the community and
stakeholders to engage in
developing a more certain,
achievable, financially feasible
future for the railroad based on
local, regional, and statewide
needs.

Service• Number of trains
• Frequency of service
• Number of people
riding the trains
• Infrastructure needs
to support different
service levels
Business Case• Value from
investments (past,
present, and future)
• Infrastructure and
operating costs
• Potential sources of
revenue
What Will the Business Plan Cover?
Organization• Organizational structure
of Caltrain including
governance and delivery
approaches
• Funding mechanisms to
support future service
Community Interface• Benefits and impacts to
surrounding communities
• Corridor management
strategies and
consensus building
• Equity considerations
Technical Tracks

Where Are We in the Process?
We Are Here
Board Adoption of Scope
Stanford Partnership andTechnical Team Contracting
Board Adoption of 2040 Service Vision
Board Adoption of Final Business Plan
Initial Scoping and Stakeholder Outreach
Technical Approach Refinement, Partnering, and Contracting
Part 1: Service Vision Development Part 2: Business Plan Completion
Implementation

2040 Service Scenarios: Different Ways to Grow
Am
ou
nt
of
Inve
stm
en
t /N
um
be
r o
f T
rain
s
Design Year
2033High Speed
Rail Phase 12022Start of Electrified
Operations2018Current
Operations
Baseline Growth
2040
Service
Vision
Moderate Growth
High Growth
2029HSR Valley
to Valley &
Downtown
Extension

2040 Baseline Growth Scenario (6 Caltrain + 4 HSR)
Features
• Blended service with up to 10 TPH north of Tamien
(6 Caltrain + 4 HSR) and up to 10 TPH south of
Tamien (2 Caltrain + 8 HSR)
• Three skip stop patterns with 2 TPH – most stations
are served by 2 or 4 TPH, with a few receiving 6 TPH
• Some origin-destination pairs are not served at all
Passing Track Needs
• Less than 1 mile of new passing tracks at Millbrae
associated with HSR station plus use of existing
passing tracks at Bayshore and Lawrence
Options & Considerations
• Service approach is consistent with PCEP and HSR EIRs
• Opportunity to consider alternative service approaches
later in Business Plan process
Skip Stop
High Speed Rail
Service Type
Conceptual 4 Track
Segment or Station
Infrastructure
4 3 2 1 <1
Service Level
(Trains per Hour)
2 Trains / Hour
4 Trains / Hour
2 Trains / Hour
2 Trains / Hour
22n
d S
t
Baysh
ore
So
uth
San
Fra
nc
isco
San
Bru
no
Mil
lbra
e
Bro
ad
way
Bu
rlin
ga
me
San
Mate
o
Hayw
ard
Park
Hil
lsd
ale
Belm
on
t
San
Carl
os
Red
wo
od
Cit
y
Palo
Alt
o
Cali
forn
ia A
ve
San
An
ton
io
Mo
un
tain
Vie
w
Su
nn
yvale
La
wre
nc
e
San
ta C
lara
San
Jo
se D
irid
on
Ath
ert
on
Men
lo P
ark
Co
lleg
e P
ark
Tam
ien
Cap
ito
l
Blo
sso
m H
ill
Mo
rga
n H
ill
San
Mart
in
Gil
roy
4 Trains / Hour
PEAK PERIOD ,
EACH DIRECTION Sale
sfo
rce T
ran
sit
Cen
ter
4th
& K
ing
/ 4
th&
To
wn
sen
d

Moderate Growth Scenario (8 Caltrain + 4 HSR)
Features
• A majority of stations served by 4 TPH local stop line, but Mid-
Peninsula stations are serviced with 2 TPH skip stop pattern
• Express line serving major markets – some stations receive 8 TPH
• Timed local/express transfer at Redwood City
Passing Track Needs
• Up to 4 miles of new 4-track segments and stations: Hayward Park
to Hillsdale, at Redwood City, and a 4-track station in northern
Santa Clara county (Palo Alto, California Ave, San Antonio or
Mountain View. California Ave Shown)
Options & Considerations
• To minimize passing track requirements, each
local pattern can only stop twice between San
Bruno and Hillsdale - in particular, San Mateo is
underserved and lacks direct connection to
Millbrae
• Each local pattern can only stop once between
Hillsdale and Redwood City
• Atherton, College Park, and San Martin served
on an hourly or exception basis
Local
Express
High Speed Rail
Service Type
Conceptual 4 Track
Segment or Station
Infrastructure
4 3 2 1 <1
Service Level
(Trains per Hour)4 Trains / Hour
4 Trains / Hour
4 Trains / Hour
22n
d S
t
Baysh
ore
So
uth
San
Fra
nc
isco
San
Bru
no
Mil
lbra
e
Bro
ad
way
Bu
rlin
ga
me
San
Mate
o
Hayw
ard
Park
Hil
lsd
ale
Belm
on
t
San
Carl
os
Red
wo
od
Cit
y
Palo
Alt
o
Cali
forn
ia A
ve
San
An
ton
io
Mo
un
tain
Vie
w
Su
nn
yvale
La
wre
nc
e
San
ta C
lara
San
Jo
se D
irid
on
Ath
ert
on
Men
lo P
ark
Co
lleg
e P
ark
Tam
ien
Cap
ito
l
Blo
sso
m H
ill
Mo
rga
n H
ill
San
Mart
in
Gil
roy
PEAK PERIOD ,
EACH DIRECTION
4 Trains / Hour
Sale
sfo
rce T
ran
sit
Cen
ter
4th
& K
ing
/ 4
th&
To
wn
sen
d

High Growth Scenarios (12 Caltrain + 4 HSR)
Features
• Nearly complete local stop service – almost all
stations receiving at least 4 TPH
• Two express lines serving major markets – many
stations receive 8 or 12 TPH
Passing Track Needs
• Requires up to 15 miles of new 4 track segments:
South San Francisco to Millbrae, Hayward Park to
Redwood City, and northern Santa Clara County
between Palo Alto and Mountain View stations
(shown: California Avenue to north of Mountain View)
Options & Considerations
• SSF-Millbrae passing track enables second express line;
this line cannot stop north of Burlingame
• Tradeoff between infrastructure and service along Mid-
Peninsula - some flexibility in length of passing tracks
versus number and location of stops
• Flexible 5 mile passing track segment somewhere
between Palo Alto and Mountain View
• Atherton, College Park, and San Martin served on an
hourly or exception basis
Local
Express
High Speed Rail
Service Type
Conceptual 4 Track
Segment or Station
Infrastructure
4 3 2 1 <1
Service Level
(Trains per Hour)
22n
d S
t
Baysh
ore
So
uth
San
Fra
nc
isco
San
Bru
no
Mil
lbra
e
Bro
ad
way
Bu
rlin
ga
me
San
Mate
o
Hayw
ard
Park
Hil
lsd
ale
Belm
on
t
San
Carl
os
Red
wo
od
Cit
y
Palo
Alt
o
Cali
forn
ia A
ve
San
An
ton
io
Mo
un
tain
Vie
w
Su
nn
yvale
La
wre
nc
e
San
ta C
lara
San
Jo
se D
irid
on
Ath
ert
on
Men
lo P
ark
Co
lleg
e P
ark
Tam
ien
Cap
ito
l
Blo
sso
m H
ill
Mo
rga
n H
ill
San
Mart
in
Gil
roy
4 Trains / Hour
4 Trains / Hour
4 Trains / Hour
4 Trains / Hour
4 Trains / Hour
PEAK PERIOD ,
EACH DIRECTION Sale
sfo
rce T
ran
sit
Cen
ter
4th
& K
ing
/ 4
th&
To
wn
sen
d

Terminal Analysis

Terminal Planning Context
Terminal Planning Context
San Jose Terminal
San Francisco Terminal
Next Steps

Purpose and Process
Purpose • Extend initial service planning analysis to identify how each growth 2040 growth scenario will function at and around terminals
• Establish initial service plans as a basis for estimating ridership, identifying areas of operational risk and clarifying needed investments
• Initial staff discussions with partner agencies at each terminal regarding goals and planning parameters
• Initial planning analysis
• Follow up discussion and review with partner agencies at each terminal
• Move to detailed simulation analysis and continued coordination
Process

Service Planning Parameters
Parameter HSR Caltrain
Minimum headway
between trains*
2 minutes 2 minutes
Turnaround time
at terminal
20 minutes 20 minutes
Minimum station
dwell time**
2 minutes 1.0 (high-ridership stations)
0.7 (low-ridership stations)
Train equipment High speed trainset 8-car electric multiple unit trainset
Speed limit 110 MPH 110 MPH
Recovery time 10% distributed 10% distributed
The following rail operating parameters are used as the starting point for 2040 service planning.
Some variation to these parameters may be explored as service planning progresses
**Assumes investment to achieve level-boarding
*Assumes investment in new signal system
San Francisco Terminal
Terminal Planning Context
San Jose Terminal
San Francisco Terminal
Next Steps

San Francisco TerminalKey Points and Findings
• In the Baseline and Moderate Scenarios preliminary
analysis suggests that all train service can utilize Sales
Force Transit Center. In the High Growth Scenario the
additional 4 trains would terminate at 4th & King.
• Some platform availability preserved at 4th & King in all
scenarios to account for event, disruption, and/or regular
revenue service
• Direct sharing of platforms between Caltrain and HSR as
part of scheduled revenue service provides no direct
capacity benefits in any of the scenarios studied at either
terminal. The importance of platform interoperability to
system reliability is under study through ongoing analysis
• All findings will be further tested and evaluated trhough
simulation analysis
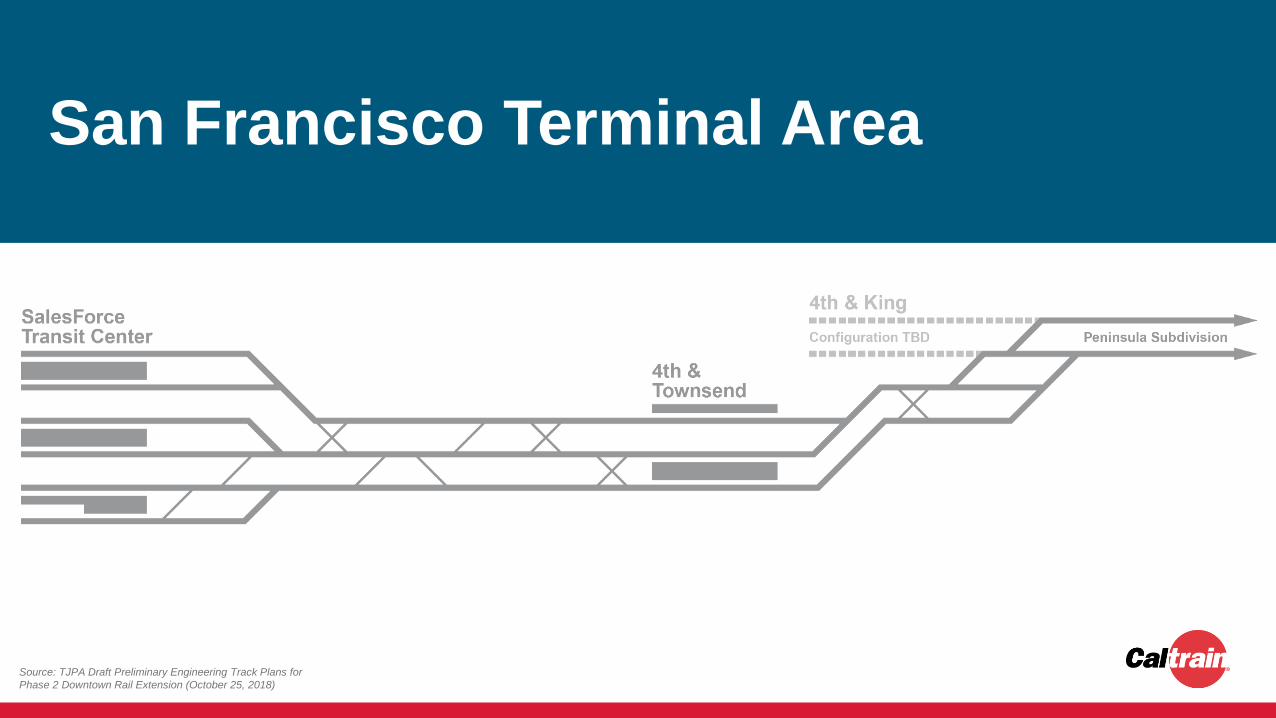
Source: TJPA Draft Preliminary Engineering Track Plans for
Phase 2 Downtown Rail Extension (October 25, 2018)
San Francisco Terminal Area

SF Terminal: Baseline Growth
Skip Stop
HSR
Some conflict potential into/out of
STC, but plan works within the
planning parameters and will be
subject of more detailed analysis
with dynamic simulation
Turn times at STC above minimum
requirements are achievable with HSR
assigned to two tracks and Caltrain assigned
to four tracks. Three and three is also
achievable with tighter turns for Caltrain

SF Terminal: Moderate Growth
15-minute repeating pattern
allows two additional trains
to STC without creating
additional conflicts
Turns at STC are tighter for both HSR and Caltrain compared to
the Baseline, but are still within minimum parameters w/ two
HSR and four Caltrain platforms faces for normal operations.
Three and three in normal operation would result in unacceptably
short turns for Caltrain
Local
Express
HSR
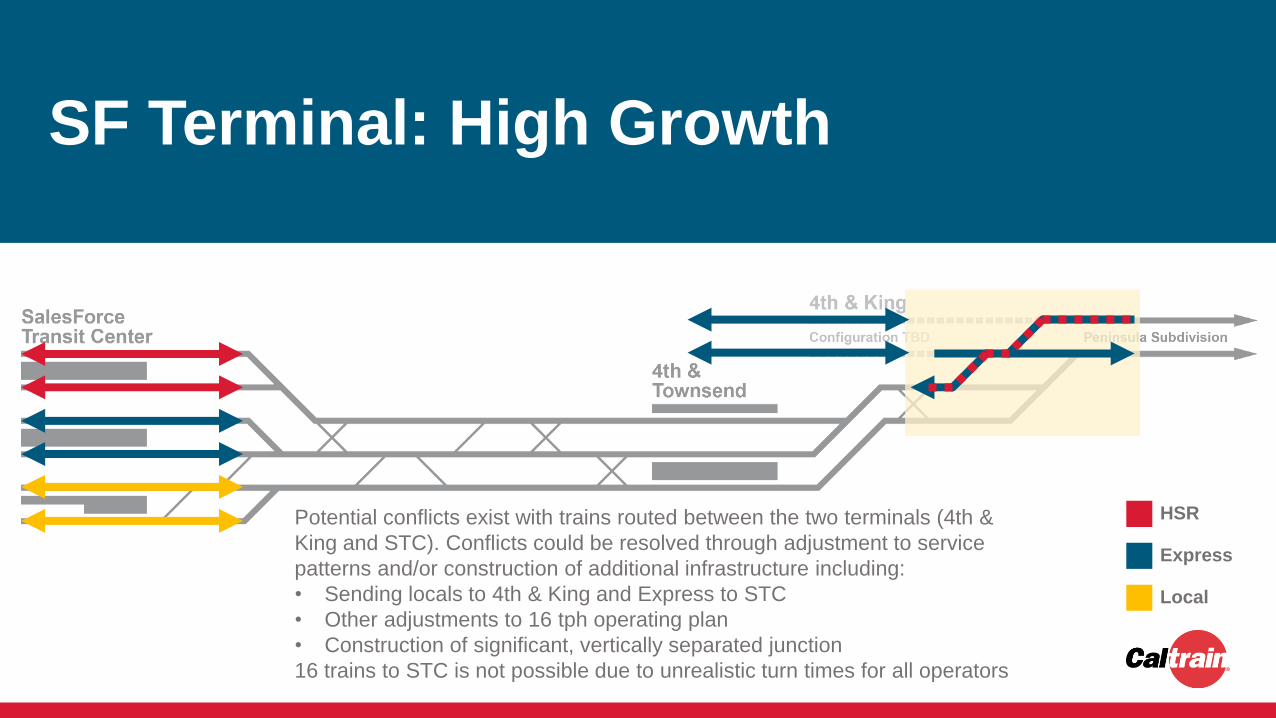
Potential conflicts exist with trains routed between the two terminals (4th &
King and STC). Conflicts could be resolved through adjustment to service
patterns and/or construction of additional infrastructure including:
• Sending locals to 4th & King and Express to STC
• Other adjustments to 16 tph operating plan
• Construction of significant, vertically separated junction
16 trains to STC is not possible due to unrealistic turn times for all operators
SF Terminal: High Growth
Local
Express
HSR

San Jose Terminal
Terminal Planning Context
San Jose Terminal
San Francisco Terminal
Next Steps

San Jose TerminalKey Points and Findings
• Work developed in conjunction with Diridon
Integrated Station Concept Plan and some
analysis is ongoing
• Solutions were found for all three Growth
Scenarios that are consistent with ongoing
Diridon planning efforts
• For Caltrain, the ability to “turn” trains south of
Diridon is important and will require investments
• Analysis of “diesel” system including freight and
intercity operators (Amtrak, ACE, and CCJPA) IS
ongoing
• All findings will be further tested and evaluated
trhough simulation analysis

1. Existing
San Jose Terminal Area

San Jose Terminal Area2. HSR-PEPD

UPRR and Diesel Passenger Service Tracks (Analysis Ongoing through DISC Process)
San Jose Terminal Area3. HSR-PEPD + Generalized Initial Diridon Integrated Station Concept Plan (DISC) Concepts

UPRR and Diesel Passenger Service Tracks (Analysis Ongoing through DISC Process)
San Jose Terminal Area4. HSR-PEPD + DISC Concepts + Potential Additional Infrastructure

SJ Terminal: Baseline Growth
UPRR and Diesel Passenger Service TracksHSR
Caltrain
Scenario generally works within infrastructure
currently contemplated with some level of
operational risk that will be tested with simulation
in next round of Business Plan
Operational challenges result from turning six
Caltrain and three HSR trains in the
Diridon/Tamien area. Possible mitigations for
operational risk in the Baseline include additional
interlocking infrastructure and/or adjustment to
turn locations for HSR in San Jose.Caltrain Turns
Caltrain Turns

SJ Terminal: Moderate Growth
UPRR and Diesel Passenger Service TracksHSR
Caltrain
Caltrain Turns Caltrain Turns
Operating all Caltrain
through Diridon and
turning a maximum of
four trains at Tamien
broadly works in
currently contemplated
infrastructure in PEPD
and assumed changes
at Diridon contemplated
in DISC analysis

SJ Terminal: High Growth
UPRR and Diesel Passenger Service TracksHSR
Caltrain
Caltrain Turns Caltrain Turns
Scenario works with
San Jose terminal
planning assumptions,
but requires some
trains to turn at new
maintenance facility
Caltrain Turns

DRAFT
Next Steps
Terminal Planning Context
San Jose Terminal
San Francisco Terminal
Next Steps

Next Steps: SimulationProcess
• The primary objective for the simulation analysis
is to determine whether the simulation model
indicates a stable rush-hour operation absent
any major disruptions (e.g. track outages or
disabled trains) for the three growth scenarios
subject to analysis
• Of particular concern is the extent to which the
variability of dwells at intermediate stations will
affect the ability to deliver the proposed
timetables within reasonable on-time
performance parameters

Next Steps: Storage & Maintenance AnalysisProcess
• Analyze fleet, storage and maintenance needs
associated with the fleet requirements for each
of the growth scenarios considered
• Understand when and where new investments in
storage and maintenance facilities may be
required and analyze how these may impact or
benefit overall system operations
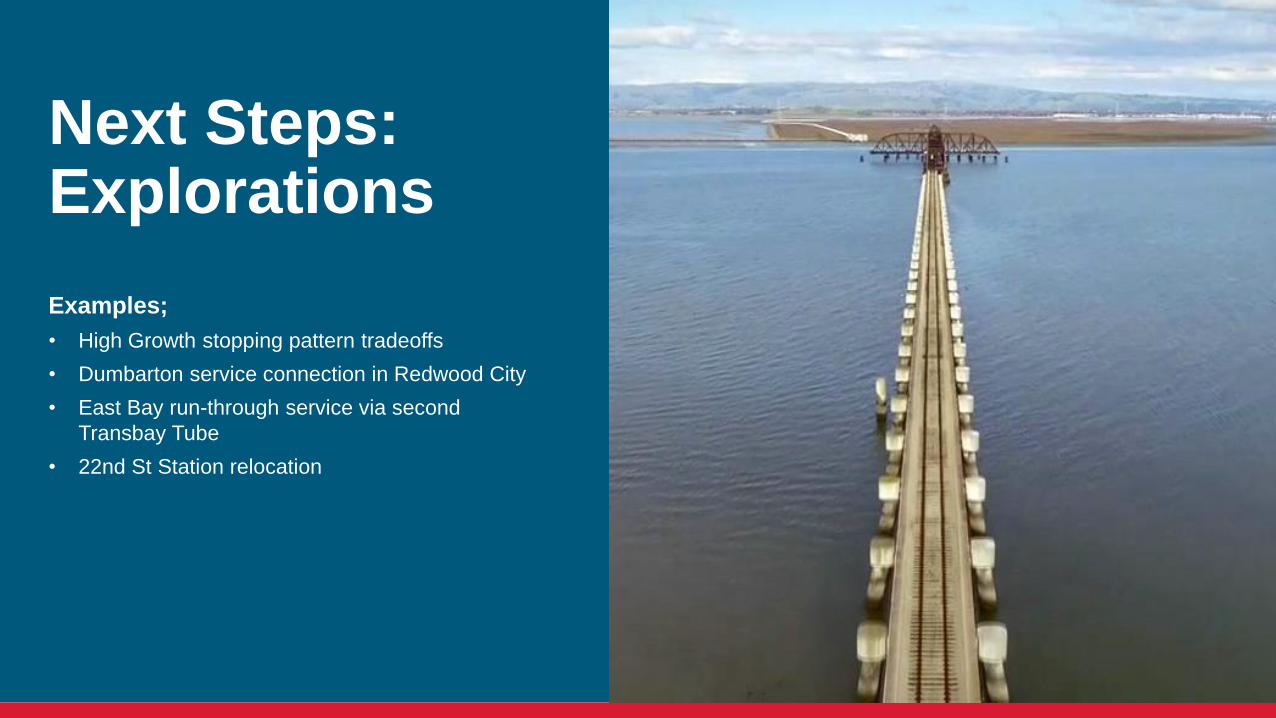
Next Steps: Explorations
Examples;
• High Growth stopping pattern tradeoffs
• Dumbarton service connection in Redwood City
• East Bay run-through service via second
Transbay Tube
• 22nd St Station relocation

Ridership Forecasts

Ridership Context
Ridership Context
Ridership Forecasts
Capacity & Crowding

Existing Ridership
Ave
rag
e W
ee
kd
ay B
oa
rdin
gs
Today, Caltrain serves bidirectional and
polycentric ridership demand• 62,000 daily boardings1
• 64%-36% NB-SB split during AM peak period
• Half of trips occur outside of San Francisco
Ridership is highly concentrated around
stations with fastest & most frequent Service• 73% of ridership at 8 Baby Bullet stations served by 4
or more trains per hour, per direction
• There is substantial latent demand, particularly at
stations with low service
Train occupancy varies by service type• Many Baby Bullet trains carry 100%-140% of their
seated capacity during peak periods, while limited
trains vary from about 50% to 120% of seated
capacity
1Based on 2017 ridership data

Ridership Growth Over Time
+30,000 Riders
+5,000 Riders
-400 Riders
-500 Riders
Source: 1998-2017 Passenger Counts

DRAFT
Ridership Forecasts
Ridership Context
Ridership Forecasts
Capacity & Crowding

2040 Service Scenarios
Am
ou
nt
of
Inve
stm
en
t /N
um
be
r o
f T
rain
s
Design Year
2033High Speed
Rail Phase 12022Start of Electrified
Operations2018Current
Operations
Baseline Growth
2040
Service
Vision
Moderate Growth
High Growth
2029HSR Valley
to Valley &
Downtown
Extension

ObjectivesUpdate the Caltrain Ridership Model to forecast
changes associated with Growth Scenarios• System, station, and origin-destination forecasts
• Weekday and weekend forecasts
• Breakdown by time period for weekdays (AM peak,
midday, PM peak, and evening)
Incorporate sensitivity to regional and local
factors influencing ridership• Regional transportation changes
• Station area land use
• Differentiated service patterns
• Socioeconomic characteristics
Understand implications of train crowding• Align ridership against capacity provided
• Consider extent to which service will be able to fully
“capture” market given potential train crowding

4. Crowding
Constrained
Forecasts
Crowding-Constrained
Forecasts
Demand
Forecasts
3. HSR
Ridership
Adjustment
2. Caltrain
Ridership
Model
Ridership Model Structure
1. VTA-
C/CAG
Travel Model
Station Area
Context- Train
Crowiding
Constraints
Modeling
Process
1. Forecast for
changes in regional
travel behavior over
time
Modeling
Objectives
Regional
Context
Caltrain Service Plans
+ HSR Access
Trips
- HSR Overlap
Trips
Caltrain
Ridership
Forecasts
2. Refine Caltrain regional
distribution & account for
micro travel behavior
related to Caltrain
- Net Effect: adjusts
ridership by station and
reduces overall ridership
forecast
3. Account for HSR
influence on Caltrain
ridership
+ Net Effect: Subtracts
riders on HSR ODs; adds
riders as HSR access mode
4. Constrain capacity to a
comfortable crowding load
of 1.35 at each segment
- Net Effect: Decrease overall
Caltrain ridership for baseline
and moderate growth
scenarios
Exis
tin
g
Ele
ctr
ific
ati
on
Do
wn
tow
n E
xte
nsio
n
Bu
sin
ess P
lan
Gro
wth
Scen
ari
os
-
50,000
100,000
150,000
200,000
2005 2010 2015 2020 2025 2030 2035 2040
Baseline Growth
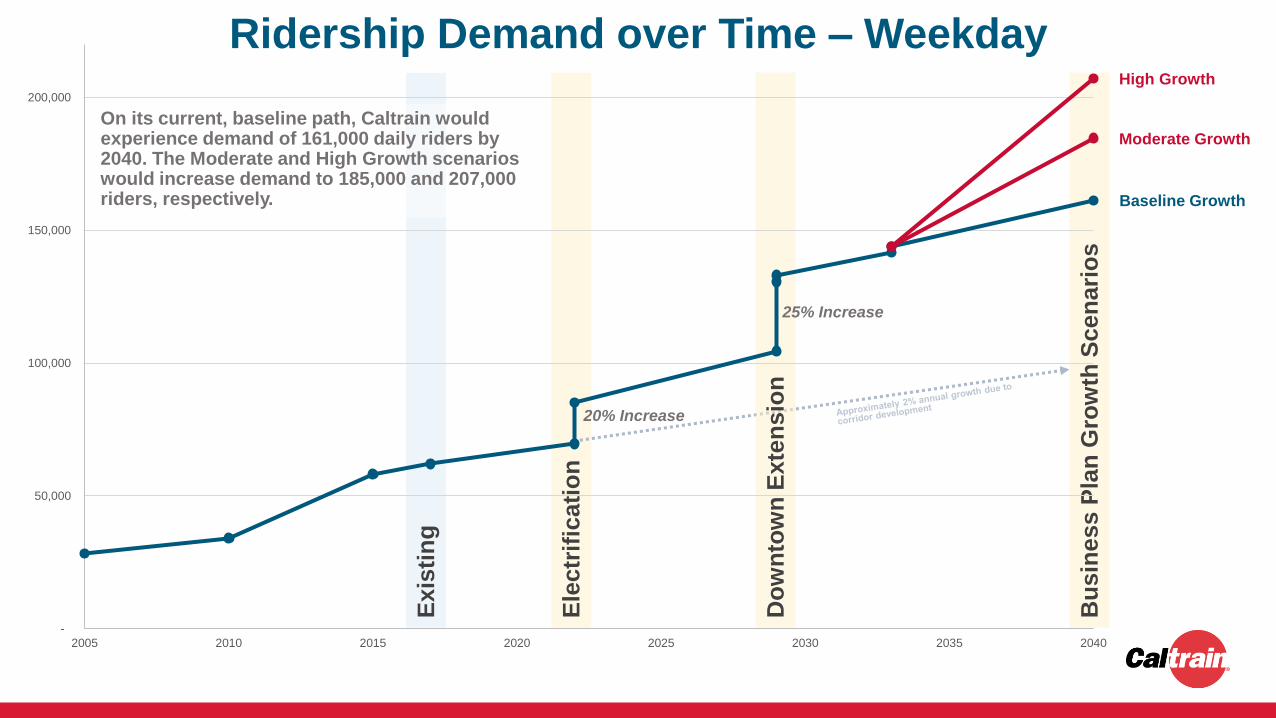
Ridership Demand over Time – Weekday
20% Increase
Moderate Growth
High Growth
25% Increase
On its current, baseline path, Caltrain would experience demand of 161,000 daily riders by 2040. The Moderate and High Growth scenarios would increase demand to 185,000 and 207,000 riders, respectively.

Exis
tin
g
Ele
ctr
ific
ati
on
Do
wn
tow
n E
xte
nsio
n
Bu
sin
ess P
lan
Gro
wth
Scen
ari
os
-
50,000
100,000
150,000
200,000
2005 2010 2015 2020 2025 2030 2035 2040
Baseline Growth
Baseline Change over Time – Weekday
20% Increase
25% Increase
Early 2020s:
Demand increases 20%
with electrification, though
some trips shift to express
buses and managed lanes
Late 2020s:
Demand increases 25%
with DTX while HSR,
Dumbarton, and BART to
SJ enable improved
connections
2030s:
Land use growth fuels
continued ridership gains
over time
However, ridership
demand exceeds a
comfortable crowding
level shortly after the
completion of DTX
Nearby development
activity increases Caltrain
ridership demand by about
2% per year – or 40% of
growth by 2040

Peer Comparison: Ridership DemandCaltrain’s 2040 ridership demand is more balanced
(directionally and geographically) than peer corridors
Pe
ak
Ho
ur
Rid
ers
hip
at
Ma
x L
oad
Po
int
-
5,000
10,000
15,000
20,000
25,000
30,000
35,000
Existing BaselineGrowth
ModerateGrowth
High Growth BART Metro North Long IslandRailroad
Peak Hour, Peak Direction Ridership Peak Hour, Reverse Peak Direction
System Daily
Peak
Hour,
Max Load
Point
Peak % -
Reverse
Peak %
Peak Hour,
Peak
Direction
Max Load
Point
Caltrain
Existing 62,000 6,500 60% - 40% 3,900
2040 Baseline 161,000* 15,300* 57% - 43%* 8,700
2040 Moderate 185,000* 17,700* 56% - 44%* 9,900
2040 High 207,000 20,600 56% - 44% 11,500
BART (All Lines) 414,000 28,400 88% - 12% 24,900
Metro North
(Harlem & New Haven
Lines)176,000 27,900 94% - 6% 26,200
Long Island Railroad
(All Lines)350,000 35,900 94% - 6% 33,700
*Excludes capacity constraining for Baseline and Moderate
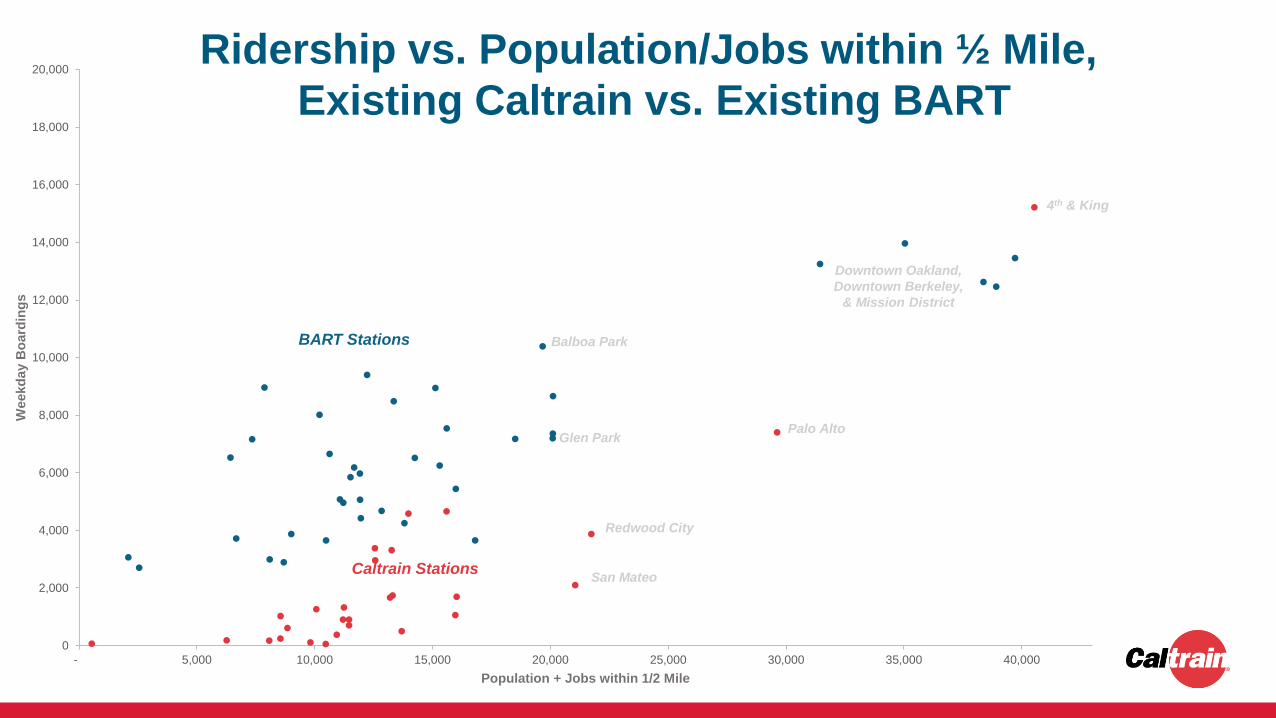
Ridership vs. Population/Jobs within ½ Mile,
Existing Caltrain vs. Existing BART
BART Stations
Caltrain Stations
4th & King
Palo Alto
Downtown Oakland,
Downtown Berkeley,
& Mission District
Redwood City
San Mateo
Glen Park
Balboa Park
0
2,000
4,000
6,000
8,000
10,000
12,000
14,000
16,000
18,000
20,000
- 5,000 10,000 15,000 20,000 25,000 30,000 35,000 40,000
Weekd
ay B
oard
ing
s
Population + Jobs within 1/2 Mile

0
2,000
4,000
6,000
8,000
10,000
12,000
14,000
16,000
18,000
20,000
- 5,000 10,000 15,000 20,000 25,000 30,000 35,000 40,000
Weekd
ay B
oard
ing
s
Population + Jobs within 1/2 Mile
Ridership vs. Population/Jobs within ½ Mile,
2040 Caltrain High Growth Ridership vs. Existing BART
BART Stations
Caltrain Stations
Palo Alto
Salesforce Transit Center
4th & King
San Mateo
Mountain View
Lawrence
Redwood City
San Jose
Sunnyvale
South San Francisco
Millbrae
Hillsdale
22nd Street

Key Findings
1. Ridership demand could exceed 200,000 riders by 2040i. Under the Baseline Growth condition, Caltrain would attract 161,000 riders by 2040
ii. Increasing to 8 TPH would increase ridership to 185,000 for the Moderate Growth scenario
iii. Increasing to 12 TPH would increase ridership to 207,000 for the High Growth scenario
2. PCEP will provide near-term crowding relief, but growing demand will lead to
overcrowded conditions during peak hours upon completion of DTX around 2029i. Caltrain could reach 100,000 riders over the next decade with electrification and land use growth
alone
ii. The Completion of DTX increases Caltrain ridership demand by about 25 percent (27,000 riders)
iii. While new trains will enable better standing conditions for passengers, the level of crowding
expected will be uncomfortable and may not be a competitive option for choice riders
3. By 2040 the Baseline and Moderate Growth scenarios face crowding challenges,
while the High Growth does not.i. By 2040 the Baseline and Moderate Growth scenarios exceed a comfortable crowding condition
by about 30 to 40 percent for peak hour, peak direction travel.

DTX & Intra-San Francisco Ridership1. STC Surcharge
i. Assumed average surcharge of $2.50 (or $3 in 2029 dollars) per trip, roughly equivalent to a
separate fare zone
ii. STC would serve about 25,000 daily boardings, but some potential riders may shift to other modes
iii. Ultimate surcharge amount and mechanism will influence ridership outcomes at STC
2. Location of 22nd Street Station i. Ridership forecasts suggest 6,000-10,000 daily station boardings by 2040, but may be higher or
lower depending on potential station relocation
3. Intra-SF Ridershipi. With opening of DTX Caltrain could offer substantial time savings for intra-SF trips and as
connection to BART, Transbay buses, and ferries
ii. Ridership forecasts suggest 4,000-7,000 trips, but could be 20,000-30,000 if similar to BART
Origin-Destination Pair Estimated Travel Time (& Frequency by Growth Scenario)
Muni Caltrain
4th & King – STC/Montgomery Station 15 minutes (6 trains per hour) 4 minutes (6-8 trains per hour)
22nd Street – STC/Montgomery Station 25 minutes (6 trains per hour) 8 minutes (4-8 trains per hour)
Bayshore – STC/Montgomery Station 37 minutes (8 buses per hour) 13 minutes (2-4 trains per hour)

South of Tamien Ridership
*Excludes capacity constraining for Baseline and Moderate
Findings
• There is reasonably strong demand for service in southern San Jose, where Capitol and Blossom Hill
would serve 3,000-4,000 new boardings per day with service every 15 minutes
• There is lower demand in Morgan Hill and Gilroy with half-hourly peak period service and hourly off-peak
service
• Smaller markets with less housing growth
• HSR is attractive option at Gilroy due to higher frequency service to San Jose and faster travel times
to San Francisco and Millbrae
Daily Boardings
Topic Existing 2040 Baseline 2040 Moderate 2040 High
Capitol & Blossom Hill 300 700 3,500 4,300
Morgan Hill & Gilroy 400 600 1,300 1,600

Off-Peak & Weekend Ridership
Daily Boardings
Topic Existing 2040 Baseline 2040 Moderate 2040 High
Off-Peak Boardings (Early AM, Midday, and Evening) 7,300 23,000 34,700 35,900
Weekend Boardings 12,400 43,300 58,800 61,200
Findings
• There is strong potential for growth during off-peak and weekend periods, although there is particularly
high uncertainty given data and model limitations
• However, station demand is highly sensitive to service frequency. Demand is highest at stations
receiving service every 15 minutes or greater, and lower at stations receiving service every 30 or 60
minutes
2040 Capacity & Crowding
Ridership Context
Ridership Forecasts
Capacity & Crowding

CrowdingHow crowded will trains be? Will they still be a
competitive choice? Will they be able to serve
their full potential market demand?
• The underlying ridership model projects demand
based on land use and service levels- it does not take
comfort and crowding into account
• If Caltrain is highly crowded and uncomfortable will it
still be a competitive mode? Is there a portion of
future demand that we may not capture if the trains
are uncomfortably full?
For the purposes of Business Planning,
Caltrain is assuming that it can competitively
serve passenger loads of up to 135% of seated
capacity during regular service. At higher
levels of crowding the service may not be
competitive for choice riders and Caltrain may
not be able to fully capture potential demand
DRAFT

Exceeds
Seated
Capacity
0%
20%
40%
60%
80%
100%
120%
140%
6:04 6:23 6:49 6:54 6:59 7:04 7:23 7:49 7:54 7:59 8:04 8:23 8:36 15:34 16:12 16:23 16:32 16:38 16:58 17:16 17:27 17:32 17:38 17:58 18:16 18:23
PA
SS
EN
GE
R L
OA
DS
Baby Bullet
Limited
Context - CrowdingToday, 15 of 28 peak commute direction trains exceed seated capacity during peak periods. Baby
Bullet trains are usually beyond their seated capacities (averaging 115%), while Limited trains are
typically near capacity (averaging 92%). Max train loads vary from 40% to 140%.
PM PEAK PERIOD TRAINSAM PEAK PERIOD TRAINS
Source: 1998-2017 Passenger Counts
At 100% seated
capacity, everyone
gets a seat

Train Capacity and Crowding
50% Occupancy – Many seats available

100% Occupancy – Everyone gets a seat
Train Capacity and Crowding
This level of occupancy is the planning standard used for commuter rail by FTA

Train Capacity and Crowding
135% Occupancy – Most are seated and everyone else can stand comfortably
This level of occupancy roughly equates to the planning standard used for commuter rail lines into
London and on S-Bahn (commuter) trains in Germany. Depending on the specific train design this
level of occupancy generally equates to less than two standees per square meter of space

More than 135% Occupancy – Many are standing and may be uncomfortable
While occupancy loads well over 150% can be safely accommodated, passengers will
feel crowded and uncomfortable and the service may not be attractive to choice riders
Train Capacity and Crowding

Baseline & Moderate scenarios exceed
comfortable crowding level during peak hours
AM (Reverse Peak Direction)
Assumes 8 car trains
in Baseline and 10 car
trains in Moderate
and High scenarios
135% - Comfortable
crowding level
Oc
cu
pan
cy L
oad
Baseline Moderate High
0%
25%
50%
75%
100%
125%
150%
175%
200%
ST
C
4th
and
Kin
g
22n
d S
t
Ba
ysho
re
So
uth
San
Fra
ncis
co
Sa
n B
run
o
Millb
rae
Bro
ad
wa
y
Bu
rlin
ga
me
Sa
n M
ate
o
Ha
yw
ard
Park
Hill
sda
le
Be
lmo
nt
Sa
n C
arl
os
Re
dw
oo
d C
ity
Ath
ert
on
Me
nlo
Pa
rk
Pa
lo A
lto
Ca
lifo
rnia
Ave
Sa
n A
nto
nio
Mo
un
tain
Vie
w
Su
nn
yva
le
Law
ren
ce
Sa
nta
Cla
ra
Sa
n J
ose
Dirid
on
Ta
mie
n
Ca
pito
l
Blo
sso
m H
ill
Mo
rga
n H
ill
Sa
n M
art
in
Gilro
y
Baseline AM Moderate AM High AM Baseline PM Moderate PM High PM
22nd S
t
ST
C
Bays
hore
SS
F
San B
runo
Mill
bra
e
Bro
adw
ay
Burlin
gam
e
San M
ate
o
Hayw
ard
Park
Hill
sdale
Belm
ont
San C
arlos
Redw
ood C
ity
Palo
Alto
Calif
orn
ia A
ve
San A
nto
nio
Mounta
in V
iew
Sunnyv
ale
Law
rence
Santa
Cla
ra
San J
ose D
irid
on
Ath
ert
on
Menlo
Park
Tam
ien
Capitol
Blo
ssom
Hill
Morg
an H
ill
San M
art
in
Gilr
oy
4th
& K
ing
2040 Crowding by Scenario
PM (Peak Direction)
Baseline Moderate (Average) HighModerate (Express)

Exis
tin
g
Ele
ctr
ific
ati
on
Do
wn
tow
n E
xte
nsio
n
Bu
sin
ess P
lan
Gro
wth
Scen
ari
os
Baseline Growth
Baseline Demand over Time – Weekday
-
50,000
100,000
150,000
200,000
2005 2010 2015 2020 2025 2030 2035 2040
Crowding-
Constrained
Growth
(94% of potential
demand)
Under the Baseline Scenario, demand
exceeds crowding capacity by 10,000 riders
during peak hours by 2040.

Exis
tin
g
Ele
ctr
ific
ati
on
Do
wn
tow
n E
xte
nsio
n
Bu
sin
ess P
lan
Gro
wth
Scen
ari
os
Moderate Demand over Time – Weekday
-
50,000
100,000
150,000
200,000
2005 2010 2015 2020 2025 2030 2035 2040
Moderate Growth
Crowding-
Constrained
Growth
(96% of potential
demand)
Under the Moderate Scenario, demand
exceeds crowding capacity by 7,500 riders
during peak hours by 2040.

Exis
tin
g
Ele
ctr
ific
ati
on
Do
wn
tow
n E
xte
nsio
n
Bu
sin
ess P
lan
Gro
wth
Scen
ari
os
High Growth Demand over Time – WeekdayHigh Growth
Crowding challenges
in 2030s until service
expansion complete
-
50,000
100,000
150,000
200,000
2005 2010 2015 2020 2025 2030 2035 2040
Caltrain is able to fully
accommodate 2040 demand

System Forecasts- Constrained for Crowding
Systemwide Boardings: Weekday Ridership
Model Year Service Plan DemandCapacity
ConstrainedNotes
2017 5 TPH 62,100 62,100
Electrification increases service and capacity.
Combined with the Central Subway, significant
latent demand is unlocked within the system. After
the completion of DTX, peak Caltrain ridership
demand would exceed capacity. Ridership
continues to grow during shoulder peak and off-
peak periods.
20225 TPH 69,700 69,700
6 TPH 85,000 85,000
2029
6 TPH 103,100 103,100
6 TPH (+ DTX) 130,600 124,900
6 TPH (+ DTX and 2 HSR) 132,900 128,900
20336 TPH (+ 2 HSR) 141,700 135,700
6 TPH (+ 4 HSR) 143,800 137,600
2040 Baseline 6 TPH (+ 4 HSR) 161,200 151,700
2040 Moderate 8 TPH (+ 4 HSR) 184,800 177,200
Demand for express trains would exceed a
comfortable crowding level. While local trains could
serve some excess capacity, some riders would
choose other modes in lieu of a longer local travel
time.
2040 High 12 TPH (+ 4 HSR) 207,300 207,300 Sufficient peak capacity and more connected local
service serving off-peak and weekend demand.
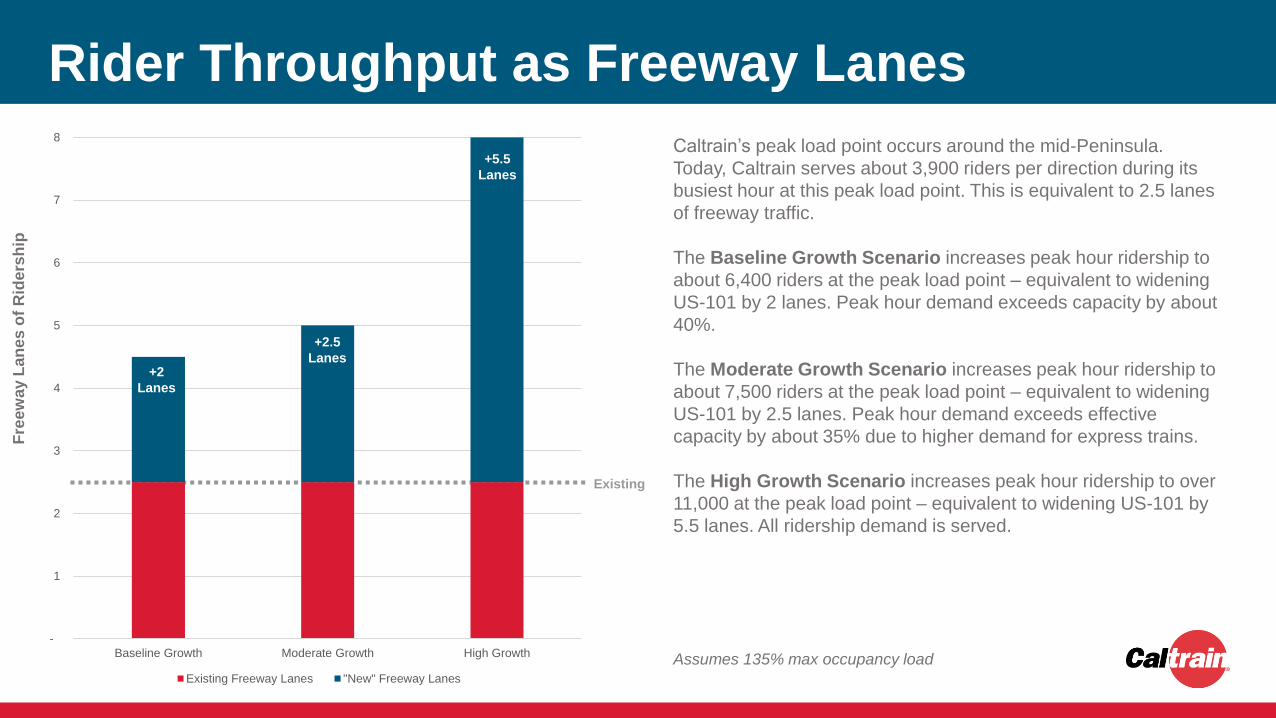
Rider Throughput as Freeway Lanes
Caltrain’s peak load point occurs around the mid-Peninsula.
Today, Caltrain serves about 3,900 riders per direction during its
busiest hour at this peak load point. This is equivalent to 2.5 lanes
of freeway traffic.
The Baseline Growth Scenario increases peak hour ridership to
about 6,400 riders at the peak load point – equivalent to widening
US-101 by 2 lanes. Peak hour demand exceeds capacity by about
40%.
The Moderate Growth Scenario increases peak hour ridership to
about 7,500 riders at the peak load point – equivalent to widening
US-101 by 2.5 lanes. Peak hour demand exceeds effective
capacity by about 35% due to higher demand for express trains.
The High Growth Scenario increases peak hour ridership to over
11,000 at the peak load point – equivalent to widening US-101 by
5.5 lanes. All ridership demand is served.
Fre
ew
ay L
an
es
of
Rid
ers
hip
Assumes 135% max occupancy load
-
1
2
3
4
5
6
7
8
Baseline Growth Moderate Growth High Growth
Existing Freeway Lanes "New" Freeway Lanes
Existing
+2
Lanes
+2.5
Lanes
+5.5
Lanes

Next Steps

Next StepsUpcoming Work & Updates
• Service Planning
• Explorations and Variations
• Simulation analysis
• Business Case Development
• Corridor Investments and Capital Costs
• Operating Costs and Revenues
• Mobility and Environmental Benefits
• Community Interface Assessment
• Grade Separation Update
F O R M O R E I N F O R M AT I O N
W W W . C A LT R A I N . C O M

2040 Station Demand: Top 12
Notes:
Excludes capacity constraining.
San Francisco ridership may vary depending on location of 22nd Street station and Salesforce Transit Center surcharge.
Future SFCHAMP modeling may better inform intra-SF ridership demand.
Weekday BoardingsStation Existing Baseline Growth Moderate Growth High Growth
4th & King 15,200 20,600 23,800 27,300
Salesforce Transit Center 0 21,600 26,800 25,000
Palo Alto 7,400 14,900 15,700 18,000
Mountain View 4,500 11,700 12,700 14,100
San Jose 4,700 11,100 12,000 13,400
Sunnyvale 3,300 7,700 10,000 11,700
Redwood City 3,900 8,300 9,400 11,500
Hillsdale 3,000 8,400 9,000 10,400
22nd Street 1,700 5,800 7,100 9,500
Millbrae 3,400 8,900 7,900 8,100
Lawrence 900 5,400 4,700 6,100
South San Francisco 500 2,100 5,500 5,600

2040 Station Demand: Largest Gains
Weekday Boardings – 2040 High Growth vs. ExistingStation Existing 2040 High Growth Change % Change
Capitol 55 1,700 1,600 2,909%
Blossom Hill 107 2,600 2,500 2,336%
Bayshore 240 3,200 3,000 1,250%
South San Francisco 496 5,600 5,100 1,028%
Hayward Park 376 2,900 2,500 665%
Lawrence 907 6,100 5,200 573%
22nd St 1,687 9,500 7,800 462%
Morgan Hill 181 900 700 387%
Gilroy 173 700 600 347%
Tamien 1,264 5,100 3,900 309%
Hillsdale 2,963 10,400 7,500 253%
San Antonio 904 3,000 2,100 232%
Notes:
Excludes Salesforce Transit Center.
22nd Street Station ridership may vary depending on station location and Salesforce Transit Center surcharge.

2040 County to County Demand
Notes:
Excludes capacity constraining.
Future SFCHAMP modeling may better inform intra-SF ridership demand and implications of STC fare surcharge.
Southern Santa Clara County stations account for 1,300 riders in Baseline Scenario, 4,800 in Moderate Scenario, and 5,900 in High Scenario
HSR, Dumbarton Rail, and BART to San Jose each account for an increase of about 1,000-2,000 daily trips over existing.
Daily County to County Ridership DemandCounty OD Pair Existing Baseline Growth Moderate Growth High Growth
San Francisco-San Mateo 11,500 36,500 37,200 37,700
San Francisco-Santa Clara 22,600 57,400 71,200 74,800
San Mateo-Santa Clara 15,800 29,700 35,500 46,400
Within San Francisco 100 4,400 7,000 7,100
Within San Mateo 4,900 13,300 11,900 16,000
Within Santa Clara 7,200 19,900 21,900 24,500

2040 Station OD Demand
Excludes capacity constraining
Top 5 Station OD Pairs, Including Downtown San FranciscoStation-Station OD Pair Existing Baseline Growth Moderate High Growth
STC/4th & King-Palo Alto 4,300 9,100 12,300 12,300
STC/4th & King-Mountain
View4,100 8,100 9,300 9,200
STC/4th & King-Sunnyvale 3,700 6,900 8,400 8,600
STC/4th & King-San Jose 3,700 5,000 5,900 6,500
STC/4th & King-Lawrence 500 4,600 4,700 5,200
Top 5 Station OD Pairs, Excluding Downtown San FranciscoStation-Station OD Pair Existing Baseline Growth Moderate High Growth
San Jose-Palo Alto 1,500 4,200 3,600 3,500
San Jose-Mountain View 400 2,900 3,600 3,300
Redwood City-Palo Alto 600 2,200 2,000 3,100
22nd Street-Palo Alto 1,400 1,700 2,000 2,600
Redwood City-Hillsdale 300 1,500 2,100 2,400

Land Use/Transportation Context: ½-Mile Area#
of
Pe
op
le +
Jo
bs
# o
f P
eo
ple
+ J
ob
s
600,000 people and jobs within
1/2 mile of Caltrain stations
1 million people and jobs within
1/2 mile of Caltrain stations
Indicates a station where substantial growth beyond Plan Bay Area forecasts is anticipated, but not yet approved
2040Existing

4.2 million people and jobs within
2 miles of Caltrain stations
Land Use/Transportation Context: 2-Mile Area#
of
Pe
op
le +
Jo
bs
2040
3 million people and jobs within
2 miles of Caltrain stations
Indicates a station where substantial growth beyond Plan Bay Area forecasts is anticipated, but not yet approved
# o
f P
eo
ple
+ J
ob
s
Existing