calpers investment office environmental initiatives annual ... · 1 calpers | 2008 environmental...
TRANSCRIPT

CalPERS Investment Office Environmental InitiativesAnnual Update
November 17, 2008
CalPERS | 2008 Environmental Update

1
CalPERS | 2008 Environmental Update
• First annual cross-asset class update
• This presentation summarizes the work being done in programs and activities throughout the Investment Office.
• Leadership participation in numerous investor coalitions• Ceres
• Investor Network on Climate Risk (INCR)
• United Nations Principles for Responsible Investment (UN PRI)
• United Nations Environmental Programme Financial Initiative (UNEPFI)
• Global Warming Shareholder Campaign
• P8 Group

2
CalPERS | 2008 Environmental Update
• Activities in the following areas will be covered:
• Real Estate• Energy Efficiency
• Green Fund
• Global Equity• External Environmental Equity Managers
• Corporate Governance• Environmental Strategies
• Alternative Investment Management• Clean Energy and Technology Program Update
• Inflation Linked Asset Class• Infrastructure Investment Policy
• Cross-Asset Class Initiative• Manager Survey
3
Real EstateEnvironmental Update
CalPERS | 2008 Environmental Update

4
Real Estate | Environmental Update

5
Buildings | Environmental Impact
“Buildings are the largest source of both energy consumption and greenhouse gas emissions in America as well as around the world.”
- The American Institute of Architects
Source: USGBC

6
Why Do We Care? | Real Estate Sector’s Environmental Impact
Source : USGBC

7
Real Estate | Energy Efficiency Goal
• CalPERS Investment Committee adopted the current Real Estate Environmental Initiative in December 2004
• CalPERS Real Estate Environmental Initiative
• The Energy Efficiency Goal
• 20% energy reduction over a five year period
• Focus on Core portfolio
• Voluntary program
• Cost benefit analysis
Tribeca GreenNew York City, NY
LEED-NC Gold

8
Energy Efficiency Goal | JDM Associates
• In 2007, Staff hired JDM Associates to complete the following:
• Report 2007 progress toward goal
• Determine best units of measure and reporting standards
• Establish baseline years of energy consumption
• Review prior years’ reporting based on recommended calculation measurements and methodology

9
Energy Efficiency Goal | Methodology
• Important considerations when refining energy consumption data and how it can affect results:
• Very large, diverse and dynamic portfolio
• Multiple property types
• Sample size varies annually
• Only a small portion of the portfolio has remained constant since 2004
• The aggregate energy consumption reduction should be considered a representative, rather than an absolute, measure of partners’ energy efficiency improvements

10
Energy Efficiency Goal | Results
• Compared to the 2004 energy consumption baseline, the weighted total reduction in overall energy consumption was 12.5%
• Methods for energy saving include, but are not limited to:• Meet and exceed LEED and California’s Title 24 energy standards• Energy Star appliances• Install zoned and computerized HVAC systems
2005 2006 2007
Total Energy Consumption
1.6% increase 2.3% decrease 13.3% decrease
• Results of the comprehensive review:- Revised reporting for prior years- New reporting of energy savings for 2007
11
Energy Efficiency Goal | Will We Reach 20%
• CalPERS asked its partners for their feedback on the feasibility of achieving the additional 7.5% over two years to meet our 20% energy reduction goal
• Investment partner responses varied, depending on:
• Investment strategy and building type
• Degree of control over day-to-day operations
• Energy efficiency improvements that have already been completed
• Partners generally expressed confidence in the ability to meet the remainder of the goal
• Partners cautioned that the 7.5% balance of energy reduction may not be cost-effective to achieve in certain properties

12
Energy Efficiency Plan | Additional Greening Activities
• Additional Greening Activities:
• Waste Management
• Using recycled content and recycling construction waste
• Water Conservation
• Low-flow fixtures, irrigation controls, native plants
• Further Efforts
• Storm water runoff and indoor air quality control
• Results of partners’ efforts:
• Increased environmental responsiveness
• Enhanced sustainability across portfolios
• Acknowledgment that environmental sustainability is good business practice

13
Real Estate | Hines CalPERS Green Fund
• In 2006, CalPERS committed $225M to the Hines CalPERS Green Fund (HCG)
• HCG allows CalPERS to take a leadership role by only developing high performance, sustainable office buildings certifiable through the LEED Core & Shell (LEED-CS) program
• Represents approximately $725M of development projects
• Tower 333 was the first building on the West Coast to receive LEED-CS pre-certification
• Main Place is an infill project replacing one of the most blighted blocks in downtown Houston. It is LEED Silver Pre-Certified.
Tower 333Bellevue, WA
LEED-CS Certified

14
Real Estate | Staff’s Additional Efforts
• UNEP FI PRI Working Group
• Staff helped draft a best practices report for PRI signatories to understand how to apply the Principles to property assets
• CalPERS Real Estate integrates the Principles, consistent with its fiduciary duty through the following programs and initiatives:
• Energy Efficiency Goal – Green Wave
• Responsible Contractor Program Policy
• The California Urban Real Estate Program
• Hines CalPERS Green Fund

15
Real Estate | Staff’s Additional Efforts
• CalPERS Real Estate staff assisted in drafting the section of the 2008 UN Investor Network on Climate Risk Action Plan entitled Improve the Energy Performance of Real Estate Portfolios and Investments.
• The section states the following goals:
• Aim for a 20% reduction over a three-year period in energy used in core real estate investment portfolios, using standardized units of measurement, performance baselines, and regular reporting on measures taken and actual energy performance.
• Incorporate green building standards (such as LEED and Energy Star) as a factor in making investment decisions.

16
Real Estate | Looking Forward
• Position CalPERS at the leading edge of environmentally responsive investments
• Real Estate Unit’s Strategic Plan calls for a green policy to be initiated
• Discussions with industry leaders
• Creation of new goals
• Assure that sustainability is a part of investment process from start to finish
• Staff achieving LEED-AP (Accredited Professional) status
Main Place Houston, TXLEED-CS Silver Pre-Certified

17
Global EquityEnvironmental Strategies
CalPERS | 2008 Environmental Update

18
Global Equity | External Environmental Equity Managers
• Stock portfolios in environmentally screened funds managed by leading active public equity investment managers with proven track records
• Portfolio Characteristics: environmentally-friendly universe; positive ESG factors; “eco-efficiency” ratings
• Environmental Manager Delegation: 0% - 0.5% of Global Equity
• 5 External Managers (3 U.S.; 2 Developed ex-U.S.)
• Assets Under Management: $419 million (9/30/08)

19
Global Equity | External Environmental Equity Managers
• AXA Rosenberg Investment Mgmt.
• New Amsterdam Partners
• State Street Global Advisors (U.S.)
• Global Currents, LLC
• State Street Global Advisors (Dev ex-U.S.)

20
Global Equity | External Environmental Equity Managers
Environmental External Equity
Relative PerformanceYear Ending
9/30/06*Year Ending
9/30/07Year Ending
9/30/08
Annualize Since
Inception
InceptionDate
Domestic Managers
AXA Rosenberg (3.21%) 3.15% 0.15% (0.12%) 4/1/06
New Amsterdam Partners (5.66%) (2.49%) 2.68% (1.58%) 2/1/06
State Street Global Advisors (0.05%) (2.13%) (0.77%) (1.20%) 6/1/06
International Managers
Global Currents, LLC (0.93%) (5.39%) 2.08% (0.94%) 5/1/06
State Street Global Advisors 2.70% 2.10% 0.35% 1.78% 3/1/06
Total Environmental (2.11%) (0.60%) 0.87% (0.50%) 2/1/06
Source: State Street Bank Returns are net of fees and CFA compliant.
*Note: This is a partial year. The Total Environmental number includes returns from the KLD ETF liquidated
at the end of July 2000
21
Global Equity | External Environmental Equity Managers
• Next Steps:
• Monitor evolution of environmental investing
• Explore “global” equity products
• Targeted opportunities in companies that have an advantage in adapting to, or mitigating, climate change and other environmental issues
• Internal strategies

22
CalPERS | 2008 Environmental Update
Corporate GovernanceEnvironmental Strategic Plan

23
• Objective:
• To improve transparency and timely disclosure of environmental data related to risks and opportunities by pursuing macro and micro initiatives so investors can make more informed investment decisions.
Corporate Governance | Environmental Strategic Plan

24
• Strategic Plan Implementation:
• Advocate policy reform through active leadership on boards, advisory committees, and collaborative investor coalitions
• Encouraging and supporting global reform through legislative, regulatory, and investor forums
• Promoting improved disclosure at individual companies through constructive engagement
• Enhancing and executing CalPERS’ proxy voting responsibilities to support improved environmental disclosure consistent with the InvestmentCommittee’s Global Principles of Accountable Corporate Governance
Corporate Governance | Environmental Strategic Plan
25
Corporate Governance | Environmental Strategic Plan
• Leadership through Written Correspondence:
• Securities & Exchange Commission: To emphasize growing importance of climate risk disclosure and need for interpretive guidance
• Securities & Exchange Commission: To urge SEC to pay careful attention to the implications of climate change and carbon-related regulations before finalizing new oil and gas reserves reporting
• National Association of Insurance Commissioners: To express concern over recent attempts to weaken the NAIC Climate Risk Disclosure Proposal by making key elements non-public
• Financial Accounting Standards Board: To express support for disclosing contingent liabilities such as quantifiable environmental liabilities

26
Corporate Governance | Environmental Strategic Plan
• Advocating for Congressional Leaders to Address Climate Change:
• Setting targets (60-90% cuts in greenhouse gas emissions below 1990 levels) and timetable (by 2050) to reduce emissions.
• Urging realignment of national policies and incentives to stimulate rapid deployment of clean technologies
• Inclusion of strong renewable electricity standard and increased fuel economy standards

27
Corporate Governance | Environmental Strategic Plan
• CalPERS Signatory to INCR:
• Committed to managing the System’s investments; engaging companies, investors, and others; and supporting policy action consistent with fiduciary duty that addresses significant risks and opportunities associated with climate change
• Recognition that the impacts of climate change will continue to be multi-dimensional – affecting corporations’ abilities to secure the full range of necessary resources such as energy and water
28
Corporate Governance | Environmental Strategic Plan
• In 2008, CalPERS joined INCR signatories and U.S. businesses and issued a new Call for Action:
• A mandatory national policy to contain and reduce national greenhouse gas emissions economy-wide
• Realignment of incentives and other national policies to achieve climate objectives
• Guidance from the SEC and other financial regulatory bodies on what material issues related to climate change companies should disclose

29
Corporate Governance | Environmental Strategic Plan
• Targeted Company Initiatives through Carbon Disclosure Project (CDP):
• CDP provides global framework and standards for disclosing information regarding a companies environmental impact
• 2008 company specific engagement strategy to actively promote environmental data disclosure at companies in the airline, auto, utilities, and oil and gas industries: 56 companies in 19 countries
• Public elevation in 2009 of companies opting not to disclose information regarding environmental impacts

30
Corporate Governance | Environmental Strategic Plan
• Targeted Company Initiatives through Proxy Voting:
• In 2008 to date, CalPERS has supported approximately 225 shareowner proposals seeking improved environmental reporting or disclosure
• In 2008, CalPERS’ Global Principles were enhanced by adding reference to the 14-point Ceres Climate Change Governance Checklist

31
Corporate Governance | Environmental Strategic Plan
• Dedicated Global Principle of Accountable Corporate Governance:
• “To ensure sustainable long-term returns, companies should provide accurate and timely disclosure of environmental risks and opportunities through adoption of policies or objectives, such as those associated with climate change. Companies should apply the Global Framework forClimate Risk Disclosure when providing such disclosure. The 14 point Ceres Climate Change Governance Checklist is recommended as a tool by companies to assist in the application of the Global Framework for Climate Risk Disclosure.”

32
Corporate Governance | Environmental Strategic Plan
• Looking Ahead Into 2009:
• Identifying opportunities to implement the Investment Committee's Environmental Strategic Plan through collaborative initiatives across asset classes
• Identifying opportunities to improve environmental disclosure through company specific engagement consistent with CalPERS' enhanced Global Principles related to Ceres 14 Point Climate Change Governance Checklist
• Calling on the new leadership in Congress and the U.S. ExecutiveOffice to pass strong national climate legislation
• Advocating improved environmental disclosure targeted toward emerging markets
• Working closely with INCR, UNPRI, and CDP to identify and implement opportunities to improve environmental disclosure

33
Alternative Investment ManagementClean Energy & Technology Program Update
CalPERS | 2008 Environmental Update

34
AIM| Clean Energy & Technology Program Overview
•Phase I: CalPERS Environmental Technology Program • 2004 Board directive allocating $200 MM to invest in more efficient and less
polluting environmental technology solutions
• PCG Asset Management selected as Consultant
• Primary Objective: attractive, long term, risk adjusted returns
• Ancillary Benefits: catalyzing the development of a cleaner environment, job creation, and encouraging institutional participation in an emerging sector
• CalPERS’ $200 MM as a lead investor helped catalyze over $2 billion of investment from other investors
•Phase 2: $400 MM Clean Energy & Technology Program • CalPERS created a new investment vehicle allowing other institutional investors to
participate
• Continuation and expansion of Phase I Program strategy
• Investment strategy expanded to include co-investment
• PCG Asset Management serves as discretionary Investment Manager
• Includes flexibility for CalPERS to co-invest additional capital should opportunity arise
• To date the Program has helped catalyze an additional $3 billion of capital flows into the sector
• NYC Retirement Systems participating alongside CalPERS ($200 MM)
The Program has evolved
in sophistication and
scale since

35
GLOBAL ENERGY CONDITIONS
ENVIRONMENTAL AWARENESS
EVOLVING TECHNOLOGY
PUBLIC POLICY DRIVERS
• Global energy consumption forecast to increase substantially
• Commodity & natural resource price volatility
• Increasing demand for cleaner energy & fuel production capacity
• Supply constraints regarding traditional fossil fuel supplies
• Dependence on politically and economically unstable countries for oil & gas imports
• Massive capital requirements to upgrade aging global infrastructure
• Increasing awareness of risks and opportunities related to climate change
• Rapid emerging markets growth creates threat of accelerated environmental damage
• Corporate / public awareness on the rise
• Environmental issues impacting corporate strategy
• Introduction of high profile corporate strategic initiatives: GE, BP
• Congress has prioritized climate change in an unprecedented way
• Technological developments are making many clean technologies economic
• Rapidly increasing venture capital investments driving technological developments
• Kyoto Protocol
• Robust European & Asian renewable energy mandates
• EU Emissions Trading Scheme
• Energy policy both a U.S. national security as well as environmental issue
• AB 32 in California
AIM | Fundamental Trends are Favoring Clean Energy & Technology Investments
Markets are looking for
and attributing value to
solutions that are more
efficient and less
polluting than existing
products, services or
technologies

36
AIM | Clean Energy & Technology Program Status
Phase I: Environmental Technology Program1 (2005) •Allocation: $200 million
•Committed: $191 million
•Contributed: $88 million
•General Partners: 7
•Portfolio Companies: 74
Phase II: Clean Energy & Technology Fund1 (2007)•Allocation: $400 million
•Committed: $279 million
•Contributed: $99 million
•General Partners: 8
•Portfolio Companies: 38
•Co-Investments: 6
Both phases of the
Program are
successfully deploying
capital in line with their
strategic mandates.
1 As of June 30, 2008

37
AIM | Clean Energy & Technology Program Status
Total Program (Phase 1+2)1
•Allocation: $600 million
•Committed: $470 million
•Contributed: $187 million
•General Partners: 15
•Portfolio Companies: 112
•Co-Investments: 6
Investment activity has
scaled prudently in line
with an expanding,
top-quality investable
universe and growing
overall market
opportunity.
COMMITMENTS & CONTRIBUTIONS BY VINTAGE YEAR1 ($MM)
VINTAGE YEAR DIVERSIFICATION1*
1 As of June 30, 2008
*based on committed capital

38
AIM | Clean Energy & Technology Program Performance
The Program is
performing in line with
expectations for a
private equity portfolio
at such an early stage
of development.
1 As of June 30, 2008
* At this stage of maturity the IRR’s of both Programs are not meaningful, however, when compared to the relative benchmarks they are above median.
Phase I1 Phase II1 Aggregate1
Vintage Year 2005 2007 NA
Allocation $200 million $400 million, $600 million,
Committed $191 million $279 million $470 million
Contributed $88 million $99 million $187 million
Distributed NM $5.8 million $5.9 million
Fair Market Value $95 million $93 million $188 million
Multiple 1.08x 1.00x 1.04x
IRR* 7.0% -0.03% 5.0%
General Partners 7 8 15
Portfolio Companies 74 38 112
Co-Investments 0 6 6

39
AIM | Clean Energy & Technology Program Portfolio Review
GEOGRAPHIC DIVERSIFICATION13 STRATEGY DIVERSIFICATION12
USA & Canada84.8%
Europe 9.8%
Latin America 5.1%
Asia Pacific
0.2%
Small Corp. Finance28.3%
VC – Diversified38.3%
Med. Corp. Finance
12.8%
VC – Early 12.3%
Growth Capital
4.1%
Venture Infrastructure
4.0%
The Program is
following a prudent
diversification strategy
in order to mitigate risk
and enhance risk-
adjusted returns.
1 As of June 30, 2008
2 Based on committed capital
3 Based on fair market value
STRUCTURAL DIVERSIFICATION12
Partnership Commitments
88.5%
Co-Investments
11.5%

40
AIM | Clean Energy & Technology Program Portfolio Review
SUB-SECTOR DIVERSIFICATION1The Program’s sub-
sector diversification is
representative of the
broad nature of the
opportunity and a key
element of portfolio
construction.
1 As of June 30, 2008, based on fair market value
41
Case Study | Synapsense
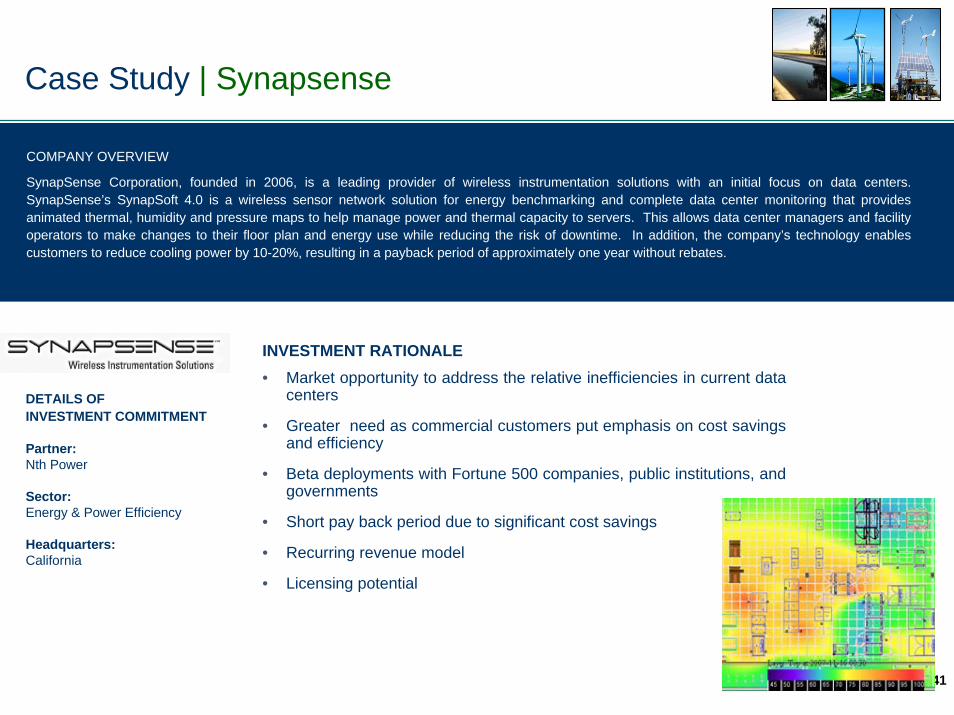
INVESTMENT RATIONALE• Market opportunity to address the relative inefficiencies in current data
centers
• Greater need as commercial customers put emphasis on cost savings and efficiency
• Beta deployments with Fortune 500 companies, public institutions, and governments
• Short pay back period due to significant cost savings
• Recurring revenue model
• Licensing potential
DETAILS OF INVESTMENT COMMITMENT
Partner:Nth Power
Sector:Energy & Power Efficiency
Headquarters:California
COMPANY OVERVIEW
SynapSense Corporation, founded in 2006, is a leading provider of wireless instrumentation solutions with an initial focus on data centers. SynapSense’s SynapSoft 4.0 is a wireless sensor network solution for energy benchmarking and complete data center monitoring that provides animated thermal, humidity and pressure maps to help manage power and thermal capacity to servers. This allows data center managers and facility operators to make changes to their floor plan and energy use while reducing the risk of downtime. In addition, the company’s technology enables customers to reduce cooling power by 10-20%, resulting in a payback period of approximately one year without rebates.

42
Case Study | Hycrete
INVESTMENT RATIONALE• High value proposition with an environmentally-friendly liquid additive that replaces membrane
wraps, a $20B industry
• Lower technology risk
• Strong management team pulled from competitors
• Partnered with US Concrete, the number three concrete manufacturer, on distribution
• Building customer base and achieved customer validation
• LEED certified building material
COMPANY OVERVIEW
Hycrete, Inc., based in Jersey City, NJ, has developed a proprietary technology that, when added to standard concrete mixtures, creates a hydrophobic cement that virtually eliminates corrosion. This level of protection yields excellent durability in concrete and creates the potential for numerous applications. By leveraging the core Hycrete technology, the company has developed a portfolio of product solutions ranging from admixtures to surface-applied waterproofers. The company is currently focused on large commercial projects demanding mission-critical sub grade, grade, and super grade water and corrosion protection. Applications include deep foundation slabs and walls, podium and plaza decks, roof, parking, and tunnel structures. Hycrete’s admixture is also qualified for DOT applications and residential foundations.
DETAILS OF INVESTMENT COMMITMENT
Partners:NGEN, RockPort
Sector:Building Efficiency
Headquarters:New Jersey

43
Case Study | Plasco Energy Group
INVESTMENT RATIONALE
• Unique technology
• Potential global rollout opportunity
• Strong potential sales pipeline
• Potential waste to energy market leader
• Small, aesthetically pleasing, non-odor emitting plant design suitable for highly populated areas
• Ability to produce energy 24/7 from a renewable, low cost source
COMPANY OVERVIEW
PLASCO Energy Group, incorporated in 2005, is developing a municipal waste-to-energy process utilizing plasma arc gasification technology to produce low heating value gas (“syngas”) used to generate electricity. The Company’s proprietary PLASCO Conversion System (“PCS”) converts carbonaceous materials, such as municipal solid waste, into syngas and a commercially useful, inert solid, or “slag”. The Company’s pilot plant is located in Castellgali, Spain. In addition to the demonstration facility in Spain, the Firm has an 85 tonne-per-day facility in operation near Ottawa, Ontario. The Fund participated in a round of financing that is expected to help PLASCO: (i) build more plants; (ii) complete product enhancement; (iii) develop the sales pipeline; and (iv) provide an exit opportunity for long-term shareholders.
DETAILS OF INVESTMENT COMMITMENT
Partners: First ReserveCalSTRS
Sector: Biomass & Waste
Headquarters:Canada
44
Case Study | Solar Reserve
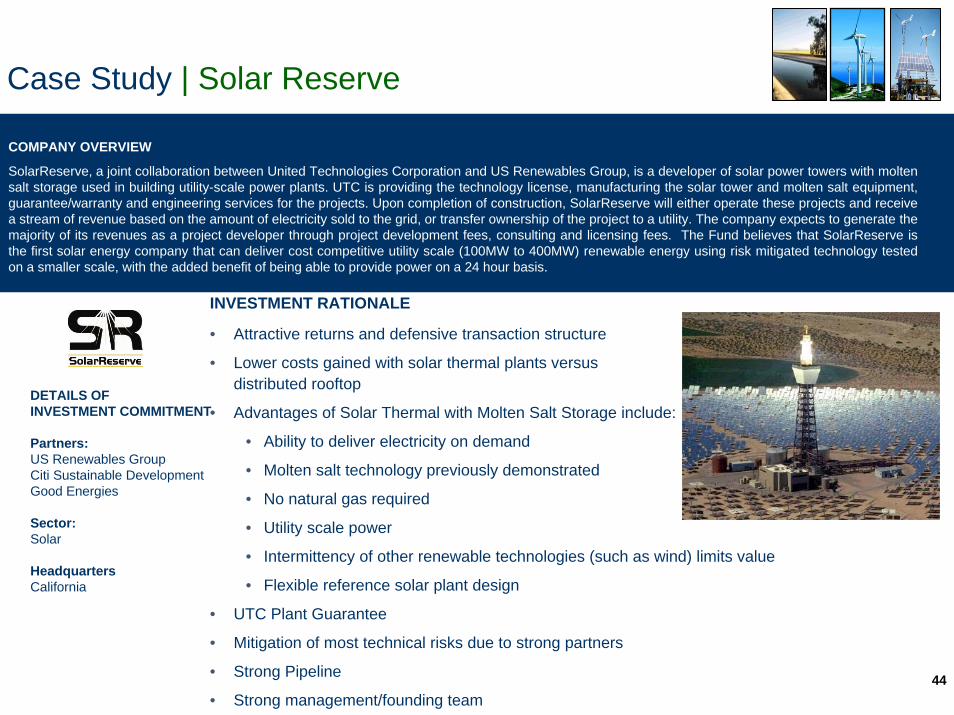
INVESTMENT RATIONALE
• Attractive returns and defensive transaction structure
• Lower costs gained with solar thermal plants versus distributed rooftop
• Advantages of Solar Thermal with Molten Salt Storage include:
• Ability to deliver electricity on demand
• Molten salt technology previously demonstrated
• No natural gas required
• Utility scale power
• Intermittency of other renewable technologies (such as wind) limits value
• Flexible reference solar plant design
• UTC Plant Guarantee
• Mitigation of most technical risks due to strong partners
• Strong Pipeline
• Strong management/founding team
COMPANY OVERVIEW
SolarReserve, a joint collaboration between United Technologies Corporation and US Renewables Group, is a developer of solar power towers with molten salt storage used in building utility-scale power plants. UTC is providing the technology license, manufacturing the solar tower and molten salt equipment, guarantee/warranty and engineering services for the projects. Upon completion of construction, SolarReserve will either operate these projects and receive a stream of revenue based on the amount of electricity sold to the grid, or transfer ownership of the project to a utility. The company expects to generate the majority of its revenues as a project developer through project development fees, consulting and licensing fees. The Fund believes that SolarReserve is the first solar energy company that can deliver cost competitive utility scale (100MW to 400MW) renewable energy using risk mitigated technology tested on a smaller scale, with the added benefit of being able to provide power on a 24 hour basis.
DETAILS OF INVESTMENT COMMITMENT
Partners: US Renewables GroupCiti Sustainable Development Good Energies
Sector:Solar
HeadquartersCalifornia

45
AIM | Environmental Benefit Evaluation
Environmental Due Diligence (Pre-Investment)•Unique and innovative environmental due diligence process used to determine whether an investment is likely to yield material net environmental benefits
•Evaluation is conducted in tandem with financial due diligence evaluation
•Formal environmental due diligence report issued prior to closing
Environmental Measurement (Post-Investment)
• Analytical framework established to relate business results to quantified environmental impacts for each investment
•Data are collected and analyzed annually
•Annual report issued aggregating and reporting results at
Program level
Current Evaluation of Program Portfolio•It is estimated that approximately 80% of the companies in the portfolio will yield material and quantifiable environmental benefits once commercial activity is established
In partnership with
Environmental Capital
Group, the Program has
developed an innovative
methodology for
measuring and
quantifying the
environmental benefits
of Portfolio activity.
PROGRAM ENVIRONMENTAL BENEFITS1
Pre Commercial (Not Quantified Yet)57%
Primary Benefit
22%
Enabling Benefit 14%
Undetermined / Immaterial Benefit
8%
1 As of December 31, 2007

46
AIM | Environmental Benefit Analysis
While still in the early
stages of its evolution,
the Program has begun
to catalyze material
environmental benefits.
2007 Annual Equivalents:
Energy Savings
= 34,000 households
Renewable Power Production
= 69,000 households
Water Savings
= 225,000 people
CO2 Emission Reduction
= 39,000 people
AGGREGATE PORTFOLIO INVESTMENT ACTIVITY
MATERIAL & QUANTIFIABLE NET ENVIRONMENTAL BENEFITS
1 2007 calendar year total

47
CO2 EMISSION REDUCTIONS1 (1,000 metric tons)
RENEWABLE POWER PRODUCTION1 (GWh)
AIM | Environmental Analysis
Environmental benefits
generated by the
Program should scale
significantly in future
years as additional
capital is deployed and
commercial activity
begins to increase
across the portfolio.
ELECTRICITY SAVINGS1 (GWh)
TOTAL WATER SAVINGS1 (billion gallons)
1 2006 & 2007 calendar year totals
48
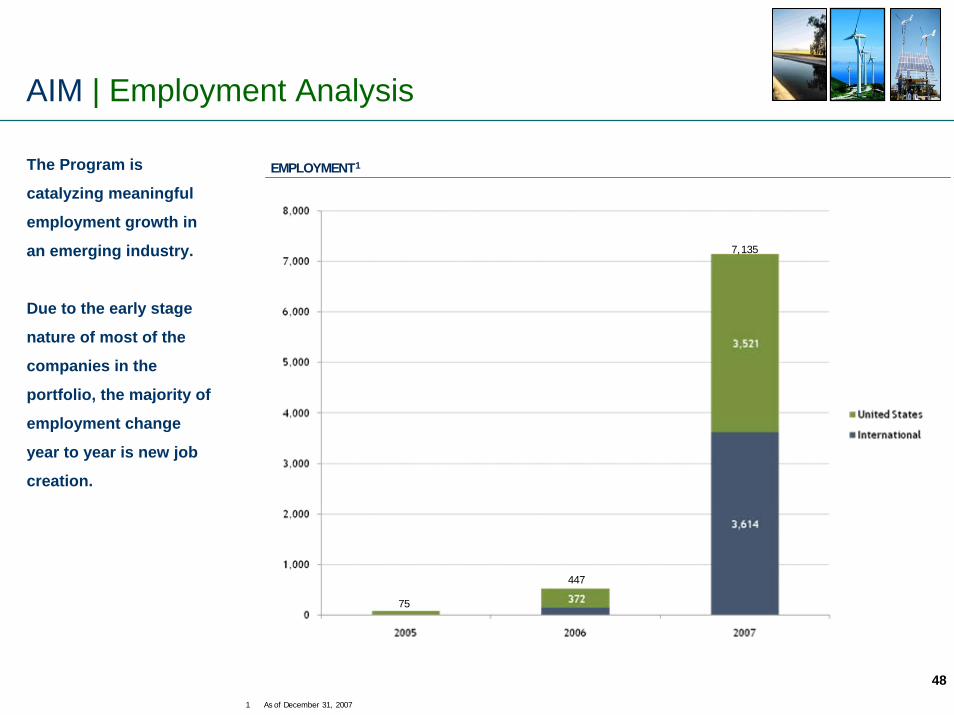
AIM | Employment Analysis
EMPLOYMENT1The Program is
catalyzing meaningful
employment growth in
an emerging industry.
Due to the early stage
nature of most of the
companies in the
portfolio, the majority of
employment change
year to year is new job
creation.
1 As of December 31, 2007
75
447
7,135
49
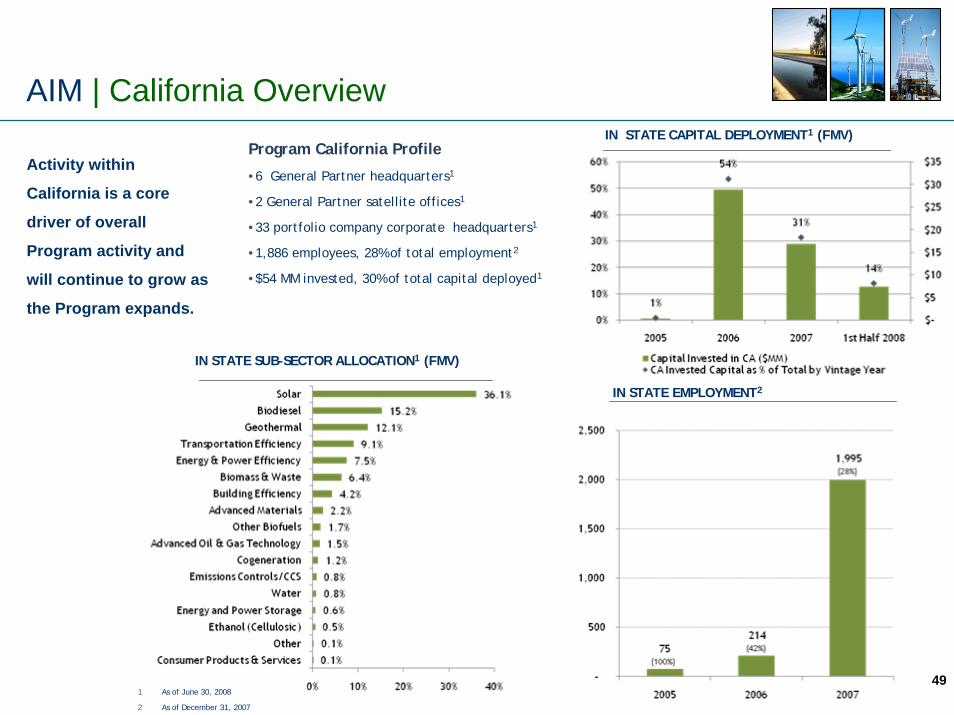
AIM | California OverviewProgram California Profile
•6 General Partner headquarters1
•2 General Partner satellite offices1
•33 portfolio company corporate headquarters1
•1,886 employees, 28% of total employment2
•$54 MM invested, 30% of total capital deployed1
IN STATE CAPITAL DEPLOYMENT1 (FMV)
IN STATE SUB-SECTOR ALLOCATION1 (FMV)
IN STATE EMPLOYMENT2
Activity within
California is a core
driver of overall
Program activity and
will continue to grow as
the Program expands.
1 As of June 30, 2008
2 As of December 31, 2007
50
AIM | Aggregate Sector Exposure
• Through Phase I, Phase II and other AIM Partner relationships CalPERS has approximately $1.1 billion of aggregate exposure to the clean energy and technology value chain
• Phase I: $200 million
• Phase II: $400 million
• Additional exposure through core partnerships in AIM portfolio: $500 million
The CalPERS AIM
Program has
approximately $1.1
billion of total exposure
to the clean energy and
technology sector.
51
AIM | Conclusions
• Through the Program CalPERS has established a leading profile as one of the most sophisticated global investors in the clean energy and technology sector
• The Program has attracted world class partners
• The Program portfolio is still young but is performing well and generating material and quantifiable environmental benefits
• The financial outlook for the portfolio is robust
• The Program is truly unique and pioneering with respect to its environmental benefit measurement system
• The Program has successfully drawn other institutional investorsinto the market
• The Program is supporting job growth particularly within the state of California
The Program is
achieving all of its
objectives.

52
CalPERS | 2008 Environmental Update
Inflation Linked Asset ClassInfrastructure Investment Policy

53
Infrastructure | Investment Policy
• An investment policy was adopted to guide CalPERS investments in infrastructure
• The following language was included in the policy:
• CalPERS encourages the prudent use of sustainable development methods and operational practices when reasonable and economically feasible. Consideration shall be given to the use of renewable energy technologies, recycled and renewable building materials, air and water conservation technologies and practices, and efficient waste, recycle and disposal technology and practices. Consideration shall also be given to the environmental sustainability of investments including but not limited to energy efficiency, fuel economy, alternative energy generation and distribution impacts.
54
CalPERS | 2008 Environmental Update
Cross Asset Class InitiativeINCR Manager Survey

55
Cross-Asset Class Initiative | INCR Manager Survey
• Initiated by State Controller John Chiang’s in April 2008
• The survey is designed to assess investment managers’ ability to evaluate climate risks and opportunities of companies in which they invest
• Staff is working closely with the Investor Network on Climate Risk (INCR) to develop the survey
• Survey results will be used to develop a set of best practices for the analysis and company valuation
• The survey is expected to be launched in late November
• The survey will be sent to a broad universe of public and private equity investment managers
• Reports on status and results will be made to the Investment Committee

56
CalPERS | 2008 Environmental Update
Conclusion• Significant progress made across portfolio
• Continuing to work collaboratively, both internally and externally, to identify and act upon environmentally-related risks and opportunities
• Will continue to update the Investment Committee

CalPERS Investment Office Environmental InitiativesAnnual Update
November 2008
CalPERS | 2008 Environmental Update