california physician supply and distribution: headed …california physician supply and distribution...
TRANSCRIPT
JUNE 2018
California Physician Supply and Distribution: Headed for a Drought?

2California Health Care Foundation
Contents
3 Summary
4 Introduction
4 Methodology
4 FindingsPhysician Supply and Activities
Specialty Distribution
Physician Demographics
Practice Types
Physician Participation in Medi-Cal
12 ConclusionsSupply of Active Patient Care Physicians
Distribution of Physician Specialties
Demographics of California Physicians
Practice Types
Physician Participation in Medi-Cal
Limitations
Recommendations
16 Appendices A. Methodology
B. California Medical Board Mandatory Survey Instrument
C. California Medical Board Supplemental Survey Instrument
D. California Counties Included in Regions
E. Physician Race/Ethnicity Categories
F. Identifying and Categorizing Physician Specialty
G. Supply of Active Patient Care Physicians in 10 Major Categories of Specialties, by Region, 2015
27 Endnotes
AuthorsJanet M. Coffman, MPP, PhDMargaret Fix, MPHHealthforce Center and Philip R. LeeInstitute for Health Policy StudiesUniversity of California, San Francisco
Michelle Ko, MD, PhDDepartment of Public Health SciencesUniversity of California, Davis
About the FoundationThe California Health Care Foundation is dedicated to advancing meaningful, measur-able improvements in the way the health care delivery system provides care to the people of California, particularly those with low incomes and those whose needs are not well served by the status quo. We work to ensure that people have access to the care they need, when they need it, at a price they can afford.
CHCF informs policymakers and industry lead-ers, invests in ideas and innovations, and connects with changemakers to create a more responsive, patient-centered health care system.
For more information, visit www.chcf.org.

3California Physician Supply and Distribution: Headed for a Drought?
The distribution of both primary and specialty care physicians was uneven in the state. Ratios of active patient care physicians per 100,000 people in the Inland Empire and San Joaquin Valley regions were approxi-mately half that of the Greater Bay Area for both primary care and specialty care physicians.
The distribution of physicians across types of practice varied by physician age and specialty. Over 40% of physicians age 60 or older were in solo practice, whereas 79% of those under 40 years old reported that they prac-ticed in Kaiser Permanente or in another group practice. Psychiatrists were more likely to be in solo practice or to work in a community health center or public clinic than physicians in other specialties.
Physicians were more likely to accept patients with any type of health insurance than uninsured patients, but were less likely to accept Medi-Cal than other forms of health insurance. In 2015, 62% of primary care physi-cians and 64% of specialists had any Medi-Cal patients. Fifty percent of primary care physicians and 57% of spe-cialists had any uninsured patients.
RecommendationsTo address the challenges in California physician supply and distribution identified in this study, the authors offer the following recommendations:
$$ Increase funding to expand undergraduate medical education, particularly in underserved areas.
$$ Increase funding to expand graduate medical edu-cation, particularly in specialties with projected shortages.
$$ Provide financial incentives for both primary care and specialty physicians to practice in underserved areas.
$$ Support opportunities for international medical grad-uates to practice in underserved areas of the state.
$$ Increase investments in programs that address the diversity of the physician workforce.
$$ Invest in technologies, such as telehealth and elec-tronic consultation and referral, that can maximize scarce physician resources, especially for rural areas.
$$ Provide training, support, and incentives for team-based care.
Summary
This report describes the number of licensed physi-cians in California in 2015, including their practice activities, demographic characteristics, and geo-
graphic distribution. Data were derived from the Medical Board of California’s mandatory survey for relicensure and a voluntary supplemental survey conducted in 2015. Where data from 2013 were available, changes from 2013 to 2015 were included.
Key FindingsLess than half of the 139,000 medical doctors licensed by the state of California (61,196) could be identi-fied as active patient care physicians (physicians who provided 20 or more hours per week of patient care in California). Some physicians with California licenses did not practice in California. Others did not renew their licenses within the two-year period required under California law. Some were completing residency or fel-lowship training.
The total supply of active patient care physicians declined slightly between 2013 and 2015. This trend appears to be driven by the aging of the physician work-force. Older physicians reported spending fewer hours per week on patient care, and were the most likely to report providing no patient care at all. The percentage of active patient care physicians over age 60 declined by eight percentage points between 2013 and 2015, while the percentage of active patient care physicians in other age groups remained stable.
Female and male physicians engaged in patient care at similar rates. A slightly higher percentage of females reported spending at least 20 hours per week on patient care (81% of females versus 78% of males).
Latinos and African Americans were substantially underrepresented in the physician workforce. Five percent of active patient care physicians reported Latino ethnicity, versus 38% for the general population. Three percent of physicians were African American, versus 6% of the general population.
Thirty-two percent of California’s active patient care physicians were primary care physicians (defined as family physicians, general internists, general pediatri-cians, and general practitioners).

4California Health Care Foundation
Analyses were limited to physicians with active licenses who were located in the state (as determined by zip code) and were no longer in training. To broadly com-pare primary care versus specialty care physician supply, physicians in the following specialties were categorized as primary care physicians: family medicine (including general practice), general pediatrics, and general internal medicine (including geriatric medicine). The remainder were classified as specialty care physicians.
FindingsPhysician Supply and ActivitiesAccording to the Medical Board of California’s records, approximately 139,000 physicians had an active license in California in 2015 (Table 1). However, fewer than half of all MDs licensed by the state of California (61,196) could be identified as active patient care physicians (physicians who provided 20 or more hours per week of patient care in California). The differences were due to several factors. More than 25,000 physicians with California licenses did not practice in the state. Some physicians did not renew their licenses within the two-year period required under California law, while others were completing residency or fellowship training.
Table 1. Active Licensed Physicians, 2015
NUMBER OF MDs
Active California license 139,222
California zip code 113,034
Two-year cohort 93,023
Not in training 87,111
Survey response 81,003
Answered patient care question 77,847
Any patient care: 1+ hours per week 71,348
Patient care: 20+ hours per week 61,196
Identified specialty and/or board certification 60,231
Source: Analysis of Medical Board of California data by the Philip R. Lee Institute for Health Policy Studies, University of California, San Francisco.
IntroductionMajor demographic trends are driving an increasing demand for health care in California. The state’s total population is projected to increase by 6.4 million people between 2015 and 2035, and the population age 65 or older is projected to increase by 4.9 million.1 With an aging population, patient health needs will likely increase in complexity and severity. To anticipate the state’s abil-ity to respond to these demographic trends, California policymakers need to understand the current supply of active physicians, the number providing patient care, and how they are distributed across the state.
This report provides detail on the total number of active licensed physicians (MDs) in California, across its regions and 58 counties. It also describes the number of hours licensed physicians spend on patient care and other activities. Findings regarding the specialty, age, gen-der, and racial and ethnic distribution of active patient care physicians and their practice settings are presented. When applicable, findings from 2013 are compared to findings from 2015.
MethodologyThe study methodology is discussed briefly here. For a more detailed description of methods, refer to Appendix A.
Most of the data presented in this report are from the Medical Board of California’s mandatory survey, which contains information on physician demographics, spe-cialty, board certification, location, and practice activities, including time spent on patient care. The survey is administered to physicians who are renewing licenses in the state (required every two years). Responses from MDs who renewed their licenses between August 1, 2013, and July 31, 2015 were analyzed.
Information on practice settings was derived from a vol-untary supplemental survey administered to a sample of physicians whose licenses were due for renewal from June through December 2015.

5California Physician Supply and Distribution: Headed for a Drought?
Patient care. Of 81,003 non-trainee physicians with prac-tice locations in California who completed the survey, the average number of hours spent per week on patient care was 34.6 (Figure 1). Primary care and specialty care physicians provided similar percentages of patient care at 20+ hours per week, but the percentage of specialists that reported spending 40+ hours per week on patient care was somewhat higher (Figure 2).
Figure 1. Weekly Hours Spent on Selected Activities by Licensed Physicians, 2015
Note: Physicians who did not answer the survey question about a particular professional activity were not included in the estimate of mean hours spent on that activity per week.
34.6
Patient Care
7.4
Administration
4.5
Teaching
2.6Other
1.8Telemedicine
3.5
Research
Other activities. While patient care was the primary activity of most physicians, they also reported hours spent on other activities such as research, teaching, and administration (Table 2). Over half reported spending time on administrative activities, with about 18% spend-ing 10 or more hours per week on them. Approximately 22% reported spending one or more hours per week on research and nearly 40% spent one or more hours
Figure 2. Percentage of Licensed Physicians Who Spent Time on Selected Activities, by Hours Per Week, Primary Care vs. Specialty Care, 2015
Other
Telemedicine
Administration
Teaching
Research
Patient Care
Other
Telemedicine
Administration
Teaching
Research
Patient Care
7 7 7 13 23 44
84 11 211
60 30 6 21
35 43 12 5 2 3
81 16 21 1
82 13 31 1
8 6 7 11 19 49
64 24 6 322
44 42 10 311
28 50 14 5 22
82 14 21 1
75 18 3 1 12
HOURS SPENT PER WEEK
■ 0 ■ 1–9 ■ 10–19 ■ 20–29 ■ 30–39 ■ 40+
<1
<1
<1
Primary Care (n = 25,067)
Specialty Care (n = 55,195)
Notes: Labels are %. Segments may not sum 100% due to rounding.
Source (Figures 1 and 2): Analysis of Medical Board of California data by the Philip R. Lee Institute for Health Policy Studies, University of California, San Francisco.
Table 2. Percentage of Licensed Physicians Who Spent Time on Selected Activities, by Hours Per Week, 2015 (N = 81,003)
H O U R S P E R W E E KDID NOT ANSWER0 1–9 10–19 20–29 30–39 40+
Patient care 8.0% 6.2% 6.3% 10.8% 19.4% 45.3% 3.9%
Administration 24.3% 38.4% 10.8% 3.9% 1.3% 2.1% 19.1%
Research 50.9% 14.7% 3.4% 1.6% 0.9% 1.2% 27.3%
Teaching 37.9% 29.3% 6.5% 2.0% 0.5% 0.8% 23.0%
Telemedicine 51.2% 8.9% 1.4% 0.5% 0.2% 0.6% 37.2%
Other 46.1% 9.7% 1.9% 0.8% 0.3% 0.9% 40.3%
Source: Analysis of Medical Board of California data by the Philip R. Lee Institute for Health Policy Studies, University of California, San Francisco.

6California Health Care Foundation
on teaching. Specialist physicians were more likely than primary care physicians to report spending at least one hour per week on research, teaching, or administration (Figure 2).
Change in activities from 2013 to 2015. From 2013 to 2015, the number of active licensed California phy-sicians who had completed training and answered the mandatory survey decreased by 1.3% from 82,042 to 81,003, while the number who answered the patient care hours question increased 1.2% from 76,906 to 77,847 (Figure 3). The number of physicians who reported prac-ticing patient care for at least 20 hours per week declined 2.4% from 62,694 to 61,196. Over the same period, the number of physicians reporting no hours spent on patient care doubled from 3,121 to 6,499 physicians.
Specialty DistributionSupply of primary and specialty care MDs. Thirty-two percent (19,497) of active patient care physicians reported practicing in a primary care specialty, defined as family medicine, general internal medicine, or pediatrics (Figure 4). Another 32% practiced in medical specialties, surgical specialties, and general surgery. Nineteen per-cent practiced in facility-based specialties, which consist of emergency medicine physicians, anesthesiologists, pathologists, and radiologists. In 2015, there were 50 primary care physicians and 104 specialists per 100,000 persons in the state.
Furthermore, the development of hospitalist practices and the number of hospital-based physicians has risen in recent years.2 In the supplemental survey, approximately 2.3% of family physicians, 8.8% of general internal medi-cine physicians, and 4.7% of pediatricians in California reported practicing in a hospital over 90% of the time. This suggests that the total number of primary care phy-sicians based on specialty alone may be overestimated, particularly among general internists.
Figure 4. Supply of Physicians, by Specialty, 2015
Note: OB/GYN is obstetrics and gynecology.
Source (Figures 3 and 4): Analysis of Medical Board of California data by the Philip R. Lee Institute for Health Policy Studies, University of California, San Francisco.
Primary Care32%
OB/GYN5%
Psychiatry 6%
2%General Surgery
Facility-BasedSpecialties
19%
MedicalSpecialties18%
SurgicalSpecialties
12%
Other6%
Figure 3. Hours Per Week Spent on Patient Care by Licensed Physicians, 2013 vs. 2015
0 hours
20+ hours
Answered Patient Care Hours
TOTAL RESPONDENTS
82,042
81,003
76,906
77,847
62,694
61,196
3,121
6,499
■ 2013■ 2015

7California Physician Supply and Distribution: Headed for a Drought?
Primary and specialty care physicians by region. The supply of physicians who spent at least 20 hours per week on patient care varied across regions and by specialty (Figure 5; for detailed counts by region, see Appendix G). The Inland Empire and San Joaquin Valley regions had the lowest numbers of primary care and spe-cialty physicians per 100,000 people.
The distribution of physicians varied by county. The supply of primary care physicians per 100,000 people ranged from a low of 0 in Alpine County to a high of 113 in Napa County (see Figure 6). Similarly, the sup-ply of specialty physicians per 100,000 people ranged from a low of 0 in Alpine County and Sierra County to a high of 234 in Napa County. Several counties had no or few physicians in specific specialties, including geriat-ric medicine, endocrinology, psychiatry, pulmonary care, and rheumatology (see detailed data file on chcf.org 3 for counts of all specialties by county). Not having any physi-cians in a specialty in a county poses a barrier to access, especially in California, where many counties cover large geographic areas.
Figure 5. Physicians per 100,000 Residents, by Region Primary Care vs. Specialty Care, 2015
CALIFORNIA
104.1 / 49.8
San Joaquin Valley
San Diego Area
Sacramento Area
Orange County
Northern and Sierra
Los Angeles County
Inland Empire
Greater Bay Area
Central Coast
■ Primary Care■ Specialty Care
49.5 92.9
34.5 64.3
46.9 75.6
52.0 108.4
53.7 113.3
49.8 112.3
39.4 65.0
51.3 110.3
64.1 138.2
Source (Figures 5 and 6): Analysis of Medical Board of California data by the Philip R. Lee Institute for Health Policy Studies, University of California, San Francisco.
Alameda
AlpineAmador
Butte
Calaveras
Colusa
Contra Costa
El Dorado
Fresno
Glenn
Imperial
Inyo
Kern
Kings
Los Angeles
Madera
Marin
Mariposa
Mendocino
Merced
Mono
Monterey
Napa
Nevada
Orange
Placer
Plumas
Riverside
Sacra-mento
SanBenito
San Bernardino
San Diego
SanJoaquin
San Luis Obispo
San Mateo
San Francisco
Santa Barbara
Santa Clara
Santa Cruz
Sierra
Solano
Sonoma
Stanislaus
Sutter
Tehama
DelNorte
Humboldt
Lake
Lassen
Modoc
Shasta
Siskiyou
Trinity
Tulare
Tuolumne
Ventura
Yolo
Yuba
◾ <34◾ 34– 49◾ 50–59◾ >59
STATE AVERAGE 49.8
0114
Figure 6. PCPs per 100,000 Residents, by County, 2015
Note: PCPs is primary care physicians.

8California Health Care Foundation
Physician DemographicsAge. Physicians over age 60 accounted for 36% of the 77,847 nontrainee licensed physicians with practice loca-tions in California who provided information about hours spent on patient care. Among active patient care physi-cians, 27% were over age 60. In the Northern and Sierra region, older physicians accounted for 37% of active patient care physicians (Figure 7).
Change from 2013 to 2015. Over the two-year period, the percentage of survey respondents practicing in California over age 60 increased from 31% to 36%. Among these physicians, the percentage engaged in active patient care decreased by eight percentage points. The percentage of active patient care physicians in the younger age groups remained stable over the same period.
Gender. In 2015, 33% of survey respondents were female. The age distributions of male and female physicians were quite different; this is largely due to the growth in the number of women entering medical school since the 1970s. Among nontrainee physicians in California who provide patient care at least 20 hours per week, 34% of male physicians were over age 60, versus only 14% of female physicians (Figure 8).
A slightly higher percentage of females than males were engaged in active patient care (81% vs. 78%).
Within each age group, male and female physicians in California were engaged in active patient care (i.e., provided patient care 20 or more hours per week) at similar rates (Figure 9, page 9). The largest differential was among those age 40 to 60. In this age group, 90% of male physicians were engaged in active patient care, versus 83% of female physicians. For both genders, the proportion of physicians who provided patient care 20 or more hours per week was substantially lower among phy-sicians over 60 than it was among younger physicians.
California
San Joaquin Valley
San Diego Area
Sacramento Area
Orange County
Northern and Sierra
Los Angeles County
Inland Empire
Greater Bay Area
Central Coast
12% 56% 32%
19% 59% 22%
18% 56% 26%
17% 52% 31%
9% 55% 37%
14% 58% 28%
17% 62% 21%
17% 60% 23%
14% 56% 30%
17% 57% 27%
■ <40 ■ 40–60 ■ >60
Figure 7. Age of Active Patient Care Physicians by Region, 2015
Note: Segments may not sum 100% due to rounding.
>6040–60<40ALL AGES
34%
66%62%
54%
14%
34%
25%
12%
■ Female ■ Male
Figure 8. Age Distribution of Active Patient Care MDs by Gender, 2015
Source (Figures 7 and 8): Analysis of Medical Board of California data by the Philip R. Lee Institute for Health Policy Studies, University of California, San Francisco.

9California Physician Supply and Distribution: Headed for a Drought?
Race and ethnicity. The racial and ethnic breakdown of California’s physicians differed considerably from that of the overall population (Table 3).
Compared to the state population, the physician popu-lation was composed of a higher percentage of Asians (28% of physicians and 14% of population). The percent-age of Latino physicians was 33 percentage points lower than that of the Latino state population (5% of physi-cians versus 38% of the population). African Americans accounted for 6% of the population but 3% of physicians.
The California Office of Statewide Health Planning and Development defines the following Asian ethnic groups as “underrepresented” in medicine: Cambodian, Thai, Vietnamese, and Other Southeast Asian.4 The mandatory survey data indicated that 7% of California’s physicians were “underrepresented” Asian ethnicities, Pacific Islanders, or Native Hawaiians.
The racial and ethnic breakdown
of California’s physicians differed
considerably from that of the
overall population
Table 3. Race/Ethnicity of Active Patient Care MDs and State Population, 2015
# OF MDs % OF MDs% STATE
POPULATION
American Indian / Alaska Native
72 0.1% 0.4%
Asian 16,892 27.6% 13.6%
African American 1,556 2.5% 5.9%
Latino 3,097 5.1% 38.4%
Middle Eastern 1,696 2.8% N/A
Multiracial/ethnic 209 0.3% 2.8%
White 19,673 32.1% 38.7%
Other 1,658 2.7% 0.2%
Decline to state* 8,779 14.3% N/A
Did not answer race/ethnicity question*
7,564 12.4% N/A
Total 61,196 100.0%
*A substantial number of physicians are not accounted for among the listed groups because 14% declined to report their race/ethnicity and 12% did not answer the survey question about race/ethnicity.
Note: The survey included an option to self-identify as Middle Eastern with unspecified nationality or ethnicity. The ACS does not have a corre-sponding Middle Eastern response option. For California’s population, multiracial/ethnic was derived from combining multiple single-item responses (whereas the physician survey allowed respondents to select all response options).
Sources: Analysis of Medical Board of California data and American Community Survey (ACS) data by the Philip R. Lee Institute for Health Policy Studies, University of California, San Francisco.
>6040–60<40ALL AGES
81% 78%
91% 93%
83%90%
60% 61%
■ Female ■ Male
Figure 9. Percentage of Female and Male MDs Engaged in Active Patient Care, by Age, 2015
Source: Analysis of Medical Board of California data by the Philip R. Lee Institute for Health Policy Studies, University of California, San Francisco.
10California Health Care Foundation
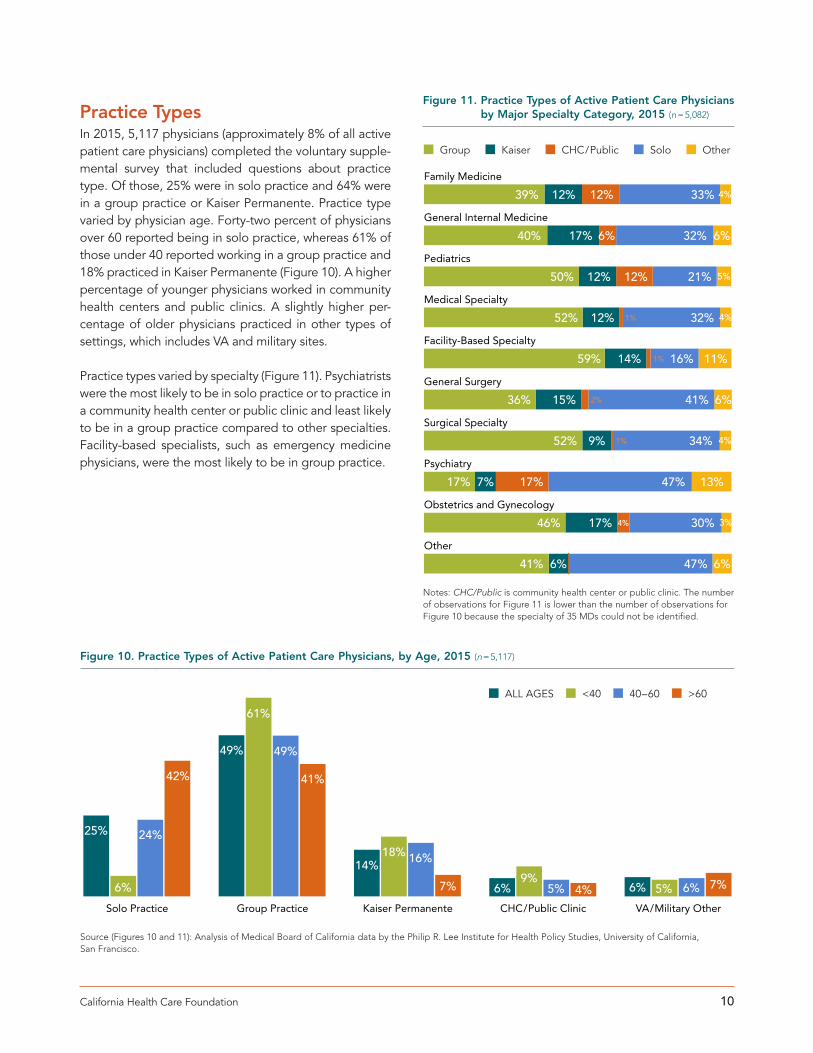
Practice TypesIn 2015, 5,117 physicians (approximately 8% of all active patient care physicians) completed the voluntary supple-mental survey that included questions about practice type. Of those, 25% were in solo practice and 64% were in a group practice or Kaiser Permanente. Practice type varied by physician age. Forty-two percent of physicians over 60 reported being in solo practice, whereas 61% of those under 40 reported working in a group practice and 18% practiced in Kaiser Permanente (Figure 10). A higher percentage of younger physicians worked in community health centers and public clinics. A slightly higher per-centage of older physicians practiced in other types of settings, which includes VA and military sites.
Practice types varied by specialty (Figure 11). Psychiatrists were the most likely to be in solo practice or to practice in a community health center or public clinic and least likely to be in a group practice compared to other specialties. Facility-based specialists, such as emergency medicine physicians, were the most likely to be in group practice.
VA/Military OtherCHC/Public ClinicKaiser PermanenteGroup PracticeSolo Practice
25% 24%
6%
42%
49%
61%
49%
41%
14%18% 16%
7% 6%9%
5% 4% 6% 5% 6% 7%
■ ALL AGES ■ <40 ■ 40–60 ■ >60
Figure 10. Practice Types of Active Patient Care Physicians, by Age, 2015 (n = 5,117)
Source (Figures 10 and 11): Analysis of Medical Board of California data by the Philip R. Lee Institute for Health Policy Studies, University of California, San Francisco.
Other
Obstetrics and Gynecology
Psychiatry
Surgical Specialty
General Surgery
Facility-Based Specialty
Medical Specialty
Pediatrics
General Internal Medicine
Family Medicine
39% 12% 12% 33% 4%
40% 17% 6% 32% 6%
50% 12% 12% 21% 5%
52% 12% 1% 32% 4%
59% 14% 1% 16% 11%
36% 15% 2% 41% 6%
52% 9% 1% 34% 4%
17% 7% 17% 47% 13%
46% 17% 4% 30% 3%
41% 6% 47% 6%
■ Group ■ Kaiser ■ CHC/Public ■ Solo ■ Other
Figure 11. Practice Types of Active Patient Care Physicians by Major Specialty Category, 2015 (n = 5,082)
Notes: CHC/Public is community health center or public clinic. The number of observations for Figure 11 is lower than the number of observations for Figure 10 because the specialty of 35 MDs could not be identified.

11California Physician Supply and Distribution: Headed for a Drought?
Physician Participation in Medi-CalThe voluntary supplemental survey also asked physi-cians questions about the types of health insurance they accept. Figure 12 presents information on the percent-ages of physicians who had patients in their practices by type of insurance coverage. Physicians were most likely to have patients with private insurance coverage in their practices, followed by patients with Medicare coverage. Only 62% of primary care physicians and 64% of special-ists had any Medi-Cal beneficiaries in their practices.
In 2015, California physicians were less likely to accept new Medi-Cal patients than patients with Medicare or private health insurance (Figure 13). Only 55% of pri-mary care physicians and 62% of specialists accepted new Medi-Cal patients. Conversely, physicians were more likely to accept new Medi-Cal patients than new uninsured patients. One in 3 primary care physicians and 4 in 10 specialists accepted new patients who were uninsured. The extent to which physicians accept new patients affects the ability of patients who are newly insured, or who switch from one type of health insurance to another, to find a physician who will care for them.
In 2015, California physicians were less likely to accept new Medi-Cal patients than patients with Medicare or private health insurance. Conversely, physicians were more likely to accept new Medi-Cal patients than new uninsured patients.
Uninsured
Private Insurance
Medicare
Medi-Cal
64% 62% 64%
74% 64%
78%
87%86% 87%
55% 50%
57%
■ ALL PHYSICIANS■ Primary Care■ Specialty Care
Figure 12. Physicians with Patients in Practice by Coverage Type, 2015
Uninsured
Private Insurance
Medicare
Medi-Cal
60% 55%
62%
77% 62%
83%
85% 79%
87%
38% 32%
41%
■ ALL PHYSICIANS■ Primary Care■ Specialty Care
Figure 13. Physicians Accepting New Patients by Payer, 2015
Source (Figures 12 and 13): Analysis of Medical Board of California data by the Philip R. Lee Institute for Health Policy Studies, University of California, San Francisco.

12California Health Care Foundation
ConclusionsThe analysis of Medical Board of California mandatory survey data provides an overview of the supply of physi-cians in the state as well as detail on their distribution across active patient care, specialty care, and the regions where they practice.
Supply of Active Patient Care PhysiciansLess than half of all physicians with California medi-cal licenses could be identified as providing patient care for 20 or more hours per week (i.e., active patient care). Current totals of medical licenses overestimate the supply of physicians who are available to provide patient care to the state’s population. Of physicians who had active California license in 2015, 26,000 were not located in California. Out-of-state physicians may retain California licenses for many reasons, and can include those who completed training in California but relo-cated to practice elsewhere, military service members stationed in other locales, and physicians who previously practiced in the state who moved but wished to retain licensure. Among those located in California who were not in training, most reported providing care at least one hour per week. Although the total number of physicians with California licenses increased from 2013 to 2015, the number engaged in active patient care declined from 62,694 to 61,196.
The number of physicians who did not provide any patient care increased between 2013 and 2015. The number of active licensed physicians who reported spending no hours per week on patient care increased 108% from 3,121 in 2013 to 6,499 in 2015.
Distribution of Physician SpecialtiesThe distributions of primary and specialty care physi-cians were highly uneven across regions. The Inland Empire and San Joaquin Valley regions had 40% fewer primary care physicians per capita than the Greater Bay Area, and less than half as many specialists per capita. Previous research has found that nurse practitioners (NPs) and physician assistants (PAs) fill some of the gaps in pri-mary care physician supply, especially in regions that have low ratios of primary care physicians to population. In California, 52% of NPs and 26% of PAs provided pri-mary care.5
The Northern and Sierra, San Joaquin Valley, and Inland Empire regions had particularly low supplies of active patient care physicians across multiple specialties. Not surprisingly, people from these counties also reported substantial difficulty in accessing care. In the Northern and Sierra region, an estimated 10% and 20% of adults, respectively, had difficulty finding primary and specialty care in 2015.6 In the Greater Bay Area, only 6% and 10% reported similar challenges. Prior analyses of the Medical Board data have documented an ongoing low physician supply in rural areas in the state.7
Demographics of California PhysiciansDeclining hours spent on patient care paralleled the aging of the physician workforce. The number of phy-sicians responding to the Medical Board’s mandatory survey who were age 60 or older increased from 24,567 in 2013 to 29,082 in 2015. Consistent with ongoing state and national trends, California physicians age 60 or older provided fewer hours of patient care than younger physi-cians, and some discontinued all patient care activities. In California, physicians over age 60 accounted for 90% of physicians who provided zero hours of patient care per week.
Gender parity in the physician workforce did not appear to drive the decline in the supply of active patient care physicians. Contrary to past concerns that the increasing number of female physicians would substantially reduce the supply of physicians providing patient care,8 similar proportions of male and female phy-sicians in California met the definition of active patient care. Compared to male physicians, female physicians were less likely to report spending 40+ hours per week on patient care, but were more likely to report spend-ing 20 to 39 hours per week. Of physicians who did not provide any patient care, the majority were male, likely because males constitute a much higher percentage of older physicians.
The proportion of active patient care physicians who were members of underrepresented minority groups was substantially lower than the state’s population, particularly Latinos and African Americans. Latino physicians comprised only 5% of the active patient care physician supply, even though 38% of California residents were Latino in 2015.9 Whereas 6% of state resi-dents reported being African American, only 3% of active
13California Physician Supply and Distribution: Headed for a Drought?
patient care physicians did. Only 9% of Californians who entered medical school during the 2017–2018 academic year were Latino and only 4% were African American.10 Substantial underrepresentation among physicians is associated with ongoing challenges in access to care for minorities, irrespective of insurance or socioeconomic status.11, 12
Practice Types Younger physicians elected group practice settings over solo practice. Nearly 80% of physicians under age 40 practiced in a group practice or Kaiser Permanente, compared to less than half of physicians over 60. This is consistent with historical and national trends. Younger physicians have gravitated toward larger practices for sev-eral benefits, including reduced call schedules, increased flexibility in working hours, and improved information technology.13
Practice type varied by specialty. Sixty percent of psy-chiatrists reported practicing in solo and “other” settings, versus 25% of pediatricians. Among the major specialty categories, psychiatrists also had the lowest percentage practicing in group practice settings (17%). Practice set-ting differences carry implications for access to care: In additional analyses from the supplemental survey, nearly three-quarters of psychiatrists in solo practice reported that none of their patients were covered by Medi-Cal.
Physician Participation in Medi-CalPhysicians were more likely to accept patients with any type of health insurance than uninsured patients. In 2015, only 50% of primary care physicians and only 57% of specialists had any uninsured patients in their practices.
Physicians were less likely to have any Medi-Cal patients in their practices than patients with Medicare or private health insurance. Sixty-two percent of pri-mary care physicians had any Medi-Cal patients in their practices, whereas 64% had Medicare patients, and 86% had privately insured patients. For specialists, the corresponding percentages were 64%, 78%, and 87%, respectively.
Patterns of acceptance of new patients were similar. Physicians were less likely to accept any new uninsured patients in their practices than they were to accept new
patients with any type of health insurance. However, they were also less likely to accept new Medi-Cal patients than to accept new patients with Medicare or private health insurance. Sixty percent of physicians accepted new Medi-Cal patients. The corresponding percentages for new Medicare patients and new patients with private health insurance were 77% and 85%, respectively.
LimitationsThis study has limitations related to the data and design. First, the data were derived from physician self-reports. The actual amount of time spent providing patient care and performing other professional activities may differ. Furthermore, the mandatory survey only asks that respon-dents report hours spent on an activity; counts are not equivalent to access. Second, due to revisions in the sur-vey instrument across years, change over time could not be assessed for several items, such as physician-reported specialty. Third, this study was limited to physicians with doctorates of medicine. Doctors of osteopathic medicine were not included. The study also did not assess whether physician capacity was extended by NPs or PAs, or broader multidisciplinary care teams that include regis-tered nurses, medical assistants, and/or other personnel. Fourth, the description of the racial/ethnic composition of the physician workforce was incomplete because more than 26% of physicians did not report their race/ethnic-ity. Fifth, generalizability of analysis of practice types and physician acceptance of Medi-Cal and uninsured patients was limited because the supplemental survey represents a small percentage (8%) of all patient care physicians. Although a quasi-random selection method was used, response rates differed by age group, with response rates of 50.2% over age 60, 27.4% for ages 40 to 60, and 14% under age 40.
Lastly, the Medical Board’s mandatory survey does not specify what constitutes “patient care.” In the survey, tele-health was listed as a separate item, although that would likely fall under the broader category of patient care. A recent study using electronic medical records found that physicians spend 50% of their time on office visits and the remainder on electronic documentation and commu-nication.14 Physicians may differ on their perceptions as to whether these latter activities constitute “patient care.” In addition, many physicians practice collaboratively with nurse practitioners or physician assistants, which may lead them to provide more “patient care” than physi-cians who see only their panel of patients.

14California Health Care Foundation
RecommendationsThe supply of physicians in California may not be able to keep pace with growth in the state’s demand for medi-cal care due to population growth and aging. As with the general population, the population of physicians is aging, and older physicians will likely continue to scale back on patient care activities. Although the future of health insurance coverage remains unclear, coverage does not confer access without a health care workforce to provide care. Policymakers, providers, and plans should invest in strategies that both bolster the number of physi-cians and extend their services in innovative ways.
To address the challenges in the supply of physicians in California, the authors recommend the following:
$$ Increase funding to expand undergraduate medi-cal education (i.e., medical school), particularly in underserved areas. California has a higher ratio of medical school applicants to medical school admis-sion slots than most other states.15 Increasing the number of medical students could help increase the supply of physicians because over 60% of California medical students remain in the state.16 Several new medical schools have opened in recent years and several more are planned. The combined efforts of these schools would help to boost the total supply of physicians. Increased funding should be targeted particularly for recruiting students who are interested in caring for underserved populations and who are interested in practicing in specialties that are projected to experience shortages, such as family medicine, general internal medicine, general pediat-rics, and psychiatry.17, 18
$$ Increase funding to expand graduate medical edu-cation (i.e., residency and fellowship programs), particularly in specialties with projected shortages. Residency programs are another important source of physicians; 70% of physicians who completed resi-dency in California remain in the state to practice.19 However, in 2016, California ranked 31st among the 50 states with respect to the ratio of residents and fellows per 100,000 population. Also, California ranked 35th in the rate of growth of residents and fellows between 2006 and 2016. Despite increases in federal and state support for primary care train-ing, graduate medical education in California
continues to be weighted toward specialty fellow-ships.20 Investment in residency programs should be targeted to primary care specialties, psychiatry, and other specialties in which shortages are projected.21, 22 The state budget for 2017–18 and the governor’s budget proposal for 2018 –19 included $33 million for primary care residency programs. The state will need to maintain funding for primary care residency programs at this level to meet the state’s needs and should explore options for obtaining funding from other sources, such as Medi-Cal and Medicare.
$$ Increase funding for financial incentives to encour-age both primary care and specialty physicians to practice in underserved areas. Scholarship and loan repayment programs have demonstrated success in both recruitment and retention of primary care physi-cians in underserved areas, particularly rural areas.23
$$ Support opportunities for international medical graduates to practice in underserved areas of the state. Maintaining policies and mechanisms to sup-port international medical graduates (IMGs) is critical for meeting the health care needs of California’s population. Nationwide, IMGs made up 18.5% of generalist physicians in rural areas, and a higher per-centage practice in rural Health Professions Shortage Areas.24 In California, IMGs constituted 21.8% of primary care physicians in nonmetropolitan counties. Program administrators have reported that recent shifts in immigration policy have raised challenges in hiring, recruiting, and retaining IMGs for residency and fellowship positions.25 Policymakers should con-tinue advocacy for visa programs that allow IMGs to train and remain in the state.26
$$ Increase investments in programs that address diversity of the physician workforce. Underrepresentation in medical schools is attrib-uted to multiple factors, including inequities in K–12 education, a lack of support and mentorship in col-leges, and inadequate prioritization and institutional commitment to diversity.27 Multiple programs across the pipeline, from K–12 programming, community colleges, undergraduate recruitment, post-baccalau-reate, and undergraduate medical education have been shown to increase both diversity and the num-ber of physicians practicing in underserved areas.28

15California Physician Supply and Distribution: Headed for a Drought?
$$ Invest in technologies that can maximize scarce physician resources, especially for rural areas. Greater investment in training and technology to expand telehealth via electronic advice refer-rals, virtual consults, and care navigators / primary care liaisons would expand access to primary and specialty care.29 For specialty care in particular, reim-bursement for videoconferencing, mobile therapy technologies, and peer providers would alleviate a lack of specialists.
$$ Provide training, support, and incentives for team-based care. Care teams that consist of several types of personnel — including nurse practitioners, physician assistants, and community-based sup-port staff such as care coordinators and community health workers — can expand the number of patients that primary care physicians can serve. Primary care physicians should receive training on both team management (leadership of other health care per-sonnel) and panel management (population health management). Reimbursement mechanisms should support care delivered by teams that include several types of members. To facilitate adoption of these models, community health centers and other pro-viders who have experience in team models could facilitate learning collaboratives with private provid-ers. These efforts can also be adapted for specialty care; for example, physician assistants can extend the practices of general surgeons by providing initial evaluations, assistance in the operating room, and follow-up care.30

16California Health Care Foundation
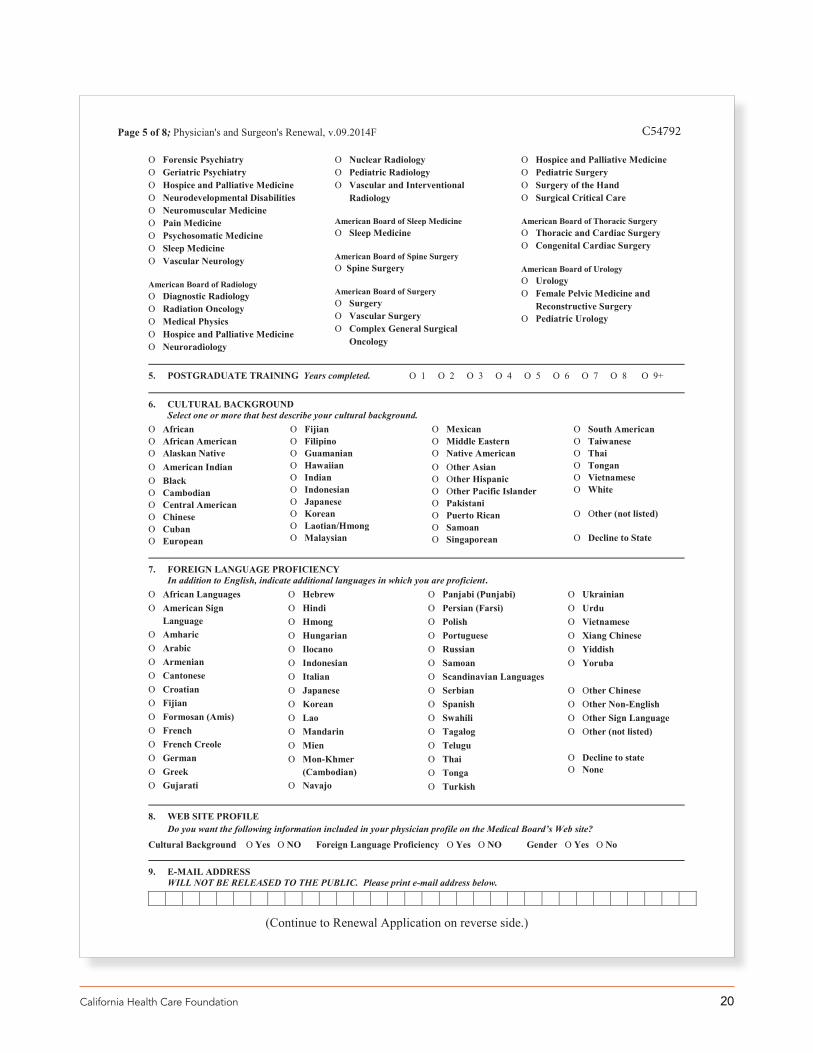
The Medical Board of California requires physicians to reapply for MD licenses every two years. Physicians undergoing relicensure are required to complete a man-datory survey, which includes questions regarding their demographics, practice location, professional activities, primary and secondary specialty, board certifications, and whether they have completed residency and/or fellowship training (see Appendix B for the mandatory survey instrument).
In addition to the survey for all re-applicants, the Medical Board, in partnership with the University of California, San Francisco, also administered a voluntary supple-mental survey to a sample of physicians who were due for renewal in June and December 2015. Because the physicians were selected by birth month rather than any practice-related characteristics, the sample approximates a random sample. Physicians were eligible for inclusion in analyses of responses to the supplemental survey if they had an active California license, practiced in California, had completed training, and provided patient care for at least 20 hours per week. These inclusion criteria ensured that the analysis focused on physicians whose primary professional activity was providing patient care to Californians (see Appendix C for the supplemental survey instrument). Among physicians who met the eli-gibility criteria, the response rate for the supplemental survey was 63% in 2013 and 22% in 2015.
The lower response rate in 2015 was likely due to a change in the mechanism by which the Medical Board administered the online version of the supplemental sur-vey. In 2013, the supplemental survey was embedded in the same software platform as the licensure renewal form and the mandatory survey, making it easy for phy-sicians to complete the supplemental survey with little additional effort. In 2015, physicians had to first submit the online renewal applications and mandatory survey responses and then go to a different software platform and re-enter some identifying information before com-pleting the supplemental survey.
State Physician SupplyAssessing geographic distribution and supply. To assess geographic distribution, the study used respon-dent practice zip codes to count the number of physicians in the state and in each California county. If no practice zip code was available (3%), the zip code for the respon-dent’s primary mailing address on file at the Medical Board was used. Responses were aggregated by region (see Appendix D for California counties in regions). To calculate the supply of physicians per capita, the study used estimates of the state and county populations in 2015 from the US Census Bureau’s American Community Survey.
Physician ActivitiesDescribing physician activities. The survey asked physi-cians to report the number of hours spent per week on the following activities: patient care, research, teaching, administration, telemedicine, other. Hours devoted to each activity were categorized as zero and then increas-ing 10-hour increments, up to 40 or more hours per week. Hours spent on patient care by age and gender were examined to assess whether there were age or gen-der differences in hours spent on patient care.
Enumerating active patient care physicians. The American Medical Association’s criteria were used to identify “active patient care” physicians as those who reported spending 20 or more hours per week on patient care.
Specialty DistributionDetermining physician specialty. The survey asked physicians to report primary and secondary specialties, as well as board certifications. Physician specialty was determined by the primary specialty; if no primary was reported, then secondary specialties were used to deter-mine specialty. If no primary or secondary specialty was reported, then reported board certifications were used to identify specialty. Among active patient care physi-cians, 0.4% were missing specialty information under this algorithm.
Appendix A. Methodology

17California Physician Supply and Distribution: Headed for a Drought?
Identifying primary care physicians. The following spe-cialties were categorized as primary care: family medicine (including general practice), general pediatrics, and gen-eral internal medicine (including geriatric medicine).
Categorizing physician specialty. The study also created a 10-category measure to describe primary care and spe-cialty distribution in greater depth. The 10 categories were family medicine, general internal medicine, pediatrics, medical specialty, facility-based care, surgical specialty, psychiatry, obstetrics/gynecology, general surgery, and other. Facility-based care included specialties generally practiced by physicians employed in or by health care facilities, including emergency medicine, anesthesiology, radiology, and pathology. (See Appendix F for lists of the specialties included in each category.)
Demographic CharacteristicsThe California Medical Board retains data on physician age and gender for all licensed physicians, indepen-dent of the mandatory survey. The mandatory survey asked respondents to identify their race and ethnic-ity. The self-reported responses were categorized as follows: White, African American, Latino, Middle Eastern, American Indian / Alaska Native, Asian Not Underrepresented, Asian Underrepresented / Hawaiian / Pacific Islander, Multiracial/Ethnic, and Other. Asian Not Underrepresented includes Asian subgroups in which the percentage of physicians meets or exceeds the popu-lation percentage. (See Appendix E for detailed race/ethnicity response items.)
Practice TypeThe supplemental survey included a question that asked physicians to report the organizational setting in which they practiced. Practice types were categorized as fol-lows: solo practice, small medical partnership (2 to 9 physicians), group practice (10 to 49 physicians), large group practice including academia (50 or more physi-cians), Kaiser Permanente, community health center / public clinic, VA or military, or other (see Appendix C for supplemental survey instrument).
Change Over TimeBecause the Medical Board of California administers the mandatory survey every other year in conjunction with licensure renewal, responses to the 2013 survey were analyzed and compared to 2015 responses for items that remained consistent over time. For this study, hours spent on the different activities in medicine and the total num-ber of active patient care physicians were compared. In 2015, the survey instrument included additional medical specialty items as well as board certifications, allowing more physicians to identify themselves as practicing in particular medical specialties. The survey change pre-vented comparison of physician supply in primary care versus medical specialties across years. Trends in phy-sician race/ethnicity could not be assessed because response options for the question about race/ethnicity changed.

18California Health Care Foundation
Appendix B. California Medical Board Mandatory Survey Instrument
Page 3 of 8; Physician's and Surgeon's Renewal, v.09.2014F C54792
I. Physician SurveyAre you retired? O Yes O No
1. ACTIVITIES IN MEDICINE (Mandatory) 2. PRACTICE LOCATIONS (Mandatory)Fill in one circle on each line. If you have hours for Patient Care, enter the primary and secondary
practice location(s).Primary practice location (U.S. Only) Secondary practice location (CA Only)
Hours None 1-9 10-19 20-29 30-39 40+ Zip Code County Zip Code County
Patient Care O O O O O O
Telehealth O O O O O O
Administration O O O O O O
Research O O O O O O
Teaching O O O O O O
Other O O O O O O
3. CURRENT TRAINING STATUS (Mandatory) O Residency O Fellow O Not in Training
4a. AREAS OF PRACTICE (Mandatory) Please mark one primary (P) practice area and all secondary (S) practice areas.
P S P S P SO O Aerospace Medicine O O Allergy and Immunology O O Anesthesiology O O Cardiology O O Colon and Rectal Surgery O O Complementary & Alternative
Medicine O O Cosmetic Surgery O O Critical Care O O Dermatology O O Emergency Medicine O O Endocrinology O O Epilepsy O O Facial, Plastic & Reconstructive
SurgeryO O Family Medicine O O Gastroenterology O O General Practice O O General Surgery O O Geriatric Medicine O O Hematology
O O Infectious Disease O O Internal Medicine O O Medical Genetics O O Neonatal-Perinatal Medicine O O Nephrology O O Neurodevelopmental Disabilities O O Neurological Surgery O O Neurology with Special
Qualification in Child Neurology O O Neurology O O Nuclear Medicine O O Obstetrics and Gynecology O O Occupational Medicine O O Oncology O O Ophthamology O O Orthopedic Surgery O O Otolaryngology O O Pain Medicine O O Pathology O O Pediatrics
O O Physical Medicine and Rehabilitation
O O Plastic Surgery O O Psychiatry O O Psychosomatic Medicine O O Public Health and General
Preventive Medicine O O Pulmonary O O Radiation Oncology O O Radiologic Physics O O Radiology O O Rheumatology O O Sleep Medicine O O Spine Surgery O O Sports Medicine O O Surgical Oncology O O Thoracic Surgery O O Urology O O Vascular Surgery
O O Other – Not Listed
4b. BOARD CERTIFICATIONS (Mandatory) Please mark any Board Certifications that you may have. If you have no current certifications, mark here: O None
American Board of Allergy and Immunology O Allergy and Immunology
American Board of Anesthesiology O Anesthesiology O Critical Care Medicine O Hospice and Palliative Medicine O Pain Medicine
O Pediatric Anesthesiology O Sleep Medicine
01 Alameda 16 Kings 31 Placer 46 Sierra 02 Alpine 17 Lake 32 Plumas 47 Siskiyou03 Amador 18 Lassen 33 Riverside 48 Solano04 Butte 19 Los Angeles 34 Sacramento 49 Sonoma05 Calaveras 20 Madera 35 San Benito 50 Stanislaus06 Colusa 21 Marin 36 San Bernardino 51 Sutter07 Contra Costa 22 Mariposa 37 San Diego 52 Tehama08 Del Norte 23 Mendocino 38 San Francisco 53 Trinity09 El Dorado 24 Merced 39 San Joaquin 54 Tulare10 Fresno 25 Modoc 40 San Luis Obispo 55 Tuolumne11 Glenn 26 Mono 41 San Mateo 56 Ventura12 Humboldt 27 Monterey 42 Santa Barbara 57 Yolo13 Imperial 28 Napa 43 Santa Clara 58 Yuba14 Inyo 29 Nevada 44 Santa Cruz15 Kern 30 Orange 45 Shasta 98 Out of State
CODES (CA County / Out of State)
(Continued on reverse side.)

19California Physician Supply and Distribution: Headed for a Drought?
Page 4 of 8; Physician's and Surgeon's Renewal, v.09.2014F C54792
American Board of Colon and Rectal Surgery O Colon and Rectal Surgery
American Board of Dermatology O Dermatology O Clinical and Laboratory
Dermatological Immunology O Dermatopathology O Pediatric Dermatology
American Board of Emergency Medicine O Emergency Medicine O Critical Care Medicine O Emergency Medical Services O Hospice and Palliative Medicine O Medical Toxicology O Pediatric Emergency Medicine O Sports Medicine O Undersea and Hyperbaric Medicine
American Board of Facial Plastic & Reconstructive Surgery O Facial Plastic & Reconstructive
Surgery
American Board of Family Medicine O Family Medicine O Adolescent Medicine O Geriatric Medicine O Hospice and Palliative Medicine O Sleep Medicine O Sports Medicine
American Board of Internal Medicine O Internal Medicine O Adolescent Medicine O Advanced Heart Failure and
Transplant Cardiology O Cardiovascular Disease O Clinical Cardiac Electrophysiology O Critical Care Medicine O Endocrinology, Diabetes and
Metabolism O Gastroenterology O Geriatric Medicine O Hematology O Hospice and Palliative Medicine O Infectious Disease O Interventional Cardiology O Medical Oncology O Nephrology O Pulmonary Disease O Rheumatology O Sleep Medicine O Sports Medicine O Transplant Hepatology
American Board of Medical Genetics O Clinical Biochemical Genetics
O Clinical Cytogenetics O Clinical Genetics (MD) O Clinical Molecular Genetics O Medical Biochemical Genetics O Molecular Genetic Pathology
American Board of Neurological Surgery O Neurological Surgery
American Board of Nuclear Medicine O Nuclear Medicine
American Board of Obstetrics and Gynecology O Obstetrics and Gynecology O Critical Care Medicine O Female Pelvic Medicine and
Reconstructive Surgery O Gynecologic Oncology O Hospice and Palliative Medicine O Maternal and Fetal Medicine O Reproductive
Endocrinology/Infertility
American Board of Ophthalmology O Ophthalmology
American Board of Orthopaedic Surgery O Orthopaedic Surgery O Orthopaedic Sports Medicine O Surgery of the Hand
American Board of Otolaryngology O Otolaryngology O Neurotology O Pediatric Otolaryngology O Plastic Surgery Within Head/Neck O Sleep Medicine
American Board of Pain Medicine O Pain Medicine
American Board of Pathology O Pathology – Anatomic/Pathology-
Clinical O Pathology – Anatomic O Pathology – Clinical O Blood Banking/Transfusion
Medicine O Clinical Informatics O Cytopathology O Dermatopathology O Neuropathology O Pathology – Chemical O Pathology – Forensic O Pathology – Hematology O Pathology – Medical Microbiology O Pathology – Molecular Genetic O Pathology – Pediatric
American Board of Pediatrics
O Pediatrics O Adolescent Medicine O Child Abuse Pediatrics O Developmental-Behavioral
Pediatrics O Hospice and Palliative Medicine O Medical Toxicology O Neonatal-Perinatal Medicine O Neurodevelopmental Disabilities O Pediatric Cardiology O Pediatric Critical Care Medicine O Pediatric Emergency Medicine O Pediatric Endocrinology O Pediatric Gastroenterology O Pediatric Hematology-Oncology O Pediatric Infectious Diseases O Pediatric Nephrology O Pediatric Pulmonology O Pediatric Rheumatology O Pediatric Transplant Hepatology O Sleep Medicine O Sports Medicine
American Board of Physical Medicine and Rehabilitation O Physical Medicine and
Rehabilitation O Brain Injury Medicine O Hospice and Palliative Medicine O Neuromuscular Medicine O Pain Medicine O Pediatric Rehabilitation Medicine O Spinal Cord Injury Medicine O Sports Medicine
American Board of Plastic Surgery O Plastic Surgery O Plastic Surgery Within Head/Neck O Surgery of the Hand
American Board of Preventive Medicine O Aerospace Medicine O Occupational Medicine O Public Health and General
Preventive Medicine O Clinical Informatics O Medical Toxicology O Undersea and Hyperbaric Medicine
American Board of Psychiatry and Neurology O Psychiatry O Neurology O Neurology with Special
Qualification in Child Neurology O Addiction Psychiatry O Brain Injury Medicine O Child and Adolescent Psychiatry O Clinical Neurophysiology O Epilepsy
(Continued on Page 5.)
20California Health Care Foundation
Page 5 of 8; Physician's and Surgeon's Renewal, v.09.2014F C54792
O Forensic Psychiatry O Geriatric Psychiatry O Hospice and Palliative Medicine O Neurodevelopmental Disabilities O Neuromuscular Medicine O Pain Medicine O Psychosomatic Medicine O Sleep Medicine O Vascular Neurology
American Board of Radiology O Diagnostic Radiology O Radiation Oncology O Medical Physics O Hospice and Palliative Medicine O Neuroradiology
O Nuclear Radiology O Pediatric Radiology O Vascular and Interventional
Radiology
American Board of Sleep Medicine O Sleep Medicine
American Board of Spine Surgery O Spine Surgery
American Board of Surgery O Surgery O Vascular Surgery O Complex General Surgical
Oncology
O Hospice and Palliative Medicine O Pediatric Surgery O Surgery of the Hand O Surgical Critical Care
American Board of Thoracic Surgery O Thoracic and Cardiac Surgery O Congenital Cardiac Surgery
American Board of Urology O Urology O Female Pelvic Medicine and
Reconstructive Surgery O Pediatric Urology
5. POSTGRADUATE TRAINING Years completed.
6. CULTURAL BACKGROUNDSelect one or more that best describe your cultural background.
O African O African American O Alaskan Native O American Indian O Black O Cambodian O Central American O Chinese O Cuban O European
O Fijian O Filipino O Guamanian O Hawaiian O Indian O Indonesian O Japanese O Korean O Laotian/Hmong O Malaysian
O Mexican O Middle Eastern O Native American O Other Asian O Other Hispanic O Other Pacific Islander O Pakistani O Puerto Rican O Samoan O Singaporean
O South American O Taiwanese O Thai O Tongan O Vietnamese O White
O Other (not listed)
O Decline to State
7. FOREIGN LANGUAGE PROFICIENCYIn addition to English, indicate additional languages in which you are proficient.
O African Languages O American Sign
Language O Amharic O Arabic O Armenian O Cantonese O Croatian O Fijian O Formosan (Amis) O French O French Creole O German O Greek O Gujarati
O Hebrew O Hindi O Hmong O Hungarian O Ilocano O Indonesian O Italian O Japanese O Korean O Lao O Mandarin O Mien O Mon-Khmer
(Cambodian) O Navajo
O Panjabi (Punjabi) O Persian (Farsi) O Polish O Portuguese O Russian O Samoan O Scandinavian Languages O Serbian O Spanish O Swahili O Tagalog O Telugu O Thai O Tonga O Turkish
O Ukrainian O Urdu O Vietnamese O Xiang Chinese O Yiddish O Yoruba
O Other Chinese O Other Non-English O Other Sign Language O Other (not listed)
O Decline to state O None
8. WEB SITE PROFILEDo you want the following information included in your physician profile on the Medical Board’s Web site?
Cultural Background O Yes O NO Foreign Language Proficiency O Yes O NO Gender O Yes O No
9. E-MAIL ADDRESSWILL NOT BE RELEASED TO THE PUBLIC. Please print e-mail address below.
O 1 O 2 O 3 O 4 O 5 O 6 O 7 O 8 O 9+
(Continue to Renewal Application on reverse side.)
21California Physician Supply and Distribution: Headed for a Drought?
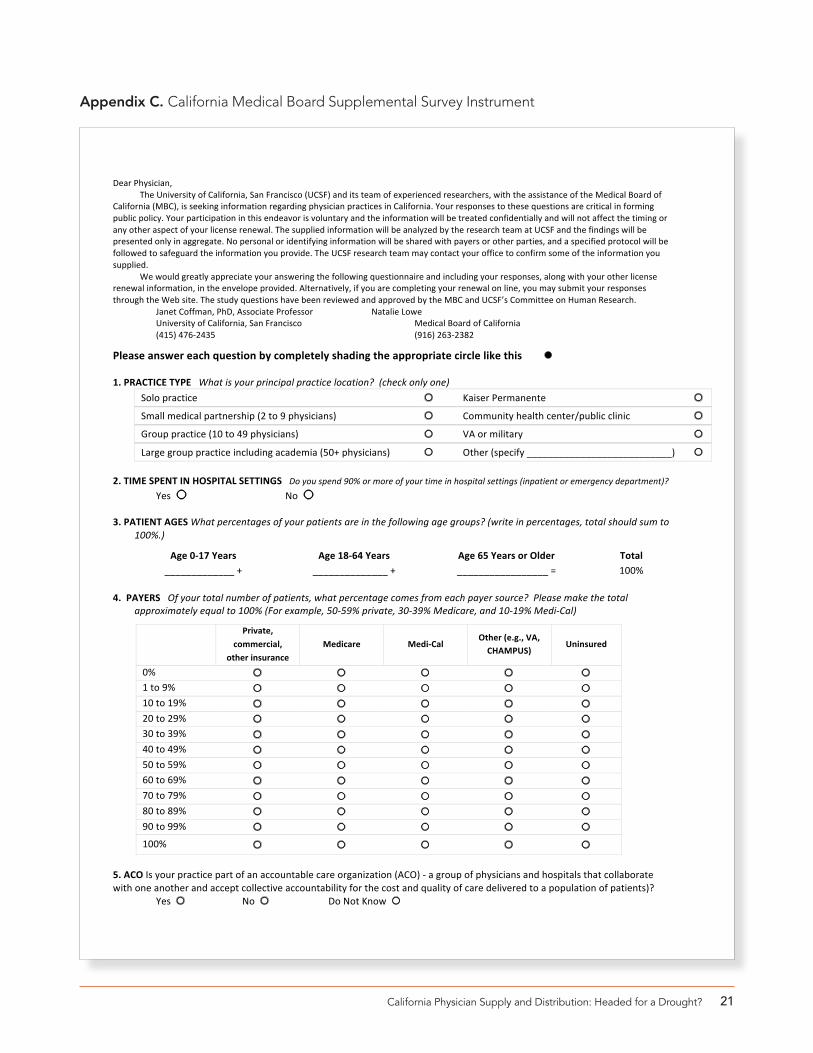
Appendix C. California Medical Board Supplemental Survey Instrument
DearPhysician,TheUniversityofCalifornia,SanFrancisco(UCSF)anditsteamofexperiencedresearchers,withtheassistanceoftheMedicalBoardof
California(MBC),isseekinginformationregardingphysicianpracticesinCalifornia.Yourresponsestothesequestionsarecriticalinformingpublicpolicy.Yourparticipationinthisendeavorisvoluntaryandtheinformationwillbetreatedconfidentiallyandwillnotaffectthetimingoranyotheraspectofyourlicenserenewal.ThesuppliedinformationwillbeanalyzedbytheresearchteamatUCSFandthefindingswillbepresentedonlyinaggregate.Nopersonaloridentifyinginformationwillbesharedwithpayersorotherparties,andaspecifiedprotocolwillbefollowedtosafeguardtheinformationyouprovide.TheUCSFresearchteammaycontactyourofficetoconfirmsomeoftheinformationyousupplied.
Wewouldgreatlyappreciateyouransweringthefollowingquestionnaireandincludingyourresponses,alongwithyourotherlicenserenewalinformation,intheenvelopeprovided.Alternatively,ifyouarecompletingyourrenewalonline,youmaysubmityourresponsesthroughtheWebsite.ThestudyquestionshavebeenreviewedandapprovedbytheMBCandUCSF’sCommitteeonHumanResearch.
JanetCoffman,PhD,AssociateProfessor NatalieLowe UniversityofCalifornia,SanFrancisco MedicalBoardofCalifornia (415)476-2435 (916)263-2382
Pleaseanswereachquestionbycompletelyshadingtheappropriatecirclelikethis l 1.PRACTICETYPEWhatisyourprincipalpracticelocation?(checkonlyone)
Solopractice ¡ KaiserPermanente ¡
Smallmedicalpartnership(2to9physicians) ¡ Communityhealthcenter/publicclinic ¡
Grouppractice(10to49physicians) ¡ VAormilitary ¡
Largegrouppracticeincludingacademia(50+physicians) ¡ Other(specify___________________________) ¡ 2.TIMESPENTINHOSPITALSETTINGSDoyouspend90%ormoreofyourtimeinhospitalsettings(inpatientoremergencydepartment)? Yes¡ No¡ 3.PATIENTAGESWhatpercentagesofyourpatientsareinthefollowingagegroups?(writeinpercentages,totalshouldsumto
100%.)
Age0-17Years Age18-64Years Age65YearsorOlder Total_____________+ ______________+ _________________= 100%
4.PAYERSOfyourtotalnumberofpatients,whatpercentagecomesfromeachpayersource?Pleasemakethetotalapproximatelyequalto100%(Forexample,50-59%private,30-39%Medicare,and10-19%Medi-Cal)
Private,
commercial,otherinsurance
Medicare Medi-CalOther(e.g.,VA,
CHAMPUS)Uninsured
0% ¡ ¡ ¡ ¡ ¡ 1to9% ¡ ¡ ¡ ¡ ¡ 10to19% ¡ ¡ ¡ ¡ ¡ 20to29% ¡ ¡ ¡ ¡ ¡ 30to39% ¡ ¡ ¡ ¡ ¡ 40to49% ¡ ¡ ¡ ¡ ¡ 50to59% ¡ ¡ ¡ ¡ ¡ 60to69% ¡ ¡ ¡ ¡ ¡ 70to79% ¡ ¡ ¡ ¡ ¡ 80to89% ¡ ¡ ¡ ¡ ¡ 90to99% ¡ ¡ ¡ ¡ ¡ 100% ¡ ¡ ¡ ¡ ¡
5.ACOIsyourpracticepartofanaccountablecareorganization(ACO)-agroupofphysiciansandhospitalsthatcollaboratewithoneanotherandacceptcollectiveaccountabilityforthecostandqualityofcaredeliveredtoapopulationofpatients)?
Yes¡ No¡ DoNotKnow¡

22California Health Care Foundation
6.NEWPATIENTS a.Areyoucurrentlyacceptingnewpatientsinyourpracticewithprivateinsurance? Yes¡ No¡ b.AreyoucurrentlyacceptingnewMedicarepatientsinyourpractice?
Yes¡ No¡ c.Areyoucurrentlyacceptingnewfee-for-serviceMedi-Calpatientsinyourpractice?
Yes¡ No¡ d.AreyoucurrentlyacceptingnewMedi-Calmanagedcare(HMO)patientsinyourpractice?
Yes¡ No¡ e.Areyoucurrentlyacceptinganynewuninsuredpatientsinyourpracticewhoareunabletopay?
Yes¡ No¡ f.Areyouacashonly(no3rdpartyinsurance)practice?
Yes¡ No¡
7.MEDI-CALPAYMENTRATESWhatimpact,didanincreaseinMedi-Calpaymentratesforprimarycarephysiciansin2014haveonyourwillingnesstocareforMedi-Calpatients?
a. IncreasedMedi-Calparticipation ¡ b. NochangeinMedi-Calparticipation ¡ c.DecreasedMedi-Calparticipation ¡
8.REASONSFORLIMITINGMEDI-CALPATIENTSHowimportantiseachfactorbelowasareasonyoudonotacceptorlimitthenumberofMedi-Calpatientsinyourpractice?
REASONS Veryimportant
Moderatelyimportant
Alittlebitimportant
Notimportant
AcceptallMedi-Calpatients
a.AdministrativehassleofMedi-Cal ¡ ¡ ¡ ¡ ¡b.DelaysinMedi-Calpayment ¡ ¡ ¡ ¡ c.AmountofMedi-Calpayment ¡ ¡ ¡ ¡ d.Medi-Calpatientshavecomplexneeds ¡ ¡ ¡ ¡ e.Medi-Calpatientsaredisruptiveinthewaitingroom ¡ ¡ ¡ ¡ f.Practicealreadyhasenoughpatients ¡ ¡ ¡ ¡ 9.REFERRALS-PRIVATEINSURANCEDuringthelast12months,howoftendidyouhavedifficultyobtainingthefollowingservicesforyourpatientswithprivateinsurance?
PRIVATEINSURANCE Hardlyever Occasionally Sometimes Frequently Almostalwaysa.Referralstospecialists ¡ ¡ ¡ ¡ ¡ b.Diagnosticimagingservices ¡ ¡ ¡ ¡ ¡ c.Referralsforoutpatientmentalhealthservices ¡ ¡ ¡ ¡ ¡
10.REFERRALS-MEDI-CALDuringthelast12months,howoftendidyouhavedifficultyobtainingthefollowingservicesforyourpatientsonMedi-Cal?MEDI-CAL Hardlyever Occasionally Sometimes Frequently Almostalwaysa.Referralstospecialists ¡ ¡ ¡ ¡ ¡ b.Diagnosticimagingservices ¡ ¡ ¡ ¡ ¡ c.Referralsforoutpatientmentalhealthservices ¡ ¡ ¡ ¡ ¡

23California Physician Supply and Distribution: Headed for a Drought?
COUNTIES
Central Coast Monterey, San Benito, San Luis Obispo, Santa Barbara, Santa Cruz, Ventura
Greater Bay Area Alameda, Contra Costa, Marin, Napa, San Francisco, San Mateo, Santa Clara, Solano, Sonoma
Inland Empire Riverside, San Bernardino
Los Angeles County Los Angeles
Northern and Sierra Alpine, Amador, Butte, Calaveras, Colusa, Del Norte, Glenn, Humboldt, Inyo, Lake, Lassen, Mariposa, Mendocino, Modoc, Mono, Nevada, Plumas, Shasta, Sierra, Siskiyou, Sutter, Tehama, Trinity, Tuolumne, Yuba
Orange County Orange
Sacramento Area El Dorado, Placer, Sacramento, Yolo
San Diego Area Imperial, San Diego
San Joaquin Valley Fresno, Kern, Kings, Madera, Merced, San Joaquin, Stanislaus, Tulare
Appendix D. California Counties Included in Regions
CENTRALCOAST
SAN JOAQUINVALLEY
ORANGE COUNTY
LOS ANGELES COUNTY
GREATERBAY AREA
SACRAMENTOAREA
NORTHERNAND SIERRA
NORTHERNAND SIERRA
INLANDEMPIRE
SAN DIEGO AREA

24California Health Care Foundation
WhiteWhiteEuropean
African AmericanAfricanAfrican AmericanBlack
LatinoCentral AmericanCubanMexicanPuerto RicanSouth AmericanOther Hispanic
Middle Eastern
American Indian / Alaska NativeAmerican IndianNative AmericanAlaska Native
Multiracial/Ethnic
Other
Appendix E. Physician Race/Ethnicity Categories

25California Physician Supply and Distribution: Headed for a Drought?
Family MedicineFamily MedicineGeneral Practice
General Internal MedicineInternal MedicineGeriatrics
Pediatrics
Obstetrics and Gynecology
PsychiatryPsychiatryPsychosomatic Medicine
General Surgery
Facility-Based SpecialtiesAnesthesiologyEmergency MedicinePathologyRadiology
Other SpecialtiesAerospace MedicineComplementary and Alternative MedicinePain MedicinePublic Health and General Preventive MedicineOther Specialty
Medical SpecialtiesAllergy and ImmunologyCardiologyCritical CareDermatologyEndocrinologyEpilepsyGastroenterologyHematologyHospice and Palliative MedicineInfectious DiseaseMedical GeneticsNeonatal-Perinatal MedicineNephrologyNeurologyOccupational MedicineOncologyPulmonologyRheumatologySleep Medicine
Surgical SpecialtiesColon and Rectal SurgeryCosmetic SurgeryFacial/Plastic/Reconstructive SurgeryNeurological SurgeryOphthalmologyOrthopedic SurgeryOtolaryngologyPediatric SurgeryPlastic SurgerySpine SurgerySports MedicineSurgery of the HandSurgical Critical CareSurgical OncologyThoracic SurgeryUrologyVascular Surgery
Appendix F. Identifying and Categorizing Physician Specialty

26California Health Care Foundation
Central Coast
Greater Bay Area
Inland Empire
Los Angeles County
Northern and Sierra
Orange County
Sacramento Area
San Diego Area
San Joaquin Valley
Unknown Region California
Primary Care
Family Medicine 591 1,439 652 1,768 381 697 471 674 728 35 7,436
General Internal Medicine
367 2,287 602 2,050 194 600 486 698 579 32 7,895
Pediatrics 203 1,179 295 1,078 85 352 265 362 331 16 4,166
Specialty Care
Obstetrics and Gynecology
160 849 214 812 64 285 184 255 255 15 3,093
Psychiatry 232 1,231 275 1,027 77 221 213 368 239 18 3,901
General Surgery 79 345 135 380 68 113 100 123 142 6 1,491
Facility-Based Specialties
603 2,090 792 2,953 394 934 820 1,141 740 57 11,343
Medical Specialties 567 2,709 747 3,179 211 948 642 1,001 697 48 10,749
Surgical Specialty 384 1,835 504 2,118 193 693 460 757 431 40 7,415
Other Specialty 151 700 220 750 57 241 157 263 196 7 2,742
Unknown Specialty 45 206 82 304 35 77 57 66 91 2 965
Physician Supply
Total MDs 3,382 15,689 4,518 16,419 1,759 5,161 3,855 5,708 4,429 276 61,196
Region Population (in millions)
2.3 7.7 4.5 10.2 1.4 3.2 2.3 3.5 4.2 39.1
Total MDs/100K 144.3 205.1 100.6 161.4 125.0 162.8 169.5 164.0 106.6 156.3
$$ Primary Care 49.5 64.1 34.5 51.3 46.9 52.0 53.7 49.8 39.4 49.8
$$ Specialist 92.9 138.2 64.3 110.3 75.6 108.4 113.3 112.3 65.0 104.1
Source: Analysis of Medical Board of California data by the Philip R. Lee Institute for Health Policy Studies, University of California, San Francisco.
Appendix G. Supply of Active Patient Care Physicians in 10 Major Categories of Specialties by Region, 2015

27California Physician Supply and Distribution: Headed for a Drought?
Endnotes 1. Total Estimated and Projected Population for California: July 1,
2010 to July 1, 2060 in 1-Year Increments, State of California Department of Finance, www.dof.ca.gov.
2. “Hospitalists: A Growing Part of the Primary Care Workforce,” Association of American Medical Colleges, www.aamc.org.
3. “California Maps: How Many Primary Care and Specialist Physicians Are in Your County?” California Health Care Foundation, August 2017, www.chcf.org.
4. “Target Participants” in The Mini Grants Program Grant Guide for Fiscal Year 2017–18, Office of Statewide Health Planning and Development, 2018, www.oshpd.ca.gov (PDF).
5. Janet Coffman, Igor Geyn, and Kristine Himmerick, California’s Primary Care Workforce: Current Supply, Characteristics, and Pipeline of Trainees, UCSF Healthforce Center, February 17, 2017, healthforce.ucsf.edu (PDF).
6. “AskCHIS,” University of California, Los Angeles, accessed March 2017, healthpolicy.ucla.edu.
7. Craig Paxton, California Physicians: Surplus or Scarcity? California Health Care Foundation, March 2014, www.chcf.org (PDF).
8. Lindsay Hedden et al, “The Implications of the Feminization of the Primary Care Physician Workforce on Service Supply: A Systematic Review,” Human Resources for Health 12, no. 32 (June 4, 2014), doi.org:10.1186/1478-4491-12-32.
9. “Demographic and Housing Estimates,” US Census Bureau, accessed January 2017, census.gov.
10. Table A-11: Matriculants to US Medical Schools by Race/Ethnicity and State of Legal Residence, 2017 – 2018, American Association of Medical Colleges, November 21, 2017, www.aamc.org (PDF).
11. Lyndonna Marrast, Leah Zallman, and Steffie Woolhandler, “Minority Physicians’ Role in the Care of Underserved Patients: Diversifying the Physician Workforce May Be Key in Addressing Health Disparities,” JAMA Internal Medicine 174, no. 2 (February 2014): 289–91, doi:10.1001/jamainternmed.2013.12756.
12. Imam M. Xierali and Mark A. Nivet, “The Racial and Ethnic Composition and Distribution of Primary Care Physicians,” Journal of Health Care for the Poor and Underserved. 29, no. 1 (February 2018): 556–70, doi:10.1353/hpu.2018.0036.
13. Hoangmai H. Pham and Paul B. Ginsburg, “Unhealthy Trends: The Future Of Physician Services,” Health Affairs, 26, no. 6 (November/December 2007): 1586–98, doi:10.1377/hlthaff.26.6.1586.
14. Ming Tai-Seale et al, “Electronic Health Record Logs Indicate That Physicians Split Time Evenly Between Seeing Patients and Desktop Medicine,” Health Affairs 36, no. 4 (April 2017): 655–62, doi:10.1377/hlthaff.2016.0811.
15. Table A-5: Applicants to US Medical Schools by In or Out-of-State Matriculation Status, 2017– 2018. American Association of Medical Colleges, November 29, 2017, www.aamc.org (PDF)
16. “2017 State Physician Workforce Data Book,” Association of American Medical Colleges, www.aamc.org.
17. Janet Coffman, Timothy Bates, Igor Geyn, and Joanne Spetz, California’s Current and Future Behavioral Health Workforce Needs, UCSF Healthforce Center, February 12, 2018, healthforce.ucsf.edu.
18. Joanne Spetz, Janet Coffman, and Igor Geyn, California’s Primary Care Workforce: Forecasted Supply, Demand, and Pipeline of Trainees, 2016 – 2030, UCSF Healthforce Center, August 15, 2017, healthforce.ucsf.edu.
19. “2017 State Physician Workforce Data Book,” Association of American Medical Colleges, www.aamc.org.
20. Anastasia J. Coutinho et al., “Changes in Primary Care Graduate Medical Education Are Not Correlated with Indicators of Need: Are States Missing an Opportunity to Strengthen Their Primary Care Workforce?,” Academic Medicine: Journal of the Association of American Medical Colleges, 92, no. 9 (September 2017), doi:10.1097/ACM.0000000000001539.
21. Coffman et al., California’s Current and Future Behavorial Health Workforce Needs.
22. Spetz, Coffman, and Geyn, California’s Primary Care Workforce.
23. Ashley Goodfellow et al, “Predictors of Primary Care Physician Practice Location in Urban Underserved or Rural Areas in the United States: A Systematic Literature Review,” Academic Medicine 91, no. 9 (September 2016): 1313–21, doi:10.1097/ACM.0000000000001203.
24. L. Gary Hart et al., “International Medical Graduate Physicians in the United States: Changes Since 1981,” Health Affairs 26, no. 4 (2007): 1159–69, doi:10.1377/hlthaff.26.4.1159
25. Eric Boodman, “Hospitals Rush to Get Accelerated Visas for Foreign Medical Residents,” STAT, April 3, 2017, www.statnews.com.
26. Peggy G. Chen et al, “Policy Solutions to Address the Foreign-Educated and Foreign-Born Health Care Workforce in the United States,” Health Affairs 32, no. 11 (November 2013): 1906–13, doi:10.1377/hlthaff.2013.0576.
27. Somnath Saha, “Taking Diversity Seriously: The Merits of Increasing Minority Representation in Medicine,” JAMA Internal Medicine 174, no. 2 (2014): 291–92, doi:10.1001/jamainternmed.2013.12736.
28. Coutinho, Changes in Primary Care.
29. Shana F. Sandberg, Scott A. Shipman, and Clese E. Erikson, Innovations at the Interface of Primary and Specialty Care, Association of American Medical Colleges, 2016, members.aamc.org (PDF).
30. Ibid.