california health care almanac | california employer health
TRANSCRIPT

californiaHealth Care Almanac
december 2011California Employer Health Benefits Survey

©2011 California HealtHCare foundation 2
<< r e t u r n to Co n t e n t s
employer-based coverage is the leading source of health insurance in California and nationally. Changes in coverage
offerings, worker cost sharing, and benefits have major implications for millions of Californians. this report presents the
highlights of the 2011 California Employer Health Benefits Survey, annual research that tracks changes in employer-based
health benefits in the state over time.
Key findings include:
since 2002, premiums rose 153.5%, more than five times the 29.3% increase in California’s inflation rate. •
the proportion of California employers offering coverage declined from 73% to 63% over the last two years.•
Premiums were higher in California than nationally for both single and family coverage. However, the employer •contribution in California was significantly higher than the national average.
annual premiums for single coverage in California were $5,970, compared to $5,429 nationally. •family coverage premiums were $15,724 in California and $15,073 nationally.
employers in California contributed $5,213 annually for single coverage and $11,921 for family coverage.•
Workers in small firms in California were significantly more likely to cover at least half of the premium for family •coverage than workers in large firms.
enrollment in plans with a deductible of $1,000 or more for single coverage leveled off for California workers in •2011, but has increased considerably in recent years for small firms. twenty-seven percent of workers in small firms have a deductible of $1,000 or more, up from just 7% in 2006.
twenty-five percent of California firms either reduced benefits or increased cost sharing for employees in the •past year, while 22% increased employees’ share of the premium (compared to 15% in 2010).
thirty-six percent of California firms say they are “very” or “somewhat” likely to increase the amount workers •pay for premiums in the coming year.
additional information on the project methodology is available at the end of the presentation on page 41.
California Employer Health Benefits
c o n t e n t s
overview . . . . . . . . . . . . . . . . . . . . . . . . . . . . . . . . .3
Coverage availability . . . . . . . . . . . . . . . . . . . . .4
Cost of Health insurance . . . . . . . . . . . . . . . . . .9
Benefits and Cost sharing . . . . . . . . . . . . . . 16
Plan enrollment and Choice . . . . . . . . . . . . 27
employer Views and Practices . . . . . . . . . . 31
Methodology . . . . . . . . . . . . . . . . . . . . . . . . . . . 41
overview
Introduction

©2011 california HealtHcare foundation 3
<< r e t u r n to co n t e n t s
US
California
US
California
US
California
3 to 9 10 to 49 50 to 199 200 to 999 1,000+
Employers
Workers
Covered Workers
9% 18% 15% 13% 45%
8% 17% 14% 14% 48%
5% 16% 14% 13% 51%
5% 13% 14% 15% 53%
60% 31% 6%
61% 32% 6%
<1%
1%2%
California Employer Health Benefits
number of worKers
overview
california firms with three
to 49 workers accounted for
91% of employers but just
27% of all workers and 21%
of covered workers.
*tests found no statistically different distributions between california and the united states.
note: in this report, numbers may not add up to 100% due to rounding.
sources: california Healthcare foundation/norc california employer Health benefits survey: 2011. author analysis of data from the Kaiser/Hret survey of employer-sponsored Health benefits: 2011.
Employers, Workers, and Covered Workers, by Firm Size, California vs. the United States, 2011*
©2011 california HealtHcare foundation 4
<< r e t u r n to co n t e n t s
0%
10%
20%
30%
40%
50%
60%
70%
80%
90%
100%
2011*2010*2009200820072006200520042003200220012000
California
United States
69%
68%
70%
68%
71%
66%
70%
66%
67%
63%
67%
60%
71%
61%
71%
59%
70%
63%
73%
59%
69%
69%63%
60%
California Employer Health Benefits
*us estimates are statistically different from the previous year shown.
sources: california Healthcare foundation (cHcf)/norc california employer Health benefits survey: 2007– 2011. cHcf/Hsc california employer Health benefits survey: 2005 – 2006. cHcf/Hret california employer Health benefits survey: 2004. Kaiser/Hret california employer Health benefits survey: 2000 – 2003. Kaiser/Hret survey of employer-sponsored Health benefits: 2000 – 2011.
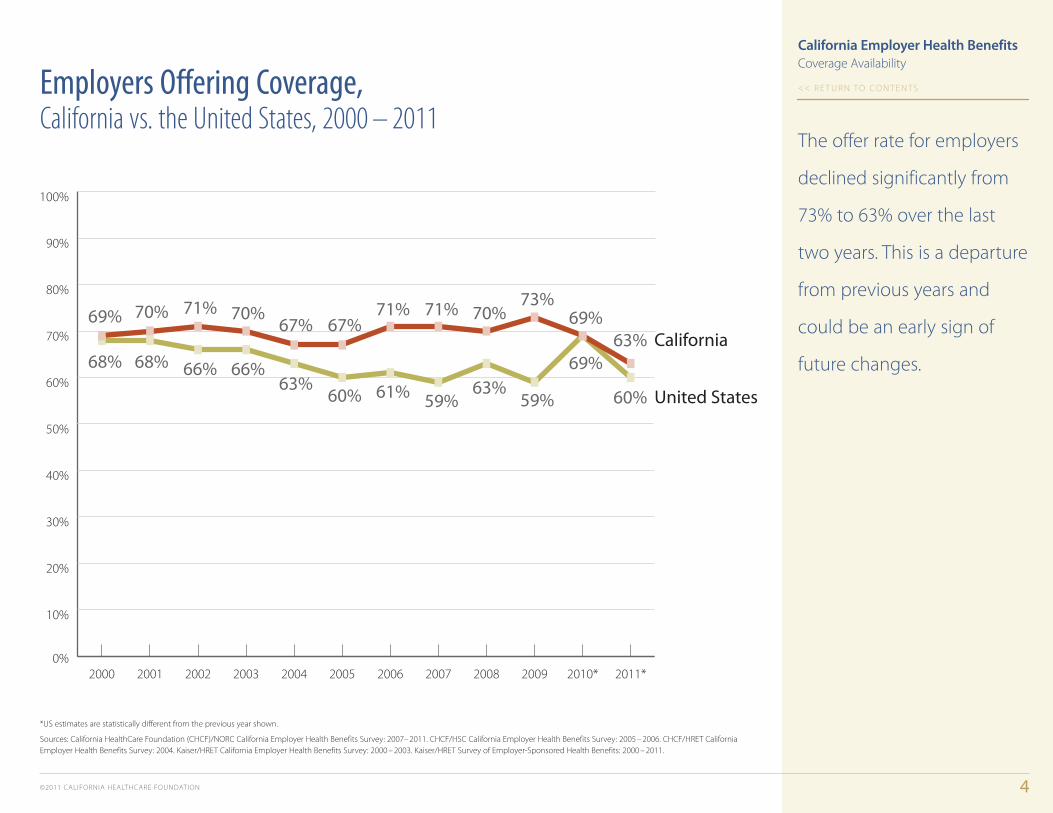
the offer rate for employers
declined significantly from
73% to 63% over the last
two years. this is a departure
from previous years and
could be an early sign of
future changes.
Employers Offering Coverage, California vs. the United States, 2000 – 2011
coverage availability

©2011 California HealtHCare foundation 5
<< r e t u r n to Co n t e n t s
0 17 34 51 68 85
No Union Workers
At Least Some Union Workers
Fewer Part-Time Workers*
Many Part-Time Workers*
Higher-Wage Firms*
Lower-Wage Firms*
All Firms
63%
42%
66%
41%
70%
84%
61%
California Employer Health Benefits
*estimates are statistically different between lower- and higher-wage firms, and between many and fewer part-time workers.
notes: lower-Wage firms are defined as those in which at least 35% of workers earn $23,000 or less per year. Higher-Wage firms are those in which less than 35% of workers earn $23,000 or less. Many Part-time Workers are firms in which at least 35% of workers work part-time. fewer Part-time Workers are first in which less than 35% work part-time.
source: California HealthCare foundation/norC California employer Health Benefits survey: 2011.
the probability of
employers offering
coverage varied widely
by firm characteristics.
only 42% of lower-wage
firms offered health benefits
in 2011, versus 66% of
higher-wage ones.
Employers Offering Coverage, by Firm Characteristics, California, 2011
Coverage availability

©2011 california HealtHcare foundation 6
<< r e t u r n to co n t e n t s
0
20
40
60
80
100
1,000+200 to 99950 to 19910 to 493 to 9All Firms
48%53%
60%63%
74%74%
93%91%
98% 99%98%99%
California United States
Number of Workers
California Employer Health Benefits
*tests found no statistically different estimates between california and the united states.
sources: california Healthcare foundation/norc california employer Health benefits survey: 2011. author analysis of data from the Kaiser/Hret survey of employer-sponsored Health benefits: 2011.
slightly more than half of
california’s smaller firms
(three to nine workers)
provided coverage in 2011,
while the vast majority
of larger firms did so.
offer rates were generally
comparable in california
and the nation.
coverage availability
Employers Offering Coverage, by Firm Size, California vs. the United States, 2011*

©2011 california HealtHcare foundation 7
<< r e t u r n to co n t e n t s
0
20
40
60
80
100
Employees CoveredEligible EmployeesWho Take Up Coverage*
Employees Who Are Eligible
79%79% 81%85%
67% 65%
California United States
California Employer Health Benefits
*estimates are statistically different between california and the united states.
sources: california Healthcare foundation/norc california employer Health benefits survey: 2011. Kaiser/Hret survey of employer-sponsored Health benefits: 2011.
nearly 80% of california
employees working in firms
offering coverage were
eligible for health benefits,
and 85% of those elected
to enroll. overall 67% of
all employees received
coverage from their firm.
Employee Eligibility, Take-Up Rates, and Coverage,California vs. the United States, 2011
coverage availability

©2011 california HealtHcare foundation 8
<< r e t u r n to co n t e n t s
0 10 20 30 40 50 60 70 80
Large Firms (200+ workers)
Small Firms (3 to 199 workers)
All Firms
69% 65% 66%
65% 67%
73%73%
71% 67%
66%
66% 60%
63% 64%
67%
2003 2005 2007 2009
2011
California Employer Health Benefits
*tests found no statistically different estimates from previous year shown within firm size.
sources: california Healthcare foundation (cHcf)/norc california employer Health benefits survey: 2007, 2009, and 2011. cHcf/Hsc california employer Health benefits survey: 2005. Kaiser/Hret california employer Health benefits survey: 2003.
insurance coverage rates
have been fairly stable
since 2003.
Worker Coverage Rates, Among Offering Firms, by Firm Size, California, 2003–2011, Selected Years*
coverage availability

©2011 california HealtHcare foundation 9
<< r e t u r n to co n t e n t s
0
2
4
6
8
10
United States(variable enrollment)
California(variable enrollment)
California(�xed enrollment)
9.1%
8.1%
9.5%
California Employer Health Benefits
Average Increases in Premiums, Family Coverage, by Product Enrollment Status, California vs. the United States, 2011
among california firms that
offered the same health
plan or plans in 2010 and
2011 (fixed enrollment), the
average family coverage
premium increase for those
plans was 8.1%.
When the calculation
includes california firms
that changed plans or had
workers who switched plans
(variable enrollment), the
average family premium
increase was 9.1%.
sources: california Healthcare foundation/norc california employer Health benefits survey: 2011. Kaiser/Hret survey of employer-sponsored Health benefits: 2011.
cost of Health insurance

©2011 california HealtHcare foundation 10
<< r e t u r n to co n t e n t s
-2%
0%
2%
4%
6%
8%
10%
12%
14%
16%
18%
2011201020092008200720062005200420032002200120001999
Premiums
Overall In�ation
4.8%
6.7%
10.0%*
13.4%*
15.8%*
11.4%*
8.2%* 8.7% 8.3% 8.3%7.5%
8.1% 8.1%
3.1%3.5%
California Employer Health Benefits
*estimates are statistically different from the previous year shown.
sources: california Healthcare foundation (cHcf)/norc california employer Health benefits survey: 2007–2011. cHcf/Hsc california employer Health benefits survey: 2005–2006; cHcf/Hret california employer Health benefits survey: 2004. Kaiser/Hret california employer Health benefits survey: 1999 – 2003. california division of labor statistics and research, consumer Price index, california average of annual inflation (april to april) 1999 – 2011.
Health insurance premiums
for family coverage in
california grew by 8.1%
in 2011, statistically
unchanged in recent years.
Premiums continue to
rise much faster than the
california inflation rate.
Premium Increases Compared to Inflation, Family Coverage, California, 1999–2011
cost of Health insurance

©2011 california HealtHcare foundation 11
<< r e t u r n to co n t e n t s
0%
20%
40%
60%
80%
100%
120%
140%
160%
180%
2011201020092008200720062005200420032002
Premiums
13.4%
2.8%
153.5%
29.3%
Overall In�ation
California Employer Health Benefits
sources: california Healthcare foundation (cHcf)/norc california employer Health benefits survey: 2007–2011. cHcf/Hsc california employer Health benefits survey: 2005 – 2006. cHcf/Hret california employer Health benefits survey: 2004. Kaiser/Hret california employer Health benefits survey: 2002–2003. california division of labor statistics and research, consumer Price index, california average of annual inflation (april to april) 2002–2011.
since 2002, health insurance
premiums in california have
increased by 153.5%, more
than five times the 29.3%
increase in the state’s overall
inflation rate.
Cumulative Premium Increases Compared to Inflation, Family Coverage, California, 2002–2011
cost of Health insurance

©2011 california HealtHcare foundation 12
<< r e t u r n to co n t e n t s
HDHP/SO
POS
PPO*
HMO*
All Plans*
HDHP/SO*
POS
PPO*
HMO
All Plans*
California United States
Single Coverage$498
$452 $474
$446 $545
$465 $543
$487 $381 $399
Family Coverage$1,310
$1,256 $1,277 $1,274
$1,399 $1,284
$1,419$1,272
$960 $1,142
California Employer Health Benefits
*estimates are statistically different between california and the united states.
sources: california Healthcare foundation/norc california employer Health benefits survey: 2011. Kaiser/Hret survey of employer-sponsored Health benefits: 2011.
average monthly premiums
for both single and family
coverage were significantly
greater in california than
nationally.
Average Monthly Premiums, by Plan Type, California vs. the United States, 2011
cost of Health insurance

©2011 california HealtHcare foundation 13
<< r e t u r n to co n t e n t s
$0
$50
$100
$150
$200
$250
$300
$350
$400
$450
$500
2011*201020092008*2007*20062005*2004*2003*2002*2001*2000*
California
United States
$187
$163
$199
$178
$233
$196
$263
$222
$288
$261
$314
$282
$342
$337
$358
$330
$396
$374
$406
$395
$428
$422
$474
$446
California Employer Health Benefits
*estimates are statistically different between california and the united states.
note: annual rate of change for Hmo single premiums should not be calculated by comparing dollar values from one year with the previous year, due to both the survey’s sampling design and the way in which plan information is collected. rates of change in family premiums are collected directly as a question in the survey (no change data for single premiums are collected).
sources: california Healthcare foundation (cHcf)/norc california employer Health benefits survey: 2007–2011. cHcf/Hsc california employer Health benefits survey: 2005–2006. cHcf/Hret california employer Health benefits survey: 2004. Kaiser/Hret california employer Health benefits survey: 2000 – 2003. Kaiser/Hret employer Health benefits survey: 2000 – 2011.
between 2010 and 2011, the
monthly Hmo premiums for
single coverage increased
in california. Premiums in
california now exceed the
national figure.
Average Monthly HMO Premiums, Single Coverage, California vs. the United States, 2000–2011
cost of Health insurance
©2011 California HealtHCare foundation 14
<< r e t u r n to Co n t e n t s
US
California
US
California
Worker Contribution Employer Contribution
Single Coverage
Family Coverage
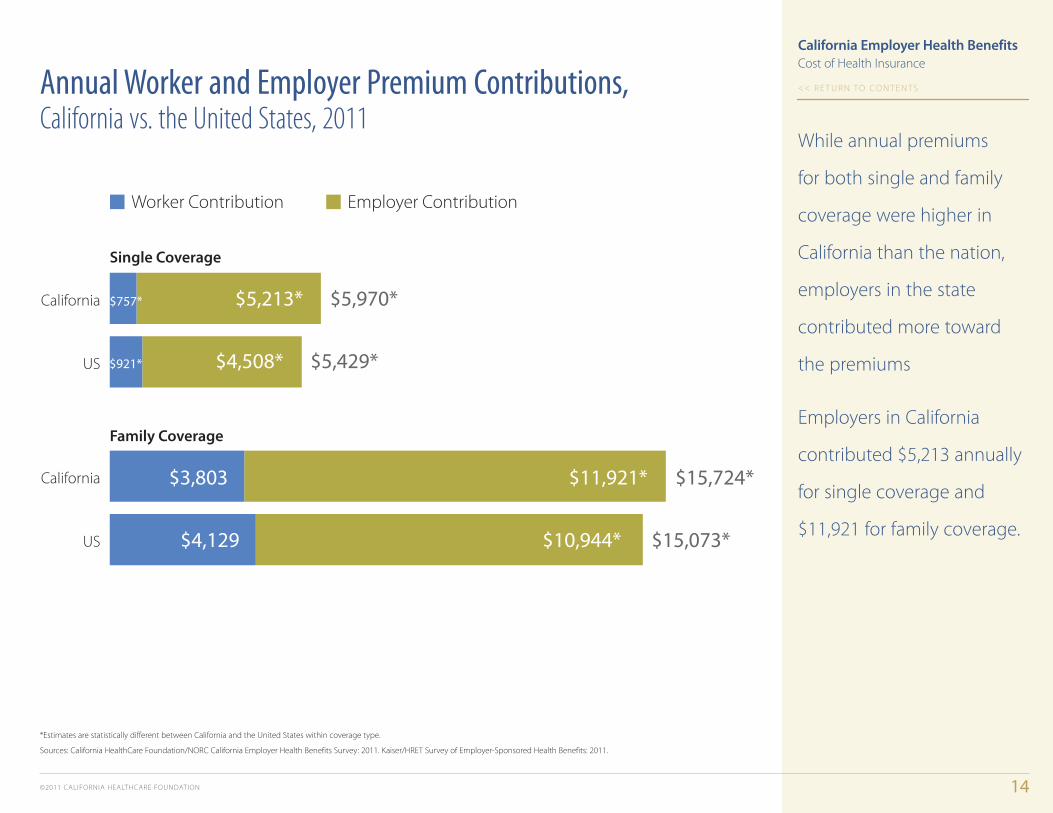
$3,803 $11,921* $15,724*
$4,129 $10,944* $15,073*
$757* $5,213* $5,970*
$921* $4,508* $5,429*
California Employer Health Benefits
*estimates are statistically different between California and the united states within coverage type.
sources: California HealthCare foundation/norC California employer Health Benefits survey: 2011. Kaiser/Hret survey of employer-sponsored Health Benefits: 2011.
Annual Worker and Employer Premium Contributions, California vs. the United States, 2011
While annual premiums
for both single and family
coverage were higher in
California than the nation,
employers in the state
contributed more toward
the premiums
employers in California
contributed $5,213 annually
for single coverage and
$11,921 for family coverage.
Cost of Health insurance

©2011 california HealtHcare foundation 15
<< r e t u r n to co n t e n t s
Large Firms*(200+ workers)
Small Firms*(3–199 workers)
All Firms
No Contribution 1–25% 26–50% 51%+
Single Coverage
24% 60% 14%
37% 44% 16% 3%
17% 69% 13%
Large Firms*(200+ workers)
Small Firms*(3–199 workers)
All Firms
Family Coverage
12% 49% 25% 14%
11% 29% 29% 31%
12% 60% 22% 5%
2%
2%
California Employer Health Benefits
Worker Share of Premium, by Firm Size, California, 2011
in 2011, almost one in
four covered california
employees worked for firms
that paid the full premium
for single coverage.
employees of small firms
were more likely to cover
half of the family premium
than workers in large firms.
*distribution is statistically different from all firms.
source: california Healthcare foundation/norc california employer Health benefits survey: 2011.
cost of Health insurance

©2011 california HealtHcare foundation 16
<< r e t u r n to co n t e n t s
2011*
2009*
2007
2011*
2009*
2007
2011*
2009*
2007
$5 $10 $15 $20 $25 $30 Other
HMO
PPO
POS
— 1% 24% 19% 28% 12% 9% 7%
— 1% 16% 29% 28% 12% 6% 7%
10% 24% 31% 16% 11% 6%
— 2% 29% 12% 29% 8% 9% 11%
3% 20% 23% 35% 5% 4% 9%
7% 6% 33% 9% 27% 19%
— 2% 28% 25% 30% 9% 4%
7% 20% 35% 22% 8% 6%
— 1% 24% 27% 25% 9% 8% 5%
1%
— 2%
California Employer Health Benefits
*distribution is statistically different from previous year shown.
note: segments may not add to 100% due to rounding.
sources: california Healthcare foundation (cHcf)/norc california employer Health benefits survey: 2007, 2009, and 2011.
copayments for office visits
increased substantially for
all types of plans from 2007
to 2011, with $15 the most
common amount for Hmo
plans and $20 the most
common amount for PPo
and Pos plans.
Workers with Specified Office Visit Copayments, by Plan Type, California, 2007–2011, Selected Years
benefits and cost sharing

©2011 california HealtHcare foundation 17
<< r e t u r n to co n t e n t s
0
20
40
60
80
100
HDHP/SO†POS in NetworkPPO in Network†HMO*
29%
10%
84%
55%
81%
69%
100% 100%
($911)
($971)
($499)
($1,098)
($675)
($928)
($2,551) ($1,908)
California United States
California Employer Health Benefits
*Percentages are statistically different between california and the united states. †average deductibles are statistically different between california and the united states.
sources: california Healthcare foundation/norc california employer Health benefits survey: 2011. Kaiser/Hret survey of employer-sponsored Health benefits: 2011.
Workers enrolled in PPos
were much more likely to
have an annual deductible
than those in Hmos or
Pos plans.
deductibles averaged $499
for PPo single coverage in
california, versus $675 in
the nation.
Workers with Annual Deductible, Single Coverage, by Plan Type, California vs. the United States, 2011
benefits and cost sharing

©2011 california HealtHcare foundation 18
<< r e t u r n to co n t e n t s
0%
5%
10%
15%
20%
25%
30%
201120102009200820072006
Small Firms(3 to 199 workers)
All Firms
Large Firms(200+ workers)
7%6%5%
11%
10%10%
14%
9%
5%
21%*
12%
6%
27%
14%
5%
27%
13%
5%
California Employer Health Benefits
*estimate is statistically different from previous year shown by firm size.
sources: california Healthcare foundation (cHcf)/norc california employer Health benefits survey: 2007– 2011. cHcf/Hsc california employer Health benefits survey: 2006.
twenty-seven percent of
covered california workers in
small firms had a deductible
of $1,000 or more for single
coverage in 2011, compared
with just 7% in 2006. in large
firms, only 5% of covered
workers had a deductible of
$1,000 or more.
Workers with a Large Deductible ($1,000+), Single Coverage, by Firm Size, California, 2006–2011
benefits and cost sharing

©2011 california HealtHcare foundation 19
<< r e t u r n to co n t e n t s
HDHP/SO*
POS*
PPO*
HMO*
All Plans
<$500 $500–999 $1,000–1,999 $2,000+
45% 27% 14% 14%
36% 15% 33% 16%
58% 32% 6% 4%
20% 21% 35% 24%
33% 67%
California Employer Health Benefits
*distribution is statistically different from all Plans.
source: california Healthcare foundation/norc california employer Health benefits survey: 2011.
among california workers
with a deductible for
single coverage, 45% had a
deductible of less than $500,
while 28% had a deductible
of $1,000 or more.
Workers with Deductible for Single Coverage, by Plan Type, California, 2011
benefits and cost sharing

©2011 california HealtHcare foundation 20
<< r e t u r n to co n t e n t s
2011
2009
2006*
2003*
2000
<$500 $500–999 $1,000–1,999 $2,000+
California
85% 9% 4%
71% 17% 6% 6%
69% 21% 8%
65% 26% 7%
58% 32% 6% 4%
2011
2009*
2006*
2003*
2000 86% 12%
69% 20% 9%
62% 26% 8% 4%
48% 32% 14% 6%
47% 32% 14% 7%
United States <1%
— 2%
— 2%
— 2%
— 2%
— 1%
California Employer Health Benefits
Percentage of worKers with sPecified deductible ranges
*distribution is statistically different from previous year shown.
sources: california Healthcare foundation (cHcf)/norc california employer Health benefits survey: 2009, 2011. cHcf/Hsc california employer Health benefits survey: 2006. Kaiser/Hret california employer Health benefits survey: 2000, 2003. Kaiser/Hret employer Health benefits survey: 2000, 2003, 2006, 2009, and 2011.
since 2000, workers in
california and the nation
have experienced significant
increases in deductibles for
PPo coverage.
Deductible for Single PPO Coverage, California vs. the United States, 2000–2011, Selected Years
benefits and cost sharing
©2011 california HealtHcare foundation 21
<< r e t u r n to co n t e n t s
HDHP/SO
POS*
PPO*
HMO*
All Plans
<$500 $500–999 $1,000–1,999 $2,000+
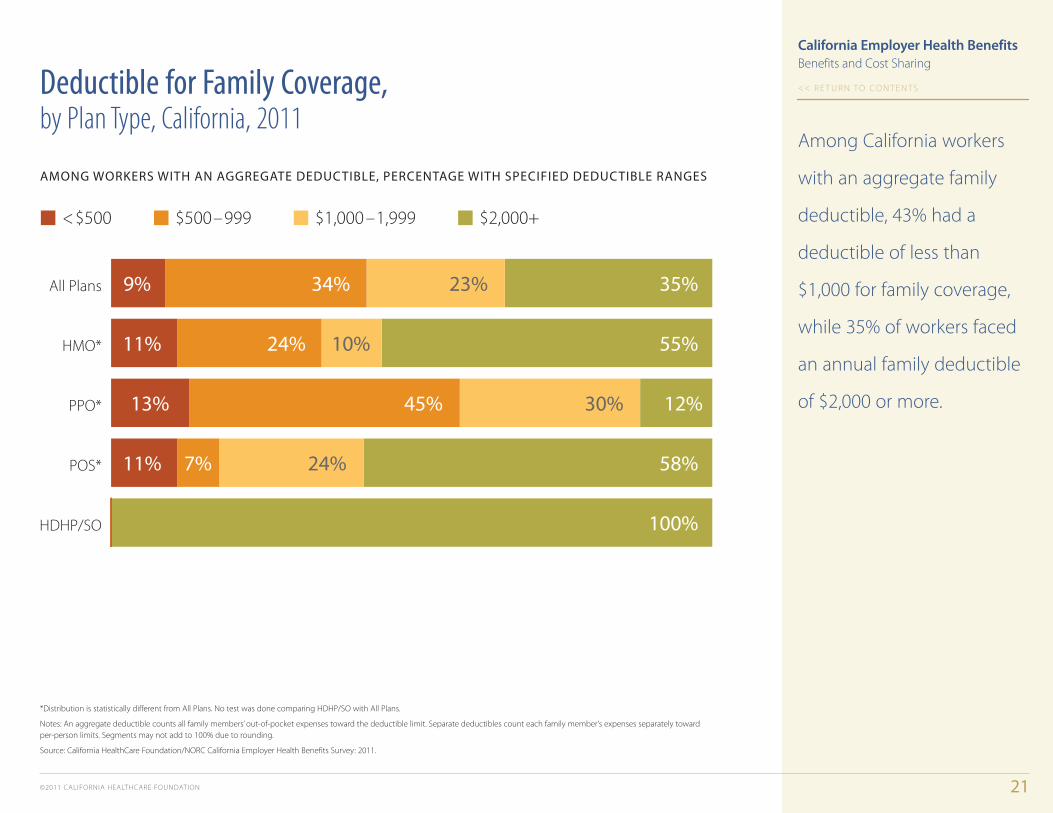
9% 34% 23% 35%
11% 24% 10% 55%
13% 45% 30% 12%
11% 7% 24% 58%
100%
California Employer Health Benefits
among worKers with an aggregate deductible, Percentage with sPecified deductible ranges
*distribution is statistically different from all Plans. no test was done comparing HdHP/so with all Plans.
notes: an aggregate deductible counts all family members’ out-of-pocket expenses toward the deductible limit. separate deductibles count each family member’s expenses separately toward per-person limits. segments may not add to 100% due to rounding.
source: california Healthcare foundation/norc california employer Health benefits survey: 2011.
among california workers
with an aggregate family
deductible, 43% had a
deductible of less than
$1,000 for family coverage,
while 35% of workers faced
an annual family deductible
of $2,000 or more.
Deductible for Family Coverage, by Plan Type, California, 2011
benefits and cost sharing
©2011 california HealtHcare foundation 22
<< r e t u r n to co n t e n t s
HDHP/SO*
POS*
PPO*
HMO*
All Plans
<$1,000 $1,000 –1,499 $1,500 –1,999 $2,000 –2,499 $2,500 –2,999 $3,000+ No Limit
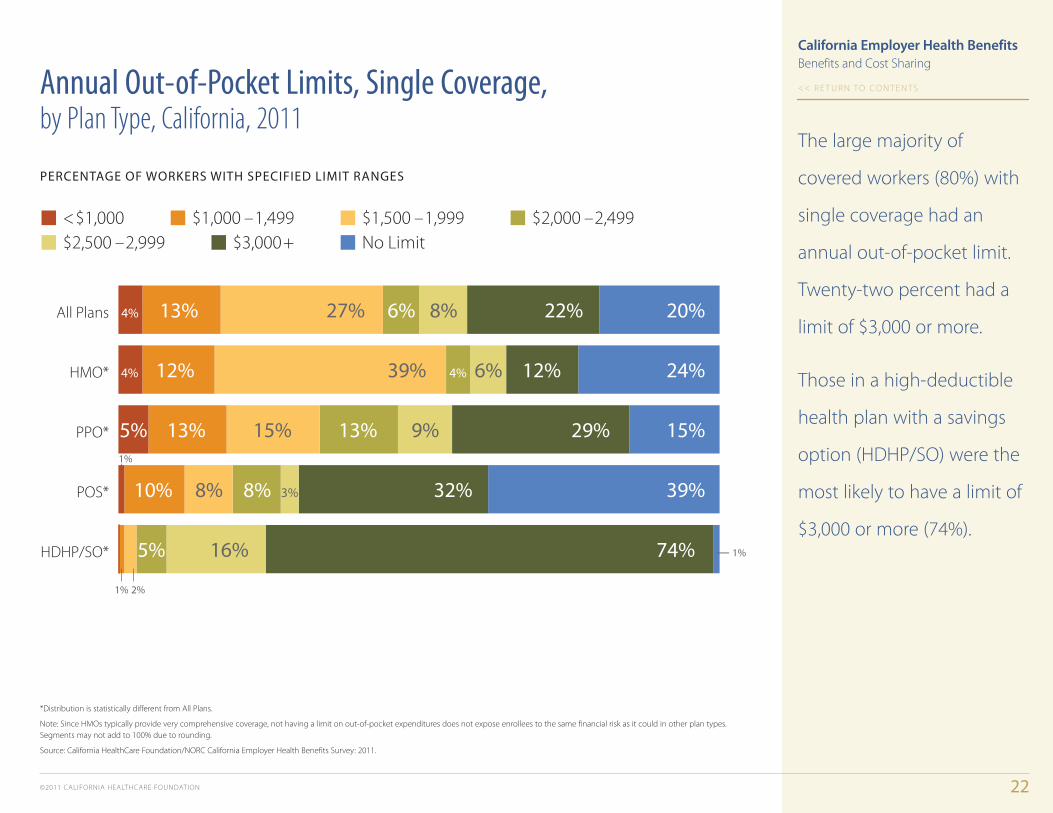
4% 13% 27% 6% 8% 22% 20%
4% 12% 39% 4% 6% 12% 24%
5% 13% 15% 13% 9% 29% 15%
10% 8% 8% 3% 32% 39%
5% 16% 74%
1%
1%
2%
— 1%
California Employer Health Benefits
Percentage of worKers with sPecified limit ranges
*distribution is statistically different from all Plans.
note: since Hmos typically provide very comprehensive coverage, not having a limit on out-of-pocket expenditures does not expose enrollees to the same financial risk as it could in other plan types. segments may not add to 100% due to rounding.
source: california Healthcare foundation/norc california employer Health benefits survey: 2011.
the large majority of
covered workers (80%) with
single coverage had an
annual out-of-pocket limit.
twenty-two percent had a
limit of $3,000 or more.
those in a high-deductible
health plan with a savings
option (HdHP/so) were the
most likely to have a limit of
$3,000 or more (74%).
Annual Out-of-Pocket Limits, Single Coverage, by Plan Type, California, 2011
benefits and cost sharing
©2011 california HealtHcare foundation 23
<< r e t u r n to co n t e n t s
2011*
2009*
2007*
2005
< $1,000 $1,000 –1,499 $1,500 –1,999 $2,000 –2,499 $2,500 –2,999 $3,000+ No Limit
California
18% 16% 10% 18% 10% 19% 9%
12% 12% 15% 16% 13% 18% 14%
8% 18% 10% 20% 10% 22% 13%
5% 13% 15% 13% 9% 29% 15%
2011*
2009*
2007*
2005 9% 22% 17% 16% 9% 13% 15%
6% 17% 16% 15% 7% 16% 23%
5% 17% 15% 18% 9% 22% 14%
3% 10% 13% 18% 10% 30% 17%
United States
California Employer Health Benefits
Percentage of worKers with sPecified limit ranges
*distribution is statistically different from previous year shown.
note: segments may not add to 100% due to rounding.
sources: california Healthcare foundation (cHcf)/norc california employer Health benefits survey: 2007, 2009, and 2011. cHcf/Hsc california employer Health benefits survey: 2005. author analysis of data from Kaiser/Hret survey of employer-sponsored Health benefits: 2005, 2007, 2009, and 2011.
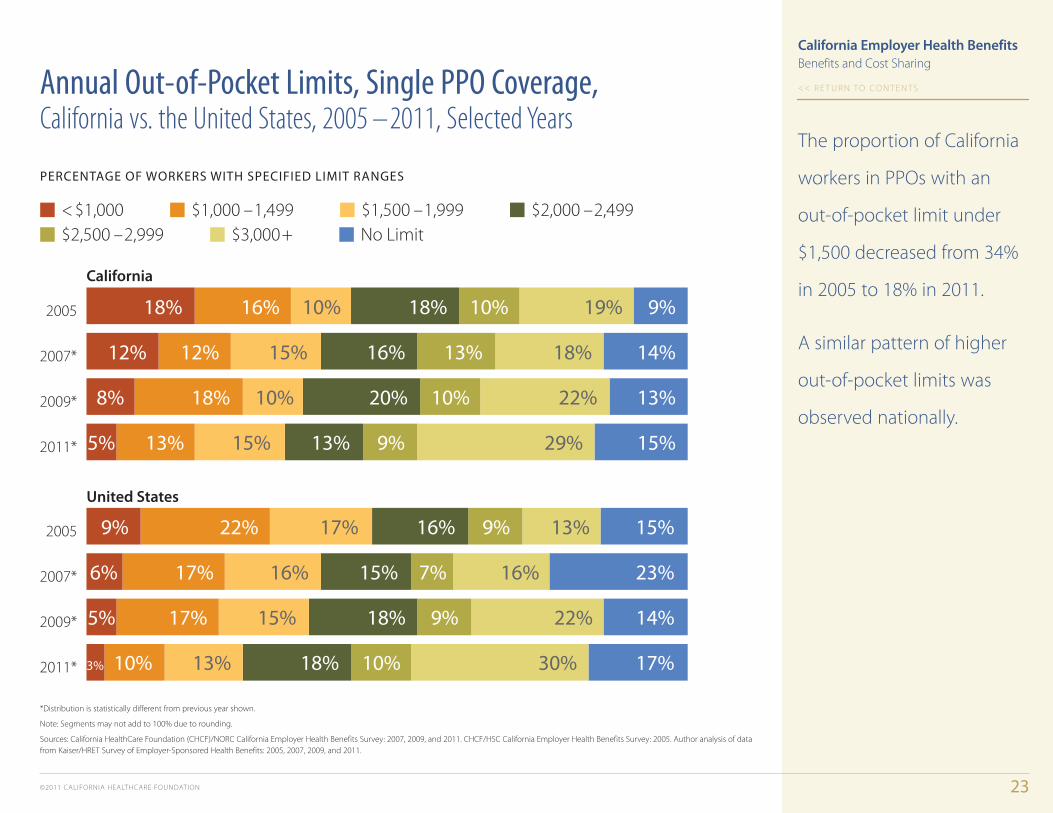
the proportion of california
workers in PPos with an
out-of-pocket limit under
$1,500 decreased from 34%
in 2005 to 18% in 2011.
a similar pattern of higher
out-of-pocket limits was
observed nationally.
Annual Out-of-Pocket Limits, Single PPO Coverage, California vs. the United States, 2005 –2011, Selected Years
benefits and cost sharing
©2011 california HealtHcare foundation 24
<< r e t u r n to co n t e n t s
HDHP/SO*
POS*
PPO*
HMO*
All Plans
<$2,000 $2,000 – $3,000 – $4,000 – $5,000 – $6,000+ 2,999 3,999 4,999 5,999
23% 6% 34% 8% 6% 23%
16% 9% 49% 6% 7% 14%
36% 6% 17% 12% 5% 23%
10% 3% 18% 15% 5% 50%
7% 3% 18% 69%
1% 2%
California Employer Health Benefits
among worKers with aggregate limit, Percentage with sPecified ranges
*distribution is statistically different from all Plans.
notes: since Hmos typically provide very comprehensive coverage, not having a limit on out-of-pocket expenditures does not expose enrollees to the same financial risk as it could in other plan types. segments may not add to 100% due to rounding.
source: california Healthcare foundation/norc california employer Health benefits survey: 2011.
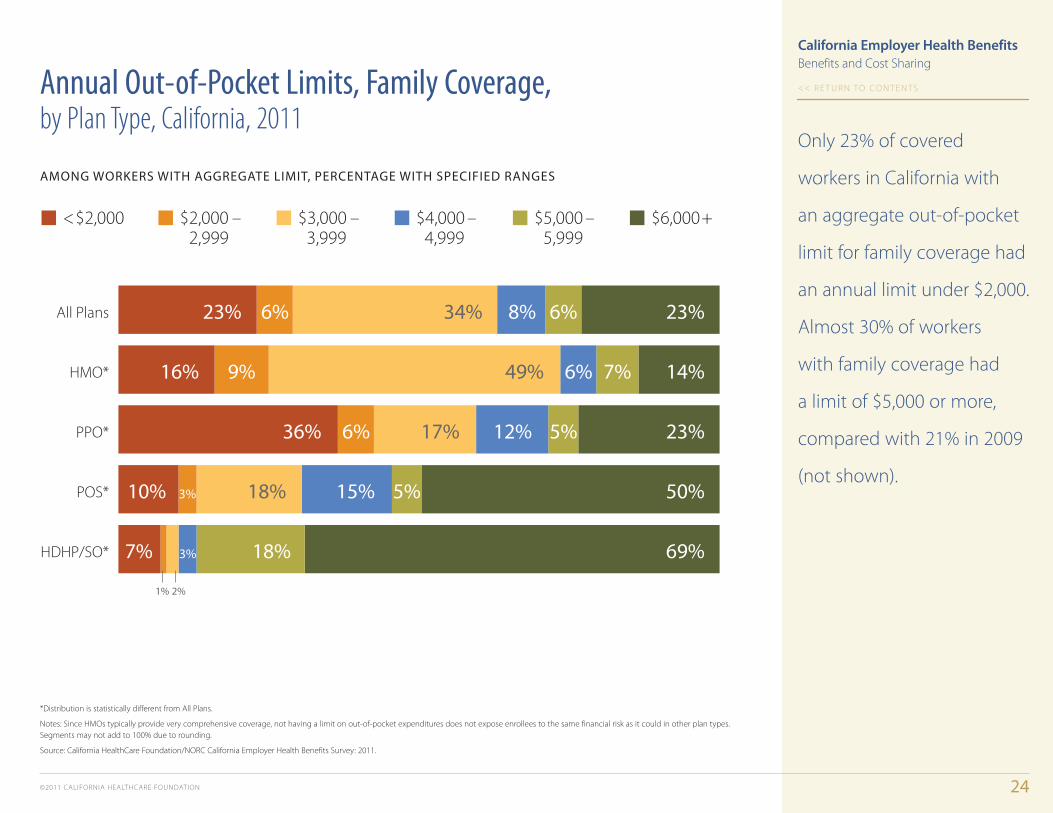
only 23% of covered
workers in california with
an aggregate out-of-pocket
limit for family coverage had
an annual limit under $2,000.
almost 30% of workers
with family coverage had
a limit of $5,000 or more,
compared with 21% in 2009
(not shown).
Annual Out-of-Pocket Limits, Family Coverage, by Plan Type, California, 2011
benefits and cost sharing

©2011 california HealtHcare foundation 25
<< r e t u r n to co n t e n t s
2011*
2009
2007*
2005
Four-Tier (such as three-tier plus a fourth tier for lifestyle or other speci�ed drugs)
Three-Tier (such as one payment for generic drugs, another for preferred drugs, and a third for non-preferred drugs)
Two-Tier (such as one payment for generic drugs and another for name brand)
One-Tier (such as cost sharing the same regardless of drug type)
Other
California
— 2% 44% 41% 13%
1 — 1% 54% 33% 11%
— 1% 55% 30% 9% 4%
3% 61% 27% 8%
2011*
2009*
2007*
2005 4% 70% 15% 8%
7% 68% 16% 6% 4%
11% 69% 12% 5%3%
14% 64% 11% 7% 3%
United States
— 2%
— 2%
— 1%
California Employer Health Benefits
*distribution is statistically different from previous year shown.
note: segments may not add to 100% due to rounding.
sources: california Healthcare foundation (cHcf)/norc california employer Health benefits survey: 2007, 2009, and 2011. cHcf/Hsc california employer Health benefits survey: 2005. author analysis of data from the Kaiser/Hret employer Health benefits survey: 2005, 2007, 2009, and 2011.
in 2011, 64% of covered
california workers had
a three- or four-tier
cost-sharing formula
for prescription drugs.
nationally, more than three-
fourths of covered workers
were subject to three- or
four-tier formulas.
Workers’ Cost Sharing for Prescriptions, California vs. the United States, 2005 –2011, Selected Years
benefits and cost sharing
©2011 california HealtHcare foundation 26
<< r e t u r n to co n t e n t s
0 10 20 30 40 50
Non-Preferred
Preferred
Generic
$8.95 $10.11*
$10.89* $10.00 $9.96
$18.61 $21.93* $21.86 $22.40
$24.35
$32.58 $38.41*
$39.47 $39.20
$43.50*
2003 2005 2007 2009 2011
California Employer Health Benefits
*estimate is statistically different from previous year shown.
sources: california Healthcare foundation (cHcf)/norc california employer Health benefits survey: 2007, 2009, and 2011. cHcf/Hsc california employer Health benefits survey: 2005. cHcf/Hret california employer Health benefits survey: 2003.
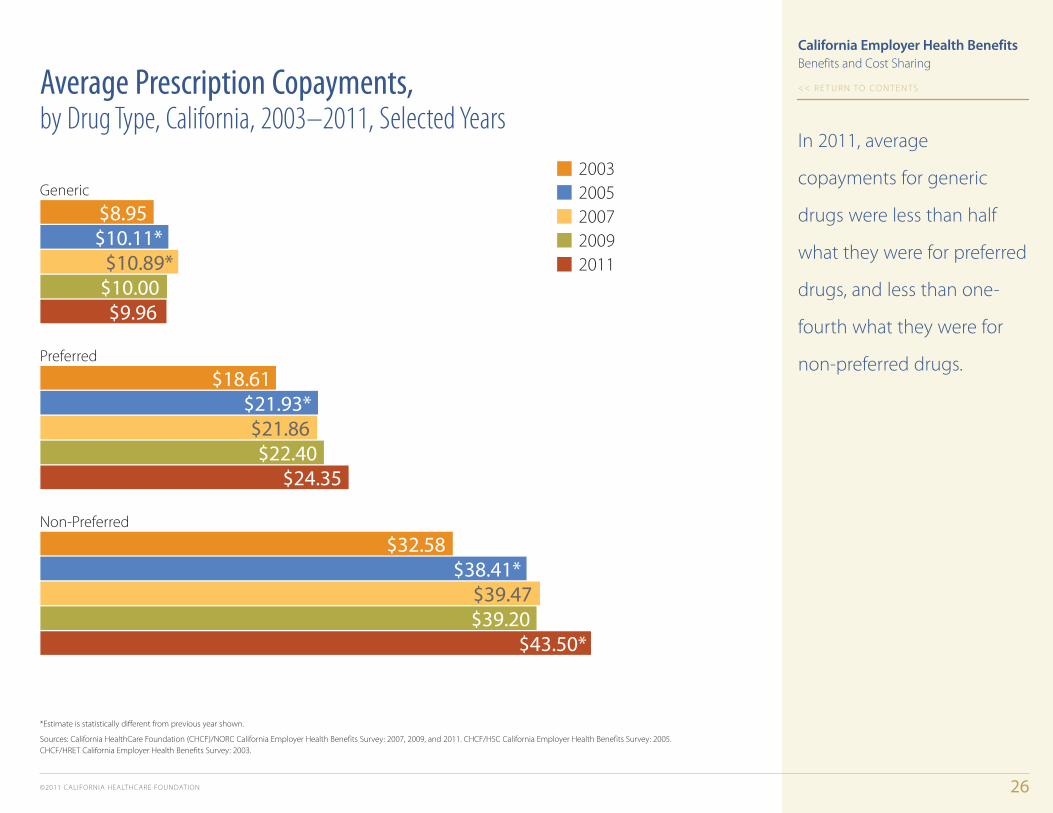
in 2011, average
copayments for generic
drugs were less than half
what they were for preferred
drugs, and less than one-
fourth what they were for
non-preferred drugs.
Average Prescription Copayments, by Drug Type, California, 2003–2011, Selected Years
benefits and cost sharing
©2011 california HealtHcare foundation 27
<< r e t u r n to co n t e n t s
0
10
20
30
40
50
60
70
80
HDHP/SO*POSPPOHMO*Conventional*
7%<1%
77% 75% 76%
39%
16% 16%
22%
40%
California United States
California Employer Health Benefits
*estimates are statistically different between california and the united states.
sources: california Healthcare foundation/norc california employer Health benefits survey: 2011. Kaiser/Hret survey of employer-sponsored Health benefits: 2011.
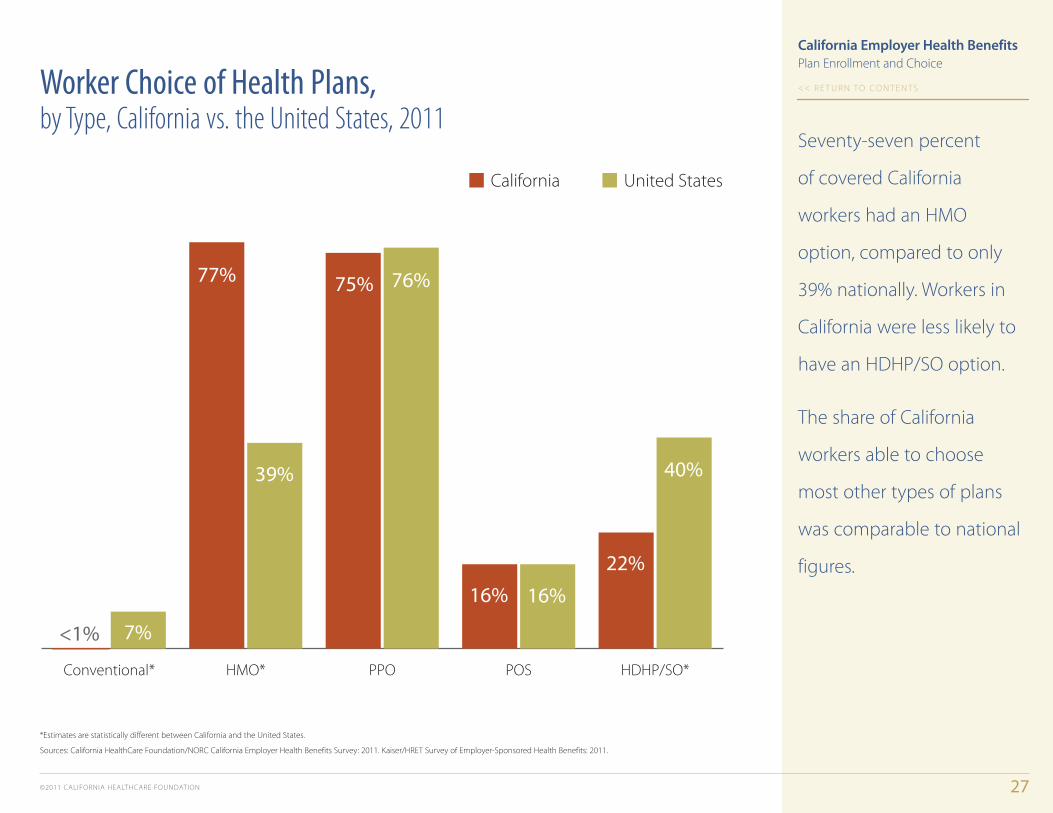
seventy-seven percent
of covered california
workers had an Hmo
option, compared to only
39% nationally. Workers in
california were less likely to
have an HdHP/so option.
the share of california
workers able to choose
most other types of plans
was comparable to national
figures.
Worker Choice of Health Plans, by Type, California vs. the United States, 2011
Plan enrollment and choice

©2011 california HealtHcare foundation 28
<< r e t u r n to co n t e n t s
2011*
2009
2007
2005*
2003
Conventional HMO PPO POS HDHP/SO
California
— 1% 52% 29% 17%
49% 34% 17%
47% 35% 13% 4%
54% 31% 11% 5%
54% 35% 6% 6%
2011*
2009*
2007
2005*
2003 5% 24% 54% 17%
3% 21% 61% 15%
3% 21% 57% 13% 5%
— 1% 20% 60% 10% 8%
— 1% 17% 55% 10% 17%
United States
California Employer Health Benefits
*distribution is statistically different from previous year shown.
notes: conventional plan enrollment in california in 2008 was less than 1%. no test was conducted comparing 2007 with 2005 due to the addition of HdHP in 2006. segments may not add to 100% due to rounding.
sources: california Healthcare foundation (cHcf)/norc california employer Health benefits survey: 2007, 2009, and 2011. cHcf/Hsc california employer Health benefits survey: 2005. cHcf/Hret california employer Health benefits survey: 2003. Kaiser/Hret california employer Health benefits survey: 2003, 2005, 2007, 2009 and 2011.
california workers have
been consistently more
likely to enroll in Hmos than
covered workers nationally.
conversely, PPos are more
popular in the us than in
california.
enrollment in high-
deductible plans with a
savings option in california
has been stable since 2007,
contrary to the national
trend.
Enrollment of Covered Workers, by Plan Type, California vs. the United States, 2003–2011, Selected Years
Plan enrollment and choice
©2011 california HealtHcare foundation 29
<< r e t u r n to co n t e n t s
0
10
20
30
40
50
HDHP with HRAHealth Savings Account-Eligible HDHP
High-Deductible Health Plan(HDHP)
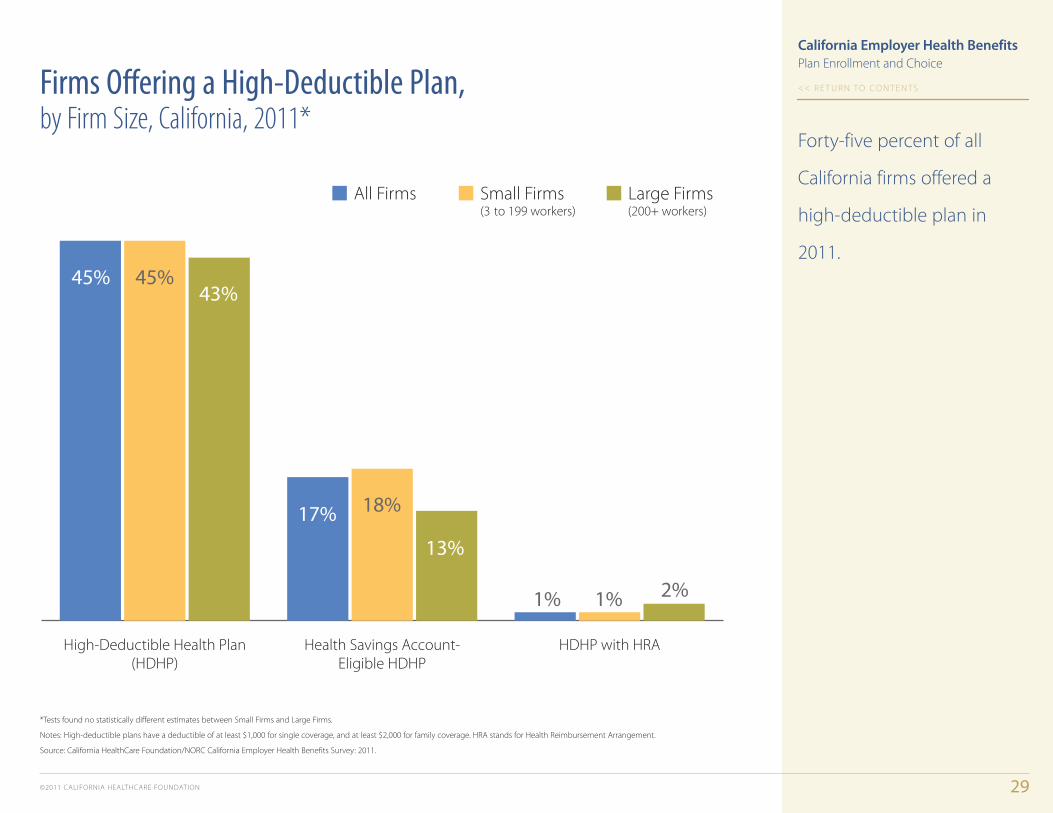
45%45%43%
13%
17%
1% 2%1%
18%
All Firms Small Firms Large Firms(3 to 199 workers) (200+ workers)
California Employer Health Benefits
*tests found no statistically different estimates between small firms and large firms.
notes: High-deductible plans have a deductible of at least $1,000 for single coverage, and at least $2,000 for family coverage. Hra stands for Health reimbursement arrangement.
source: california Healthcare foundation/norc california employer Health benefits survey: 2011.
forty-five percent of all
california firms offered a
high-deductible plan in
2011.
Firms Offering a High-Deductible Plan, by Firm Size, California, 2011*
Plan enrollment and choice
©2011 california HealtHcare foundation 30
<< r e t u r n to co n t e n t s
0
10
20
30
40
50
60
70
80
HDHP/SO*POSPPOHMO*All Plans*
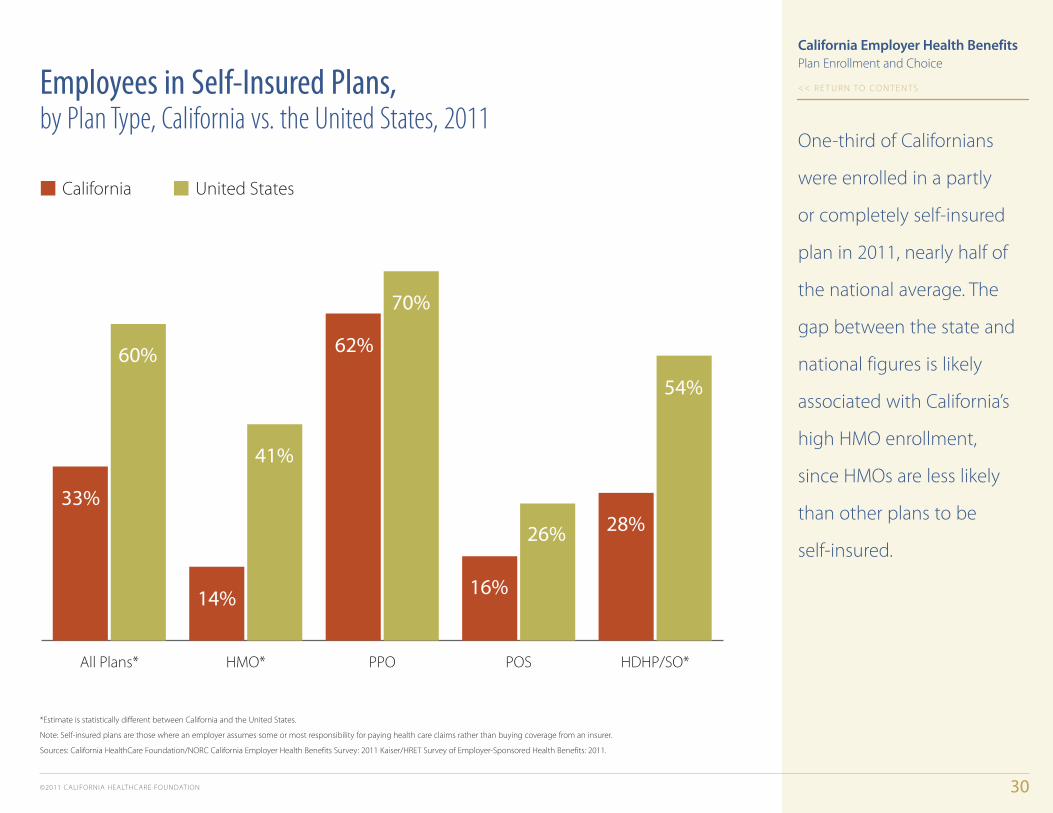
60%
33%
14%
62%
70%
41%
16%
26% 28%
54%
California United States
California Employer Health Benefits
*estimate is statistically different between california and the united states.
note: self-insured plans are those where an employer assumes some or most responsibility for paying health care claims rather than buying coverage from an insurer.
sources: california Healthcare foundation/norc california employer Health benefits survey: 2011 Kaiser/Hret survey of employer-sponsored Health benefits: 2011.
one-third of californians
were enrolled in a partly
or completely self-insured
plan in 2011, nearly half of
the national average. the
gap between the state and
national figures is likely
associated with california’s
high Hmo enrollment,
since Hmos are less likely
than other plans to be
self-insured.
Employees in Self-Insured Plans, by Plan Type, California vs. the United States, 2011
Plan enrollment and choice

©2011 california HealtHcare foundation 31
<< r e t u r n to co n t e n t s
0
16
32
48
64
80
Large Firms*(200+ workers)
Small Firms*(3 to 199 workers)
All Firm
29%23%
84%
California Employer Health Benefits
*estimate is statistically different between small firms and large firms.
source: california Healthcare foundation/norc california employer Health benefits survey: 2011.
Self-Insured Firms that Have Purchased Stop Loss Insurance, by Firm Size, California, 2011
almost 30% of california
employers with a self-
insured plan purchased stop
loss insurance in 2011 to
protect them against large
claims.
large firms were significantly
more likely than small firms
to do so — 84% compared
to 23%.
employer Views and Practices

©2011 california HealtHcare foundation 32
<< r e t u r n to co n t e n t s
Drop coverage entirely
Restrict employee eligibility for coverage
Increase the amount workers pay for prescription drugs
Increase the amount workers copay
Increase the amount workers pay for deductibles
Increase the amount workers pay for premiums
Very Somewhat Not Too Not at All Don’t Know
15% 21% 20% 44%
9% 24% 19% 46%
11% 23% 22% 41%
12% 18% 25% 43%
6% 4% 11% 78%
4% 8% 86% 1%
— 2%
— 2%
— 2%
— 1%
— 1%
California Employer Health Benefits
note: segments may not add to 100% due to rounding.
source: california Healthcare foundation/norc california employer Health benefits survey: 2011.
fifteen percent of california
firms said they are “very
likely” to increase the
amount employees pay for
health insurance premiums
in the coming year.
Likelihood of Firms Making Changes in the Next Year, by Type of Change, California, 2011
employer Views and Practices

©2011 california HealtHcare foundation 33
<< r e t u r n to co n t e n t s
Large Firms(200+ workers)
Small Firms(3 to 199 workers)
Large Firms(200+ workers)
Small Firms(3 to 199 workers)
Very Somewhat Not Too Not at All Don’t Know
Premiums
Coinsurance or Copays
14% 21% 20% 45%
43% 22% 13% 22%
11% 23% 22% 42%
13% 27% 23% 37%
1%
2%
California Employer Health Benefits
increase the amount emPloyees Pay for…
forty-three percent of large
employers in california
said they are “very likely”
to increase the amount
employees pay for health
insurance premiums in
the coming year, versus
14% of small firms.
note: segments may not add to 100% due to rounding.
source: california Healthcare foundation/norc california employer Health benefits survey: 2011.
Likelihood of Firms Making Select Changes in the Next Year, by Firm Size, California, 2011
employer Views and Practices

©2011 california HealtHcare foundation 34
<< r e t u r n to co n t e n t s
reduced scoPe of health benefits
or increased cost sharing
increased worKers’ share
of Premium
firm siZe
All Small Firms (3 to 199 workers) 25%* 21%*
All Large Firms (200 + workers) 41%* 50%*
• 200 to 999 workers 40% 43%*
• 1,000 + workers 42%* 61%*
region
los angeles 26% 18%
san francisco 25% 7%*
rest of state 25% 31%
All Firms 25% 22%
California Employer Health Benefits
*estimate is statistically different from all other firms or regions.
note: los angeles and san francisco are defined as the metropolitan statistical area (msa).
source: california Healthcare foundation/norc california employer Health benefits survey: 2011.
twenty-two percent of
california firms increased
workers’ share of the
premium in the past year,
compared with just 12% in
2010 (not shown).
the san francisco region
had a significantly lower
rate of firms that increased
premiums than the rest of
the state.
Firms that Made Changes in the Past Year, by Firm Size and California Region, 2011
employer Views and Practices
©2011 california HealtHcare foundation 35
<< r e t u r n to co n t e n t s
Yes No Don’t Know
Aware of small �rm tax credit
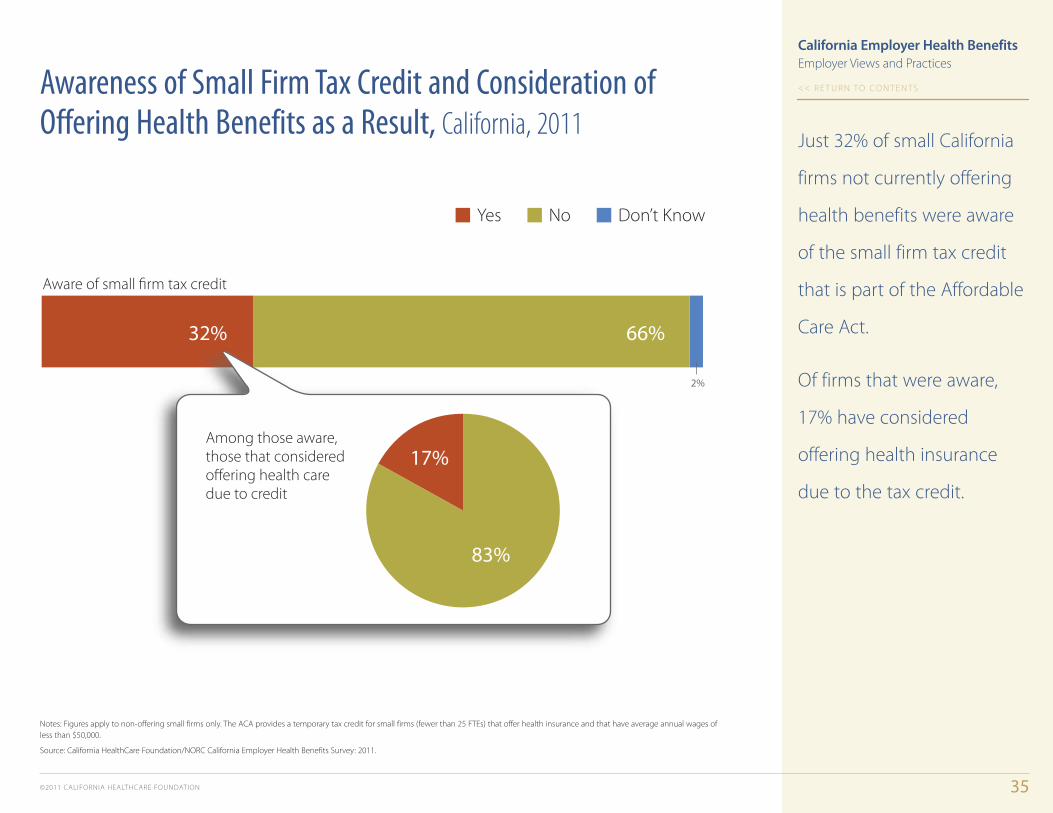
32% 66%
2%
83%
Among those aware,those that consideredo�ering health caredue to credit
17%
California Employer Health Benefits
notes: figures apply to non-offering small firms only. the aca provides a temporary tax credit for small firms (fewer than 25 ftes) that offer health insurance and that have average annual wages of less than $50,000.
source: california Healthcare foundation/norc california employer Health benefits survey: 2011.
Just 32% of small california
firms not currently offering
health benefits were aware
of the small firm tax credit
that is part of the affordable
care act.
of firms that were aware,
17% have considered
offering health insurance
due to the tax credit.
employer Views and Practices
Awareness of Small Firm Tax Credit and Consideration of Offering Health Benefits as a Result, California, 2011

©2011 California HealtHCare foundation 36
<< r e t u r n to Co n t e n t s
Yes No Not Sure Yet Don’t Know
Attempted to determine eligibility for small business tax credit
21% 67% 12%
Among �rms that attempted to determine eligibility,those that plan to take advantage ofthe tax credit
35%(neither year)
18%
46%(both 2010and 2011)
1%
California Employer Health Benefits
notes: this exhibit refers only to small firms offering health coverage. the aCa provides a temporary tax credit for small firms (fewer than 25 ftes) that offer health insurance and that have average annual wages of less than $50,000.
source: California HealthCare foundation/norC California employer Health Benefits survey: 2011.
twenty-one percent of
California firms with fewer
than 50 workers that offer
health benefits attempted
to determine whether their
firm was eligible for the
small business tax credit
to offset firms’ premium
contributions.
forty-six percent of those
firms that attempted
to determine eligibility
are planning on taking
advantage of the tax credit
for 2010 and 2011.
Small Firm Efforts to Determine Eligibility and Intention to Take Advantage of Tax Credit to Offset Premium Contributions, California, 2011
employer Views and Practices

©2011 california HealtHcare foundation 37
<< r e t u r n to co n t e n t s
0
20
40
60
80
100
Firms o�ering a�exible spending account*
Firms allowing employeesto use pre-tax dollars to pay premiums*
89%
53%
15%
52%
14%
71%
All Firms Small Firms Large Firms(3 to 199 workers) (200+ workers)
California Employer Health Benefits
Firms Allowing Employees to Use Pre-Tax Dollars to Pay Premiums or Offering a Flexible Spending Account, by Firm Size, California, 2011
slightly more than half of
california firms allowed
employees to use pre-tax
dollars to pay for health
insurance premiums.
large firms were significantly
more likely than small firms
to allow the use of pre-tax
dollars and to offer a flexible
spending account.
*estimates are significantly different between small firms and large firms.
source: california Healthcare foundation/norc california employer Health benefits survey: 2011.
employer Views and Practices
©2011 california HealtHcare foundation 38
<< r e t u r n to co n t e n t s
Large Firms(1,000+ workers)
Large Firms(200 to 999 workers)
Small Firms(50 to 199 workers)
Small Firms(3 to 49 workers)
All Firms
Firms with at Least One Grandfathered Plan Covered Workers in Grandfathered Plan
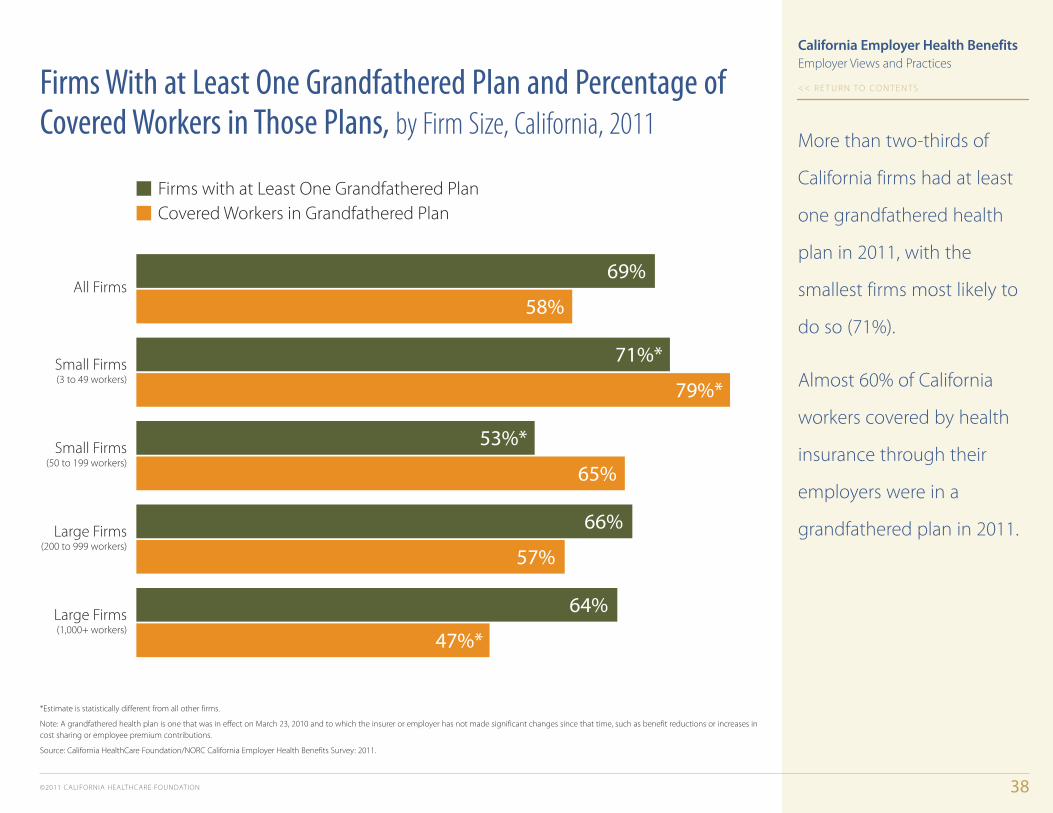
69%
58%
71%*
79%*
53%*
65%
66%
57%
64%
47%*
California Employer Health Benefits
*estimate is statistically different from all other firms.
note: a grandfathered health plan is one that was in effect on march 23, 2010 and to which the insurer or employer has not made significant changes since that time, such as benefit reductions or increases in cost sharing or employee premium contributions.
source: california Healthcare foundation/norc california employer Health benefits survey: 2011.
employer Views and Practices
more than two-thirds of
california firms had at least
one grandfathered health
plan in 2011, with the
smallest firms most likely to
do so (71%).
almost 60% of california
workers covered by health
insurance through their
employers were in a
grandfathered plan in 2011.
Firms With at Least One Grandfathered Plan and Percentage of Covered Workers in Those Plans, by Firm Size, California, 2011

©2011 california HealtHcare foundation 39
<< r e t u r n to co n t e n t s
Large Firms(1,000+ workers)
Large Firms(200 to 999 workers)
Small Firms(50 to 199 workers)
Small Firms(10 to 49 workers)
Small Firms(3 to 9 workers)
All Firms 38%
32%
32%
69%*
81%*
95%*
California Employer Health Benefits
*estimate is statistically different from all other firms.
source: california Healthcare foundation/norc california employer Health benefits survey: 2011.
thirty-eight percent of
california employers offering
health benefits enrolled
adult dependents who
would not previously have
been eligible for coverage
due to a provision of the
affordable care act.
the largest firms were
significantly more likely to
do so.
Firms that Enrolled Adult Dependents Up to Age 26, Who Would Not Previously Have Been Eligible, Through Their Parents’ Policy, by Firm Size, California, 2011
employer Views and Practices

©2011 california HealtHcare foundation 40
<< r e t u r n to co n t e n t s
Changes in care delivery and payment
Disease management program
Higher employee cost sharing
Consumer-driven health plans
Tighter managed care restrictions
Very Somewhat Not Too Not at All Don’t Know
18% 28% 15% 28% 11%
23% 22% 26% 22% 7%
17% 29% 22% 24% 9%
34% 26% 16% 13% 11%
20% 36% 19% 12% 13%
California Employer Health Benefits
california employers viewed
disease management
programs and changes in
care delivery and payment
as the most effective in
controlling health costs.
Employer Views of Effectiveness of Health Cost Control Measures, California, 2011
source: california Healthcare foundation/norc california employer Health benefits survey: 2011.
employer Views and Practices
©2011 California HealtHCare foundation 41
<< r e t u r n to Co n t e n t s
f o r m o r e i n f o r m at i o n
California HealthCare foundation
1438 Webster street, suite 400
oakland, Ca 94612
510.238.1040
www.chcf.org
norC at the university of Chicago
4350 east West Highway suite 800
Bethesda, Md 20814
301.634.9300
www.norc.org
California Employer Health Benefits
the California Employer Health Benefits Survey is a joint product of the
California HealthCare foundation (CHCf) and norC at the university of
Chicago (norC). the survey was designed and analyzed by researchers
at norC, and administered by national research llC (nr). the findings
are based on a random sample of 770 interviews with employee
benefit managers in private firms in California. nr conducted interviews
from July to october 2011. as with prior years, the sample of firms was
drawn from the dun & Bradstreet list of private employers with three or
more workers. the margin of error for responses among all employers
is +/– 3.5%; for responses among employers with 3 to 199 workers it
is +/– 4.8%; among employers with 200 or more workers it is +/– 5.3%.
some exhibits do not sum to 100% due to rounding effects.
the Kaiser family foundation sponsored this survey of California
employers from 2000 to 2003. a similar employer survey was also
conducted in 1999 in California, in conjunction with the Center for
Health and Public Policy studies at the university of California, Berkeley.
the Health research and educational trust (Hret) collaborated on
these surveys from 1999 to 2004. the Center for studying Health
system Change collaborated on these surveys from 2005 to 2006.
this survey instrument is similar to a national employer survey
conducted annually by the Kaiser family foundation and Hret. the
us results in this study either are from the published reports or, in a
few cases, from author calculations from the survey’s public use files. a
full analysis of the us dataset is available on the foundation’s website
at www.kff.org. Both the California and us surveys asked questions
about: Health Maintenance organizations (HMo), Preferred Provider
organizations (PPo), Point-of-service (Pos) plans, and High-deductible
Health Plan with a savings option (HdP). Conventional (fee-for-service)
plans are generally excluded from the plan type analyses because they
comprise such a small share of the California market.
Many variables with missing information were identified as needing
complete information within the database. to control for item non-
response bias, missing values within these variables were imputed
using a hot-deck approach. Calculation of the weights follows a
common approach. first, the basic weight is determined, followed by
a survey non-response adjustment. next, the weights are trimmed
in order to reduce the influence of weight outliers. finally, a post-
stratification adjustment is applied.
all statistical tests in this almanac compare either changes over time, a
plan-specific estimate with an overall estimate, or subcategories versus
all other firms (e.g., firms with 3 to 9 workers vs. all other firms). tests
include t-tests and chi-square tests and significance was determined at
p < 0.05 level. due to the complex nature of the design, standard errors
were calculated in sudaan.
An important note about the methodology: rates of change for
total premiums, for worker or employer contributions to premiums,
and other variables calculated by comparing dollar values in this report
to data reported in past CHCf or Kff publications should be used
with caution, due to both the survey’s sampling design and the way
in which plan information is collected. rates calculated in this fashion
not only reflect a change in the dollar values but also a change in
enrollment distribution, thus creating a variable enrollment estimate.
However, rates of change in premiums are collected directly as a
question in the California survey. this rate of change holds enrollment
constant between the current year and the previous year, thus creating
a fixed enrollment estimate. Because the survey does not collect
information on the rate of change in other variables, additional rates
are not reported. the national survey conducted by Kaiser/Hret,
however, stopped directly collecting rates of change in premiums in its
2008 survey. therefore, the rate of change in total premiums in the us
provided in this report uses a variable enrollment estimate.
Please note that due to a change in the post-stratification methods
applied in 2003, the survey data published in this almanac may vary
slightly from reports published prior to 2003.
Methodology