california energy commission research on · pdf filecalifornia energy commission research on...
TRANSCRIPT

CALIFORNIA ENERGY COMMISSION
RESEARCH ON METHANE EMISSIONS
FROM THE NATURAL GAS SYSTEM
California Methane Symposium
Los Angeles
March 12, 2015
Guido Franco
Team Lead for Environmental and Climate Research
California Energy Commission
1

Outline• Basic background information
• Description of past and on-going research supported by
the Energy Commission
• Energy policy relevant issues identified in the 2014
Update to the Integrated Energy Policy Report (IEPR).
• Some observations about the 2015 IEPR
2
Acknowledgment • Dr. Marc Fischer (LBNL/UC Davis) provided slides 9 and 10 that were modified by Mr. Franco to
avoid reporting confidential preliminary results for on-going research supported by the Energy
Commission. Kristen Driskell and Karen Griffin provided very useful comments to an earlier version
of this presentation.

Background
3
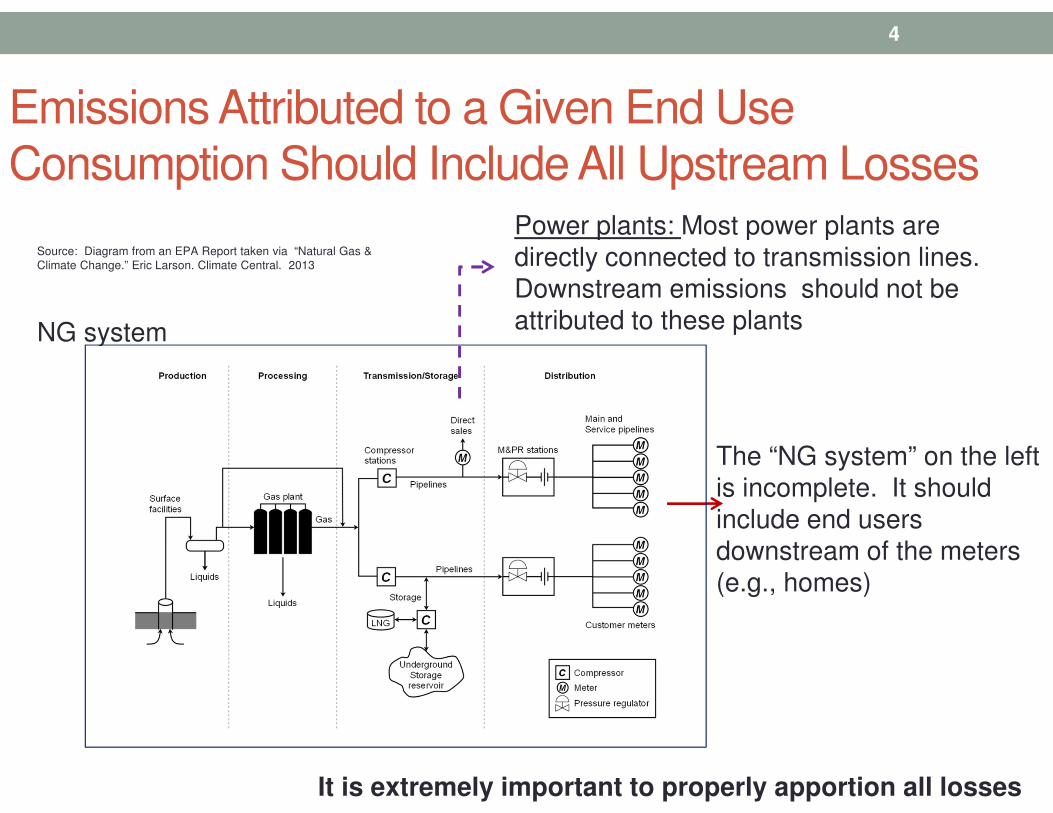
Emissions Attributed to a Given End Use
Consumption Should Include All Upstream Losses
4
The “NG system” on the left
is incomplete. It should
include end users
downstream of the meters
(e.g., homes)
Source: Diagram from an EPA Report taken via “Natural Gas &
Climate Change.” Eric Larson. Climate Central. 2013
4
Power plants: Most power plants are
directly connected to transmission lines.
Downstream emissions should not be
attributed to these plants
It is extremely important to properly apportion all losses
NG system

More than 90% of natural gas supply
imported into California • Imports to California
(% of total consumption in 2012)
• Canada 16%
• Southwest 35%
• Rocky Mountains 40%
• Blue numbers = “measured” leak rates as % of production
• From Alvarez et al., PNAS 2012
• For natural gas (CNG) to immediately reduce climate impacts from heavy-duty vehicles, well-to-wheels leakage must be reduced below 1%
• New natural gas power plants produce net climate benefits relative to efficient, new coal plants using 3.2% from well through delivery at a power plant
5
6 to 12 %
1 to 2 %
Percentages come from a February 18, 2015, AGU news release
U.S. Natural Gas Supply Basins Relative to Major Natural Gas Pipeline Transportation Corridors, 2008
? %
? %
San Juan Basin

San Juan Basin
• “Satellite data shows U.S. methane ‘hot spot’ bigger than expected” AGU 9 October 2014.
6
Kort
, E
. A
., e
t al.,
2014. F
our
Corn
ers
: th
e larg
est U
S m
eth
ane a
nom
aly
vie
wed f
rom
space. G
RL.
Vol41 I
ssue 1
9

Past and on-going research supported by
the Energy Commission
7

CEC started monitoring GHG in ambient
air in 2005• CALGEM project with LBNL demonstrated that methane and nitrous oxide emissions were most likely substantially higher than reported in the ARB inventory
• ARB and others are leading this effort now with additional measurement sites and new approaches
8
Source: CALGEM

Project with Fullerton State University
• Bottom-up field campaign (~2010) measuring emissions from thousands of different units representing different components (e.g., flanges)
• Most of the emissions come from “super-emitters”
• Similar results have been reported by others more recently
• “Super-emitters” can create huge problems for GHG inventories and for mitigation programs. A different approach is needed.
9
Leak-Rate Histogram of Flanges

On-going CEC research
• Holistic assessment to determine the main source of emissions (e.g., distribution network, wells) from the natural gas system (LBNL/UC Davis)
• Evaluation of opportunities to reduce methane emissions (LBNL)
• Using an airplane with a monitor for methane and ethane to detect leaks in remote locations
• Methane emissions from the residential sector (some measurements in Southern CA)
• Work done in coordination with ARB, NASA, NOAA, Utilities, and others.
10
SSJV Production
Delta Storage
Source: CEC project with LBNL/UC Davis

SF Bay Area Emissions
• Estimate CH4 emissions
CH4:CO correlations + CO
emission inventory
• Total CH4 1.5 – 2.0 x
BAAQMD Inventory
• AQ focused sites likely biased
toward CO emissions
• Future: expand w/ VOC
tracers to quantify NG
emissions from distribution
11
0
50
100
150
200
250
300
350
400
450
500
CH
4 e
mis
sio
ns (
Gg
CH
4/y
ear)
Napa
Fremont
San Jose
San Rafael
Pittsburg
Vallejo
Richmond
Concord
RedwoodCity
Santa Rosa
Livermore
SanFrancisco
Inventorych4*
Source: Fairley, D., Fischer, M.L., Top-Down Methane Emissions
Estimates for the San Francisco Bay Area from 1990 to 2012,
Atmospheric Environment (2015), doi: 10.1016/j.atmosenv.2015.01.065.

Local Measurements: LBNL Mobile
Plume Integration System
• Cross-wind integral of CH4
enhancement flux quantifies plume emissions
• Samples to 8 magl
• Multi-analyzer system (w/ 13C)
• Anemometry for mean winds &
turbulence
• Recent system developments
• Tests at LBNL and PG&E test
facilities show ability to capture
plumes
• Test measurements show
capability to capture unknown
emissions
12
Wind
direction
Sourc
e: C
EC
pro
ject w
ith L
BN
L

Subsidence
• The drought is severely increasing land subsidence
• Is subsidence in the Central Valley degrading the physical integrity of abandoned wells? We don’t know
• LBNL is conducting some exploratory measurements
13
Protruded Well
Source: DWR 2014

Future CEC Projects
14
February 2015

CEC studies that will start in the near
future [request for proposals late this year]
• Estimating emissions from buildings, power plants, industrial
facilities (downstream of the meters)
• More in-depth studies (e.g., abandoned wells). The results of
the on-going studies will determine the course to take.
Preliminary results are percolating and most of the work will
be done by late this summer
• Options to reduce methane emissions
15
Integrated Energy Policy Report
(IEPR)
16

2014 Integrated Energy Policy Report
Update• Super emitters create huge challenges for bottom-up
inventories because it almost requires testing all components of the natural gas system to ensure that all super emitters are identified
• Emissions can be sporadic, and testing done at discrete times may or may not capture these emissions
• Emissions estimates for California exclude emissions that occur at fuel stages, such as extraction and fuel processing, that take place outside the state. From an energy policy perspective, however, all emissions from “well-to-wheel” are important.
• Some studies report emissions from associated gas (gas from wells that produce both crude oil and natural gas) as being part of the natural gas system. How to apportion these emissions?
17

2015 Integrated Energy Policy Report
• The Energy Commission will continue to develop the
report required by Assembly Bill 1257 (Bocanegra,
Chapter 749, Statues of 2013) as part of the 2015 IEPR.
• The AB 1257 report will include an assessment of the
benefits and environmental impacts of natural gas as an
energy source for both electricity, transportation, and
residential use.
• To develop the information necessary for this report, the
Energy Commission will hold public IEPR workshops to
assess the state of the science on methane emissions
from the natural gas system.
18

19
19
Thank you!
DISCLAIMER
A staff member of the California Energy Commission prepared this
presentation. As such, it does not necessarily represent the views of the
Energy Commission, its employees, or the State of California. The Energy
Commission, the State of California, its employees, contractors and
subcontractors make no warrant, express or implied, and assume no legal
liability for the information in this presentation; nor does any party represent
that the uses of this information will not infringe upon privately owned rights.
This presentation has not been approved or disapproved by the Energy
Commission nor has the Commission passed upon the accuracy or adequacy
of the information in this presentation.
Panchito Franco