california department of water resources · 30/09/2010 · before ab1x, dwr actively traded energy...
TRANSCRIPT

California Department of Water ResourcesB k M tiBank Meeting
Power Supply Revenue Bond Update
June 30, 2010

Participants
Russell Mills, Department of Water Resources, Financial Management
Jeanne Trujillo, California State Treasurer’s Office
Doug Montague, Montague DeRose and Associates, LLC
James Bemis, Montague DeRose and Associates, LLC
Frank Perdue, Montague DeRose and Associates, LLC
Kreg McCollum, Navigant Consulting
Bruce Van Dusen, Hawkins Delafield & Wood LLP
Stan Dirks, Orrick, Herrington & Sutcliffe LLP
Tim Self, JPMorgan Chase
2

Agenda
I. Meeting Objective
II B k dII. Background
III. 2011 Revenue Requirement
IV Ad f RIV. Adequacy of Reserves
V. Gas Price Update
VI P S l C t tVI. Power Supply Contracts
VII. Bond Summary
VIII L i l ti d R l t U d tVIII. Legislative and Regulatory Update
IX. Summary
3

I. Meeting Objective
4

Meeting Objective
In May 2010, the Department restructured a significant piece of its variable rate portfolioportfolio
• $2.679 billion of variable rate debt was restructured with fixed rate bonds
• $2.005 billion of variable rate debt is currently outstanding
A i t l $1 344 billi i l tt f dit d li idit f iliti i ti Approximately $1.344 billion in letters of credit and liquidity facilities in connection with the Department’s remaining variable rate debt expire by December 2010, with the balance expiring in 2011 and 2012
In July 2010, the Department will be soliciting proposals and bids for replacement J y , p g p p pletter of credit facilities for the facilities expiring in 2010
5

II. Background
6

California’s 2000-01 Energy Crisis
California deregulated its energy markets in 1996; but provided for a transition period in which IOU rates continued to be frozen
The supply and demand relationship for electricity in California became out of balance, as supply barely increased (1,196 MW in new generation from 1996-2000) while demand rose steadily (6,573 MW rise in peak demand from 1996-2000)
As revenues became insufficient to cover utilities’ rising power costs IOUs’ credit As revenues became insufficient to cover utilities rising power costs, IOUs credit quality fell below investment grade, and generators and fuel suppliers would not sell to utilities
The State of California stepped in and, through legislation enacted in January 2001 (AB1X) d h D f W R h b f l f h (AB1X), made the Department of Water Resources the buyer of last resort for the State’s energy needs
Before AB1X, DWR actively traded energy in California’s energy markets, and as owner/operator of State Water Project, DWR is the single largest user of electricity in / p j , g g yCalifornia
California Energy Resources Scheduling was established in 2001 to manage DWR’s responsibilities under AB1X
7

Summary of AB 1X
Passed in January 2001 to implement the State’s strategy to stabilize power markets
Authorized DWR to negotiate and enter into long-term power supply contracts with independent producers
Authorized issuance of revenue bonds to fund power purchases and to cover the St t ’ h tf ll i th k t til i t biliState’s revenue shortfalls in the market until prices stabilize
Authorized DWR to impose a Revenue Requirement sufficient to cover debt service on the bonds and payments under DWR’s power purchase and fuel purchase agreementsg
CPUC was authorized to set retail rates to allocate DWR’s revenue requirement and to enter into a Rate Agreement relating to DWR’s power purchase program
DWR retains title to all power sold and all associated revenues but was authorized to DWR retains title to all power sold and all associated revenues, but was authorized to enter into service agreements with the IOUs for distribution and billing services
DWR can collect power charges as long as it is providing power and bond charges as long as bonds are outstanding
8

Description of Key Rate Agreement Provisions
Agreement to set charges to facilitate cost recovery
Consistent with priority provisions of long term power contracts Consistent with priority provisions of long-term power contracts
Establishes separate Power Charges and Bond Charges
Power Charges are based on DWR power delivered
Bond Charges are based on all power delivered to customers in the IOU service area (even after DWR is no longer delivering power)
CPUC Covenants: CPUC Covenants:
• Irrevocably to impose Bond Charges sufficient to provide for the timely payment of debt service and other bond related costs (including prefunding of bond accounts), whether or not DWR files a revenue requirement
T i P Ch ffi i i f DWR “ il • To impose Power Charges sufficient to satisfy DWR “retail revenue requirements” for power, fuel and related costs
• To impose charges within no greater than 120 days of delivery of a revenue requirement filing
9

Flow of Revenues under the Indenture
d
BondCharge
Revenues
PowerCharge
Revenues
Operating Account
PriorityContract A t
Bond Charge CollectionAccount
Bond ChargePaymentAccountAccount
PriorityContract
Costs Bond Related Costs
other than
Account
Fiduciary Costs
Fiduciary Costs
Debt Service Reserve Account
Other OperatingExpenses
OperatingReserveAccount
Source of Revenues
Contingent flow of funds
Expected flow of funds
10
Accounts
Payments
Contingent flow of funds
Replenishment of Accounts (if necessary)
III. 2011 Revenue Requirement
11

2011 Revenue Requirement Process – Anticipated Schedule
2010April
May
June
- Coordinate with IOUs on key assumptions
- Preliminary market modeling and simulation
- Review IOU and CPUC input
June/July
August
September
- Begin public comment process June 9, 2010
- Submit revenue requirement to CPUC August 5, 2010
- Update gas price forecast September 30 2010 September
October
November
- Update gas price forecast September 30, 2010
- Provide updated gas forecast and actual operating resultsto CPUC October 15, 2010
December - CPUC allocation decision December 2, 2010
12

Power Charge Revenue Requirement On the basis of actual results to date and adjusted projections, the Department projects
that it will end 2010 with approximately $60 million more in the Operating Account than projected in the 2010 Revenue Requirement, primarily due to lower gas prices
Two factors explain the $936 million decrease in power costs from 2010 to 2011: Two factors explain the $936 million decrease in power costs from 2010 to 2011:
• Gas prices are projected to average about $1/MMBtu less in 2011 compared to 2010
• A number of large power supply contracts expire at the end of 2010 and during 2011
Power charges averaged $89/MWh in 2009, $60/MWh in 2010 and are projected to average $34/MWh in 2011
Summary of Retail Power Revenue Requirements$ illi
Description 2011 2010 DifferenceSources of Funds
Revenue from Customers $904 $2,126 ($1,222)Off System Sales and Other Revenue 0 0 0Interest 6 13 (6)
Total Sources to Service Costs1 $910 $2 139 ($1 228)
$ millions
Total Sources to Service Costs $910 $2,139 ($1,228)
Uses of FundsPower Costs $1,872 $2,809 ($936)General and Administrative Expenses 27 27 (0)Change in Operating Balances (989) (698) (291)
Total Uses of Funds1 $910 $2,139 ($1,228)
13
1May not match due to rounding.

Bond Charge Revenue Requirement
The 2011 Revenue Requirement projects interest rates for its unhedged variable rate bonds at 4.423% compared to 5.713% that was projected in the 2010 Revenue Requirement
B d h i i k j i i h l i i l l d Bond charge revenue receipts continue to track projections given the low variance in total load
Bond charges averaged $4.91/MWh in 2009, $5.15/MWh in 2010 and are projected to average $5.15/MWh in 2011
Description 2011 2010 DifferenceSources of Funds
Revenue from Customers $889 $896 ($8)Interest 22 26 (4)
Summary of Retail Bond Revenue Requirements$ millions
Interest 22 26 (4)Total Sources to Service Costs1 $911 $923 ($11)
Uses of FundsDebt Service $919 $951 ($32)Change in Bond Account Balances (7) (28) 21
Total Uses of Funds1 $911 $923 ($11)Total Uses of Funds $911 $923 ($11)
1May not match due to rounding.
14

IV. Adequacy of Reserves
15

Stress Cases Used to Evaluate the Adequacy of Reserves
The Sensitivity Cases evaluated are consistent with stressors used in the 2005 through 2010 Filings
Case 1 - Reduced Demand Sensitivity
• Increased natural gas prices (three standard deviations from base case levels)
• Reduced customer demand and energy requirementsgy q
• Increased hydroelectric production due to higher than normal precipitation
Case 2 - Increased Demand Sensitivity
• Increased natural gas prices (three standard deviations from base case levels)• Increased natural gas prices (three standard deviations from base case levels)
• Increased customer demand and energy requirements
• Reduced hydroelectric production due to lower than normal precipitation
• Large unscheduled outages of base load IOU resources• Large unscheduled outages of base load IOU resources
16
Revenue Requirement Reserve Summary - Power
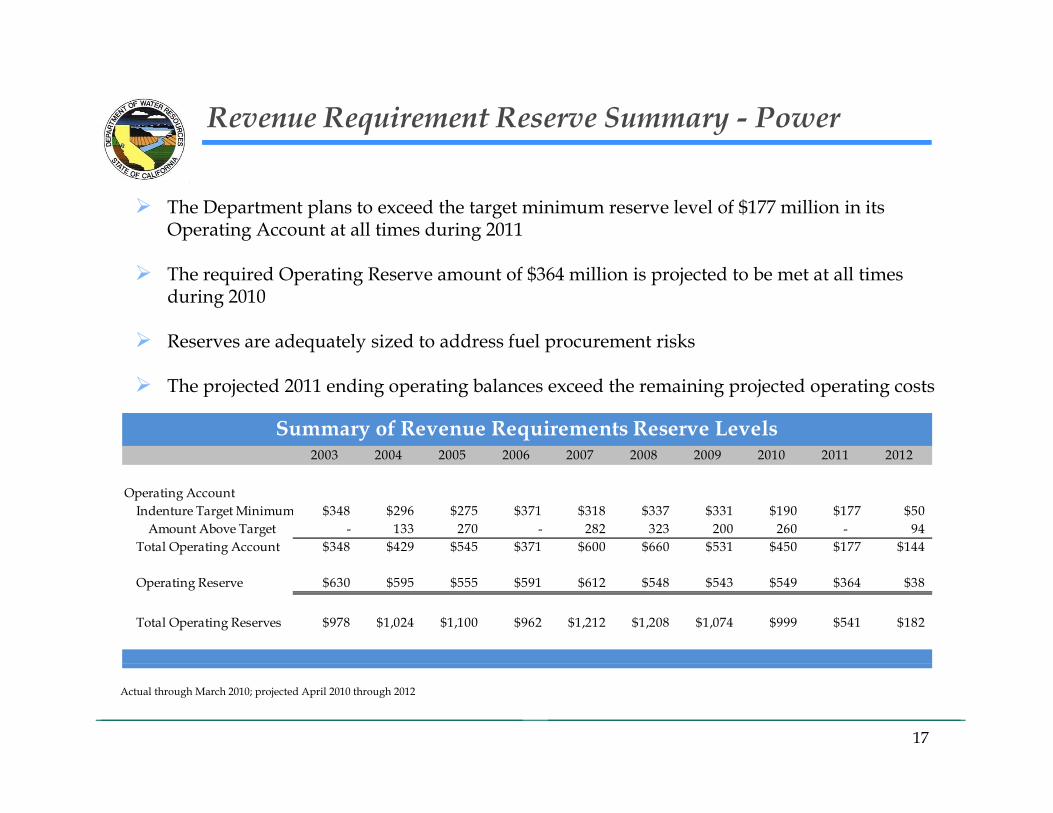
The Department plans to exceed the target minimum reserve level of $177 million in its Operating Account at all times during 2011
The required Operating Reserve amount of $364 million is projected to be met at all times during 2010
Reserves are adequately sized to address fuel procurement risks
The projected 2011 ending operating balances exceed the remaining projected operating costs
2003 2004 2005 2006 2007 2008 2009 2010 2011 2012
Summary of Revenue Requirements Reserve Levels2003 2004 2005 2006 2007 2008 2009 2010 2011 2012
Operating AccountIndenture Target Minimum $348 $296 $275 $371 $318 $337 $331 $190 $177 $50
Amount Above Target - 133 270 - 282 323 200 260 - 94 Total Operating Account $348 $429 $545 $371 $600 $660 $531 $450 $177 $144
Operating Reserve $630 $595 $555 $591 $612 $548 $543 $549 $364 $38
Total Operating Reserves $978 $1,024 $1,100 $962 $1,212 $1,208 $1,074 $999 $541 $182
17
Actual through March 2010; projected April 2010 through 2012

Revenue Requirement Reserve Summary - Bond
The Department plans to exceed the target minimum level in its Bond Accounts by $75 million at all times during 2011
The required Debt Service Reserve amount of $948 million is met at all times during 2011
The Bond Charge Payment Account minimum (3 months accrued and unpaid debt service) and the Bond Charge Collection Account minimum (1 month accrued and unpaid debt service) along with the Debt Service Reserve Account provides 16 months of debt service coverage
2003 2004 2005 2006 2007 2008 2009 2010 2011 2012
Summary of Revenue Requirements Bond Reserve Levels
Bond Charge Collection AccountIndenture Target Minimum $41 - $76 $75 - $78 $76 - $78 $75 - $80 $76 - $78 $78 - $80 $78 - $80 $79 - $81 $77 - $89 $59 - $80
Amount Above Target 36 37 82 92 46 94 78 96 78 63Total BCC Amount 77-112 111-114 158-160 166-171 121-123 171-173 156-158 174-176 155-167 122-143
Bond Charge Payment Account $140 - $442 $300 - $702 $237 - $834 $228 - $835 $318 - $810 $324 - $825 $328 - $873 $330 - $905 $405 - $875 $361 - $775
Actual through March 2010; projected April 2010 through 2012
g yDebt Service Reserve 927 927 927 913 930 937 950 959 940 948
Total Bond Reserves 1144-1481 1338-1743 1322-1921 1307-1919 1369-1863 1432-1935 1434-1981 1463-2040 1500-1982 1424-1859
18
g ; p j p g

Energy Costs and Cash Reserves
5,000
Energy Cost vs. Cash Reserves
3 000
3,500
4,000
4,500
1 500
2,000
2,500
3,000
($ M
illio
ns)
500
1,000
1,500
The ratio of projected operating reserves to projected energy costs is 0.63% in 2010, 0.51% in 2011 and 100% in 2012
-
2004 2005 2006 2007 2008 2009 2010 2011 2012 2013 2014Operating Account Operating Reserves Operating Costs
19
Note: All projections assume annual calculation of revenue requirements in accordance with current practices. Actual through March 2010; projected April 2010 through 2014

Debt Service and Cash Reserves
Bond Costs vs. Cash Reserves
2,000
1,400
1,600
1,800
800
1,000
1,200
($ M
illio
ns)
200
400
600
-
2004 2005 2006 2007 2008 2009 2010 2011 2012 2013 2014Debt Service Reserve Account Balance Bond Charge Accounts BalanceDebt Service Costs
20
Note: Operating Account Balances are the average for the year. Actual through March 2010; projected April 2010 through 2014

DWR’s Combined Reserve Summary
The Department’s aggregate reserves were over $2.7 billion at all times in 2010
Projected reserves are more than adequate relative to DWR’s costs and ongoing risk profile Projected reserves are more than adequate relative to DWR s costs and ongoing risk profile
3,500
2,000
2,500
3,000
lions
)
BCC Target Minimum
BCC Above Target
BCP
DSR
500
1,000
1,500
($ M
ill DSR
OA Target Minimum
OA Above Target
OR
-2003 2004 2005 2006 2007 2008 2009 2010 2011 2012
Year
Actual through March 2010; projected April 2010 through 2012
21

V. Gas Price Update
22

How DWR Uses Gas Prices
DWR uses a monthly gas price forecast for three primary purposes in determining itsits revenue requirement
f f f h d l l h d h ll• Prices are a significant factor for the production simulation analysis that dispatches all resources across the western electricity grid and determines cost of projected DWR contract dispatch
• Prices are used to adjust expected DWR contract costs for the remainder of 2010 potentially lt i th t d f d b l t th b i i f 2011altering the expected fund balances at the beginning of 2011
• Prices are used to adjust costs related to the mark-to-market of ISDA contracts and financial positions
DWR thl i th t b d 10 d f NYMEX f t t t i DWR uses monthly prices that are based on a 10-day average of NYMEX futures contract prices through June of the year following the revenue requirement period (e.g. June 2012 for the 2011 revenue requirement)
In the spring of each year, DWR prepares a gas price forecast that is provided to the IOUs for p g y p p g p pinitial review
DWR updates its forecast of gas prices at the end of September each year
23

Current Gas Price Projections
2011 gas prices are $0.97/MMBtu lower than those projected in the 2010 Revenue R iRequirement
The beneficial effects of lower actual gas prices for 2010 result in higher than projected fund balances
2010 Revenue Requirement Forecast
2011 Revenue Requirement Forecast Difference
Southern PG&E
Southern PG&E
Southern PG&E
Period Henry Hub California Border
PG&E CityGate
Henry Hub California Border
PG&E CityGate
Henry Hub California Border
PG&E CityGate
$/MMBtu $/MMBtu $/MMBtu $/MMBtu $/MMBtu $/MMBtu $/MMBtu $/MMBtu $/MMBtu
2011 $6.46 $6.19 $6.31 $5.49 $5.31 $5.76 $0.97 $0.88 $0.55
2012 $5 36 $5 14 $5 19 $5 69 $5 66 $6 00 ($0 33) ($0 53) ($0 81)2012 $5.36 $5.14 $5.19 $5.69 $5.66 $6.00 ($0.33) ($0.53) ($0.81)
24
Fuel Summary
20,000
25,000
tu)
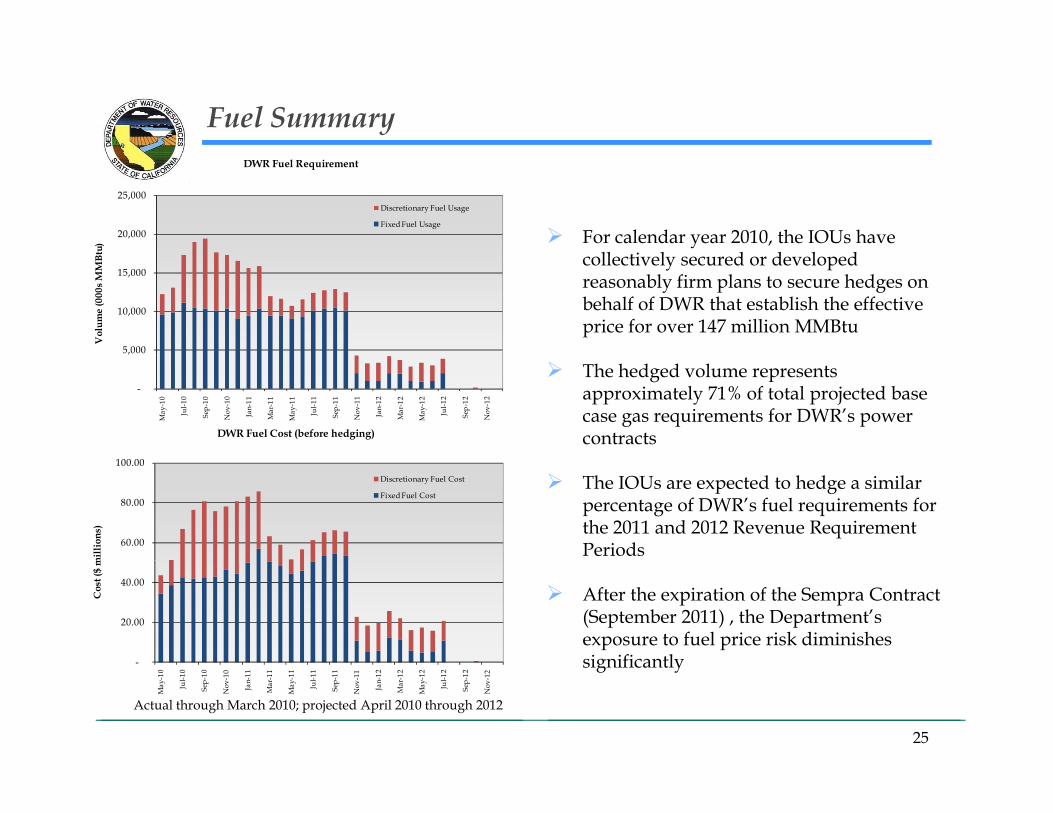
DWR Fuel Requirement
Discretionary Fuel Usage
Fixed Fuel Usage
For calendar year 2010, the IOUs have ll i l d d l d
5,000
10,000
15,000
Vol
ume
(000
s MM
Bt collectively secured or developed reasonably firm plans to secure hedges on behalf of DWR that establish the effective price for over 147 million MMBtu
-
May
-10
Jul-1
0
Sep-
10
Nov
-10
Jan-
11
Mar
-11
May
-11
Jul-1
1
Sep-
11
Nov
-11
Jan-
12
Mar
-12
May
-12
Jul-1
2
Sep-
12
Nov
-12
DWR Fuel Cost (before hedging)
The hedged volume represents approximately 71% of total projected base case gas requirements for DWR’s power contracts
60.00
80.00
100.00
mill
ions
)
Discretionary Fuel Cost
Fixed Fuel Cost The IOUs are expected to hedge a similar
percentage of DWR’s fuel requirements for the 2011 and 2012 Revenue Requirement Periods
-
20.00
40.00
Cos
t ($
m
After the expiration of the Sempra Contract (September 2011) , the Department’s exposure to fuel price risk diminishes significantly-
May
-10
Jul-1
0
Sep-
10
Nov
-10
Jan-
11
Mar
-11
May
-11
Jul-1
1
Sep-
11
Nov
-11
Jan-
12
Mar
-12
May
-12
Jul-1
2
Sep-
12
Nov
-12
25
significantly
Actual through March 2010; projected April 2010 through 2012

VI. Power Supply Contracts
26

Long-Term Power Supply Contract Summary
Contract Type Fuel Tolling Origin of Deliveries 2010 2011 2012 2013 2014 2015
Capacity (MW)
Calpeak Dispatchable Yes Generator-specific 260 260 - - - - Calpine 1 Must-take No Market - - - - - - Calpine 2 Must-take No Market 180 180 180 - - - Calpine 3 Dispatchable Yes Generator-specific 495 495 - - - - Colton Dispatchable Yes Generator-specific 80 - - - - - Colton Dispatchable Yes Generator specific 80 Coral Must-take Yes Market 925 595 595 - - - Power Receivables Finance Must-take No Market 800 800 - - - - GWF Dispatchable Yes Generator-specific 362 362 171 - - - High Desert Dispatchable Yes Generator-specific 840 840 - - - - Kings River Dispatchable Yes Generator-specific 96 96 96 96 96 96 g p pIberdrola Renewables Dispatchable Yes Market 300 300 - - - - PG&E Energy Trading-wind As-Avail No Generator-specific 30 30 - - - - Sempra Must-take Yes Market 1,600 1,600 - - - - Sunrise Dispatchable Yes Generator-specific 581 581 581 - - - Wellhead Dispatchable Yes Generator-specific 118 118 - - - - JPM Energy ABC Must-take No Market 325 - - - - - JPM Energy D Dispatchable Yes Generator-specific 1,045 - - - - - Shell Cabazon Wind No Generator-specific 29 29 29 30 - - Shell Whitewater-wind As-Avail No Generator-specific 44 44 45 45 - -
Total Capacity1 8,109 6,329 1,697 171 96 96
27
1. Average Summer Peaking Capacity
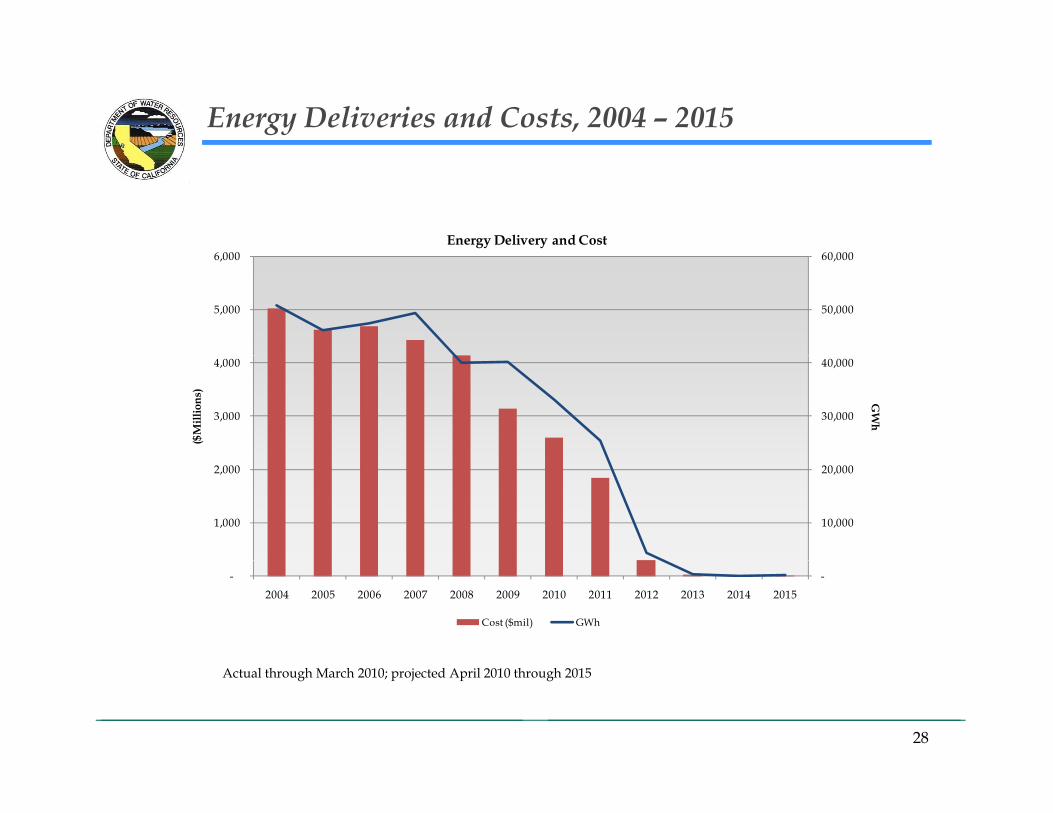
Energy Deliveries and Costs, 2004 – 2015
60 000 6 000 Energy Delivery and Cost
50,000
60,000
5,000
6,000
30,000
40,000
3,000
4,000
GW
h
($M
illio
ns)
10,000
20,000
1,000
2,000
--2004 2005 2006 2007 2008 2009 2010 2011 2012 2013 2014 2015
Cost ($mil) GWh
28
Actual through March 2010; projected April 2010 through 2015

VII. Bond Summary
29

Power Bond Credit Ratings History
The Power Bonds have received numerous credit rating upgrades since 2002:
Ratings History for DWR’s Power Supply Revenue Bonds
Date Moody’s S&P Fitch
Current Aa3 AA- AA-
2008 Aa3 A+ A+2008 Aa3 A+ A+
2007 Aa3 A A
2006 A1 A- A
2005 A2 BBB+ A2005 A2 BBB A
2004 A2 BBB+ A-
2003 A3 BBB+ A-
2002 A3 BBB+ A-
30

Power Bond Summary
In May 2010, the Department issued an aggregate principal amount of over $2.9 billion for purposes of:
• Reducing DWR’s exposure to market uncertainties and expenses related to variable rate debt
• Achieving debt service savings by the issuance of fixed rate refunding bonds for the purpose of refunding a portion of its outstanding fixed rate bonds
• The resulting portfolio is shown below:
Description Fixed Rate Variable Rate Total
Power Bond Portfolio Summary
Series A $1,590,195,000 - $1,590,195,000Series B - 30,000,000 30,000,000 Series C - 1,346,200,000 1,346,200,000 Series F 348,130,000 - 348,130,000 Series G 173,000,000 410,300,000 583,300,000 Series H 1,006,510,000 - 1,006,510,000 Series I - - - Series J - 218,500,000 218,500,000 Series K 279,250,000 - 279,250,000 Series L 2,992,540,000 - 2,992,540,000
$6 389 625 000 $2 005 000 000 $8 394 625 000
31
$6,389,625,000 $2,005,000,000 $8,394,625,000

Power Bond Summary
California Department of Water Resources -Power Revenue Bonds
$
$900,000,000
$1,000,000,000
Power Revenue BondsOutstanding Debt Service
$500,000,000
$600,000,000
$700,000,000
$800,000,000
$200,000,000
$300,000,000
$400,000,000
$0
$100,000,000
2010 2011 2012 2013 2014 2015 2016 2017 2018 2019 2020 2021 2022
Fixed Rate Debt Service Variable Rate Debt Service
32

Power Bond Summary, Continued
The Department currently has $6.4 billion of fixed rate bonds outstanding, $1.05 i i l
Portfolio Detailsof fixed rate bonds outstanding, $1.05 billion of hedged variable rate bonds outstanding and $952 million of un-hedged variable rate bonds outstanding
Th j t d i t t t f ll
Description Total
Fixed Rate Bonds $6,389,625,000Variable Rate Bonds 2,005,000,000 Bonds $8,394,625,000
The projected average interest rate for all fixed rate bonds for the 2011 Revenue Requirement Period is 4.948%
The projected average interest rate for all
SIFMA Swaps $151,900,000LIBOR Swaps 901,000,000 Swaps $1,052,900,000
Hedged VRDO Bonds $1,052,900,000p j ghedged variable rate bonds (taking into account the hedges) is 4.060%
For the 2011 Revenue Requirement Period on the basis of the calculation
Unhedged VRDO Bonds $952,100,000% of Debt Not Fixed or Hedged 11.342%
Period, on the basis of the calculation requirements in the indenture, the projected interest rate on unhedged variable rate bonds is 4.423%
33

Near-Term Debt Restructuring Plans
DWR has $1.34 billion of bank facilities scheduled to expire by December 1, 2010
DWR is considering selected renewals of credit enhancement facilities and possible fixed-rate b d k dd l f bl b d f d hbond issuances to take out additional portions of its variable rate bonds if credit enhancement facilities are not renewed
PAR
INSTITUTIONFORM OF CREDIT
SERIESPAR
AMOUNT (000s)
EXPIRATION DATE
Bank of New York LOC 2002B-1 3,750$ 11/30/2010CalSTRS LOC 2002B-1 1,250$ 11/30/2010State Street Bank LOC 2002B-6 25,000$ 11/30/2010Dexia Credit, NY LOC 2002C-1 233,000$ 11/30/2010
INSTITUTIONFORM OF CREDIT
SERIESPAR
AMOUNT (000s)
EXPIRATION DATE
Lloyds TSB Bank LOC 2005G-2 6,200$ 12/1/2010Bank of Nova Scotia Liq Agrmt 2005G-5 50,000$ 12/1/2010Fortis Bank Liq Agrmt 2005G-5 150,000$ 12/1/2010Calyon Liq Agrmt 2005G-6 58,491$ 12/1/2010, , / /
Landesbank HTG LOC 2002C-10 15,400$ 11/30/2010Bank of Nova Scotia LOC 2002C-11 25,000$ 11/30/2010KBC LOC 2002C-11 75,000$ 11/30/2010West LB AG LOC 2002C-14 87,100$ 11/30/2010Bank of New York LOC 2002C-17 25,000$ 11/30/2010CalSTRS LOC 2002C-4 61,725$ 11/30/2010JP Morgan Chase LOC 2002C 4 185 175$ 11/30/2010
Societe Generale Liq Agrmt 2005G-6 28,809$ 12/1/2010CALPERS LOC 2008J-1 5,891$ 4/15/2011JP Morgan Chase LOC 2008J-1 19,610$ 4/15/2011Bank of Nova Scotia LOC 2008J-2 48,250$ 4/15/2011CALPERS LOC 2008J-2 48,250$ 4/15/2011JP Morgan Chase LOC 2008J-2 96,500$ 4/15/2011Dexia Credit NY Liq Agrmt 2002C 13 31 933$ 11/30/2012JP Morgan Chase LOC 2002C-4 185,175$ 11/30/2010
Dexia Credit, NY LOC 2002C-5 50,000$ 11/30/2010Bayerische LB LOC 2002C-8 123,800$ 11/30/2010Citibank LOC 2002C-9 122,400$ 11/30/2010Bank of Nova Scotia LOC 2005G-1 16,800$ 12/1/2010
Dexia Credit, NY Liq Agrmt 2002C-13 31,933$ 11/30/2012Dexia Credit, Paris Liq Agrmt 2002C-13 63,867$ 11/30/2012Dexia Credit, NY Liq Agrmt 2002C-7 82,267$ 11/30/2012Dexia Credit, Paris Liq Agrmt 2002C-7 164,533$ 11/30/2012JP Morgan Chase LOC 2005G-3 100,000$ 12/1/2012
34

Swap Portfolio Summary (5-31-10)
Aggregate negative mark-to-market value of about $78 million • 7.45% of outstanding swap notional• 0.93% of total outstanding Power Bond debt
If the Department were to terminate the swaps it has alternatives to pay for any potential unwind costs
• Bond fund termination paymentsBond fund termination payments• Cash fund termination payments with any excess amounts in Bond Charge Accounts• DWR also has right to pay any unwind payments in 11 equal quarterly installments,
rather than in lump sum Lower interest rates on fixed-rate take-out bonds compared to all-in synthetic fixed rate
bond costs would offset to some degree increase in debt required to fund the unwind payments
Swap Portfolio SummaryOutstanding Call Current Prior Q Change Fixed Floating Floatingg Q g g g
Swap Name Counterparty Balance Maturity Date MTM MTM MTM Leg Leg 1 % Index 1
2002 Libor 3 Bayerische Landesbank $174,200,000 5/1/2015 n/a ($14,621,618) ($15,984,980) $1,363,362 3.2800% 67.0000% 1M Libor2002 SIFMA 1 JP Morgan Chase 92,089,000 5/1/2013 n/a (3,169,641) (5,267,763) 2,098,122 3.4050% 100.0000% SIFMA2002 SIFMA 2 Morgan Stanley 46,044,000 5/1/2013 n/a (1,584,824) (2,633,892) 1,049,068 3.4050% 100.0000% SIFMA2002 SIFMA 3 Merrill Lynch 13,767,000 5/1/2013 n/a (473,862) (787,527) 313,665 3.4050% 100.0000% SIFMA2005 Libor 1 Depfa Bank 241 500 000 5/1/2015 n/a (16 753 655) (19 372 180) 2 618 525 3 1840% 66 5000% 1M Libor
35
2005 Libor 1 Depfa Bank 241,500,000 5/1/2015 n/a (16,753,655) (19,372,180) 2,618,525 3.1840% 66.5000% 1M Libor2005 Libor 2 BNP Paribas 485,300,000 5/1/2016 n/a (41,833,123) (43,760,318) 1,927,195 3.2277% 66.5000% 1M Libor
$1,052,900,000 ($78,436,723) ($87,806,660) $9,369,937
VIII. Legislative and Regulatory Update
36

Summary of Senate Bill 695
SB 695 was enacted to avoid a significant one-time rate increase on residential baseline customers – baseline residential customers have been exempted from rate increases since 2001 until the Department had recovered the cost of power purchased on behalf since 2001 - until the Department had recovered the cost of power purchased on behalf of its customers
Allows the PUC to increase residential customer rates for usage up to 130% baseline quantities by the annual percentage change in the CPI from the prior year plus 1% (not less than 3% and not more than 5% per year)
Allows the CPUC to allocate the Department’s and the IOUs' revenue requirements so that cost increases since the beginning of 2001 are spread over a larger customer base
SB 695 authorizes a limited opening – up to a maximum allowable limit – of direct access for nonresidential end-use customers that commences immediately and will phase in over a period of three to five years, subject to a total energy (kWh) limit
If h i ll bl li i f di l d i h d i ll h i If the maximum allowable limit of direct access load is reached in all three service areas, the total percentage of IOU retail load attributable to direct access customers would increase from 9.3% to approximately 14.1%
37

IX. Summary
38
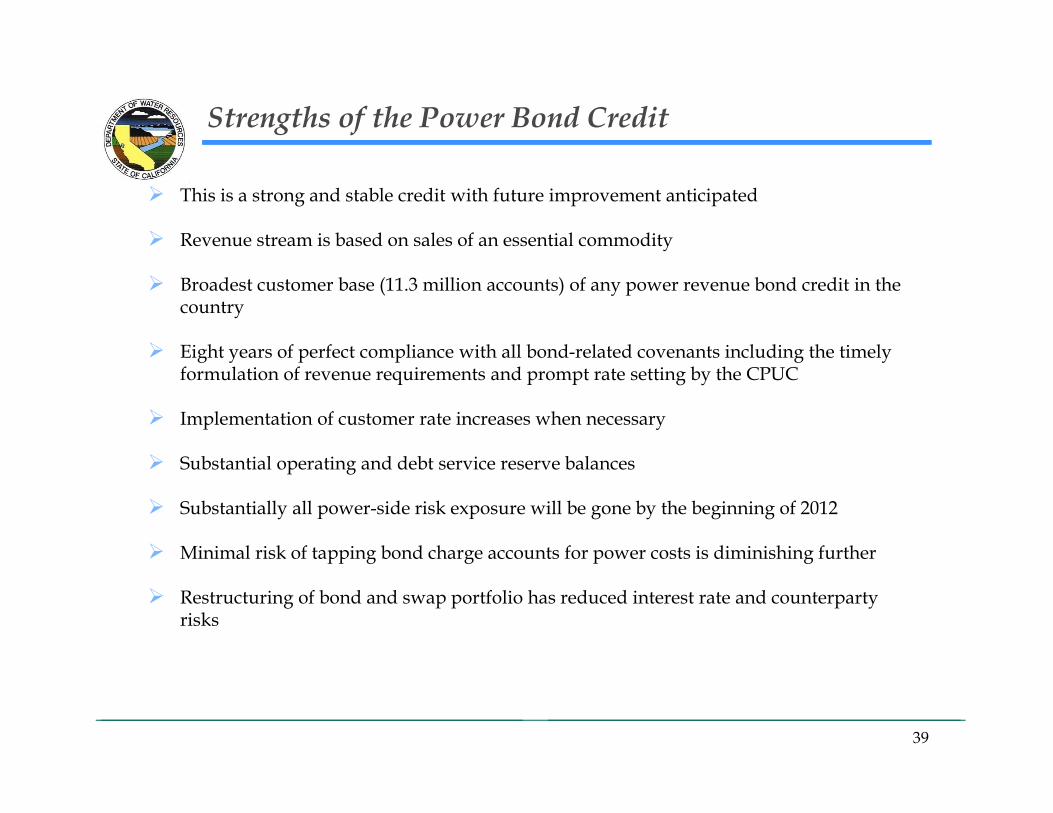
Strengths of the Power Bond Credit
This is a strong and stable credit with future improvement anticipated
Revenue stream is based on sales of an essential commodity
Broadest customer base (11.3 million accounts) of any power revenue bond credit in the country
Eight years of perfect compliance with all bond-related covenants including the timely Eight years of perfect compliance with all bond related covenants including the timely formulation of revenue requirements and prompt rate setting by the CPUC
Implementation of customer rate increases when necessary
S b t ti l ti d d bt i b l Substantial operating and debt service reserve balances
Substantially all power-side risk exposure will be gone by the beginning of 2012
Minimal risk of tapping bond charge accounts for power costs is diminishing furtherpp g g p g
Restructuring of bond and swap portfolio has reduced interest rate and counterparty risks
39

Schedule
Activity Date
Bank meeting June 30thBank meeting June 30th
Release bank RFP July 9th
Bank bids due July 30th
Closing of amendments to Master Bank Agreement Autumn 2010Closing of amendments to Master Bank Agreement Autumn 2010
40

Contact Information
Participant Contact Information Phone Number Email AddressNumber
Russell Mills – California Department of Water Resources
916-574-2756 [email protected]
Jim Bemis - Montague DeRose and Associates 805-496-2211 [email protected]
Tim Self – JPMorgan 212-270-4946 [email protected]
41