calibration of verley and sotberg soil resistance model
TRANSCRIPT

Calibration of Verley and Sotberg Soil Resistance Model for Pipelines Placed on Calcareous Soils
Bassem S. Youssef Atteris Pty Ltd
Perth, WA, Australia
Mark J. Cassidy Centre for Offshore Foundation Systems,
The University of Western Australia Perth, WA, Australia
ABSTRACT
On-bottom stability of subsea pipelines has been the focus of substantial research in recent years with particular emphasis on the topic of pipe-soil interaction. Numerous models have been developed to predict the pipe-soil interaction behavior under combined vertical and horizontal loading scenarios. The Verley and Sotberg energy based soil resistance model for silica sand is among these models. The model is recommended by Det Norske Veritas (DNV) and widely accepted and used by subsea pipeline design industry to model the pipe-soil interaction on silica sand soils. Calcareous sand soils are found in many of the world’s offshore hydrocarbon development regions including offshore of Western Australia. The engineering characteristics of the calcareous sand are different from those of the typical silica sand soils. As such, Verley and Sotberg parameters for silica sand soils are not suitable for calcareous sand soils. This paper presents a calibration of the Verley and Sotberg silica sand soil resistance model for calcareous sand soil conditions using the results of a set of centrifuge tests of a pipe model on calcareous sand soil. KEY WORDS: On-bottom stability; pipe-soil interaction; calcareous sand soils; centrifuge tests. INTRODUCTION
Offshore pipelines are employed to transport hydrocarbons to onshore processing units or to connect the well heads with the FPSO or tanker facilities. For accurate and reliable pipeline on-bottom stability design, the complex hydrodynamic-pipe-soil interaction should be accounted for within the analysis. Soil formation in many places around the globe, for example offshore of Western Australia, Africa, Brazil and the Middle East, is composed from calcareous sand soils. The characteristic features of the calcareous sand soils, as will be discussed later in the paper, distinguish them from typical silica sand soils with a similar particle size distribution. Therefore, for the case of calcareous sand soils, direct implementation of a silica sand pipe-soil interaction models will not necessarily predict the behavior of the calcareous sand soil. The complex pipe-soil interaction for the case of calcareous soil remains the most challenging aspect of the pipeline on-bottom stability analysis. Several pipe-soil interaction models are based on the approximation that the soil resistance has two terms: Coulomb friction and passive resistance. Among these models are Verley and Sotberg (1992) and Verley and Lund (1995) pipe-soil interaction models which are widely used by pipeline design industry and recommended by DNV-RP-F109 (DNV 2010) for simulating the pipe-soil interaction for the case
of silica sand and clay soils, respectively. The mathematical equations of these two models are based on simple dimensional analysis. The equations are fitted to large scale laboratory pipe mode tests. Accuracy of the models is demonstrated by predicting the time history of penetration and displacements as recorded during the physical testing (Verley and Sotberg 1992 and Verley and Lund 1995).
More advanced pipe-soil interaction models based on the sophisticated plasticity model are presented by Zhang (2001) and introduced into a computer program by Tian and Cassidy (2008). The centrifuge testing results presented in this paper were mainly conducted to assess the applicability of Zhang’s (2001) plasticity model in predicting the pipe-soil interaction under complex loading scenarios (see Youssef (2012) and Youssef et al. (2013-a) for more details). However, the main focus of this paper is to calibrate Verley and Sotberg (1992) silica sand soil resistance model for the case of calcareous sand soil using the centrifuge test results of Youssef (2012).
The soil resistance model of Verley and Sotberg (1992) is briefly discussed in this paper. Major engineering properties of calcareous soils which differentiate them from typical silica sand are highlighted. The centrifuge testing program of Youssef (2012) is discussed in association with the numerical simulation program CORUS-3D. The main procedures used in calibrating Verley and Sotberg’s soil resistance model and the retrospective simulation results are presented. SOIL RESISTANCE MODEL OF VERLEY AND SOTBERG
Verley and Sotberg (1992) has used three sources of pipe testing data, PIPESTAB (Brennodden et al. 1986), AGA (Brennodden et al. 1989) and DHI (Palmer et al. 1988), to develop and validate their pipe-soil resistance model. The model’s main governing equations and assumptions will be summarized in this section. However, for full details about the model reference should be made to Verley and Sotberg (1992).
The soil horizontal resistance force )( hF is assumed to have two components: Coulomb friction and passive resistance:
rfh FFF ��
(1)
where fF is Coulomb friction force which can be estimated as:
�*)( Lf FWsF ��
(2)
where W s is pipe self-weight, LF is hydrodynamic lift load, � is Coulomb friction coefficient and rF is passive resistance force.
141
Proceedings of the Twenty-fourth (2014) International Ocean and Polar Engineering ConferenceBusan, Korea, June 15-20, 2014Copyright © 2014 by the International Society of Offshore and Polar Engineers (ISOPE)ISBN 978-1 880653 91-3 (Set); ISSN 1098-6189 (Set)
www.isope.org

-Fr1
-Fr2
-Fr3
-y1-y2-y3
Lateral displacement, y
Pass
ive
resis
tanc
e, F
r
Fr1
Fr2
Fr3
y1 y2 y3
Passive resistance (right) due to the build up of the soil penetration
Passive resistance (left) due to the build up of the soil penetration
Fig. 1. Diagrammatic sketch of Verley and Sotberg silica sand soil resistance model
The passive resistance force is described with regard to the pipe
horizontal displacement (y) experienced during loading as shown in Fig. 1. The model is symmetric about the origin; i.e. the vertical penetration and force resistance achieved from one side applies to the other side after the displacement reverses direction. The force displacement diagram is composed of four different regions, which are: 1) An elastic region where the pipe lateral displacement is less than
0.02 the pipe diameter (D) (y≤y1). In this region, no work is done and the penetration is equal to the initial penetration.
2) A region, up to 0.5D (y1<y≤y2), where the pipe accumulates vertical penetration under the lateral cyclic displacement.
3) Breakout region, from 0.5D to D (y2<y≤y3), where the accumulated work is set to zero and the pipe penetration is linearly decreased to half this value at y= y3.
4) A region where the displacement exceeds 1.0D (y>y3), pipe penetration and passive resistance remain constant.
The peak passive resistance force, 2rF , is given by:
20,))(15.00.5( 25.122'2 ��� ssSr K
Dz
KDF ����� (3)
20,)(2 25.122'2 �� sSr K
Dz
DF ����������
(4)
where 'S� is soil saturated unit weigh, 2z is pipe penetration at pipe
displacement equal to y2 and sK is the soil stiffness parameter given by:
L
Ss FW s
DK
��
2'�
(5)
The residual passive resistance force, 3rF , can be estimated from
Eqs. 3 and 4 by replacing 2z with 3z (pipe penetration at pipe displacement equal to y3). The peak elastic passive resistance force,
1rF , assumed to equal 0.3 2rF . Pipe penetration at breakout, 2z , which corresponds to a pipe
lateral displacement equal to y2 is calculated from the following equation based on the work done by the pipe on the soil through pipe lateral displacement:
31.05.0
13'
2 23.0��
�
��
�
���
��
�����
���
� � ��
DyK
DE
Dzz
sS
i
�
(6)
where E is the work done and iz is the initial pipe penetration which is given by:
67.02'
037.0�
���
���
����
�
���
�W s
DDz Si �
(7)
Maximum penetration, 2z max, that can be achieved from the cyclic movement is estimated from:
5.05.0
max
2 ���
��
�����
���
� �s
i KDy
Dzz
(8)
The residual pipe penetration, 3z , can be calculated from the following equation:
1.0)(),(2.382.0 22
2
3 ������
���
�Dz
Dz
zz
��������� (9)
1.0)(,50.0 2
2
3 �����
���
�Dz
zz
������������� (10)
CALCAREOUS SAND SOIL PROPERTIES
Calcareous sand soils are primarily composed of calcite and aragonite derived from the skeletal remains of marine organisms. Due to carbonate precipitation and crystal growth between the particles, calcareous soils undergo cementation; this cementation develops irregularly throughout the soil structure and shows significant vertical variation (Airey and Fahey 1991). Thus, the engineering properties of calcareous soils differ from non-calcareous soils that have the same particle size distribution.
Carbonate minerals are weaker and softer than quartz, and have very high void ratios and high compressibility, Murff (1986) reported void ratios between 0.8 and 1.4 for calcareous sand soils, whereas Airey et al. (1988) obtained maximum and minimum void ratios of 1.48 and 1.12, respectively.
142

Calcareous sand soil, unlike silica sand soil, has a crushability coefficient, which is defined as the ratio between the percentages finer than D10 prior to and after compression. D10 represents the particle diameter corresponding to 10% cumulative (from 0 to 100%) undersize particle size distribution. The mean value of the crushability coefficient for calcareous sand was found to range from 1.21 to 2.34 under pressures between 800 and 6400 kPa in an oedometer (Hudson et al. 1988). An extremely high crushability coefficient, 24, was reported under a maximum stress of 55 MPa for a sample initially containing a small fraction of fine particles (Joer et al. 1997). Furthermore, Nauroy and Le-Tirant (1983) have shown that calcareous sand can be up to 100 times more compressible than silica sand at the same effective stress. The main reasons behind this high compressibility are the high initial void ratio and high crushability.
Fahey (1993) summarized experimental data of the stiffness values during virgin compression and swelling. The study concluded that the ratios of virgin calcareous sand to unloading-reloading compressibility are between 30 and 45. This ratio difference is mainly due to the high compressibility of the calcareous soil under virgin loading. Byrne and Houlsby (1998) observed the response of 1-g tests on circular flat footings on un-cemented loose carbonate sand recovered from the Goodwyn site 23 km to the west of North Rankin-A gas production platform off the North West Shelf of Australia. A footing of 150 mm diameter penetrated into the dry sand by up to 60 mm when loaded to 1600 N, suggesting a bearing modulus of approximately 160 and a gradient (q/z) of approximately 1500 kPa/m for the dry sand, with a mean unit weight of 9.3 kN/m3.
Based on the above discussion, a pipe-soil interaction model calibrated for silica sand soil would not be able to capture the behaviour of calcareous soil. Calibrating the energy based pipe-soil interaction model is an essential step to accurately and correctly model the pipeline behaviour on calcareous soil. In the present paper, calibration of the Verley and Sotberg energy based pipe-soil interaction model for calcareous soil is performed using retrospective simulation of centrifuge physical tests of pipe model on calcareous sand soil sample. As a consequence the important soil properties such as; compressibility and soil stiffness degradation are accounted for and captured. CENTRIFUGE EXPERIMENTAL PROGRAM
The initial purposes of this testing program were to investigate the pipe-soil interaction behaviour of a pipe on calcareous soil under complex loading and to assess Zhang’s (2001) plasticity pipe-soil interaction model for calcareous sand soils (see Zhang (2001) and Tian and Cassidy (2008) for more details about the plasticity model and see Youssef et al. (2013-a) for the model assessment). However, the centrifuge testing program results are used in this paper to calibrate the Verley and Sotberg (1992) energy-based pipe-soil interaction model for calcareous sand soil conditions.
The tests were conducted in the beam centrifuge at the University of Western Australia (UWA). The centrifuge is an Acutronic Model 661 geotechnical centrifuge that has a swinging platform radius of 1.8 m and is rated at 40 g-tonnes (Randolph et al. 1991). The platform supports standard rectangular ‘strongboxes’, which have plan dimensions of 650 × 390 mm and are 325 mm deep. Fig. 2 shows the beam centrifuge testing facility at UWA.
The model pipe measured 20 mm in diameter and 120 mm in length and was fabricated from aluminium. At a scale of 1:50, this represents a prototype pipe segment of 1.0 m diameter and 6.0 m length. The length-to-diameter ratio was considered sufficient to represent plane strain conditions, where the end effects are minimal. The pipe was rigidly connected to an S-shaped axial load cell and a loading arm, which was used to measure the vertical load and interpret the horizontal load acting on the pipeline, respectively. Fig. 3 shows a diagrammatic vertical cross section in the centrifuge testing box. The
tests were conducted at a centrifuge acceleration of 50-g. Scaling laws relevant to these tests are provided by Schofield (1980), Taylor (1995), Muir Wood (2004) and Garnier et al. (2007) and will not be discussed here.
Fig. 2. Beam centrifuge at UWA
The tests were conducted on a calcareous sand sample collected from offshore of the North West Shelf of Australia. Youssef (2012) studied the generic inclined loading angle of four wave return periods of 1, 10, 100 and 1000 years using typical properties of significant wave height and peak wave period for the North West Shelf of Australia. The hydrodynamic loads were calculated using the hydrodynamic wave simulation program UWAHYDRO, see Youssef (2012) for more details, which follows the Fourier model of Sorenson et al. (1986). The study revealed that majority of the peak loading points is accommodated within inclined lines of approximately 20o and 45o with the V axis as shown in Fig. 4. These angles are consistent with the realistic offshore hydrodynamic loading pattern discussed by Jones (1978) and Gao et al. (2011).
The centrifuge testing program of Youssef (2012) consisted of seven pipe model tests in total which considered three forms of loading. Five tests were conducted under inclined loading (Inclined tests 1 to 5) while the other two tests are a test under regular wave plus current loading (Regular test) and a test under irregular wave plus current loading (Irregular test). In all tests, the pipe was first penetrated under the effect of a defined initial vertical load Vpeak (1�2 in Fig. 5), before the vertical load was reduced to a lower value Vi (2�3 in Fig. 5). The initial higher vertical load value (Vpeak) was employed to simulate the load concentration at the touchdown zone during the pipe-laying process. Cathie et al. (2005) suggested that the value of load concentration at the touchdown zone varies between 2.0 and 4.2 times the pipe self-weight. Following point 3 in Fig. 5, either the generated inclined load, regular or irregular load were applied on the pipeline.
In the Inclined Load tests, a cyclically increasing inclined load was applied from point 3 until the end of the test (3�4, 4�5 etc.) as diagrammatically illustrated in Fig. 5. The horizontal load was chosen to increase at a rate of 0.25 kN/m per cycle, while the vertical load was calculated from the inclined load angle. The loading time of each cycle was 40 s. Details of the first cycle of the inclined loads (FV and FH) and the loads in the V-H space are shown in Fig. 6 for the tests at an inclined angle of 30o (Inclined load tests 1, 2 and 3).
In the case of a regular load time history, the first regular cyclic load was designed as a group of 6 sub-cycles of the same loading value. Each cycle had a loading time of 60 s, and the following regular cyclic loads were in increments of 100% of the first cyclic load values. Details of the first cycle of the regular cyclic loads (FV and FH) and the loads in the V-H space are shown in Fig. 7.
The irregular load time series was designed as a group of increasing cycles of irregular load time series. The loading values of each cycle increased by 10% of the first cyclic load values, and the loading time of each cycle was 50 s. Details of the first cycle of the
143

irregular loads (FV and FH) and the loads in the V-H space are shown in Fig. 8.
Drainage material
Soil sample
Water
8012
040
325
390
Pipe model
all dimensions are in (mm)
Loading
Actuator movement in 2 directions
armLoad cell
Strain gauges
20
120
Fig. 3. General arrangment of centrifuge testing box.
Due to testing space limitations, the pipe’s maximum horizontal
displacement was limited. Table 1 shows the loading details and the number of cyclic loads used in each test until the maximum horizontal displacement was reached. The proportion in the number of cycles represents the distance into a cycle before the maximum horizontal displacement was reached and the test concluded.
Table 1. Centrifuge test details
Test name Vpeak (kN/m)
Vi (kN/m)
Max H. Disp. (m)
Number of load cycles used (cycle)
Inclined 1 42.98 10.52 3.0 13.27 Inclined 2 23.30 9.60 2.0 13.75 Inclined 3 27.11 10.34 5.0 16.25 Inclined 4 33.92 11.12 2.5 14.29 Inclined 5 35.43 11.71 2.5 29.25 Regular 35.05 11.20 3.0 46.22 Irregular 34.57 11.46 3.0 31.25
The test results of Inclined test number 1 is shown in Fig. 9.
Fig. 9a verifies that the load control scheme was correctly implemented as the loads are increasing at an angle of 30�. Fig. 9c and Fig. 9d present the accumulation of vertical penetration under small cyclic load. Moreover as shown in Fig. 9d, for each section of the loading cycle with a change in direction of the horizontal load, the pipe was observed to penetrate into the soil. These results agree with the finding of Verley and Sotberg (1992) and Zhang (2001) as the pipe penetrated vertically under the effect of cyclic loads. As the cyclic load increased, the horizontal displacement increased and the pipe started to experience vertical upward movement. It is believed that during this stage while the horizontal displacement was less than 0.25 m, the soil in front of the pipe was swept with the pipe movement and a side berm formed. After the horizontal displacement exceeded the formed berm, the horizontal soil resistance was reduced significantly. This is clear from Fig. 9a and Fig. 9b where during the last few cycles before the test termination, the soil could not support the target horizontal load in the load controlled loop. For instance, the pipe displaced horizontally from approximately 0.4 m to 3.0 m in the last cycle. The same general observations were found for all tests. Full details of the experimental results are available in Youssef (2012) and Youssef et al. (2013-a).
-12
-8
-4
0
4
8
12
-5 0 5 10 15Vertical load, V (kN/m)
Hor
izon
tal l
oad,
H (k
N/m
)
100 1000
1 10RP (year)=
20o
20o
45o
H = FH ,V = Ws-FV andWs = 10.0 kN/m
Considering that,
tan-1(H/V)=45o
Fig. 4. Hydrodynamic loads of different return periods in the V-H space
Fig. 5. Loading steps schematic of the Inclined loading tests
Hor
izon
tal l
oad,
FH (k
N/m
)
Time (s)0 10 20
-0.50
-0.25
0.00
0.25
0.50
30 40
Ver
tical
load
, FV (
kN/m
)
Time (s)0 10 20
0.0
0.2
0.4
0.6
30 40
First cycle
First cycle
a-
b-
Fig. 6. Details of the inclined loads at 30o used in tests 1, 2 and 3
Vertical load, V
Hor
izon
tal l
oad,
H
123
45
6
8
10
,.. ,
12
13
140.
0 , 7,
Loading point
144

Time (s)0 10 20 30 60
Ver
tical
load
, FV (
kN/m
)
0.00
0.05
0.15
0.30
0.10
First cycle
a-
b- 50
0.25
40
0.20
Time (s)0 10 20 30 605040
Hor
izon
tal l
oad,
FH (k
N/m
)
-0.2
0.0
0.2
0.3First cycle
0.1
-0.1
Fig. 7. Details of the cyclic Regular loads
Time (s)0 10 20 30 50
Ver
tical
load
, FV (
kN/m
)
0.0
0.5
1.5
3.0
1.0
First cycle
a-
b- 40
2.5
2.0
Time (s)0 10 20 30 5040
Hor
izon
tal l
oad,
FH (k
N/m
)
-2
0
2
3First cycle
1
-1
Fig. 8. Details of the cyclic Irregular loads
Hor
izon
tal l
oad,
H (k
N/m
)
-4.0-3.0
2.0
4.0
0 5 4510
3.0
-1.0 0.0
Vertical load, V (kN/m)
-2.0
1.0
Ver
tical
dis
p., w
(m)
0.12
0.10
0.03
0.02
0.000 5 40 4510
0.06
4035
35
a-
c-
b-
d-
Ver
tical
dis
p., w
(m)
Horizontal disp., u (m)
0.12
0.10
0.04
0.02
0.000.0 0.5 1.5 2.5 3.51.0
0.0 1.0 2.0 3.50.5
0.06
0.08
3.0
Hor
izon
tal l
oad,
H (k
N/m
)
-4.0-3.0
2.0
4.0 3.0
-1.0 0.0
-2.0
1.0
1.5
2.0
3.02.5
0.0650.0700.0750.0800.0850.090
0 0.05 0.1 0.15 0.2 0.25
0.08
Fig. 9. Centrifuge test results of Inclined load test number 1
CORUS-3D, ON-BOTTOM STABILITY MODELLING PROGRAM
CORUS-3D is a software package developed and owned by Atteris Pty Ltd for analysing the on-bottom stability of submarine pipelines and umbilicals. CORUS-3D is based on the Finite Element Analysis (FEA) program ABAQUS which allows the use of subroutines to extend functionality. The ABAQUS DLoad subroutine allows complex loading to be applied to the model during the analysis.
CORUS-3D uses the American Gas Association/Pipeline Research Council International (AGA/PRCI) Level 3 software (PRCI 2008) to calculate the hydrodynamic loads on the submarine pipeline. These loads are applied as a time history to the pipeline within the DLoad subroutine. Additionally, the hydrodynamic loads are corrected based on pipe velocity and pipe penetration as defined in DNV-RP-F109 (DNV 2010). Finally the pipe-soil interaction is modelled using the built-in ABAQUS Coulomb friction contact algorithm, with an adjustment for the passive soil resistance of the
145

Verley and Sotberg model being provided within the DLoad subroutine. The general computational sequence that CORUS-3D uses to
perform the pipeline on-bottom stability simulation can be summarized as follows: 1) At the start of an analysis ABAQUS reads the job input file and the
CORUS-3D subroutines load the drag and lift time histories as well as the flow velocity from the AGA generated data files.
2) ABAQUS initiates the model stiffness matrix. 3) At the beginning of the simulation, the hydrodynamic loads are
estimated in the DLoad subroutine for every load integration point in each pipe element. The Loads are provided to ABAQUS to be applied onto the pipeline elements.
4) ABAQUS attempts to solve the pipeline stiffness matrix with the applied loads and boundary conditions. If a converged solution is found the analysis proceeds to the next time increment, otherwise a new iteration at a reduced time step is attempted.
5) At the start of each time increment, the pipeline displacement and normal contact force between the pipeline element and the rigid seabed surface from a previous increment are utilised to update the soil passive resistance model and to estimate the hydrodynamic correction data. The hydrodynamic loads, soil passive resistance forces and hydrodynamic correction forces are then calculated for every load integration point of every pipe element.
6) Steps 4 and 5 are repeated until the last increment is reached and the analysis is completed.
CORUS-3D has been internally checked and validated by Atteris using an extensive set of available pipeline physical modelling test results and pipeline benchmark cases. This benchmarking exercise has been used to demonstrate the ability of CORUS-3D to accurately perform complex pipeline simulations. Moreover, CORUS-3D has been successfully validated externally by DNV Australia through comparison of the simulation results from CORUS-3D and DNV’s pipeline modelling software (PONDUS). The DNV validation program included a test matrix of 35 cases featuring pipelines and umbilicals of various specific gravity, outer diameter, water depth, soil Coulomb friction and other design conditions. Reference should be made to Youssef et al. (2013-b) and Royet et al. (2014) for more details about the CORUS-3D internal validation and DNV validation, respectively. VERLEY AND SOTBERG SILICA SAND MODEL CALIBRATION FOR CALCAREOUS SAND SOILS
Based on the findings of Youssef (2012) centrifuge test results of the pipe model on calcareous sand soil, it is concluded that the pipe-soil interaction behaviour on calcareous sand soil soils is similar to the pipe-soil interaction behaviour of the silica sand model of Verley and Sotberg (1992). From Fig. 9 it can be seen that the calcareous sand force-displacement diagram has an elastic region after which the pipe accumulates vertical penetration under small cyclic movement. Moreover, under larger cyclic movements, the pipe swept outside the initial penetration zone before the pipe reaches a constant soil resistance and penetration state. Therefore, Verley and Sotberg silica sand force-displacement diagram has been assumed to be valid for the case of calcareous soil with the following changes: 1) The elastic region is defined to a pipe displacement of y=0.01D. 2) Region 2, where the pipe accumulate vertical penetration is limited
to y=0.25D. 3) Breakout region, where the pipe reduce penetration and resistance
is defined at y=0.75D. Fig. 10 shows the force-displacement diagram of the calibrated
model. The mathematical formulations and equations of the Verley and Sotberg (1992) silica soil resistance model are assumed to be valid and applicable for the case of calcareous sand soil model. However, a pilot study is conducted using CORUS-3D to perform retrospective simulations of the centrifuge tests undertaken by Youssef (2012) to
Pass
ive
resi
stan
ce, F
r
Fr1
Fr2
Fr3
y1=0.01D y2=0.25D y3=0.75DLateral displacement, y
Fig. 10. Force-displacement diagram of the calibrated model
evaluate the contribution of changing each force and displacement parameter on the calcareous sand soil resistance model behaviour. The pilot study investigated the effect of changing the following parameters ( max2321321 ,,,,,, zandzzzzandFFF irrr ) on the overall pipe-soil interaction behaviour. Coulomb friction coefficient is assumed to have an upper and lower bound of 1.2 and 0.4, respectively. Different Coulomb friction coefficient values have been investigated in the retrospective simulations. The study concluded that three parameters are required to be introduced to the force and displacement equations of Verley and Sotberg’s (1992) silica sand model. These scaling parameters are designated as A, B and C.
Parameter A is introduced to the 2rF force equations (Eqs. 3 and 4) to estimate the peak passive resistance force.
20,))(15.00.5( 25.122'2 ���
�
���
��� ssSr K
Dz
KDAF ���
(11)
20,)(2 25.122'2 ���
�
���
�� sSr K
Dz
DAF ��������
(12)
While the residual passive resistance forces, 3rF , can be
estimated from Eqs. 11 and 12 by replacing 2z with 3z (pipe penetration at pipe displacement equal to y3). The peak elastic passive resistance force 1rF is assumed to equal 0.3 2rF .
Parameter B is introduced to Eqs. 6 and 8 to control the plastic penetration and the maximum value that can be achieved from the cyclic displacement:
���
�
���
�
�
��
�
��
�
���
��
����
��
� � ��
31.05.01
3'2 23.0
DyK
DEB
Dzz
sS
i
� (13)
��
�
��
�
���
�����
�
��� � � 5.0
5.0
max
2s
i KDyB
Dzz (14)
Residual pipe penetration, 3z , is calculated from Eq. 9 or Eq. 10. Parameter C is introduced to Eq. 7 and modifies the pipe initial
penetration depth:
���
�
���
�
�
���
���
���
�
���
� 67.02'037.0
W sDC
Dz Si �
(15)
An extensive parametric study is conducted to estimate the new scaling parameter values and the Coulomb friction coefficient that will achieve the best reproduction of the pipe model centrifuge test results.
Retrospective simulation of Inclined test-1 is shown in Fig. 11. Initial penetration, maximum penetration and maximum horizontal displacement behaviour are well reproduced and compared with the centrifuge test results. Final horizontal displacement in the numerical
146

simulation is 3.70 m while the final horizontal displacement in the centrifuge test is 3.0 m. Parameters A, B and C are given by 0.25, 0.35 and 0.79, respectively. While the Coulomb friction coefficient value used in the simulation is 0.48. From Fig. 12 to Fig. 15 it can be seen that the initial penetration, maximum penetration and maximum horizontal displacement behavior compare well with the centrifuge test results. Values for the parameters A, B and C and the Coulomb friction coefficient of all the retrospective numerical simulations are presented in Table 2.
Fig. 11. Centrifuge and numerical simulation results of Inclined test-1
Fig. 12. Centrifuge and numerical simulation results of Inclined test-2
Retrospective simulation results of the Regular load test and the Irregular load test are compared with the centrifuge test results in Fig. 16 and Fig. 17, respectively. Values for the A, B and C parameters and the Coulomb friction coefficient used in the Regular and Irregular simulations are shown in Table 2. It should be noted that the values presented in Table 2 for each simulation case are the best combined parameter’s values that can reproduce the centrifuge test results. These values are selected based on the outcome of a large parametric analysis for each test scenario.
Fig. 13. Centrifuge and numerical simulation results of Inclined test-3
Fig. 14. Centrifuge and numerical simulation results of Inclined test-4
a-
b-
Ver
tical
dis
p., w
(m)
Horizontal disp., u (m)
0.12
0.10
0.04
0.02
0.00-1.0 0.0 4.01.0
-1.0 2.0 4.00.0
0.06
0.08
3.0
Hor
izon
tal l
oad,
H (k
N/m
)
-4.0-3.0
2.0
4.0 3.0
-1.0 0.0
-2.0
1.0
1.0
2.0
3.0
Centrifuge Numerical
Centrifuge Numerical
a-
b-
Ver
tical
dis
p., w
(m)
Horizontal disp., u (m)
0.12
0.10
0.04
0.02
0.00-0.5 0.5 1.5
-0.5 2.50.5
0.06
0.08
3.5
Hor
izon
tal l
oad,
H (k
N/m
)
-4.0-3.0
2.0
4.0 3.0
-1.0 0.0
-2.0
1.0
1.5
2.5
3.5
Centrifuge Numerical
Centrifuge Numerical
a-
b-
Ver
tical
dis
p., w
(m)
Horizontal disp., u (m)
0.18
0.15
0.06
0.03
0.00-1.0 1.0 3.0
0.09
0.12
Hor
izon
tal l
oad,
H (k
N/m
)
-4.0-3.0
2.0
4.0 3.0
-1.0 0.0
-2.0
1.0Centrifuge Numerical
2.00.0 5.0 7.06.04.0
1.0 3.02.00.0 5.0 7.06.04.0-1.0
Centrifuge Numerical
a-
b-
Ver
tical
dis
p., w
(m)
Horizontal disp., u (m)
0.12
0.08
0.00
-0.04
-0.08-1.0 1.0 3.0
0.04
Hor
izon
tal l
oad,
H (k
N/m
)
-4.0-3.0
2.0
4.0 3.0
-1.0 0.0
-2.0
1.0Centrifuge Numerical
2.00.0 5.04.0
1.0 2.00.0 5.04.03.0-1.0
Centrifuge Numerical
147
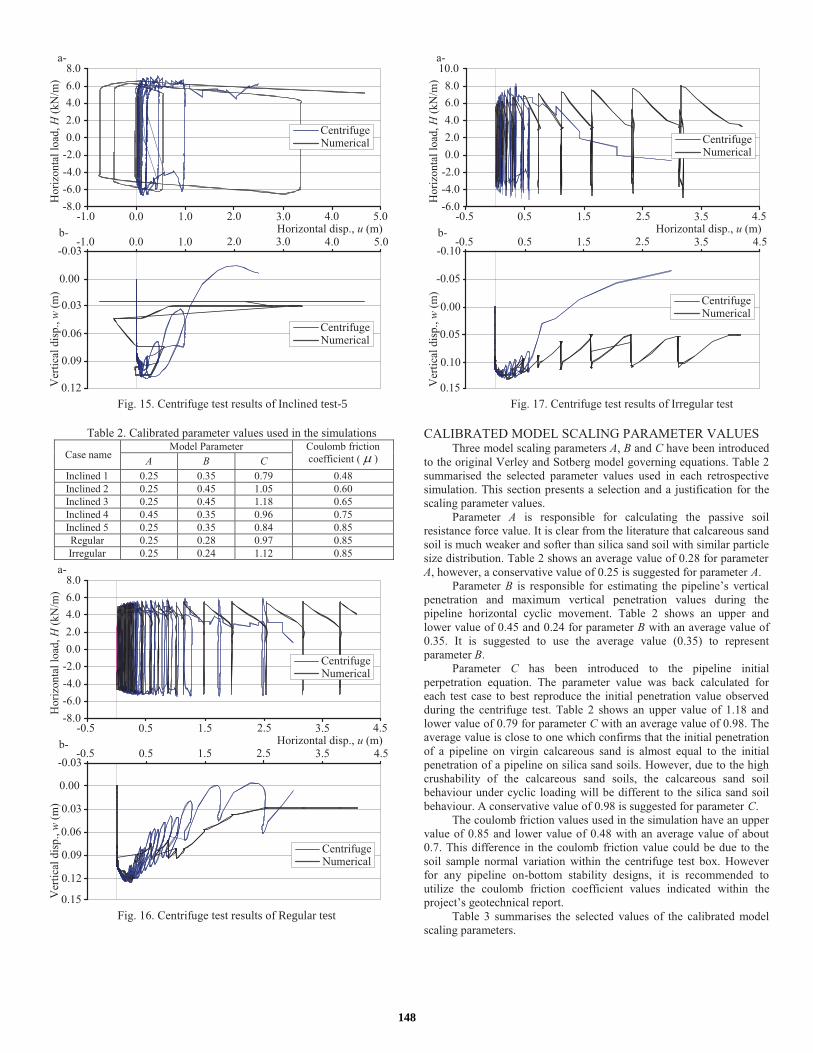
Fig. 15. Centrifuge test results of Inclined test-5
Table 2. Calibrated parameter values used in the simulations
Case name Model Parameter Coulomb friction
coefficient ( � ) A B C Inclined 1 0.25 0.35 0.79 0.48 Inclined 2 0.25 0.45 1.05 0.60 Inclined 3 0.25 0.45 1.18 0.65 Inclined 4 0.45 0.35 0.96 0.75 Inclined 5 0.25 0.35 0.84 0.85 Regular 0.25 0.28 0.97 0.85 Irregular 0.25 0.24 1.12 0.85
Fig. 16. Centrifuge test results of Regular test
Fig. 17. Centrifuge test results of Irregular test
CALIBRATED MODEL SCALING PARAMETER VALUES
Three model scaling parameters A, B and C have been introduced to the original Verley and Sotberg model governing equations. Table 2 summarised the selected parameter values used in each retrospective simulation. This section presents a selection and a justification for the scaling parameter values.
Parameter A is responsible for calculating the passive soil resistance force value. It is clear from the literature that calcareous sand soil is much weaker and softer than silica sand soil with similar particle size distribution. Table 2 shows an average value of 0.28 for parameter A, however, a conservative value of 0.25 is suggested for parameter A.
Parameter B is responsible for estimating the pipeline’s vertical penetration and maximum vertical penetration values during the pipeline horizontal cyclic movement. Table 2 shows an upper and lower value of 0.45 and 0.24 for parameter B with an average value of 0.35. It is suggested to use the average value (0.35) to represent parameter B.
Parameter C has been introduced to the pipeline initial perpetration equation. The parameter value was back calculated for each test case to best reproduce the initial penetration value observed during the centrifuge test. Table 2 shows an upper value of 1.18 and lower value of 0.79 for parameter C with an average value of 0.98. The average value is close to one which confirms that the initial penetration of a pipeline on virgin calcareous sand is almost equal to the initial penetration of a pipeline on silica sand soils. However, due to the high crushability of the calcareous sand soils, the calcareous sand soil behaviour under cyclic loading will be different to the silica sand soil behaviour. A conservative value of 0.98 is suggested for parameter C.
The coulomb friction values used in the simulation have an upper value of 0.85 and lower value of 0.48 with an average value of about 0.7. This difference in the coulomb friction value could be due to the soil sample normal variation within the centrifuge test box. However for any pipeline on-bottom stability designs, it is recommended to utilize the coulomb friction coefficient values indicated within the project’s geotechnical report.
Table 3 summarises the selected values of the calibrated model scaling parameters.
a-
b-
Ver
tical
dis
p., w
(m)
Horizontal disp., u (m)
0.12
0.09
0.03
0.00
-0.03-1.0 1.0 3.0
0.06
Hor
izon
tal l
oad,
H (k
N/m
)
-8.0-6.0
4.0
8.0 6.0
-2.0 0.0
-4.0
2.0
2.00.0 5.04.0
1.0 2.00.0 5.04.03.0-1.0
Centrifuge Numerical
Centrifuge Numerical
a-
b-
Ver
tical
dis
p., w
(m)
Horizontal disp., u (m)
0.15
0.12
0.03
0.00
-0.03-0.5 1.5
0.09
Hor
izon
tal l
oad,
H (k
N/m
)
-8.0-6.0
4.0
8.0 6.0
-2.0 0.0
-4.0
2.0
2.50.5 4.53.5
1.5 2.50.5 4.53.5-0.5
Centrifuge Numerical
0.06
Centrifuge Numerical
a-
b-
Ver
tical
dis
p., w
(m)
Horizontal disp., u (m)
0.15
0.00
-0.05
-0.10-0.5 1.5
0.10
Hor
izon
tal l
oad,
H (k
N/m
)
-6.0-4.0
6.0
10.0 8.0
0.0 2.0
-2.0
4.0
2.50.5 4.53.5
1.5 2.50.5 4.53.5-0.5
Centrifuge Numerical
0.05
Centrifuge Numerical
148

Table 3. Calibrated model scaling parameter values Scaling Parameter
A B C 0.25 0.35 0.98
DISCUSSION AND CONCLUSIONS
Accurate pipe-soil interaction modelling is essential to achieve correct and reliable on-bottom stability analysis. The Verley and Sotberg (1992) soil resistance model is among the most widely used pipe-soil resistance models for the case of silica sand soils. The model is recommended by DNV-RP-F109 (DNV 2010) to model the passive soil resistance forces for silica sand soil conditions.
This paper presents a calibration of the Verley and Sotberg (1992) silica sand resistance model for calcareous sand soil conditions tested during geotechnical centrifuge experiments of a pipe subjected to cyclic wave loading conditions (Youssef 2012). The calibrated model has introduced three scaling parameters to the original Verley and Sotberg model governing equations. Values of the new three parameters are determined through an extensive parametric numerical simulation and through investigating a combination of a wide range of the possible parameter values.
Retrospective numerical simulations of the centrifuge test cases verified the accuracy of the calibrated soil resistance model parameter values. The findings of this paper extends the applicability Verley and Sotberg soil resistance model and provides the pipeline design engineers with accurate and representative Verley and Sotberg soil resistance model parameters for the calcareous soils calibrated in the geotechnical centrifuge.
ACKNOWLEDGEMENT
The authors acknowledge Assistant Prof. Yinghui Tian, Centre for Offshore Foundation Systems (COFS) at the University of Western Australia (UWA), for making the pipe-model centrifuge test results presented in this paper available. The Authors would also like to acknowledge Eng. Olivier Royet (Principal Specialist, DNV Australia) for the useful discussion and suggestions during the preparation of the present work. REFERENCES Airey, DW and Fahey, M (1991). “Cyclic response of calcareous soil
from the North-West Shelf of Australia,” Géotechnique, Vol 41, No 1. Airey, DW, Randolph, MF and Hyden, AM (1988). “The strength and
stiffness of two calcareous sands,” Engineering for Calcareous Sediments, Vol 1, ed. A.a Jewell, Balkema, Perth, pp 43-50.
Brennodden, H , Lieng, JT, Sotberg, T and Verley, RLP (1989). “An energy-based pipe-soil interaction model,” Offshore Technology Conference, Houston, Texas.
Brennodden, H, Sveggen, DA and Murff, JD (1986). “Full-scale pipe-soil interaction tests,” Offshore Technology Conference, Houston, Texas.
Byme, BW and Houlsby, GT (1998). “Model Testing of Circular Flat Footings on Uncemented Loose Carbonate Sand: Experinzental Data,” OUEL Report No: 2192/98, Department of Engineering Science, the University of Oxford.
Cathie, DN, Jaeck, C, Ballard, JC and Wintgens, JF (2005). “Pipeline geotechnics – state-of-the art,” Frontiers in offshore geotechnics: ISFOG, In: S Gourvenec, MJ Cassidy (Eds.). London: Taylor & Francis Group.
DNV (2010). “On-Bottom Stability Design of Submarine Pipelines,” Recommended practice, DNV RP-F109, Det Norske Veritas.
Fahey, M. (1993). “Selection of parameters for foundation design in calcareous soil,” Chapter 3: Regional Soils. Kyushu Branch, Japanese Society for SMFE, pp 71-134.
Garnier, J, Gaudin, C, Springman, SM, Culligan, PJ, Goodings, D and
Konig, D, (2007). “Catalogue of scaling laws and similitude questions in centrifuge modelling,” International Journal of Physical Modelling in Geotechnics, Vol 7(3), pp 1–24.
Gao, FP, Yan, SM, Zhang, EY, Wu, YX and Jia, X (2011). “Lateral soil resistance to an untrenched pipeline under the action of ocean currents,” Frontiers in offshore geotechnics II, In: S Gourvenec, D White (Eds.). London: Taylor & Francis Group.
Hudson, MJ, Mostyn, G, Wiltsie, EA and Hyden, AM (1988). “Properties of near surface Bass Strait soils”, International Conference on Calcareous Sediments, ed. J.a. Andrews, Balkema, Perth.
Joer, HA, Ismail, M and Randolph, MF (1997). “Compressibility and crushability of calcareous soils”, Australasian Conference on the Mechanics of Structures and Materials, Melbourne, VIC.
Jones, WT (1978). “On-bottom pipeline stability in steady water currents,” Petroleum Technology, Vol 30, pp 475–484.
Muir Wood, D (2004). “Geotechnical modelling,” Spon Press, London. Murff, JD (1986). “Pile capacity in calcareous sands,” Geotechnical
Engineering, Vol 113, No. 5, pp 490-507. Nauroy, JF and Le Tirant, P (1983). “Model tests of piles in calcareous
sands,” Special Conference on Geotechnical Practice in Offshore Engineering, Austin, Texas.
Palmer, AC, Steenfelt, JS, Steensen-Bach, JO and Jacobsen, V (1988). ”Lateral resistance of marine pipelines on sand,” Offshore Technology Conference, Houston, Texas.
PRCI (2008). “Submarine Pipeline On-bottom Stability Analysis: Volume 1 Analysis and Design Guidelines, Volume 2 Software and Manuals, Version 2,” Pipeline Research Council International, American Gas Association.
Randolph, MF, Jewell, RJ, Stone, KJL and Brown, TA (1991). “Establishing a new centrifuge facility,” International Conference on Centrifuge Modelling, Boulder, Colorado.
Royet, O, Rambech, EL, Aamlid, O and Chadwick, S (2014). ” CORUS-3D – Validation of software for pipeline on-bottom stability,” DNV Australia, Report No: PP079683_TPPAU993, Rev 1.
Schofield, AN (1980). “Cambridge geotechnical centrifuge operations,” Géotechnique, Vol 30, No 3, pp 227-68.
Sorenson, T, Bryndum, M and Jacobsen, V (1986). “Hydrodynamic forces on pipelines-model tests,” Danish hydraulic Institute (DHI), Pipeline Research Council International (PRCI), Report No PR-170-185.
Taylor, RN (1995). “Geotechnical centrifuge technology,” Blackie Academic Press.
Tian, Y and Cassidy, MJ (2008). “Modelling of pipe-soil interaction and its application in numerical simulation,” International Journal of Geomechanics, Vol 8, No 4, pp 213-29.
Verley, R and Lund, KM (1995). “A soil resistance model for pipelines placed on clay soils,” Proceedings of the international conference on offshore mechanics and arctic engineering, Copenhagen, Vol 5.
Verley, RLP and Sotberg, T (1992). “A Soil Resistance Model for Pipelines Placed on Sandy Soils,” Pipeline Technology, Proceedings of the 11th International Conference on Offshore Mechanics and Arctic Engineering, Alberta, Canada.
Youssef, BS (2012). “The integrated stability analysis of offshore pipelines,” Ph.D thesis, University of Western Australia, Perth, WA.
Youssef, BS, Tian, Y and Cassidy, MJ (2013-a). ”Centrifuge modelling of an on-bottom pipeline under equivalent wave and current loading,” Applied Ocean Research Journal, Vol 40, pp 14–25
Youssef, BS, McMaster, SY and Campbell, DR (2013-b). ” Atteris on-bottom stability modelling program, CORUS-3D verification,” Atteris Pty Ltd Australia, Report No 10-021-023-TN, Rev A.
Zhang, J (2001). “Geotechnical stability of offshore pipelines in calcareous sand,” Ph.D thesis, University of Western Australia, Perth, WA
149