calibration of transyt platoon dispersion model for...
TRANSCRIPT
48 Transportation Research Record 905
Abridgment
Calibration of TRANSYT Platoon Dispersion Model for
Passenger Cars Under Low-Friction Traffic Flow Conditions
PATRICK T. McCOY, ELIZABETH A. BALDERSON, RICHARDT. HSUEH, AND ABBAS K. MOHADDES
The calculation of delay and stops by the TRANSYT program and in turn the effectiveness of the signal timings resulting from its optimization procedure de· pend on the ability of its platoon dispersion model to accurately predict traffic flow patterns from one signal to another. Therefore, calibration of the disper· sion factor a and travel-time factor {l in the model is important to the successful implementation of the TRANSYT program. However, because of limited re· search, a definitive description of the relationship between the appropriate values of a and {l and roadway conditions does not exist. The objective of this research was to contribute to the ultimate development of a definitive descrip· tion of this relationship by calibrating this model for passenger cars under lowfriction traffic flow conditions. Platoon dispersion studies were conducted on six arterial street segments (2 two·way two-lane segments and 4 four-lane divided segments). Traffic flow patterns of nearly 1700 platoons were analyzed. The results indicated that less platoon dispersion was observed in this study than has been found in other studies of low-friction traffic flow conditions. It was concluded that appropriate values of a and {l for passenger cars under these conditions are a equal to 0.21 and {l equal to 0.97 on two-way two-lane streets and a equal to 0.15 and {l equal to 0.97 on four-lane divided streets.
The traffic simulation model in the TRANSYT signaltiming optimization program is recognized as one of the most realistic in the family of macroscopic computerized traffic simulation models <ll· Rather than assume uniform traffic flow within platoons traveling from one signal to another, the TRANSYT model accounts for the effects of the dispersion of platoons as they travel between signals. The model uses the following recurrence relationship developed by Robertson !1l to simulate platoon dispersion:
q I (i + flt) ; F x q(i) + (I - F) x q 1 (i + {lt - 1)
q 1 (i) = flow in ith time interval of predicted platoon;
(I)
q(i) = flow in ith time interval of initial platoon;
t average travel time over distance for which platoon dispersion is being calculated;
6 a empirical travel-time factor expressed as ratio between average travel time of leading vehicle in platoon and average travel time of entire platoon (O<S<l.0);
F D empirical smoothing factor, which controls rate at which platoon disperses, expressed as F = 1/(1 + aSt); and
a empirical dispersion factor between O and 1.0.
The amount of dispersion in the traffic flow pattern predicted by Equation 1 is determined by the parameters a and S· A value of 0.0 for a and a value of 1. 0 for S represents no platoon dispersion over the distance for which the platoon dispersion is being calculated. Values of 1. 0 for both a and s represent a maximum platoon dispersion over the distance for which the platoon dispersion is being calculated.
The calculation of deldy dnu stuvs by the TRANSYT program and in turn the effectiveness of the signal timings resulting from its optimization procedure depend on the ability of the recurrence relationship in Equation 1 to accurately predict the traffic flow pattern from signal to signal (1_). Therefore, selection of appropriate values for a and s is important to the successful implementation of the
TRANSYT program. From an analysis of traffic flow patterns observed by Hillier and Rothery (].) at four sites in West London, England, Robertson <1l determined that the values of these parameters that resulted in the best fit between the actual and calculated traffic flow patterns were a equal to 0. 5 and S equal to 0.8. The sites where the observations were made had different traffic conditions that ranged from single-lane flow with heavy parking and very restricted overtaking to multilane flow with no parking and relatively free overtaking. However, Robertson (ll cautioned users of TRANSYT that one might expect the appropriate values for a and 6 to be a function of site factors such as roadway width, gradient, parking, opposing traffic volume, traffic composition, and others.
Since the development of the recurrence relationship in Equation 1, only a limited number of studies to evaluate its parameters have been documented. Sneddon (4) applied Equation 1 to traffic flow data collected-at two sites in Manchester, England, to determine the values of a and a that provided the best fit to the observed traffic flow patterns. One of the sites was a three-lane dual carriageway with 10-15 percent commercial vehicles in the peak hours and reasonable freedom for overtaking. The other site was a two-way road 35 ft wide with 2-3 percent commercial vehicles, two narrow lanes in the direction studied, and severely restricted overtaking. For the three-lane dual carriageway, the bestfit value of a was 0.40, and for the two-way road, the best-fit value of a was 0.63. For both sites, the best-fit value of s was 0.8.
In another study, Collins and Gower (~) observed the dispersion of platoons of passenger cars on a three-lane dual carriageway in the suburbs of London, England. They found that the values of a and S that provided the best fit between the observed and calculated traffic flow patterns were 0. 20 and a.ea, respectivPly.
In Toronto, Canada, Lam (§_) conducted platoon dispersion studies on a four-lane two-way suburban arteriul street with left-turn bays. In using Equation 1 with the parameter values suggested by Robertson (i.e., a= a.5 and S = a.8), he found an average error of 13. B percent in the computed value of delay. Therefore, he calibrated Equation 1 by using his observed traffic flow data. He found that the parameter values that provided the best fit between the observed and predicted platoon dispersion were a equal to 0.24 and S equal to a.8. As a result of this calibration, the average error in the computed delay was significantly reduced to 8.2 percent.
El-Reedy and Ashworth Ill conducted a study of platoon dispersion along a single carriageway in Sheffield, England. The road was 33 ft wide. The traffic flow observed was on a 5 percent downgrade. It was subject to a 30-mph speed limit, and it had a bus volume of 12/h. Clearway regulations applied during the morning peak period when the observations were made. Data were collected at three different positions on three different days at distances of 1082 ft (position A), 1378 ft (position B), and 1837 ft (position C) downstream from a signal. The good-

Transportation Research Record 905
ness of fit of traffic flow patterns predicted by Equation 1 with the observed traffic flow patterns was evaluated separately for each position. No platoon dispersion was found at position A. The bestf it parameter values at position B were a equal to 0.60 and B equal to 0.63. At position C, these values were a equal to 0.70 and B equal to 0.59.
To validate the accuracy of Equation 1 for conditions found in the United States, traffic flow data were collected by Alan M. Voorhees and Associates (8) on Route 7 east of its intersection with Towlston Road in Fairfax County, Virginia. Data were collected 100, 400, and BOO ft downstream from the intersection. Vehicle speeds were 55 mph. Equation 1 was applied to the average traffic flow pattern observed at the 100-ft station to predict the traffic flow patterns at the 400- and 800-ft stations. The parameter values determined by Lam (i.e., a equal to 0.24 and B equal to 0.8) were used to predict these patterns, because the data collected closely matched the free-flow, suburban arterial case evaluated by Lam. At , both the 400- and 800-ft stations, close agreement was obtained between the observed and predicted traffic flow patterns. Although it was acknowledged that additional research should be conducted to further refine the relationship between the parameters of Equation 1 and roadway conditions, it was concluded that it was possible to develop the general recommendations regarding this relationship shown in the first two columns of Table 1 (8).
Based on - the results of the study conducted by Alan M. Voorhees and Associates (§.l and preliminary work performed by the University of Florida, parameter values similar to those presented in the first two columns of Table 1 are suggested in the user's manual for TRANSYT-7F (1). A comparison of these values, which are also -presented in Table 1 (1), with those from the NCHRP report shows that these two sets of suggested parameter values are identical except in the case of a for moderate and low friction. However, as implied by the discussion in the user's manual, this agreement is more of an indica-
49
tion of the extent to which the parameter values from the TRANSYT-7F manual were based on those given in the NCHRP report than it is a validation of the relationship shown between the parameter values and roadway conditions.
A summary of the platoon dispersion studies cited above and conducted outside the United States is presented in Table 2. Together the findings of these studies indicate that there is a relationship between platoon dispersion and roadway conditions. In general, the greater the apparent level of friction to traffic flow implied by the description of roadway conditions, the greater is the platoon dispersion as reflected by a higher best-fit value of a. But although there seems to be a general agreement between the nature of the relationship shown in Table 2 and that presented in Table 1, the ranges of the parameter values are greater in Table 2. Not only does a vary over a wider range, but also best-fit values other than O. 8 are indicated for a. In fact, the limited amount of platoon dispersion research conducted in the United States has not investigated values other than O. 8 for B, probably because the TRANSYT signal-timing optimization program allows the user to specify an input value only for a and not for s. The value of 0.8 for B is fixed in the program. Thus, there is a need to develop a more defin i tive description of the relationship between these parameters and roadway conditions.
The primary objective of the research reported in this paper was to provide information that would contribute to the ultimate development of a def initive description of the relationship between the appropriate parameter values of the TRANSYT platoon dispersion model presented in Equation 1 and roadway conditions. The specific objectives of the research were (a) to observe the dispersion of platoons of passenger cars on urban arterial streets under lowfriction traffic flow conditions and (b) to calibrate the TRANSYT platoon dispersion model for the conditions observed. This paper presents the procedure, findings, and conclusions of this research.
Table 1. Parameter values recommended in NCH RP Report 233 and in TRANSYT-7F manual.
TRANSYT-7F NCHRP 233 Manual
C< {J C< {J
0.5 0.8 0.5 0.8
0.37 0.8 0.35 0.8
0.24 0.8 0.25 0.8
Roadway Characteristic
Heavy friction
Moderate friction
Low friction
Description of Conditions
Combination of parking, moderate to heavy turns, moderate to heavy pedestrian traffic, narrow lane width; traffic flow typical of urban CBD
Light turning traffic, light pedestrian traffic, 11- to 12-ft lanes, possibly divided; typical of welldesigned CBD arterial
No parking, divided, turning provisions, 12-ft lane width; suburban high-type arterial
Table 2. Summary of platoon dispersion studies conducted outside United States.
Best-Fit Parameter Value
0.20 0.24 0.40 0.63
0.608
0.70b 0.50
0.80 0.80 0.80 0.80
0.638
0.59b 0.80
Description of Conditions
Three-lane dual carriageway; suburban high-type arterial 'l'ypicnl suburban nrterfol rondwuy with two Innes In each direction: mm lanes provided 1l1r((·lune dual curriugeway with I 0-15 percent commeroial whicles; reasonable freedom for overt3ki ng Two-way road 35 ft wide wllh two narrow lanes in the direction studied; 2·J pl.'rconl commerci11l vehlclos; severely restrict~d overtaking
Single carriageway 33 ft wide on 5 percent downgrade; subject to 30-mph speed limit and clearway regulations during peak. periods; bus volume of 12 vehlcles/h in direction studied
Char ~loristi s ranging from single-lane Oow with hea.vy parking and very restricted overtaking to multilane flow with no parking and relatively free overtaking
a Fo r traffic flow pattern 1378 ft downstream. bFor traffic flow pattern 1837 ft downstream.
Reference
Collins and Gower (5) Lam (fl -Sneddon (4) Sneddon (1)
El-Reedy and Ashworth (7)
Robertson (2), Hillier and Rothery 0)

50
Table 3. Study sites.
Lanes Observed
Width Site Type of Arterial Street No. (ft) Alignment Gradient
I Two-way two-lane l 13 Tangent Level 2 Two-way two-lane 1 13 Tangent Level 3 Four-lane divided 2 12 Tangent Level 4 Four-l ane divided 2 12 Tangent Level 5 Four-lane divided 2 13 Tangent Level 6 Four-lane divided 2 12 Tangent Level
PROCEDURE
Platoon dispersion studies were conducted on six arterial street segments in Lincoln, Nebraska, during the summer of 1981. At each location, the traffic flow patterns of platoons of passenger cars discharging through a signalized intersection were recorded at four points over a distance of 1000 ft downstream from the signal. Two of the segments were on two-way two-lane streets and the other four were on two-way four-lane divided streets. Each segment was a level, tangent section and each had low-friction-type roadway characteristics. All of the studies were conducted during peak periods under fair weather and dry pavement conditions.
The traffic flow patterns recorded during these studies were analyzed to determine the values of the parameters a and 6 of the TRANSYT platoon dispersion model that provided the best agreement between observed traffic flow patterns and those predicted by the model. The Kolmogorov-Smirnov (K-S) test was then applied to evaluate the goodness of fit of the observed patterns with the patterns predicted by the calibrated model. Also, in order to provide a basis of comparison with previous research, the best-fit values of a with e equal to 0.8 were determined and tested.
Study Sites
In the selection of the study sites, an effort was made to find arterial street sections downstream of signalized intersections that were typical of lowfr iction traffic flow conditions. Therefore, all six sites selected were level, tangent sections with 12- to 13-ft lanes, and there was no parking ;it ;iny time along them. Four of the study sections did not have any driveways along them, and the driveway volumes on the other two sections were negligible and did not interfere with the platoon flow on the sections during the study periods. Two of the sections were on two-way two-lane streets with 35-mph posted speed limits. The other four sections were on four-lane divided streets with 45-mph posted speed limits. Characteristics of the study sites are summarized in Table 3.
The approaches to the signalized intersections upstream of the study sites on the two-way two-lane arterial streets had right-turn lanes of sufficient length so that right-turn movements did not interfere with the discharge of through-vehicle platoons in the adjacent lane. These approaches did not have left-turn lanes. However, the left-turn volumes on Llu~~e approaches were very low during the study periods so that the left-turn movements seldom interfered with the discharge of through-vehicle platoons. During the conduct of the field studies at these locations, the occurrence of left-turn movements was noted so that data collected for the platoons with which they were associated could be excluded from the subsequent data analysis.
Transportation Research Record 905
Speed Peak Driveway Limit Period
Parking Access (mph) Studied
None None 35 p.m . None Limited 35 p.m. None None 45 a.m. None None 45 a.m. None None 45 a.m. None Limited 45 a.m.
The approaches to the signalized intersections upstream of the study sites on the four-lane divided streets had left-turn and right-turn lanes. These lanes were of sufficient length so that the turning movements on these approaches did not interfere with the discharge of vehicle platoons from the two through lanes.
Data Collection
At each study site, four observers were stationed downstream from the signalized intersection. The first observer was located at a point immediately downstream from the intersection. The other three observers were located downstream from the first observer at distances of 300, 600, and 1000 ft, respectively. At each of these points, the observer recorded the time of arrival of every vehicle coming from the intersection by pressing a switch connected to a 20-pen recorder.
A fifth observer was stationed at the site of the 20-pen recorder, which was located near the intersection. This observer made notations directly on the recorder chart paper of the following items: (a) the beginning and ending of the green times on the street being studied, (b) the first vehicle of each platoon passing through the intersection, (c) platoons that contained any vehicles other than passenger cars, and (d) platoons that were delayed and/or influenced hy turning movements, pedestrians, stalled vehicles, or any other circumstances. These notations were made to facilitate the identification of passenger-car platoons to be studied in the subsequent data analysis.
Data Analysis
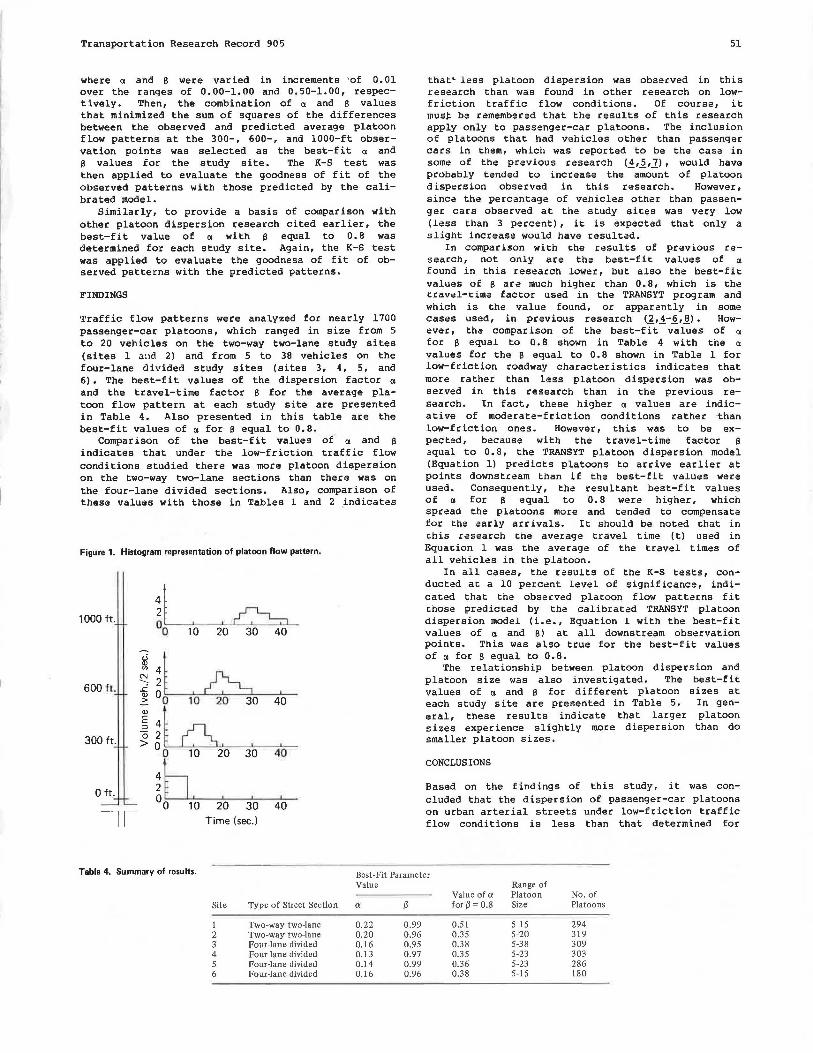
The 20-pen recorder charts were examined. Data for platoons that contained vehicles other than passenger cars and for platoons that were delayed or influenced by turning movements, pedestrians, stalled vehicles, or other circumstances were identified and excluded from the analysis. For each of the remaining platoons, the record of its traffic flow pattern at each of the four downstream observation points was identified and expressed as a histogram relating the number of vehicles that passed the point in each 2-s interval to time referenced to the instant at which the first vehicle in the platoon passed the first observation point. This histogram representation of platoon flow past each observation point is shown in Figure 1.
The histograms of all platoon flows at each study site were combined to determine the average platoon flow pattern at each observation point. The TRANSYT platoon dispersion model (Equation 1) was then applied to the average platoon flow pattern at the first observation point to predict an average platoon flow pattern at each of the other three observation points. Average platoon flow patterns were predicted for each combination of a and e values
Transportation Research Record 905
where a and B were varied in increments 'of 0.01 over the ranges of 0.00-1.00 and 0.50-1.00, respectively. Then, the combination of a and B values that minimized the sum of squares of the differences between the observed and predicted average platoon flow patterns at the 300-, 600-, and 1000-ft observation points was selected as the best-fit a and B values for the study site. The K-S test was then applied to evaluate the goodness of fit of the observed patterns with those predicted by the calibrated model.
Similarly, to provide a basis of comparison with other platoon dispersion research cited earlier, the best-fit value of a with B equal to 0.8 was determined for each study site. Again, the K-S test was applied to evaluate the goodness of fit of observed patterns with the predicted patterns.
FINDINGS
Traffic flow patterns were analyzed for nearly 1700 passenger-car platoons, which ranged in size from 5 to 20 vehicles on the two-way two-lane study sites (sites l and 2) and from 5 to 38 vehicles on the four-lane divided study sites (sites 3, 4, 5, and 6). The best-fit values of the dispersion factor a and the travel-time factor B for the average platoon flow pattern at each study site are presented in Table 4. Also presented in this table are the best-fit values of a for B equal to 0.8.
Comparison of the best-fit values of a and B indicates that under the low-friction traffic flow conditions studied there was more platoon dispersion on the two-way two-lane sections than there was on the four-lane divided sections. Also, comparison of these values with those in Tables l and 2 indicates
Figure 1. Histogram representation of platoon flow pattern.
1000 ft. ii I I ~ 00 10 20 30 40
500 r-i . ~ ;I I ~ I ! 00 10 20 30 40
300 ft. ! JI A . I I
0 10 20 30 40
0 ft. ~h. I I 0o 10 20 30 40
II Time (sec.)
51
that• less platoon dispersion was obsecved in this research than was found in other research on lowfriction traffic flow conditions. Of course, it mus~ be remembered that the results of this research apply only to passenger-car platoons. The inclusion of platoons that had vehicles other than passenger cars in them, which was reported to be the case in some of the previous research (_!,~,]) , would have probably tended to increase the amount of platoon dispersion observed in this research. However, since the percentage of vehicles other than passenger cars observed at the study sites was very low (less than 3 percent) , it is expected that only a slight increase would have resulted.
In comparison with the results of previous research, not only are the best-fit values of a found in this research lower, but also the best-fit values of B are much higher than 0. 8, which is the tcavel-time factor used in the TRANSYT program and which is the value found, or apparently in some cases used, in previous research (2,4-6,8). However, the comparison of the best-fit - v:i1-;:;es of a for equal to O. 8 shown in Table 4 with the a values for the B equal to O. 8 shown in Table l for low-friction roadway characteristics indicates that more rather than less platoon dispersion was observed in this research than in the previous research. In fact, these higher a values are indicative of moderate-friction conditions rather than low-friction ones. However, this was to be expected, because with the travel-time factor B equal to 0.8, the TRANSYT platoon dispersion model (Equation 1) predicts platoons to arrive earlier at points downstream than if the best-fit values were used. Consequently, the resultant best-fit values of a for B equal to 0.8 were higher, which spread the platoons more and tended to compensate for the early arrivals. It should be noted that in chis research the average travel time (t) used in Equation 1 was the average of the travel times of all vehicles in the platoon.
In all cases, the results of the K-S tests, conducted at a 10 percent level of significance, indicated that the observed platoon flow patterns fit those predicted by the calibrated TRANSYT platoon dispersion model (i.e., Equation 1 with the best-fit values of a and B) at all downstream observation points. This was also true for the best-fit values of a for B equal to 0.8.
The relationship between platoon dispersion and platoon size was also investigated. The best-fit values of a and B for different platoon sizes at each study site are presented in Table 5. In general, these results indicate that larger platoon sizes experience slightly more dispersion than do smaller platoon sizes.
CONCLUSIONS
Based on the findings of this study, it was concluded that the dispersion of passenger-car platoons on urban arterial streets under low-friction traffic flow conditions is less than that determined for
Table 4. Summary of results. Best-Fit Parameter Value Range of
Value of ex Platoon No. of Site Type of Street Section ex f3 for f3 = 0.8 Size Platoons
l Two-way two-lane 0.22 0.99 0.51 5-15 294 2 Two-way two-lane 0.20 0.96 0.35 5-20 319 3 Four-lane divided 0.16 0.95 0.38 5-38 309 4 Four-lane divided 0.13 0.97 0.35 5-23 303 5 Four-lane divided 0.14 0.99 0.36 5-23 286 6 Four-lane divided 0.16 0.96 0.38 5-15 180

52
Table 5. Best-fit parameter values versus platoon size.
Platoon Size Range
5-10 Vehicles 11-15 Vehicles 16-20 Vehicles
Site °' (J °' (J °' (J
I 0.21 0.99 0.24 0.99 NA NA 2 0.21 0.92 0.24 0.94 NA NA 3 0.08 0.99 0.14 0.97 0.12 0.97 4 0.09 0.98 0.11 0.98 0.13 0.97 5 0.06 0.99 0.10 0.98 0.16 0.96 6 0.13 0.97 0.16 NA NA NA
Note: NA= sufficient data not available.
low-friction roadway characteristics by previous research. In addition, the dispersion of passengercar platoons is less on a four-lane divided arterial street than it is on a two-way two-lane arterial street. Also, larger platoons experience more dispersion than do smaller platoons.
In regard to calibration of the TRANSYT platoon dispersion model, the average results of this research indicate that appropriate values of the dispersion factor a and the travel-time factor a for passenger-car platoons under low-friction traffic flow conditions on urban arterial streets are as follows:
Type of Street Two-way two-lane Four-lane divided
!!. 0.21 0.15
i 0.97 0.97
Thus, in order to more accurately account for the patterns of passenger-car platoon flow for these conditions, the input to the TRANSYT program should be revised to enable the user to specify the traveltime factor a as well as the dispersion factor a.
REFERENCES
l . TRANSYT-7F User's Manual. Office of Traffic Operations, FHWA, Feb. 1981.
Transportation Research Record 905
21-25 Vehicles 26-30 Vehicles
°' (J °' (J
NA NA NA NA NA NA NA NA 0.14 0.98 0.16 0.99 NA NA NA NA NA NA NA NA NA NA NA NA
2. D.I. Robertson. TRANSYT: A Traffic Network Study Tool. U.K. Transport and Road Research Laboratory, Crowthorne, Berkshire, England, Rept. LR 253, 1969.
3. J.A. Hillier and R. Rothery. The Synchroni~ation of Traffic Signals for Minimum Delay. Transportation Science, Vol. 1, No. 2, May 1967, pp. 81-94.
4. P.A. Sneddon. Another Look at Platoon Dispersion--3: The Recurrence Relationship. Traffic Engineering and Control, Feb. 1972, pp. 442-444.
5. J.F. Collins and P. Gower. Dispersion of Traffic Platoons on A4 in Hounslow. U.K. Transport and Road Research Laboratory, Crowthorne, Berkshire, England, TRRL Rept. SR 29UC, 1974.
6. J.K. Lam. Studies of a Platoon Dispersion Model and Its Practical Applications. Proc., Seventh International Symposium on Transportation and Traffic Theory, Institute of Systems Science Research, Kyoto, Japan, 1977.
7. T. Y. El-Reedy and R. Ashworth. Platoon Dispersion Along a Major Road in Sheffield. Traffic Engineering and Control, April 1978, pp. 186-189.
8. P.J. Tarnoff and P.S. Parsonson. Selecting Traffic Signal Control at Individual Intersections. NCHRP, Rept. 233, June 1981.
Publication of this paper sponsored by Committee on Traffic Flow Theory and Characteristics.
Evaluation of Dynamic Freeway Flow Model By Using Field Data
N.A. DERZKO, A.J. UGGE, AND E.R. CASE
An attempt to calibrate and validate a dynamic freeway model by using real data from Queen Elizabeth Way in Ontario, Canada, is described. The model used in this research is the one developed by H. Payne; one of the Phillips kinetic models was also applied for comparison purposes. The overall conclusion is that the models exhibit instabilities in their behavior and do not track real road data correctly.
Traffic simulation models are playing an increasingly important role in the development of urban freeway traffic management systems because they provide an economical and safe way to evaluate alternative system designs and control strategies prior to implementation. Freeway models in common use today are adequate for simulating traffic conditions over
a period of hours but are not sufficiently realistic for the research and development of new surveillance and control techniques for real-time applications. For such applications, the model must have the ability to realistically represent the shorter-term dynamic phenomena (e.g., shock waves) characteristic or traf'tic tlow. These cumlideratiumi l<o!ll tu d t:<o!view a few years ago of the state of the art of traffic flow models and eventually to the conclusion that the Payne model (1-6) seemed to be the most realistic and the most developed of the very few dynamic models available at the time. Unfortunately, although it had been tested to some degree, the model had never undergone a comprehensive validation