calgary real estate market stats december 2015
TRANSCRIPT

Calgary & Area Real Estate Statistics:
December 2015
1
Request Your Free Home Evaluation Today!

TABLE OF CONTENTS
3December Real Estate Summary
4 - 5City of Calgary Detached Homes Sales Data
6 - 7City of Calgary Semi-Detached Homes Sales Data
8 - 9City of Calgary Row Homes Sales Data
10 - 11City of Calgary Apartment Homes Sales Data
12 – 13Rural Rockyview Detached Sales Data
14Message From The Calgary Real Estate Board
15 – 16Rural Foothills Detached Sales Data
17 – 18City of Airdrie Detached Sales Data
19 - 20City of Airdrie Semi-Detached Sales Data
21-22City of Airdrie Row Sales Data
23 – 24City of Airdrie Apartment Sales Data
2

Housing Market Characterized By Slow Demand
Elevated supply levels placed downward pressure on prices in December
“With the focus shifting toward the holiday season, December sales activity slowed to 878 units in the city, 18 per cent below last year at this time and well below the five and 10-year averages.
Asaresult,theunadjustedbenchmarkpricedippedto$448,800,a0.42percentdeclineoverthepreviousmonthand2.33yearoveryear.CREB®chiefeconomistAnn-MarieLurienotedDecemberfollowedapatternestablishedearlyonin2015,whichwascharacterizedbyslowerhousingdemand.”(Source: Calgary Real Estate Board)
Onanannualbasis,salesactivitydeclinedby24percentinthedetachedsectorand33and28percentintheapartmentandattachedsegments,respectively.
WhileDecemberpricesforboththedetachedandattachedsectorswere1.91and1.29percentlowerthanlevelsrecordedatthebeginningof2015,onanannualaveragebasis,theyremained1.35and1.84percentabove2014numbers.
AnyonewhohasbeenfollowingthemediareportsonrealestateknowsthattheCalgaryRealEstateMarketingeneralhascorrected.Howeverthedatashowsthatsomemarketsegmentsarelessaffectedthanothers.IntheCityofCalgarytheApartmentsectorhasbeenthehardesthitwithlessthan9%ofavailableapartmentssellinginthemonthofDecember.
Forthosewhoareselling,itisvitaltoknowhowthemarketisperformingforyourspecifictypeofproperty!
Ifyouarecuriousabouttheinvestmentmarketorthecurrentmarketvalueofyourhome,pleasefeelfreetocontactus.
Hope this helps!
Susanita de Diego
3

City of Calgary Detached Homes Sales DataYearly – December 2014 – December 2015
The following table shows the City of Calgary Detached Homes Sales Data for each month since December of last year.
Month/Year DetachedSales
PreviousMonthEndInventory+InventoryAdded
DuringtheMonth
%ofAvailableInventorySold
DaysonMarket
MonthsofSupply
December2014 604 2,158+761=2,919 20.70% 41 2.97
January2015 533 1,791+1,835=3,626 14.70% 37 4.85
February2015 740 2,583+1,671=4,254 17.40% 34 4.03
March2015 1,080 2,980+1,774=4,754 22.70% 37 2.80
April2015 1,150 3,029+1,770=4,799 24.00% 38 2.65
May2015 1,150 3,048+1,876=4,924 27.91% 38 2.13
June2015 1,331 2,926+1,831=4,757 28.00% 37 2.10
July2015 1,220 2,793+1,731=4,524 27.00% 37 2.26
August2015 994 2,756+1,643=4,399 22.60% 37 2.85
September2015 906 2,834+1,769=4,603 19.70% 37 3.35
October2015 871 3,031+1,441=4,472 19.50% 38 3.36
November2015 797 2,923+1,185=4,108 19.40% 43 3.37
December2015 533 2,688+793=3,481 15.30% 47 4.01
City of Calgary Detached Homes Sales DataMonthly – December 2011 – December 2015
The following table shows the City of Calgary Detached Homes Sales Data for each month since Decembr of last year.
Month/Year DetachedSales PreviousMonthEndInventory+Inventory
AddedDuringtheMonth
%ofAvailableInventorySold
DaysonMarket
MonthsofSupply
December2011 623 3,209+644=3,853 16.30% 58 3.74
December2012 657 2,293+539=2,832 23.20% 51 2.46
December2013 674 1,883+548=2,431 27.70% 44 1.97
December2014 604 2,158+761=2,919 20.70% 41 2.97
December2015 533 2,688+793=3,481 15.30% 47 4.01
4
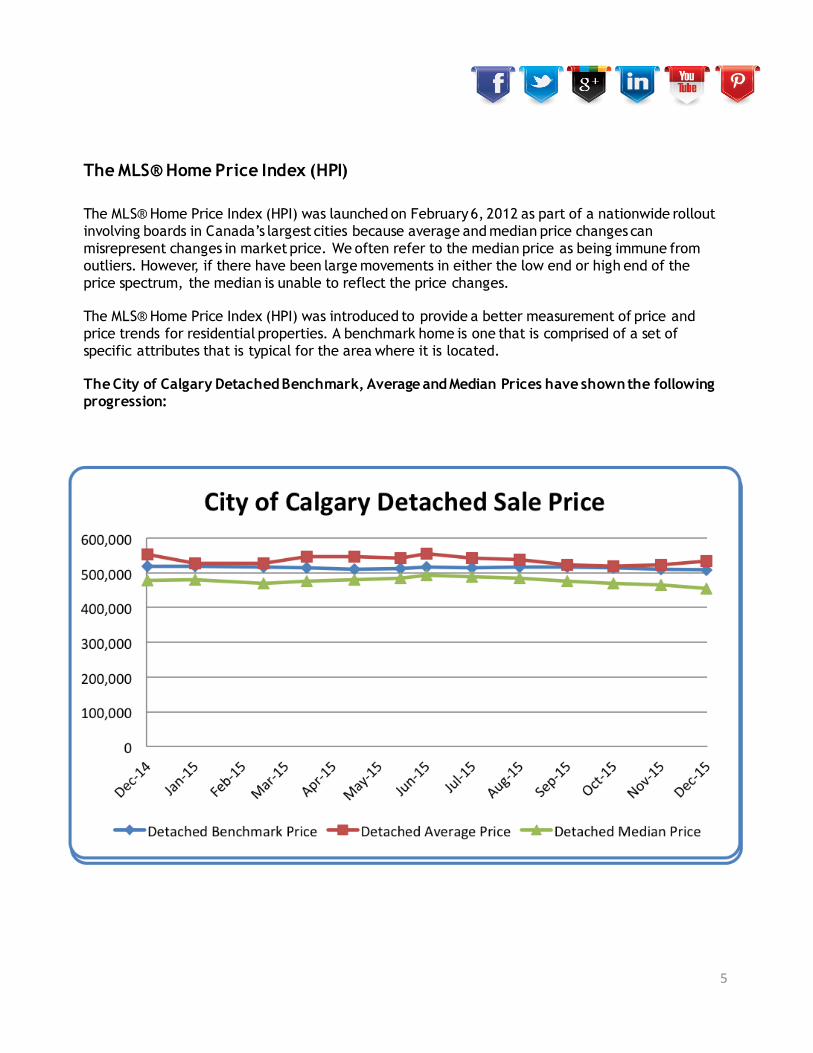
The MLS® Home Price Index (HPI)
The MLS® Home Price Index (HPI) was launched on February 6, 2012 as part of a nationwide rollout involving boards in Canada’s largest cities because average and median price changes can misrepresent changes in market price. We often refer to the median price as being immune from outliers. However, if there have been large movements in either the low end or high end of the price spectrum, the median is unable to reflect the price changes.
The MLS® Home Price Index (HPI) was introduced to provide a better measurement of price and price trends for residential properties. A benchmark home is one that is comprised of a set of specific attributes that is typical for the area where it is located.
The City of Calgary Detached Benchmark, Average and Median Prices have shown the following progression:
5

City of Calgary Semi-Detached Homes Sales DataYearly – December 2014 – December 2015
The following table shows the City of Calgary Semi-Detached Homes Sales Data for each month since Deceber of last year.
Month/Year Semi-DetachedSales
PreviousMonthEndInventory+InventoryAdded
DuringtheMonth
%ofAvailableInventorySold
DaysonMarket
MonthsofSupply
December2014 103 421+131=552 18.66% 46 3.44
January2015 76 354+298=485 15.67% 42 6.12
February2015 97 465+275=740 13.11% 35 5.55
March2015 158 538+307=845 18.70% 41 3.61
April2015 202 570+265=835 24.19% 39 2.48
May2015 192 501+296=797 24.09% 45 2.52
June2015 179 483+294=777 23.04% 43 2.74
July2015 191 490+283=773 24.71% 44 2.58
August2015 138 492+244=736 18.75% 41 3.66
September2015 103 505+269=774 13.31% 40 5.38
October2015 129 556+294=850 15.18% 41 4.56
November2015 108 588+199=787 13.72% 47 5.06
December2015 74 547+141=688 10.80% 53 6.03
City of Calgary Semi-Detached Homes Sales DataMonthly – December 2011 – December 2015
The following table shows the City of Calgary Semi-Detached Homes Sales Data for each month since December of last year.
Month/Year AttachedSales PreviousMonthEndInventory+Inventory
AddedDuringtheMonth
%ofAvailableInventorySold
DaysonMarket
MonthsofSupply
December2011 93 447+113=560 16.60% 59 3.90
December2012 88 336+90=426 20.70% 50 2.92
December2013 115 317+101=418 27.50% 54 2.09
December2014 103 421+131=552 18.66% 46 3.44
December2015 74 547+141=688 10.80% 53 6.03
6

The following table shows the City of Calgary Semi-Detached Sales Data for each month since December of last year.
7

City of Calgary Row Homes Sales DataYearly – December 2014 – December 2015
The following table shows the City of Calgary Semi-Detached Homes Sales Data for each month since December of last year.
Month/Year RowSales PreviousMonthEndInventory+InventoryAdded
DuringtheMonth
%ofAvailableInventorySold
DaysonMarket
MonthsofSupply
December2014 144 438+172=610 23.61% 43 2.68
January2015 113 386+389=775 14.58% 41 4.85
February2015 155 548+395=943 16.44% 33 4.35
March2015 236 675+374=1,049 22.50% 38 2.88
April2015 258 679+418=1,097 23.52% 42 2.80
May2015 273 722+379=1,101 24.80% 41 2.46
June2015 269 672+385=1,057 25.45% 44 2.39
July2015 255 644+383=1,072 23.79% 44 2.49
August2015 227 636+332=968 23.45% 46 2.79
September2015 181 633+387=1,020 17.75% 41 3.82
October2015 185 720+368=1,088 17.00% 41 4.03
November2015 161 745+305=1,050 15.33% 50 4.58
December2015 120 738+208=946 12.70% 47 5.26
City of Calgary Row Homes Sales DataMonthly – December 2011 – December 2015
The following table shows the City of Calgary Row Homes Sales Data for each month since December of last year.
Month/Year AttachedSales PreviousMonthEndInventory+Inventory
AddedDuringtheMonth
%ofAvailableInventorySold
DaysonMarket
MonthsofSupply
December2011 114 581+113=694 16.40% 60 3.86
December2012 113 402+101=503 22.50% 51 2.51
December2013 157 319+106=425 36.90% 46 1.32
December2014 144 438+172=610 23.61% 43 2.68
December2015 120 738+208=946 12.70% 47 5.26
8
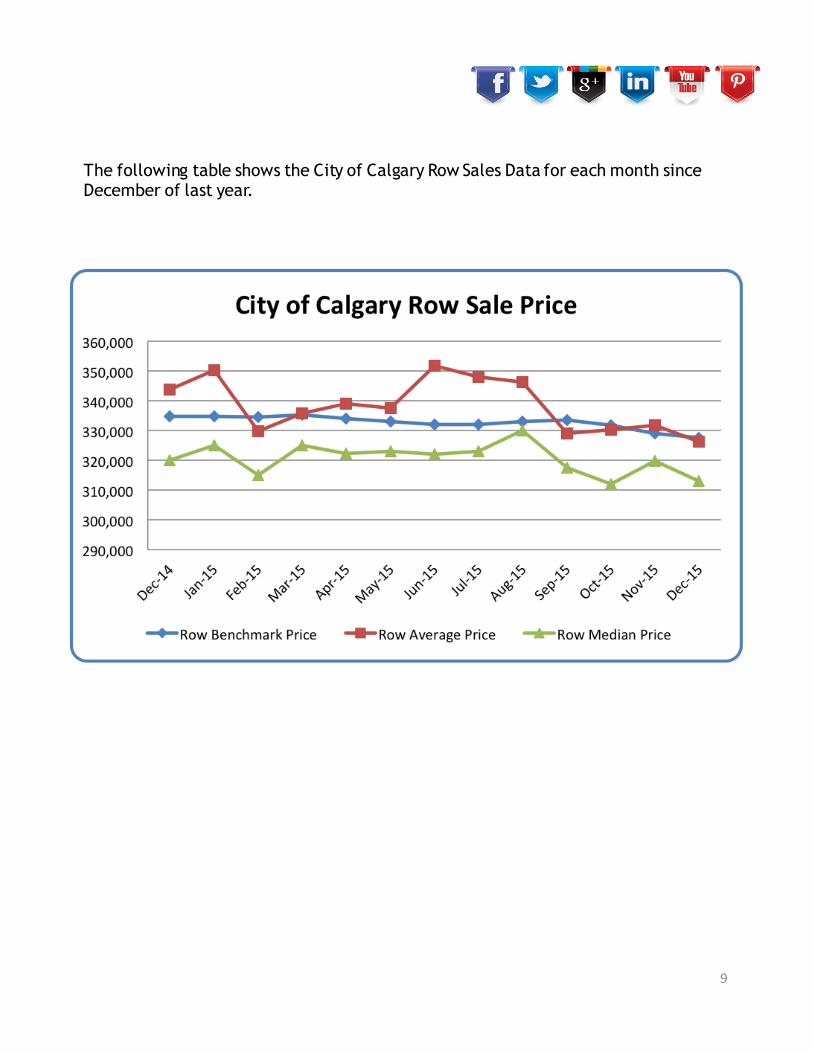
The following table shows the City of Calgary Row Sales Data for each month since December of last year.
9

City of Calgary Apartment Homes Sales DataYearly – December 2014 – December 2015
The following table shows the City of Calgary Apartment Homes Sales Data for each month since December of last year.
Month/Year ApartmentSales
PreviousMonthEndInventory+InventoryAdded
DuringtheMonth
%ofAvailableInventorySold
DaysonMarket
MonthsofSupply
December2014 222 1,041+304=1,269 17.57% 46 3.65
January2015 154 853+745=1,598 9.60% 55 7.79
February2015 215 1,200+593=1,793 12.00% 40 6.23
March2015 302 1,340+672=2,012 15.00% 43 4.73
April2015 352 1,428+608=2,036 17.30% 45 3.89
May2015 359 1,368+613=1,981 18.10% 48 3.65
June2015 399 1,311+611=1,922 20.80% 48 3.04
July2015 324 1,212+582=1,794 18.10% 47 3.84
August2015 281 1,245+514=1,759 16.00% 47 4.37
September2015 259 1,227+657=1,884 13.70% 49 4.99
October2015 237 1,293+587=1,888 12.60% 50 5.76
November2015 195 1,366+489=1,855 10.50% 50 6.94
December2015 151 1,353+341=1,694 8.90% 56 7.42
City of Calgary Apartment Homes Sales DataMonthly December 2011 – December 2015
The following table shows the City of Calgary Apartment Homes Sales Data for each month since December of last year.
Month/Year ApartmentSales
PreviousMonthEndInventory+Inventory
AddedDuringtheMonth
%ofAvailableInventorySold
DaysonMarket
MonthsofSupply
December2011 186 1,068+200=1,268 14.70% 67 4.38
December2012 220 846+147=993 22.20% 67 2.65
December2013 223 613+213=826 27.00% 51 2.14
December2014 223 966+303=1,269 17.57% 46 3.65
December2015 151 1,353+341=1,694 8.90% 56 7.42
10

The City of Calgary Apartment Benchmark, Average and Median Prices have shown the following progression:
11
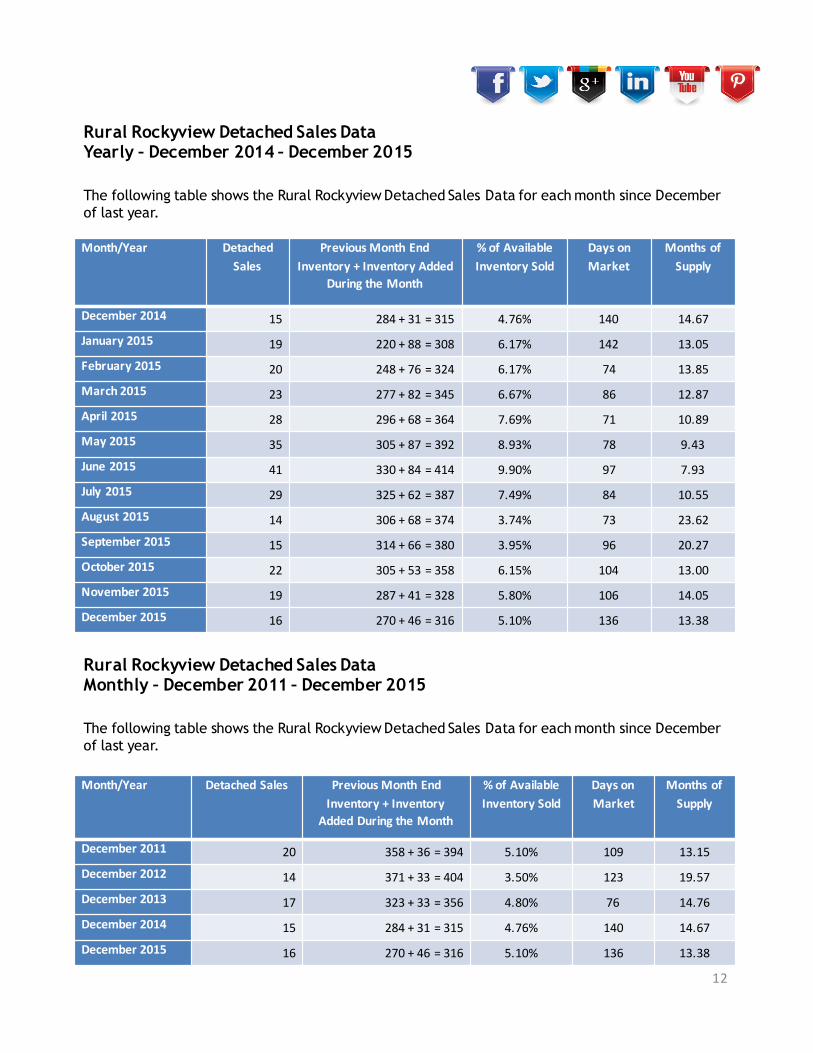
Rural Rockyview Detached Sales DataYearly – December 2014 – December 2015
The following table shows the Rural Rockyview Detached Sales Data for each month since December of last year.
Month/Year DetachedSales
PreviousMonthEndInventory+InventoryAdded
DuringtheMonth
%ofAvailableInventorySold
DaysonMarket
MonthsofSupply
December2014 15 284+31=315 4.76% 140 14.67
January2015 19 220+88=308 6.17% 142 13.05
February2015 20 248+76=324 6.17% 74 13.85
March2015 23 277+82=345 6.67% 86 12.87
April2015 28 296+68=364 7.69% 71 10.89
May2015 35 305+87=392 8.93% 78 9.43
June2015 41 330+84=414 9.90% 97 7.93
July2015 29 325+62=387 7.49% 84 10.55
August2015 14 306+68=374 3.74% 73 23.62
September2015 15 314+66=380 3.95% 96 20.27
October2015 22 305+53=358 6.15% 104 13.00
November2015 19 287+41=328 5.80% 106 14.05
December2015 16 270+46=316 5.10% 136 13.38
Rural Rockyview Detached Sales DataMonthly – December 2011 – December 2015
The following table shows the Rural Rockyview Detached Sales Data for each month since December of last year.
Month/Year DetachedSales PreviousMonthEndInventory+Inventory
AddedDuringtheMonth
%ofAvailableInventorySold
DaysonMarket
MonthsofSupply
December2011 20 358+36=394 5.10% 109 13.15
December2012 14 371+33=404 3.50% 123 19.57
December2013 17 323+33=356 4.80% 76 14.76
December2014 15 284+31=315 4.76% 140 14.67
December2015 16 270+46=316 5.10% 136 13.38
12

Rural Rockyview Detached Sales Data Benchmark, Average and Median Prices have shown the following progression:
13

“Economic uncertainty, followed by weak economic conditions and job losses, contributed to slowing housing demand throughout the year ” said CREB® chief economist Ann-Marie Lurie.
“”
14
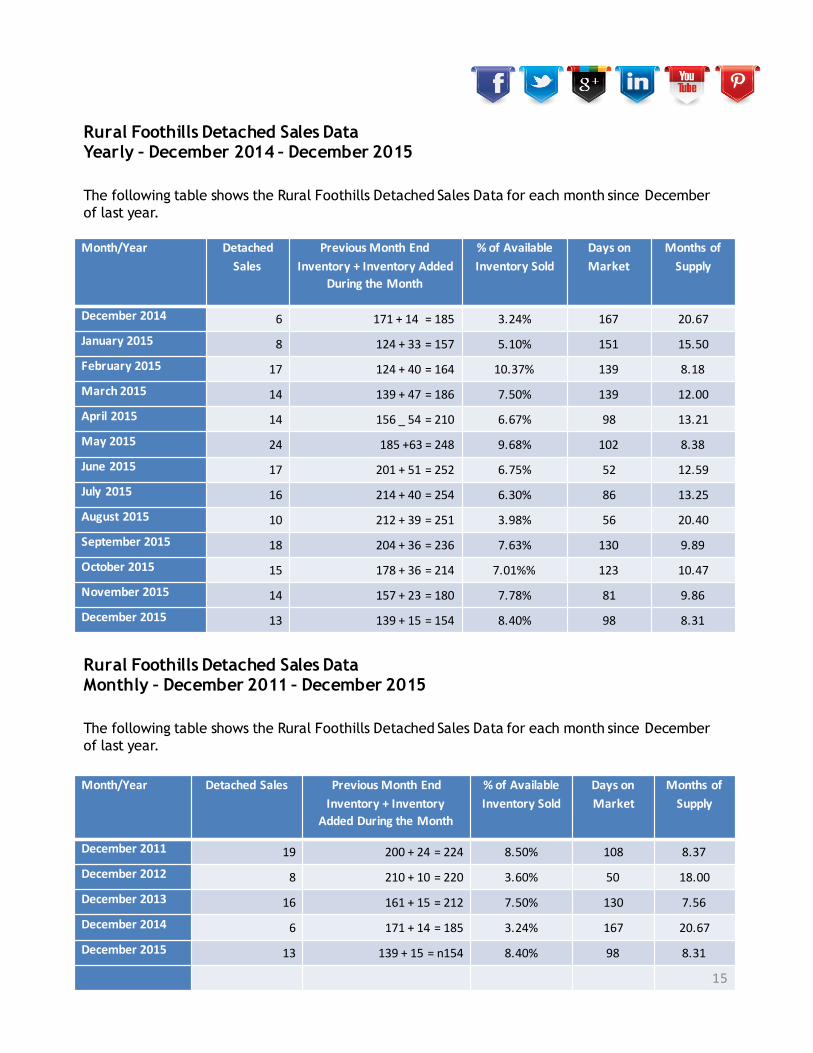
Rural Foothills Detached Sales DataYearly – December 2014 – December 2015
The following table shows the Rural Foothills Detached Sales Data for each month since December of last year.
Month/Year DetachedSales
PreviousMonthEndInventory+InventoryAdded
DuringtheMonth
%ofAvailableInventorySold
DaysonMarket
MonthsofSupply
December2014 6 171+14=185 3.24% 167 20.67
January2015 8 124+33=157 5.10% 151 15.50
February2015 17 124+40=164 10.37% 139 8.18
March2015 14 139+47=186 7.50% 139 12.00
April2015 14 156_54=210 6.67% 98 13.21
May2015 24 185+63=248 9.68% 102 8.38
June2015 17 201+51=252 6.75% 52 12.59
July2015 16 214+40=254 6.30% 86 13.25
August2015 10 212+39=251 3.98% 56 20.40
September2015 18 204+36=236 7.63% 130 9.89
October2015 15 178+36=214 7.01%% 123 10.47
November2015 14 157+23=180 7.78% 81 9.86
December2015 13 139+15=154 8.40% 98 8.31
Rural Foothills Detached Sales DataMonthly – December 2011 – December 2015
The following table shows the Rural Foothills Detached Sales Data for each month since December of last year.
Month/Year DetachedSales PreviousMonthEndInventory+Inventory
AddedDuringtheMonth
%ofAvailableInventorySold
DaysonMarket
MonthsofSupply
December2011 19 200+24=224 8.50% 108 8.37
December2012 8 210+10=220 3.60% 50 18.00
December2013 16 161+15=212 7.50% 130 7.56
December2014 6 171+14=185 3.24% 167 20.67
December2015 13 139+15=n154 8.40% 98 8.31
15

Rural Foothills Detached Sales Data Benchmark, Average and Median Prices have shown the following progression:
16

City of Airdrie Detached Sales DataYearly – December 2014 – December 2015
The following table shows the City of Airdrie Detached Sales Data for each month since December of last year.
Month/Year DetachedSales
PreviousMonthEndInventory+InventoryAdded
DuringtheMonth
%ofAvailableInventorySold
DaysonMarket
MonthsofSupply
December2014 44 131+56=187 23.53% 48 2.89
January2015 41 127+154=281 14.59% 43 5.10
February2015 70 211+149=360 19.44% 35 3.51
March2015 93 248+133=381 24.41% 38 2.62
April2015 92 245+140=385 23.90% 40 2.66
May2015 112 243+159=404 27.72% 41 2.16
June2015 117 243+157=400 29.25% 43 2.06
July2015 106 240+128=368 28.80% 37 2.16
August2015 87 224+127=351 24.79% 40 2.58
September2015 86 227+115=342 25.15% 52 2.55
October2015 64 219+122=341 18.77% 50 3.66
November2015 55 234+93=327 16.82% 45 4.18
December2015 42 230+59=289 14.50% 53 4.81
City of Airdrie Detached Sales DataMonthly – December 2011 – December 2015
The following table shows the City of Airdrie Detached Sales Data for each month since December of last year.
Month/Year DetachedSales PreviousMonthEndInventory+Inventory
AddedDuringtheMonth
%ofAvailableInventorySold
DaysonMarket
MonthsofSupply
December2011 53 257+51=308 17.20% 84 3.62
December2012 40 154+35=189 21.20% 61 3.05
December2013 37 119+39=158 23.40% 53 2.57
December2014 44 131+56=187 23.53% 48 2.89
December2015 42 230+59=289 14.50% 53 4.81
17

City of Airdrie Detached Sales Data Benchmark, Average and Median Prices have shown the following progression:
18

City of Airdrie Semi-Detached Sales DataYearly – December 2014 – December 2015
The following table shows the City of Airdrie Semi-Detached Sales Data for each month since December of last year.
Month/Year Semi-detachedSales
PreviousMonthEndInventory+InventoryAdded
DuringtheMonth
%ofAvailableInventorySold
DaysonMarket
MonthsofSupply
December2014 7 9+6=15 46.67% 30 1.00
January2015 4 7+21=28 14.29% 23 5.75
February2015 8 23+20=43 18.60% 42 3.63
March2015 14 29+11=40 35% 43 1.50
April2015 12 21+17=38 31.58% 29 1.83
May2015 9 22+12=34 26.47% 32 2.11
June2015 12 19+20=39 30.77% 36 1.92
July2015 16 23+13=36 44.44% 35 1.31
August2015 12 21+16=37 32.43% 50 1.67
September2015 8 20+10=30 26.67% 26 2.75
October2015 9 23+10=33 27.30% 41 2.00
November2015 11 18+8=26 42.30% 29 1.45
December2015 4 16+5=21 19.00% 66 2.75
City of Airdrie Semi-Detached Sales DataMonthly – December 2011 – December 2015
The following table shows the City of Airdrie Semi-Detached Sales Data for each month since December of last year.
Month/Year Semi-detachedSales
PreviousMonthEndInventory+Inventory
AddedDuringtheMonth
%ofAvailableInventorySold
DaysonMarket
MonthsofSupply
December2011 1 13+2=15 6.70% 33 11.00
December2012 0 8+5=13
December2013 7 10+2=12 58.30% 39 0.86
December2014 7 9+6=15 46.67% 30 1.00
December2015 4 16+5=21 19.00% 66 2.75
19

City of Airdrie Attached Sales Data Benchmark, Average and Median Prices have shown the following progression:
20

City of Airdrie Row Sales DataYearly – December 2014 – December 2015
The following table shows the City of Airdrie Row Sales Data for each month since December of last year.
Month/Year RowSales PreviousMonthEndInventory+InventoryAdded
DuringtheMonth
%ofAvailableInventorySold
DaysonMarket
MonthsofSupply
December2014 4 15+8=23 17.39% 26 4.00
January2015 13 16+22=38 34.21% 41 1.62
February2015 9 21+37=38 23.68% 37 5.11
March2015 18 46+39=85 21.18% 34 3.22
April2015 28 58+38=96 29.17% 41 2.14
May2015 25 60+30=90 27.78% 31 2.32
June2015 28 58+40=98 28.57% 46 2.29
July2015 28 64+38=102 27.45% 48 2.21
August2015 27 62+22=84 32.14% 39 1.89
September2015 12 51+35=86 13.95% 51 5.00
October2015 16 62+37=99 16.20% 58 4.38
November2015 17 70+22=92 18.50% 63 3.59
December2015 14 62+18=80 17.50% 70 4.07
City of Airdrie Row Sales DataMonthly – December 2011 – December 2015
The following table shows the City of Airdrie Row Sales Data for each month since December of last year.
Month/Year RowSales PreviousMonthEndInventory+Inventory
AddedDuringtheMonth
%ofAvailableInventorySold
DaysonMarket
MonthsofSupply
December2011 6 32+11=43 14.00% 67 5.00
December2012 4 26+2=28 14.30% 65 5.50
December2013 7 14+4=18 38.90% 38 1.75
December2014 4 15+8=23 17.39% 26 4.00
December2015 14 62+18=80 17.50% 70 4.07
21

City of Airdrie Apartment Sales Data Benchmark, Average and Median Prices have shown the following progression:
22

City of Airdrie Apartment Sales DataYearly – December 2014 – December 2015
The following table shows the City of Airdrie Apartment Sales Data for each month since December of last year.
Month/Year ApartmentSales
PreviousMonthEndInventory+InventoryAdded
DuringtheMonth
%ofAvailableInventorySold
DaysonMarket
MonthsofSupply
December2015 9 21+9=30 30.00% 53 2.22
January2015 7 20+25=45 15.56& 40 5.14
February2015 12 26+25=51 14.81% 29 3.58
March2015 13 43+11=54 24.07% 50 2.77
April2015 6 36+19=55 10.91% 70 7.50
May2015 7 45+22=66 10.61% 36 7.14
June2015 9 50+26=76 11.84% 111 6.22
July2015 13 56+18=74 17.57%% 57 3.92
August2015 8 51+19=70 11.43% 61 5.88
September2015 12 47+17=64 18.75% 50 3.50
October2015 6 42+15=57 10.53% 57 6.00
November2015 6 36+6=42 14.30% 51 3.83
December2015 6 23+6=29 20.70% 55 3.17
City of Airdrie Apartment Sales DataMonthly – December 2011 – December 2015
The following table shows the City of Airdrie Apartment Sales Data for each month since December of last year.
Month/Year ApartmentSales PreviousMonthEndInventory+Inventory
AddedDuringtheMonth
%ofAvailableInventorySold
DaysonMarket
MonthsofSupply
December2011 10 35+5=40 25.00% 72 3.20
December2012 0 18+5=23
December2013 7 12+4=16 43.80% 39 1.29
December2014 9 21+9=30 30.00% 53 2.22
December2015 6 23+6=29 20.70% 55 3.17
23

City of Airdrie Apartment Sales Data Benchmark, Average and Median Prices have shown the following progression:
24

Curious About theValue of Your Home?
Asyoucansee,currentmarketconditions playacriticalroleindeterminingthevalueofyourhome.
Equallyimportanthowever,ishavinganexperiencedandknowledgeableprofessionalRealtor®onyourside.
ColdwellBankerCompleteRealEstatewouldwelcometheopportunity todiscussanyofyourRealEstateneedsatyourconvenience.
#yesyoumatter
Request Your Free Home Evaluation Today!
ColdwellBankerCompleteRealEstatePhone: 403-686-1455
25