calendar spreads a calendar spread involves selling a front month short and buying a back month...
TRANSCRIPT

SMB CAPITAL OPTIONS TRAINING PROGRAM

Calendar
Spreads
SESSION TEN

The Calendar spread is one short option and one long option in a later month, at the same strike.

Analyze Graph of Calendar Spread

A calendar spread involves selling a front month short and buying a back month long at the same strike.
The more implied volatility embedded in the short front month strike and the less embedded in the back month long the better—”buy low, sell high”.
Normally the back month has a higher IV than the front month (not always) and therefore—a “negative horizontal skew”. The less negative the horizontal skew the better.
Note: Positive skews are often a sign of expected near term volatility in price and should be carefully investigated.
Horizontal Skews

Positive Skew
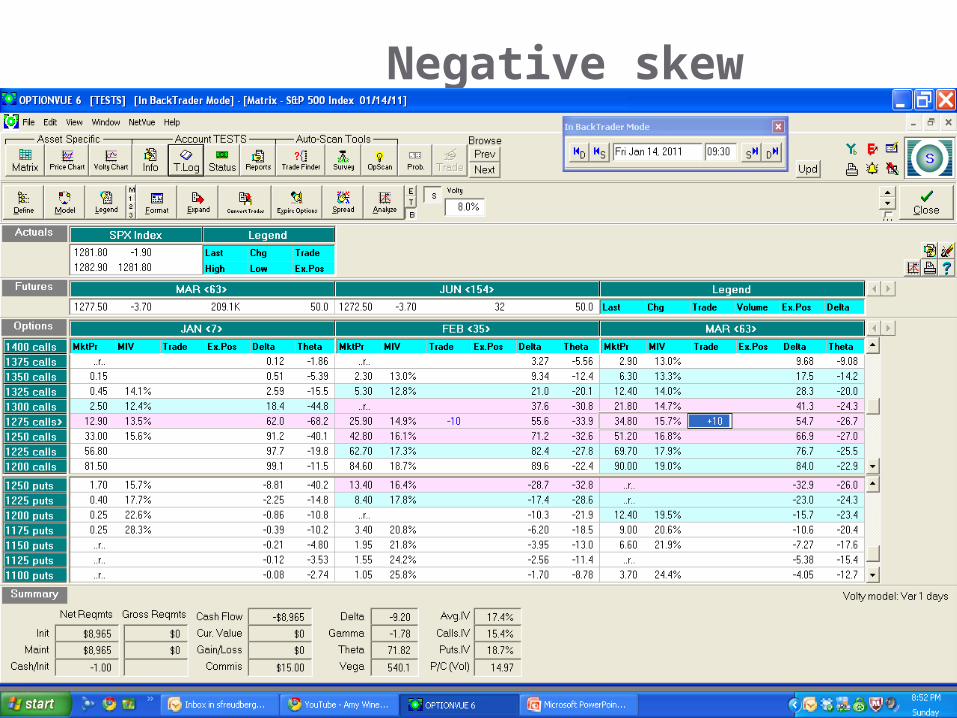
Negative skew

A calendar spread works because front at-the-money time premium burns off much faster than back month time premium at the same strike .THE RELATIVE BURN DOWN OF TIME PREMIUM BETWEEN THE SHORT AND LONG OPTIONS ARE WHAT MAKES A CALENDAR “WORK”.
But they differ from butterflies (the “other at-the-money theta trade”) in that they are POSITIVE vega vs. negative vega.
That is because the long portion of the calendar has more vega than the short portion. This positive vega issue can become a serious problem in calendar spreads.
Calendar spreads are time spreads

As the deterioration of time premium accelerates for ATM options at about the 30 day mark, most calendar trades commence in the 30-37 day range. This also allows for recycling of capital.
Calendar is simply put on at the money-one short strike and one long strike in the next month.
Place the calendar on the side with the most advantageous skew—which is the least negative of course.
Calendar Trade Basics

Call side with best skew

Best to initiate trade when implied volatilities are below average of last 3-6 months—reduces vega risk
Initiate at the money and if market hits either side breakeven, or P and L down 10%, add second calendar farther out of the money in the direction of the market—allow room for further trend.
Now a double calendar, if market hits half-way between either calendar and breakeven, roll calendars to halve deltas.
Complete this process until +15% of planned capital is achieved, unless excessive rolling suggests lower target.
Maximum loss of 20% of planned capital
Calendar Trade

Trade Initiation, at the money, 30-37 days out

Analyze Graph of Calendar at trade initiation

Market hits upside breakeven
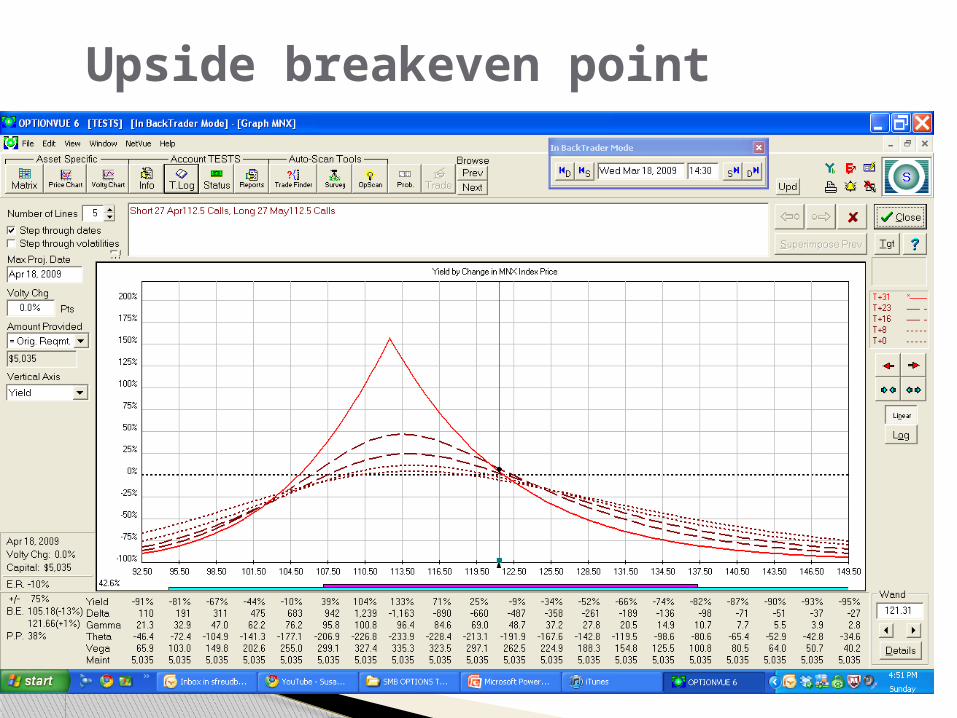
Upside breakeven point

Second calendar spread added

Creates double calendar
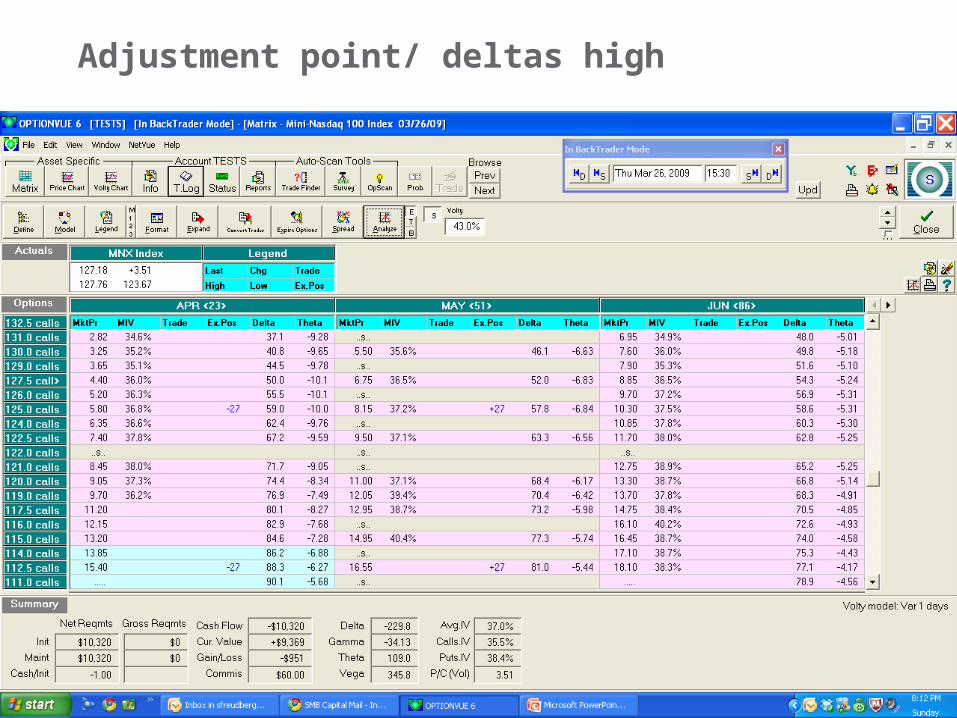
Adjustment point/ deltas high
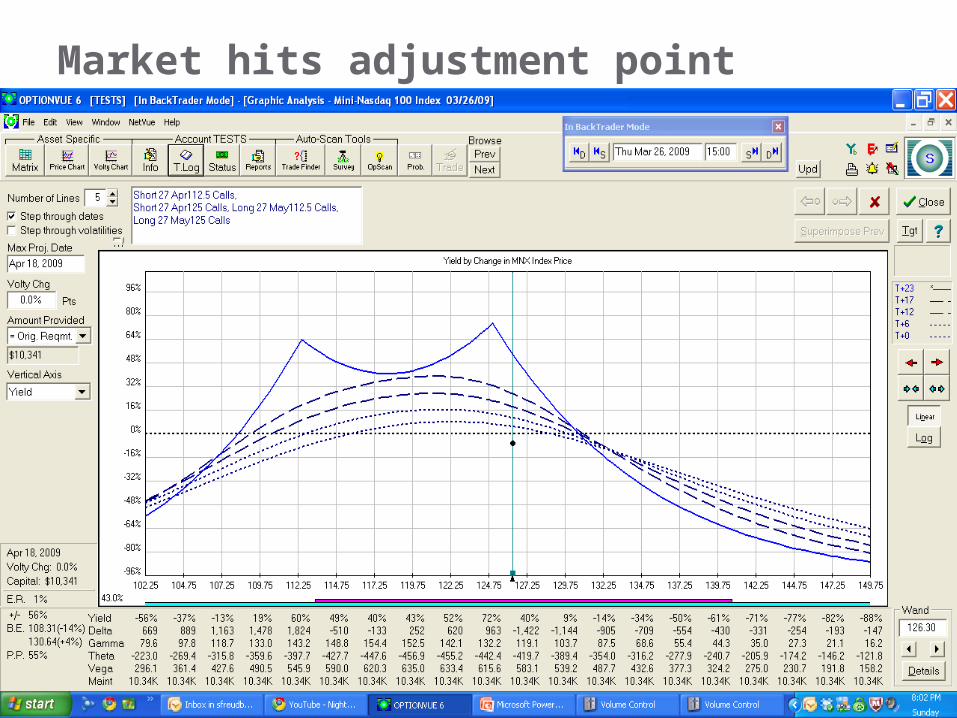
Market hits adjustment point

Rolling calendars, cutting deltas

Adjusted positions, deltas halved

Rally continues, next adjustment point hit

Deltas must be halved again

More calendars rolled, deltas halved again

“Tent” moved, deltas cut

Position closed +15%, with 16% rally in three weeks

Adjust with butterflies in lieu of calendars if concerned about further drop in volatility.
Remove original calendar instead of adding second calendar (locks in realized loss but neutralizes deltas if that is favorable).
Advanced adjustment techniques

Utilizing Optionvue’s backtrader module, select any January over the last five years and place an at the money calendar trade utilizing OIH as the vehicle, initiating and adjusting the calendar according to the adjustment techniques mentioned in this lesson. Set up a specific account for this in Optionvue and note your gains or losses for each month. Set up an X/L spreadsheet with 12 rows for each month and columns representing: initial trade risk/reward, horizontal skew (front month-back month I.V.), return in dollar and percentage terms.
Do the same utilizing $MNX. Do the same utilizing IBM except in earnings month.
Homework