calculation of the structure and absorption spectra of
TRANSCRIPT

Calculation of the structure and absorption spectra of phthalocyaninesin the gas-phase and in solution
P.N. Day, Zhiqiang Wang, R. Pachter*
Materials Directorate, Wright Laboratory, Wright–Patterson Air Force Base, OH 45433, USA
Received 10 March 1998; received in revised form 5 May 1998; accepted 5 May 1998
Abstract
Ab initio calculations have been carried out on both gas-phase and solvated phthalocyanines in order to determine equilibriumstructures, vibrational spectra, and electronic spectra. Density functional theory (DFT) optimized geometries have the expectedsymmetries ofD2h for free-base phthalocyanine,D4h for copper phthalocyanine, andC4v for tin phthalocyanine, whereas Hartree–Fock optimized geometries, which also include lead phthalocyanine, are slightly displaced from the expected symmetries. Bothsets of optimized geometries agree reasonably well with the available experimental structures. Vibrational spectra, calculatedby the Hartree–Fock method, are in partial agreement with measured spectra, whereas visible absorption spectra calculatedusing molecular geometries obtained at three different levels of theory (DFT, HF, and PM3) showed good agreement with themeasured vapor-phase spectra in the Q-band, and using the DFT optimized geometry resulted in very good agreement withmeasurements in the B-band. The self-consistent reaction field method for including bulk solvent effects in HF calculations hada small, nearly negligible, effect on the molecular structure of SnPc, whereas the DFT/COSMO solvation model yielded thepredictable result of increasing the Sn–N bond length by pulling the Sn atom further out of the molecular plane.q 1998Elsevier Science B.V. All rights reserved.
Keywords:Phthalocyanines; Visible spectra; Vibrational spectra; Solvation effects
1. Introduction
The excited-state absorption properties of metallo-phthalocyanines [1] make them of interest for opticallimiting applications [2–4]. In order to enhanceoptical limiting properties and tune the absorptionspectra, a series of calculations on these derivativeswas carried out. However, reasonably ‘‘good’’geometries for spectra predictions have to be firstobtained [5]. Ab initio Hartree–Fock calculations
have been carried out on four phthalocyanine com-pounds: the metal-free phthalocyanine (H2Pc), copperphthalocyanine (CuPc), tin phthalocyanine (SnPc), andlead phthalocyanine (PbPc). Density functional theory(DFT) calculations have been carried out on H2Pc,CuPc and SnPc. Note that experimental structures areavailable for these molecules from X-ray diffraction orneutron diffraction studies. X-ray crystal structuresare available for CuPc [6], SnPc [7], and for twostructures of PbPc, from both the monoclinic crystal[8] and the triclinic crystal [9]. A geometry for H2Pc isavailable from a neutron diffraction study [10].
Journal of Molecular Structure (Theochem) 455 (1998) 33–50
0166-1280/98/$ - see front matterq 1998 Elsevier Science B.V. All rights reserved.PII: S0166-1280(98)00238-3
* Corresponding author.

Ab initio calculations on copper phthalocyaninehave been previously carried out by Szczepaniakand Bragiel [11]. However, a relatively small basisset (3-21G) was used and no geometry optimizationwas carried out. Instead, the geometry from the X-raydiffraction crystal structure study [6] was employed(modified to an idealizedD4h symmetry). In thisstudy, we report geometry optimizations at both theHartree–Fock and DFT levels of theory to estimateequilibrium geometries of the isolated H2Pc, CuPc,SnPc, and PbPc molecules and to evaluate theappropriate approach to be used for organometallicsystems of interest to us. The geometries obtainedby both theoretical methods agree well with experi-ment. The DFT method was more successful atobtaining the expected gas-phase symmetry. Thestructures obtained for the free-base phthalocyaninewere used to evaluate the vibrational spectra viacalculation and diagonalization of the Hessian matrix,and a fair agreement is indicated with the availableexperimental values.
Both calculated and experimental geometries wereused to calculate electronic absorption spectra usingconfiguration interaction (CI) within a semiempiricalformalism, INDO/s. The electronic absorption spectrafor phthalocyanines show a strong peak in the blue(300–400 nm) region, referred to as the B-band, andan even stronger Q-band in the red to near-infrared(600–700 nm). This differs from the spectra ofporphyrins, where the Q-band tends to be muchweaker than the B-band. The spectra for free-basephthalocyanine were calculated using three com-putationally optimized geometries (HF, DFT, andPM3) and one experimental geometry. For the free-base phthalocyanine, the Q-band is split into twostrong peaks, and the calculations from all fourgeometries correctly predicted this result, whereasonly the more symmetrical DFT structure wassuccessful in predicting the single strong peak in theB-band for the gas-phase free-base phthalocyanine.
These structures can also be used as starting pointsfor evaluating the influence of a solvent. The effects ofsolvation on these molecules have been investigatedusing continuum reaction field models. The use ofsuch a model with DFT predicted a reasonabledeviation from the gas-phase geometry for tinphthalocyanine, whereas no appreciable change inthe geometry was found with the self-consistent
reaction field (SCRF) included in the Hartree–Fockcalculation.
2. Methods
The GAMESS [12] program was used to carry outthe Hartree–Fock and semiempirical calculations.DMOL1 [13] was used for the DFT calculations.Restricted-spin Hartree–Fock (RHF) calculationswere carried out on the metal-free, tin, and leadphthalocyanine molecules, whereas for copperphthalocyanine, restricted-spin open-shell Hartree–Fock (ROHF) calculations were performed. Semi-empirical calculations with the PM3 Hamiltonianwere also carried out for the metal-free and leadphthalocyanine molecules, as well as for their dimers.The STO3G [14,15], 3-21G [16], 6-31G(d) [17–20],and 6-31G(d,p) basis sets were used in the Hartree–Fock calculations of metal-free phthalocyanine, andthe copper phthalocyanine calculations were carriedout using the basis of Stevens, Basch, and Krauss(SBK) [21–23], which replaces the core electronswith an effective core potential (ECP) and is double-zeta for the valence electrons. The SBK(d) basis wasalso used in the Hartree–Fock calculations ofCuPc and SnPc. The lead phthalocyanine calculationswere carried out with the 6-31G(d,p) basis for all theatoms except lead, for which the SBK basis was used.All the DFT calculations were carried out with theDZP basis using the local density approximation(LDA).
The effects of solvation on SnPc were investigatedthrough the use of continuum dielectric models. TheSCRF [24–31] method available in the GAMESSprogram places the molecule in a spherical cavitysurrounded by a continuum solvent of a givendielectric constant. The solute molecule induces adipole in the solvent, which then interacts withthe solute molecule. The reaction field method isalso used to include solvation effects in the DFTcalculations through the use of the COSMO [32,33]program in DMOL. As in the GAMESS/SCRFprogram, COSMO places the solute molecule in acavity surrounded by a dielectric continuum, butinstead of using a spherical cavity, the van der
1 DMol is distributed by MSI/Biosym, Inc.
34 P.N. Day et al./Journal of Molecular Structure (Theochem) 455 (1998) 33–50

Waals radii of solute atoms are used to generate acavity having the same shape as the solute molecule.A second term is included in the free energy ofsolvation by COSMO in order to take into accountnon-electrostatic contributions due to dispersion andcavity formation effects; it is a linear function ofsolvent surface area and has been fit to data fromlinear-chain alkanes. In order to calculate the energiesof excited states as well as transition dipole momentsbetween states, to be used to compute oscillatorstrengths, the ZINDO [34] program was used, apply-ing the INDO/S semiempirical Hamiltonian and CIwith singly excited configurations.
3. Results and discussion
3.1. Structure and energetics
For the metal-free phthalocyanine, a stationarypoint with D2h symmetry was found in the Hartree–Fock calculations with both the STO-3G and 3-21Gbasis sets, proving to be a saddle point having oneimaginary frequency with a value of 2079i cm−1
using the STO-3G basis and 1290i cm−1 using the3-21G basis. The structure of this saddle point andthe components of the mode corresponding to theimaginary frequency are illustrated in Fig. 1. With
Fig. 1. TheD2h saddle point geometry for the metal-free phthalocyanine molecule. The components of the normal mode corresponding to thesingle imaginary frequency are indicated (the mode has no components out of the plane of the molecule).
35P.N. Day et al./Journal of Molecular Structure (Theochem) 455 (1998) 33–50

the use of the IRC method in GAMESS, a trueminimum was found withC2v symmetry (note thattwo equivalent mirror image minima were found byproceeding downhill in both directions from thesaddle-point). The symmetry axis for this geometryis in the plane of the molecule along the two N–Hbonds, rather than perpendicular to the plane of themolecule as for theD2h geometry. This minimum wasfound at the Hartree–Fock level with four differentbasis sets: STO-3G, 321G, 6-31G(d), and 6-31G(d,p).The energy barrier from the Hartree–Fock minimumto the D2h saddle point is 12.8 kcal mol−1 usingthe STO-3G basis, but only 3.7 kcal mol−1 using
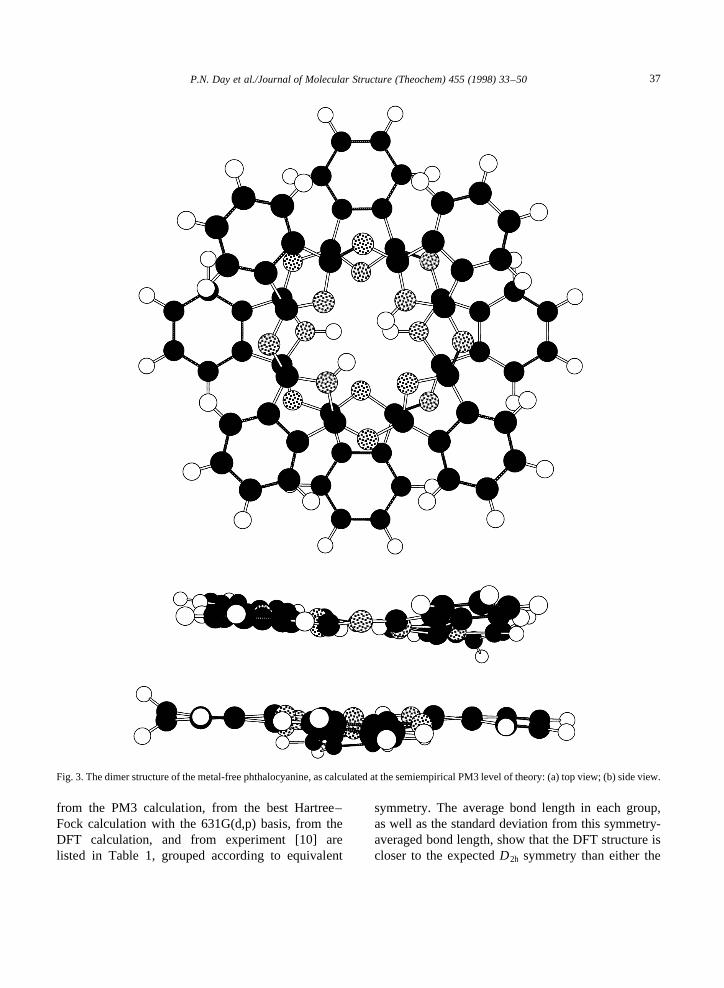
the 3-21G basis. The latter number is reduced to1.4 kcal mol−1 when zero-point vibrational effectswere included. The 6-31G(d,p) structure is shownfrom two different perspectives in Fig. 2. Semiempi-rical calculations utilizing the PM3 Hamiltonian werecarried out on the free-base phthalocyanine, since atthis level of theory it was feasible to calculate theequilibrium geometry of the dimer, (H2Pc)2, whichhas the structure shown from two perspectives inFig. 3. The calculated intermolecular interactionenergy is 30.3 kcal mol−1.
The free-base phthalocyanine geometry was alsooptimized by DFT using the LDA. The bond lengths
Fig. 2. The structure of theC2v minimum found for metal-free phthalocyanine. The side view illustrates that the structure is planar.
36 P.N. Day et al./Journal of Molecular Structure (Theochem) 455 (1998) 33–50
from the PM3 calculation, from the best Hartree–Fock calculation with the 631G(d,p) basis, from theDFT calculation, and from experiment [10] arelisted in Table 1, grouped according to equivalent
symmetry. The average bond length in each group,as well as the standard deviation from this symmetry-averaged bond length, show that the DFT structure iscloser to the expectedD2h symmetry than either the
Fig. 3. The dimer structure of the metal-free phthalocyanine, as calculated at the semiempirical PM3 level of theory: (a) top view; (b) side view.
37P.N. Day et al./Journal of Molecular Structure (Theochem) 455 (1998) 33–50

Table 1Calculated bond lengths for the free-base phthalocyanine, grouped by equivalent bonds inD2h symmetry; atom numbers are as given in Fig. 1
Bond PM3 (A) 6-31G(d,p) (A) LDA (A ) Experiment (A)
N9–H23 0.996 0.991 1.035 0.930N10–H24 1.002 0.994 1.035 0.950
N9–C1 1.397 1.354 1.367 1.380N9–C2 1.397 1.354 1.367 1.360N10–C3 1.428 1.368 1.368 1.380N10–C4 1.428 1.368 1.368 1.360
N41–C33 1.453 1.400 1.362 1.380N41–C35 1.333 1.294 1.365 1.370N42–C34 1.453 1.400 1.362 1.380N42–C36 1.333 1.294 1.365 1.370
C1–C5 1.431 1.403 1.436 1.470C2–C6 1.431 1.404 1.436 1.460C3–C7 1.478 1.475 1.437 1.470C4–C8 1.478 1.475 1.437 1.460
C33–C37 1.476 1.474 1.447 1.490C35–C39 1.475 1.472 1.451 1.460C34–C38 1.476 1.474 1.447 1.490C36–C40 1.475 1.472 1.451 1.460
C5–C6 1.427 1.414 1.402 1.400C7–C8 1.419 1.385 1.404 1.400
C37–C39 1.422 1.384 1.395 1.410C38–C40 1.422 1.384 1.395 1.410
C5–C11 1.408 1.418 1.385 1.390C6–C12 1.408 1.418 1.385 1.390C7–C13 1.380 1.380 1.386 1.390C8–C14 1.380 1.380 1.386 1.390
C37–C43 1.381 1.382 1.383 1.370C39–C45 1.381 1.383 1.383 1.400C38–C44 1.381 1.382 1.383 1.370C40–C46 1.381 1.383 1.383 1.400
C11–C15 1.374 1.356 1.384 1.390C12–C16 1.374 1.356 1.384 1.380C13–C17 1.400 1.386 1.384 1.390C14–C18 1.400 1.386 1.384 1.380
C43–C47 1.400 1.386 1.389 1.410C45–C49 1.400 1.385 1.389 1.380C44–C48 1.400 1.386 1.389 1.410C46–C50 1.400 1.385 1.389 1.380
C15–C16 1.416 1.431 1.400 1.420C17–C18 1.388 1.393 1.400 1.420
38 P.N. Day et al./Journal of Molecular Structure (Theochem) 455 (1998) 33–50
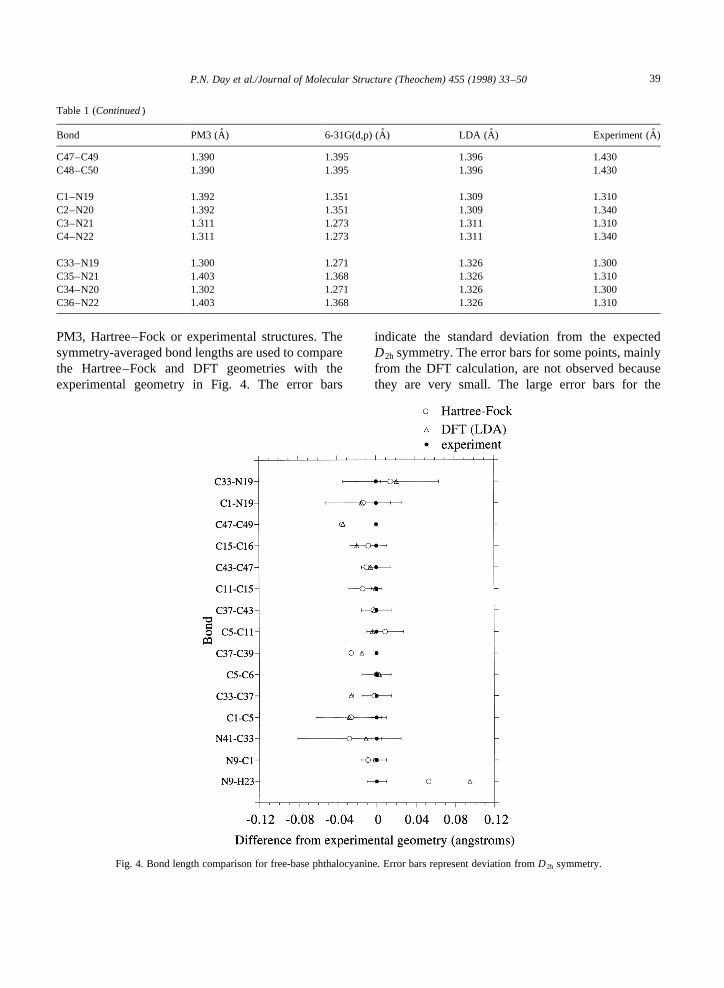
PM3, Hartree–Fock or experimental structures. Thesymmetry-averaged bond lengths are used to comparethe Hartree–Fock and DFT geometries with theexperimental geometry in Fig. 4. The error bars
indicate the standard deviation from the expectedD2h symmetry. The error bars for some points, mainlyfrom the DFT calculation, are not observed becausethey are very small. The large error bars for the
Table 1 (Continued)
Bond PM3 (A) 6-31G(d,p) (A) LDA (A ) Experiment (A)
C47–C49 1.390 1.395 1.396 1.430C48–C50 1.390 1.395 1.396 1.430
C1–N19 1.392 1.351 1.309 1.310C2–N20 1.392 1.351 1.309 1.340C3–N21 1.311 1.273 1.311 1.310C4–N22 1.311 1.273 1.311 1.340
C33–N19 1.300 1.271 1.326 1.300C35–N21 1.403 1.368 1.326 1.310C34–N20 1.302 1.271 1.326 1.300C36–N22 1.403 1.368 1.326 1.310
Fig. 4. Bond length comparison for free-base phthalocyanine. Error bars represent deviation fromD2h symmetry.
39P.N. Day et al./Journal of Molecular Structure (Theochem) 455 (1998) 33–50
Hartree–Fock results, indicating a large deviationfrom the expected symmetry, are attributed to theneglect of electron correlation in the single deter-minant Hartree–Fock model, which does not allowfor sufficient delocalization of the p orbitals. Thisexplanation is consistent with the results of previouscalculations on porphyrins [35], where it was foundthat including electron correlation at the MP2 levelof theory regained the expected symmetry. Thedeviation of the experimental structure from theD2h
symmetry can be attributed to neighboring moleculeeffects in the crystal lattice. The agreement betweenthe calculated and experimental bond lengths is goodfor both theoretical methods, except for the bond
length from a pyrrole nitrogen to a central hydrogen,where the calculated bond length is significantlylonger than the experimental one. However, theneutron diffraction study of this structure indicates anearly D4h structure with ‘‘four well defined half-hydrogen atoms, one associated with each of thepyrrole nitrogen atoms’’ [10]. Apparently, the rate ofH-transfer between the pyrrole nitrogen atoms is so fastthat the experimental method cannot differentiatebetween the pyrrole nitrogen atoms that are bondedto a hydrogen atom and those that are not. Since thecomputations result in bond lengths to each of two fullhydrogen atoms, they are significantly longer than thebond lengths given in Ref. [10].
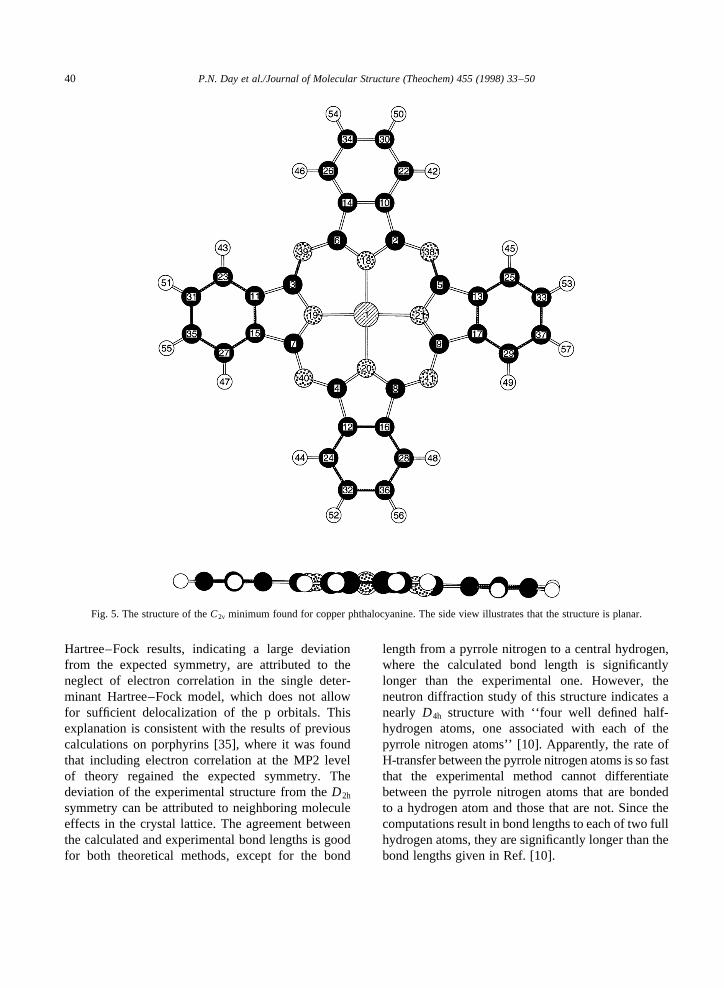
Fig. 5. The structure of theC2v minimum found for copper phthalocyanine. The side view illustrates that the structure is planar.
40 P.N. Day et al./Journal of Molecular Structure (Theochem) 455 (1998) 33–50

A planar structure withD4h symmetry was expectedfor copper phthalocyanine. In Hartree–Fock calcula-tions with the SBK basis set, a stationary point withD4h symmetry was located, and a Hessian, or energy-second-derivative, calculation was carried out in orderto characterize the stationary point and obtain thevibrational frequencies. This structure was found tohave two degenerate modes with imaginary frequenciesof 1968.58i cm−1, thus being a second-order saddlepoint and not a minimum. Using the IRC followingmethods in GAMESS, a minimum was locatedwhich was 78 kcal mol−1 lower in energy. Thisminimum energy structure, shown in Fig. 5, is planarwith C2v symmetry, although its deviations fromD4h
symmetry are small. By following each of the twodegenerate modes downhill in both the positive and
negative directions, four equivalent minima werefound.
On the other hand, the DFT calculations resulted ina minimum energy structure that is very close to theexpectedD4h symmetry. As was the case with the free-base phthalocyanine calculations, this is attributed tothe inclusion of electron correlation in DFT, whereasthe neglect of electron correlation in Hartree–Focktheory may explain its failure to predict this highsymmetry equilibrium geometry. Fig. 6 shows thedifference in the symmetry-averaged bond lengthsfrom the experimental bond lengths [6]. As in Fig. 4,the error bars indicate the standard deviation from theexpected symmetry. The Hartree–Fock equilibriumstructure, with onlyC2v symmetry, has the highestdeviation from the expectedD4h symmetry. The
Fig. 6. Bond length comparison for copper phthalocyanine. Error bars represent deviation fromD4h symmetry.
41P.N. Day et al./Journal of Molecular Structure (Theochem) 455 (1998) 33–50
symmetry-averaged bond lengths from both calculationsagree fairly well with experiment, with the exceptionof the Cu–N bond in the Hartree–Fock calculation,which is 0.09 Alonger than that found in the experi-mental structure. The DFT calculation, on the otherhand, agrees closely with the experimental value forthis bond length. The DFT bond lengths, with anaverage difference from experiment of 0.007 A˚ , arein general closer to the X-ray crystal structure thanthose from the Hartree–Fock calculations, which havean average difference of 0.027 A˚ . Even if the Cu–Nbond is excluded from the average, the DFT results
are still in better agreement with experiment, with anaverage difference of 0.008 A˚ versus 0.017 A˚ for theHartree–Fock results.
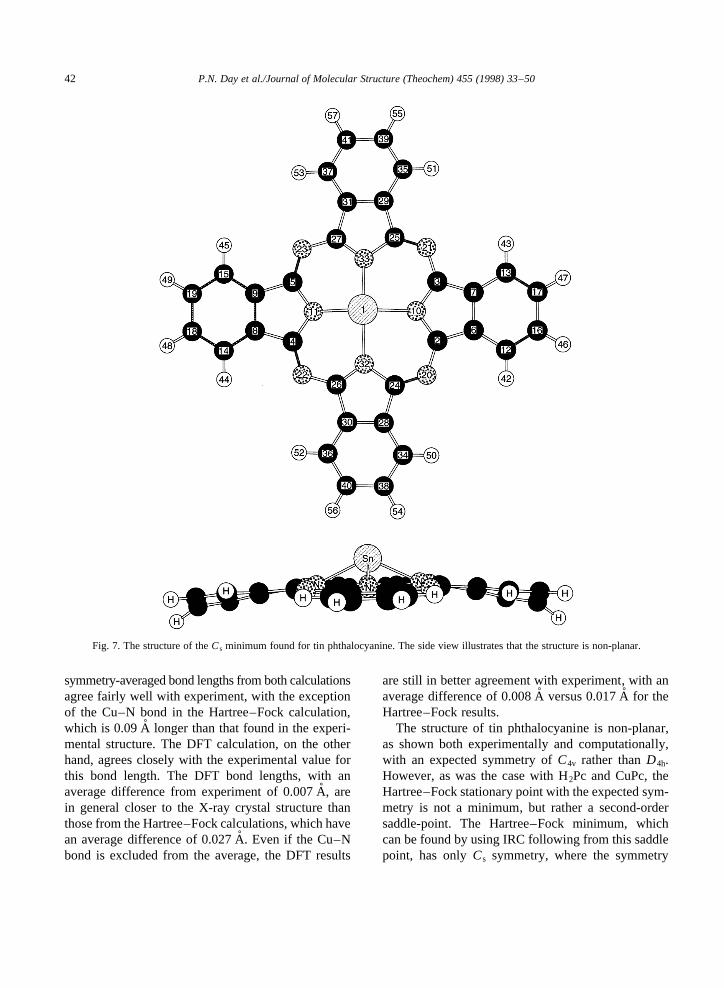
The structure of tin phthalocyanine is non-planar,as shown both experimentally and computationally,with an expected symmetry ofC4v rather thanD4h.However, as was the case with H2Pc and CuPc, theHartree–Fock stationary point with the expected sym-metry is not a minimum, but rather a second-ordersaddle-point. The Hartree–Fock minimum, whichcan be found by using IRC following from this saddlepoint, has onlyCs symmetry, where the symmetry
Fig. 7. The structure of theCs minimum found for tin phthalocyanine. The side view illustrates that the structure is non-planar.
42 P.N. Day et al./Journal of Molecular Structure (Theochem) 455 (1998) 33–50
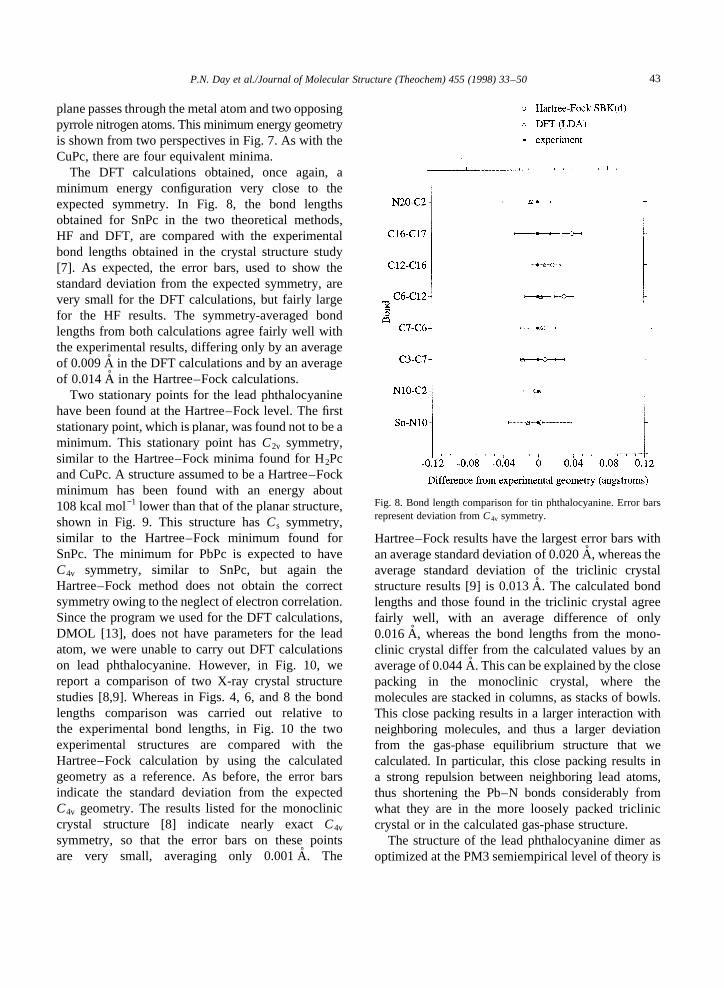
plane passes through the metal atom and two opposingpyrrole nitrogen atoms. This minimum energy geometryis shown from two perspectives in Fig. 7. As with theCuPc, there are four equivalent minima.
The DFT calculations obtained, once again, aminimum energy configuration very close to theexpected symmetry. In Fig. 8, the bond lengthsobtained for SnPc in the two theoretical methods,HF and DFT, are compared with the experimentalbond lengths obtained in the crystal structure study[7]. As expected, the error bars, used to show thestandard deviation from the expected symmetry, arevery small for the DFT calculations, but fairly largefor the HF results. The symmetry-averaged bondlengths from both calculations agree fairly well withthe experimental results, differing only by an averageof 0.009 Ain the DFT calculations and by an averageof 0.014 Ain the Hartree–Fock calculations.
Two stationary points for the lead phthalocyaninehave been found at the Hartree–Fock level. The firststationary point, which is planar, was found not to be aminimum. This stationary point hasC2v symmetry,similar to the Hartree–Fock minima found for H2Pcand CuPc. A structure assumed to be a Hartree–Fockminimum has been found with an energy about108 kcal mol−1 lower than that of the planar structure,shown in Fig. 9. This structure hasCs symmetry,similar to the Hartree–Fock minimum found forSnPc. The minimum for PbPc is expected to haveC4v symmetry, similar to SnPc, but again theHartree–Fock method does not obtain the correctsymmetry owing to the neglect of electron correlation.Since the program we used for the DFT calculations,DMOL [13], does not have parameters for the leadatom, we were unable to carry out DFT calculationson lead phthalocyanine. However, in Fig. 10, wereport a comparison of two X-ray crystal structurestudies [8,9]. Whereas in Figs. 4, 6, and 8 the bondlengths comparison was carried out relative tothe experimental bond lengths, in Fig. 10 the twoexperimental structures are compared with theHartree–Fock calculation by using the calculatedgeometry as a reference. As before, the error barsindicate the standard deviation from the expectedC4v geometry. The results listed for the monocliniccrystal structure [8] indicate nearly exactC4v
symmetry, so that the error bars on these pointsare very small, averaging only 0.001 A˚ . The
Hartree–Fock results have the largest error bars withan average standard deviation of 0.020 A˚ , whereas theaverage standard deviation of the triclinic crystalstructure results [9] is 0.013 A˚ . The calculated bondlengths and those found in the triclinic crystal agreefairly well, with an average difference of only0.016 A, whereas the bond lengths from the mono-clinic crystal differ from the calculated values by anaverage of 0.044 A˚ . This can be explained by the closepacking in the monoclinic crystal, where themolecules are stacked in columns, as stacks of bowls.This close packing results in a larger interaction withneighboring molecules, and thus a larger deviationfrom the gas-phase equilibrium structure that wecalculated. In particular, this close packing results ina strong repulsion between neighboring lead atoms,thus shortening the Pb–N bonds considerably fromwhat they are in the more loosely packed tricliniccrystal or in the calculated gas-phase structure.
The structure of the lead phthalocyanine dimer asoptimized at the PM3 semiempirical level of theory is
Fig. 8. Bond length comparison for tin phthalocyanine. Error barsrepresent deviation fromC4v symmetry.
43P.N. Day et al./Journal of Molecular Structure (Theochem) 455 (1998) 33–50

shown in Fig. 11 from two perspectives. The leadatoms are positioned as far from each other aspossible, and the porphyrin rings are offset fromeach other by 458. The calculated interaction energyat this level of theory is 36 kcal mol−1.
The effects of solvation on the calculated structureof SnPc are summarized in Fig. 12, which shows the
change in the symmetry-averaged bond lengths due tothe SCRF in the Hartree–Fock calculation and due tothe COSMO model in the DFT calculation. For theSCRF calculation in GAMESS, a cavity radius of6.03 A was used in order to simulate a cavity withapproximately the same volume as the solutemolecule, and a dielectric constant of 80 was used
Fig. 9. The structure of theCs minimum found for lead phthalocyanine. The side view illustrates that the structure is non-planar.
44 P.N. Day et al./Journal of Molecular Structure (Theochem) 455 (1998) 33–50

to simulate water. Although water may not be theprimary solvent of interest for our studies of phthalo-cyanines, this dielectric constant was used to mimicthe largest possible effect. In the SCRF calculation,the changes in the symmetry-averaged bond lengths,none of which have a magnitude of over 0.002 A˚ , aretoo small to be significant. Some of the individualbonds did change by a more significant amount; thelargest change is in one of the Sn–N bonds whichincreased in length by about 0.01 A˚ , while theopposite bond decreased in length by about thesame amount. The stabilization energy gained by theSCRF solvation model is about 2.5 kcal mol−1. TheDFT/COSMO program used a dielectric constant of78.54 by default to simulate water. As can be seen inFig. 12, there were significant changes in thesymmetry-averaged bond lengths for two of thesymmetry-unique bonds, particularly for the Sn–Nbond, which increased by an average of 0.029 A˚ .This effect was expected, as the tin atom’s out-of-plane position is the main source of polarity in this
molecule, and the effect of the solvent field is tofurther polarize the molecule, pulling the tin atomfarther out of the phthalocyanine plane. The totalsolvation energy calculated in the DFT/COSMOprogram was 22.3 kcal mol−1, 14.8 kcal mol−1 ofwhich was the electrostatic contribution. The muchsmaller solvation energy calculated by the Hartree–Fock/SCRF method could be because the SCRFmethod in GAMESS uses only induced dipoles, and itmay be that higher-order induced multipoles areneeded in order to calculate the correct solvationenergy.
3.2. Spectra
Vibrational spectra for the free-base phthalo-cyanine were calculated in the harmonic approxima-tion using Hartree–Fock theory. In Fig. 13, thecalculated vibrational frequencies and intensities forfree-base phthalocyanine are compared with thespectra observed by Kobayashi [36]. The frequencieswere calculated at the Hartree–Fock level using the3-21G basis set at the minimum-energy geometryobtained at this level of theory, and were scaled bythe factor 0.89, as is common for Hartree–Fockfrequencies in order to adjust for the errors introducedby the harmonic approximation and by the single-determinant HF theory. The intensities of thevibrational frequencies are calculated in the GAMESSprogram by projecting the dipole derivative tensoronto the normal mode vector, and squaring the result.The experimental intensities are approximate sincethey were derived only from a plot. For the largestsix frequencies, no intensities were available; there-fore, for comparison purposes, the intensity for eachof these frequencies was set to that of the nearestcalculated frequency. Some of the calculated fre-quencies agree relatively well with experiment,particularly for the observed frequencies above400 cm−1. However, the calculation shows additionalfrequencies above 400 cm−1 with significant intensitiesthat are not part of the observed spectrum. Also, theobserved spectrum has strong peaks at 269 cm−1,282 cm−1, and 342 cm−1 that do not show in thecalculated vibrational frequencies.
Electronic spectra in the visible band were calculatedfor the free-base phthalocyanine using the ZINDOprogram, which carries out configuration interaction
Fig. 10. Bond length comparison for lead phthalocyanine. Error barsrepresent deviation fromC4v symmetry.
45P.N. Day et al./Journal of Molecular Structure (Theochem) 455 (1998) 33–50

with the INDO semiempirical Hamiltonian. Thiscalculation was carried out for each of four geometriesfor free-base phthalocyanine: the ab initio Hartree–Fock geometry of Fig. 2, the DFT geometry obtainedusing LDA, the experimental geometry of Ref. [10],and one obtained in a semiempirical PM3 optimization.The calculated spectra obtained for the transitionsfrom the ground state to the first 19 excited statesare listed in Table 2, where they are compared withmeasured spectra [37,38] in the gas-phase and in1-chloronaphthalene solution. The calculatedoscillator strength for each transition, which is listedin parentheses next to the corresponding wavelength,was obtained from
fna=8p2mennalmnal
2
3he2 (1)
whereme and e are the electronic mass and chargerespectively, h is Planck’s constant,nna is thefrequency of the a→ n transition andmna is the
corresponding transition dipole moment:
m = 〈WnlerlWa〉 (2)
The oscillator strengths for the measured spectra werecalculated from
fna=4mec«0 ln 10
NAe2 Ana
wherec is the speed of light in a vacuum,«0 is thepermittivity of free space,NA is Avogadro’s number,andAna is the area under the spectral line
Ana=�
«na dn (4)
and «na is the molar extinction coefficient. Thisarea was evaluated for each transition by measuringthe width of each peak in Fig. 4 of Ref. [38],transforming the«na from Ref. [37] to a function offrequency instead of wavelength, and carrying out theintegration assuming a Gaussian functional form. The
Table 2The electronic spectra of free-base phthalocyanine, calculated using the ZINDO program at four different geometries, three of which arecomputationally optimized geometries with the fourth being the experimental geometry [10]. Two sets of measured spectra are also listed, onemeasured in the vapor phase and the other in the solvent 1-chloronaphthalene (CN). Oscillator strengths are given in parentheses.
ZINDO//LDAgeometry
ZINDO//HF/6-31G**geometry
ZINDO//PM3geometry
ZINDO//experimentalgeometry
Measured in CN Measuredvapor
727 (0.82) 601 (0.71) 637 (0.75) 756 (0.78) 700 (0.22) 686665 (0.51)
684 (0.89) 586 (0.69) 618 (0.67) 707 (0.77) 638 (0.18) 622602 (0.13)554 (0.02)
413 (0.00) 375 (0.12) 393 (0.12) 424 (0.02)398 (0.00) 359 (0.08) 377 (0.09) 415 (0.00)360 (0.05) 324 (0.09) 337 (0.12) 391 (0.39)351 (0.61) 316 (0.14) 332 (0.25) 368 (0.09) 340340 (0.00) 314 (0.00) 326 (0.04) 355 (0.29)336 (0.14) 312 (0.07) 318 (0.02) 350 (0.51)331 (0.00) 310 (0.01) 314 (0.00) 339 (0.02)314 (1.05) 308 (0.16) 304 (1.28) 329 (0.01)301 (0.00) 305 (0.02) 299 (0.70) 319 (0.51)293 (1.66) 292 (1.34) 286 (0.01) 314 (0.09)291 (0.00) 291 (0.54) 284 (0.13) 306 (0.44)288 (1.11) 276 (0.12) 280 (0.00) 303 (0.63)285 (1.63) 276 (0.00) 278 (0.12) 302 (0.22)280 (0.00) 269 (0.76) 273 (1.47) 300 (0.48)279 (0.00) 269 (0.00) 273 (0.05) 292 (0.45)277 (0.01) 262 (0.07) 266 (0.04) 290 (0.87)276 (0.00) 259 (0.00) 265 (0.06) 288 (0.63)
46 P.N. Day et al./Journal of Molecular Structure (Theochem) 455 (1998) 33–50

intensities of the measured spectra are available onlyfrom the measurements made in solution.
The Q-band is split into two peaks in free-basephthalocyanine since it has only twofold symmetryrather than the fourfold symmetry of the metalphthalocyanines. This feature is seen in all four setsof calculated spectra as well as in the two sets ofmeasured spectra, although in the solvated systemthe Q-band has been split into four or five peaks.
Since the calculated spectra are for an isolatedmolecule, the vapor-phase measurements are mostapplicable for a direct comparison. The calculatedspectra show that this method is very sensitive tothe geometry used. Although all the spectra werecalculated at the same level of theory, the fourdifferent geometries caused variations in bothdirections from the experimental spectra, with anoverall average error of 8%. The spectra calculated
Fig. 11. The dimer structure of lead phthalocyanine, as calculated at the semiempirical PM3 level of theory: (a) top view; (b) side view.
47P.N. Day et al./Journal of Molecular Structure (Theochem) 455 (1998) 33–50

using the LDA and experimental geometries havelonger wavelengths than the measured spectra,whereas those calculated using the HF and PM3geometries have shorter wavelengths for the Q-bandtransitions. From the LDA geometry, the wavelengthsof the first and second peaks are 6% and 10% longerthan measured, whereas those calculated from theexperimental geometry are 10% and 14% longerthan the measured wavelengths. From the Hartree–Fock geometry, the wavelengths of the first andsecond peaks are 12% and 6% shorter than themeasured values, whereas from the PM3 geometrythey are just 7% and 1% too short.
Although the calculations all consistently had twoQ-band peaks with oscillator strengths in the 0.7–0.9range, identification of the B-band transition, whichhas been measured in the vapor-phase at 340 nm, ismore ambiguous. The calculation from the LDAgeometry is the least deceptive, having a strongpeak at 351 nm (f = 0.61), and no other peaks nearlythis strong up to 314 nm, which is into the ultravioletspectrum. The wavelength of 351 nm is only 3%longer than the measured spectral wavelength. The
calculation at the Hartree–Fock geometry did notgive a strong, distinct line for the B-band, butinstead gave several weak lines. The lines at 375 nm( f = 0.12), 359 nm (f = 0.08), and 324 nm (f = 0.09)are the best candidates for this spectral line, whereasthe slightly stronger line at 316 nm (f = 0.14) isconsidered to be in the ultraviolet. This splitting ofthe B-band is attributed to the lower symmetry of theHartree–Fock geometry. The calculations fromthe PM3 and experimental geometries also showsome splitting of this band, but the line at 332 nm( f =0:35) from the PM3 geometry and the line at350 nm (f = 0.51) from the experimental geometryare clearly the strongest lines in the B-band range.These lines agree with the experimental wavelengthvalue to within 3%.
The calculated spectra for the two Q-band linesindicate oscillator strengths in the range 0.7–0.9.None of the individual oscillator strengths calculatedfrom the measured spectra in 1-chloronaphthalene arethis high, although if we assume that the Qx line hasbeen split into the two lines at 700 nm and 665 nm, thecombined oscillator strength for this transition is 0.73.
Fig. 12. The effect of solvation on the bond lengths in SnPc.
48 P.N. Day et al./Journal of Molecular Structure (Theochem) 455 (1998) 33–50

The experimental oscillator strengths do sum toapproximately one, as expected. The sum of thetheoretical oscillator strengths will be considerablyhigher than one, particularly if the transitions in theultraviolet are included. Note, however, that oscillatorstrengths calculated by the ZINDO program aregenerally too large since the CI includes only singlyexcited configurations.
4. Conclusions
Geometry optimizations of the phthalocyaninesH2Pc, CuPc, SnPc, and PbPc have been carried outusing ab initio calculations. DFT calculations weresuccessful in obtaining the expected symmetries ofD2h for H2Pc,D4h for CuPc, andC4v for SnPc for theequilibrium geometries, whereas the Hartree–Fock
calculations yielded geometries slightly displacedfrom these symmetries, in having onlyC2v symmetryfor H2Pc and CuPc, andCs symmetry for SnPc andPbPc. The lower symmetry obtained in the Hartree–Fock calculations can be explained by the insufficientinclusion of electron correlation in the singledeterminant Hartree–Fock method. The calculatedgeometries are compared with experimental crystalstructures, which deviate from the expected symme-tries due to neighboring molecule effects in the crys-tal. In general, the agreement between the calculatedand observed geometries is good, with the DFT resultsgenerally exhibiting a better agreement with experi-ment. The SCRF method for including solvent effectsin the HF calculation had a small, nearly negligible,effect on the molecular structure of SnPc, whereas theDFT/COSMO model yielded the expected result ofincreasing the Sn–N bond length by pulling the Snatom farther out of the molecular plane. The vibra-tional spectra calculated by the Hartree–Fock methodare in only partial agreement with the experimentalspectra. The electronic spectra calculated using theZINDO program agree best with the measuredvapor-phase spectra when the higher-symmetryLDA geometry is used. When the lower symmetrygeometries are used, the characteristically strongB-band spectral line is split into several weakerlines.
References
[1] J.W. Perry, K. Mansour, I.-Y.S. Lee, X.-L. Wu, P.V.Bedworth, C.-T. Chen, D. Ng, S.R. Marder, P. Miles, T.Wada, M. Tian, H. Sasabe, Science 273 (1996) 1533.
[2] J.S. Shirk, R.G.S. Pong, F.J. Bartoli, A.W. Snow, Appl. Phys.Lett. 63 (1993) 18.
[3] J.W. Perry, K. Mansour, S.R. Marder, K.J. Perry, D. AlvarezJr., I. Choong, Optics Lett. 19 (1994) 625.
[4] J.S. Shirk, R.G.S. Pong, S.R. Flom, M.E. Boyle, A.W. Snow,in: Materials for Optical Limiting, Materials Research SocietySymposium Proceedings, vol. 374, 1995, p. 201.
[5] M.G. Cory, H. Hirose, M.C. Zerner, Inorg. Chem. 34 (1995)2969.
[6] C.J. Brown, J. Chem. Soc. A: (1968) 2488.[7] R. Kubiak, J. Janczak, J. Alloys Compd. 189 (1992) 107.[8] K. Ukei, Acta Crystallogr. Sect. B: 29 (1973) 2290.[9] Y. Iyechika, K. Yakushi, I. Ikemoto, H. Kuroda, Acta
Crystallogr. Sect. B: 38 (1982) 766.[10] B.F. Hoskins, S.A. Mason, Chem. Commun. (1969) 554.[11] B. Szczepaniak, P. Bragiel, Vacuum 46 (1995) 465.
Fig. 13. The vibrational spectrum for free-base phthalocyanine. TheHartree–Fock spectra were obtained by using the harmonic approx-imation and scaling them by 0.89. The experimental spectrum istaken from Ref. [36].
49P.N. Day et al./Journal of Molecular Structure (Theochem) 455 (1998) 33–50

[12] M.W. Schmidt, K.K. Baldridge, J.A. Boatz, S.T. Elbert, M.S.Gordon, J.J. Jensen, S. Koseki, N. Matsunaga, K.A. Nguyen,S. Su, T.L. Windus, M. Dupuis, J.A. Montgomery, J. Comput.Chem. 14 (1993) 1347.
[13] B. Delley, J. Chem. Phys. 92 (1990) 508.[14] W.J. Hehre, R.F. Stewart, J.A. Pople, J. Chem. Phys. 51 (1969)
2657.[15] W.J. Hehre, R. Ditchfield, R.F. Stewart, J.A. Pople, J. Chem.
Phys. 52 (1970) 2769.[16] J.S. Binkley, J.A. Pople, W.J. Hehre, J. Am. Chem. Soc. 102
(1980) 939.[17] R. Ditchfield, W.J. Hehre, J.A. Pople, J. Chem. Phys. 54
(1971) 724.[18] W.J. Hehre, R. Ditchfield, J.A. Pople, J. Chem. Phys. 56
(1972) 2257.[19] M.M. Francl, W.J. Pietro, W.J. Hehre, J.S. Binkley, M.S.
Gordon, D.J. DeFrees, J.A. Pople, J. Chem. Phys. 77 (1982)3654.
[20] P.C. Hariharan, J.A. Pople, Theoret. Chim. Acta 28 (1973)213.
[21] W.J. Stevens, H. Basch, M. Krauss, J. Chem. Phys. 81 (1984)6026.
[22] W.J. Stevens, H. Basch, M. Krauss, P. Jasien, Can. J. Chem. 70(1992) 612.
[23] T.R. Cundari, W.J. Stevens, J. Chem. Phys. 98 (1993) 5555.[24] J.G. Kirkwood, J. Chem. Phys. 2 (1934) 351.[25] L. Onsager, J. Am. Chem. Soc. 58 (1936) 1486.[26] O. Tapia, O. Goscinski, Mol. Phys. 29 (1975) 1653.[27] M.M. Karelson, A.R. Katritzky, M.C. Zerner, Int. J. Quantum
Chem. Symp. 20 (1986) 521.[28] K.V. Mikkelsen, H. Aagren, H.J.A. Jensen, T. Helgaker, J.
Chem. Phys. 89 (1988) 3086.[29] M.W. Wong, M.J. Frisch, K.B. Wiberg, J. Am. Chem. Soc.
113 (1991) 4776.[30] M. Szafran, M. Karelson, A.R. Katritzky, J. Koput, M.C.
Zerner, J. Comput. Chem. 14 (1993) 371.[31] M. Karelson, T. Tamm, M.C. Zerner, J. Phys. Chem. 97 (1993)
11901.[32] A. Klamt, G. Schuurmann, J. Chem. Soc. Perkin Trans. 2:
(1993) 799.[33] Biosym/MSI 3.0.0 release notes, October, 1995, pp. 23–34.[34] J.E. Ridley, M.C. Zerner, Theoret. Chim. Acta 32 (1973) 111.[35] J. Almlof, T.H. Fischer, P.G. Gassman, A. Ghosh, M. Haser, J.
Phys. Chem. 97 (1993) 10964.[36] T. Kobayashi, Spectrochim. Acta Part A: 26 (1970) 1313.[37] M. Okawara, T. Kitao, T. Hirashima, M. Matsuoka, Organic
Colorants, Kodansha Ltd., Tokyo, 1988, pp. 374–375.[38] G.H. Heilmeier, G. Warfield, J. Chem. Phys. 38 (1963) 893.
50 P.N. Day et al./Journal of Molecular Structure (Theochem) 455 (1998) 33–50