calculating the tax gap for trinidad and tobago
TRANSCRIPT

CALCULATING THE TAX GAP
FOR
TRINIDAD AND TOBAGO
Submitted to:
Ministry of Finance,
Government of Trinidad and Tobago
Submitted by:
Professor Karl Theodore
September 4, 2017

1
Calculating the Tax Gap for Trinidad and Tobago1
Executive Summary
Having set out originally to estimate two components of the tax base of the country, our study
embarked on an estimation of the Tax Gap. Knowing the extent of the revenue collection
challenge facing the government was another way of learning what was the full tax liability of
the country. We began with the assumption that the greater portion of the Tax Gap was due to
tax evasion linked to the extent of informal or “hidden” economic activity. Ruling out the more
robust microeconomic methods of estimating the extent of informal activity because of data and
time constraints, the study settled on two widely used macroeconomic methods, the Currency
Demand method and the Macro-electric method.
For different reasons, each of these methods yields estimates that are biased downward. When
the dust settled we arrived at an informal sector size in the range of 28 percent to 43 percent for
the years 2015 and 2016, respectively. This led us to Tax Gap estimates between 11 percent and
18 percent. In financial terms, the Gap was between TT$12 billion and TT$15 billion. When
disaggregated we found the Corporate Tax Gap to be between TT$5.1 billion and TT$6.6
billion and the VAT gap between TT$1.9 billion and TT$2.4 billion.
The study ended by exploring the effective rates of taxation implicit in the extent of non-
compliance measured. For corporations facing a 25 percent statutory rate the effective rate was
found to be in the range 14 percent to 18 percent. For those corporations facing the statutory
rate of 30 percent the effective tax range was found to be between 17 percent and 21 percent.
For the VAT at 15 percent the estimated effective rate was in the range 8 percent to 11 percent,
and for the more recent VAT of 12.5 percent the expected effective rate is between 7 percent to
9 percent.
1 This work was one with expert assistance from Earl Boodoo and Kai Benjamin
2
Calculating the Tax Gap for Trinidad and Tobago
1.0 Introduction
The Ministry of Finance needs to determine the extent to which the Government of Trinidad and
Tobago is collecting all the tax revenues legally due. In other words, there is a need to know the
full tax liability of the country. One way of doing this is to compute selected components of the
Tax Base, which is the aggregate value of the financial streams or assets in the country on which
tax can be imposed. Alternatively, it is possible to estimate the country’s full tax liability by
calculating the Tax Gap. This is the method used in this study.
The Tax Gap is defined as the difference between tax actually collected and what should be
collected. It is the need to know the tax that should be collected, which makes the total tax
liability important. Here, the tax liability includes all taxes that are due either under the letter, or
under the spirit of the law. Given this definition, the tax gap or revenue loss is equivalent to the
shortfall resulting from fraud, error, non-payment and tax evasion. There are several
determinants occurring in the informal sector or shadow economy that contribute to shortfalls in
tax collection. These include untaxed proceeds of frauds and other crime, capital gains tax,
offshore tax abuse and failure to take care (taxpayers’ errors or negligence).
Peters (2017)2 noted that developing countries tend to have large unofficial or shadow
economies, whereas for developed nations, the size of the unofficial economy is typically small.
Estimating the scale of, and trends in, the tax gap is inherently difficult especially with a large
shadow economy.
The present study places emphasis on the informal economy as the major determinant of tax
evasion. The literature reveals that tax evasion, depending on the country, accounts for a
significant portion of the total Tax Gap.
2 Peters, Amos. 2017. Estimating the Size of the Informal Economy in Caribbean States. Inter-American
Development Bank Technical Note No. IDB-TN-1248.

3
2.0 Importance of Informal Economy
According to Friedman, Johnson, and Kaufmann (2000)3, in developing countries such as Egypt,
Nigeria, and Thailand, the informal economy is approximately 75 percent of the size of the
officially recorded GDP (or the formal economy). In many South American countries, the size
of the unofficial economy varies from a quarter to a third of officially recorded GDP (Chen
(2008)4. Transition economies such as Georgia and Ukraine have informal sectors estimated in
the range from 28 to 43 percent of GDP (Schneider and Enste 20005). In the more developed
Organization for Economic Cooperation and Development (OECD) countries, however, the
range is from 8 to 23 percent of GDP.
Using the work of Schneider, Buehn, and Montenegro (20106), the Table 1 presents estimates of
the size of the informal economy for eight Caribbean countries from 1999 to 2007. Generally,
lower levels of income are associated with higher levels of informal activity.
Table 1: Estimates of the Share of the Unofficial Economy in the Caribbean
1999 2000 2001 2002 2003 2004 2005 2006 2007 Period
average
Bahamas 26.1 26.2 26 26 25.5 25.1 25.8 26.2 26.2 25.9
Barbados 33.8 35.3 37.7 37.9 38.3 38.4 38.4 37.8 38.0 37.3
Belize 42.4 43.8 44.3 44.2 45.2 45.5 45.4 45.9 45.6 44.7
Guyana 33.8 33.6 33.8 33.5 33.3 33.8 33 33.4 33.3 33.5
Haiti 56.0 55.4 54.7 54.3 54.4 54.4 53.7 53.8 53.7 54.4
Jamaica 36.4 36.4 36.6 36.6 38.6 39.1 38.9 40.2 40.5 38.1
Suriname 39.9 39.8 40.3 40.8 41.5 42.9 43.3 43.9 44.7 41.9
Trinidad and Tobago 34.1 34.4 34.5 34.4 34.4 35.7 35.9 36.8 37.3 35.5
Country Average 37.8 38.1 38.5 38.5 38.9 39.4 39.3 39.8 40.0 38.9
Source: Schneider, Buehn, and Montenegro (2010); *Kamau & Lin (2015), Greenidge, Holder, and Mayers (2009)
(as cited in Peters, 2017).
Based on the data in Table 1, during the nine-year period the size of the informal sector in
Trinidad and Tobago oscillated within a very narrow band, between 34.1 percent and 37.3
3 Friedman, E., S., Johnson, D. Kaufmann, and P. Zoido-Lobatón. 2000. “Dodging the Grabbing Hand: The
Determinants of Unofficial Activity in 69 Countries.” Journal of Public Economics 76: 459–493. 4 Chen, Marty. 2008. The Informal Economy in Lain America: A Global Perspective. Presentation on May 22,
2008. Harvard University, WIEGO Network. 5 Schneider, F. and D. Enste. 2000. “Shadow Economies: Size, Causes, and Consequences,” Journal of Economic
Literature XXXVIII: 77–114. 6 Schneider, F., A. Buehn, and C. Montenegro. 2010. “New Estimates for the Shadow Economies all over the
World.” Background paper for: Packard, T., J. Koettl, and C. Montenegro. “In from the Shadow: Integrating
Europe’s Informal Labor.” World Bank Report. Washington DC: World Bank.

4
percent of GDP. Haiti, with the lowest per capita income in the Caribbean region, exhibits the
highest level of informal activity. The Bahamas, on the other hand, which has a very high level
of income shows a relatively lower level of informal activity. Income, however, is not the only
determining factor. Suriname, for example, has a higher level of informal activity vis-à-vis
Guyana and Jamaica, even though it has a higher per capita income. For Jamaica and Trinidad
and Tobago, what stands out is the slightly positive trend, which is consistent with the global
findings of Schneider, Buehn, and Montenegro (2010).
3.0 Methodologies used in Estimating Hidden Economy
This study embraces different dimensions of informality, but primarily uses one grounded in the
view that the informal sector is hidden from the view of authorities and manifests in the form of
cash transactions. This points us to a currency demand approach to estimating the informal
sector. Alternatively, since economic activity will usually require electricity, we may use
electricity consumption as another pointer to the size of the informal sector. This is called the
macro electric approach. These approaches are consistent with the notion that the “unofficial or
shadow economy” constitutes activity that is not reported to the recognised statistical agencies
in the country (Johnson, Kaufmann, and Shleifer, 19977). This definition also echoes that of
Smith (1994:48), who defines the informal economy as: “market-based production of goods and
services, whether legal or illegal, that escapes detection in the official estimates of the GDP”. In
fact, there are a number of researchers who also use a similar definition. These include Feige;
19899, 1994
10; Frey and Pommerehne 1984
11; Lubell 1991
12 and Schneider, 1994
13.
Schneider and Enste (2000) provided a detailed review of the methods used to measure the size
and growth of the shadow economy. Two broad approaches are the direct approach and the
indirect approach. One direct approach to estimating the informal sector is a microeconomic
7 Johnson, S., D. Kaufmann, and A. Shleifer. 1997. “The Unofficial Economy in Transition.” Brookings Papers
Econ. Act 0(2): 159–221. 8 Smith, Philip. 1994. Assessing the Size of the Underground Economy: the Statistics Canada Perspective.
Statistics Canada – Catalogue No. 13-604 No. 28. 9 Feige, E. 1989. (ed.) The Underground Economies. Tax Evasion and Information Distortion. Cambridge:
Cambridge University Press. 10
Feige, E.1994. “The Underground Economy and the Currency Enigm.” Supplement to Public Finance/Finances
Publiques 49: 119–36. 11
Frey, B. and W. Pommerehne. 1984. “The Hidden Economy: State and Prospect for Measurement.” Rev. Income
Wealth 30 (1): 1–23. 12
Lubell, H. 1991. The Informal Sector in the 1980’s and 1990’s. Paris: OECD. 13
Schneider, F. 1994. “Measuring the Size and Development of the Shadow Economy: Can the Causes be Found
and the Obstacles be Overcome?” In: Brandstaetter, H. and W. Güth, editors. Essays on Economic Psychology.
Berlin: Springer.
5
approach, which employs survey data based on voluntary responses or tax audit and compliance
data. Another direct approach suggested by Schneider and Enste (2000) involves exploring the
differences between income declared for tax purposes and that measured by selective checks.
The experience of countries, such as the United States, that have adopted these two types of
direct approaches is that the exercise can take up to two years to complete. Recognizing the
immense value of these approaches it would certainly be useful to explore them in measuring
the size of the informal sector in Trinidad and Tobago. However, given the time constraints
under which this research had to be conducted, these approaches were not feasible.
Under the circumstances the research leaned in the direction of indirect approaches. These are
primarily macroeconomic approaches that estimate the size of the shadow economy. One of the
macroeconomic approaches involves examining the discrepancy between different ways of
measuring the country’s GDP—national expenditure versus national income. Ideally, with
national income accounting, the income measure of GDP should be equal to the expenditure
measure of GDP. Any observed difference is then attributed to the informal sector since this is
assumed to be the main source of unreported income. Several studies have employed this
method, including Thomas (199214
) and Yoo and Hyun (199815
).
Since Trinidad and Tobago does not compute its GDP in two ways, this indirect approach was
not possible. Our study benefitted from the work of Peters (2017), who outlined two of the
more commonly used indirect approaches: the currency demand approach and the macro-
electric approach, which are discussed in the following sections.
3.1 Currency Demand Approach
The critical assumption of the currency demand approach is that cash transactions account for
the majority of informal sector transactions. If this is the case, a change in the size of the
informal economy (or demand for money) will be linked to changes in the tax liability. This
approach is perhaps the most commonly used method, especially in developing countries or
other limited-data environments. It should be noted that since the Currency Demand approach
assumes there is no shadow economy in the base year, the estimates of the size of the informal
14
Thomas, J. 1992. Informal Economic Activity. LSE Handbooks in Economics. London: Harvester Wheatsheaf. 15
Yoo, T. and J. K. Hyun. 1998. "International Comparison of the Black Economy: Empirical Evidence Using
Micro-Level Data." Paper presented at the 54th Congress of the International Institute of Public Finance. Cordoba,
Argentina.

6
economy will be biased downwards. In other words, the currency demand approach
virtually rules out an overestimation of the size of the informal sector.
The informal economy estimates based on the Currency Demand approach are presented in
Table 2.
Table 2: Estimates of Informal Economy in Trinidad and Tobago, 1992–2014
(at constant 2000 prices)
Year Illegal
money16
$TTmn
Legal money
$TTmn
Income velocity of
legal money
Informal
economy,$TTmn
Informal
economy (in % of
GDP)
1992 470.71 1,806.69 18.51 8,711.55 26.05
1993 486.81 2,005.19 16.43 7,999.67 24.28
1994 544.85 2,527.45 13.50 7,356.64 21.56
1995 … … … … …
1996 … … … … …
1997 640.81 3,257.39 19.67 8,044.64 19.67
1998 675.84 3,396.56 13.02 8,797.18 19.90
1999 716.59 3,565.31 13.40 9,599.22 20.10
2000 891.97 3,995.23 12.86 11,469.03 22.33
2001 1,086.22 5,609.38 9.54 10,362.25 19.36
2002 1,153.13 6,178.47 9.35 10,779.98 18.66
2003 1,412.97 5,896.43 11.21 15,839.65 23.96
2004 1,702.04 6,675.56 10.69 18,193.11 25.50
2005 2,718.06 9,598.04 7.90 21,461.73 28.32
2006 3,189.90 10,318.00 8.32 26,524.26 30.92
2007 3,549.25 11,572.85 7.77 27,563.26 30.67
2008 4,508.27 12,151.43 7.65 34,474.41 37.10
2009 5,037.99 18,122.31 4.90 24,697.99 27.80
2010 6,008.91 19,274.09 4.61 27,671.63 31.18
2011 7,204.52 23,980.28 3.70 26,668.13 30.04
2012 7,609.12 28,071.78 3.21 24,389.38 27.11
2013 9,139.11 30,984.49 2.95 27,001.30 29.50
2014 10,473.17 37,246.03 2.48 25,951.21 28.12
Source: Peters (2017).
Estimates of the size of informal sector for Trinidad and Tobago ranged from 19.36 percent of
real GDP in 2001 to 28.12 percent of real GDP in 2014. The estimated figure (37 percent) for
the informal sector as a percent of GDP in 2008 seems to be an outlier, since the estimates
before and after 2008 seemed to be on a stable trend up to 2014. On average, the estimates
appear to suggest that the country’s informal sector is just under 30 percent of real GDP.
To arrive at estimates for the next two years 2015 and 2016, moving averages were used to
forecast two periods sector using currency demand data obtained for 2015 and 2016. This
16
Note that Peters uses the terms ‘legal’ and ‘illegal’ to refer to transactions within the formal and informal
economy, respectively.

7
resulted in an informal economy estimate of 28.24 percent of real GDP for 2015 and 28.62
percent for 2016.
3.2 Electricity Consumption/Macro-Electric Approach
Energy consumption and economic activity have been observed to be highly correlated (Peters
2017). Since most economic activity requires some amount of electricity, it is therefore
reasonable to use electricity consumption as an approximation for total economic activity, both
formal and informal. This means that the difference between the growth of official GDP and the
growth of predicted GDP from electricity consumption can be used to estimate the size of the
informal economy (Kaufmann and Kaliberda 199617
; Lackó 199818
; and Schneider and Enste,
2000). This approach has been adopted in limited-data environments precisely because it is not
intensive in its data requirements.
There are two major limitations to this approach. Firstly, not all shadow economic activities
require considerable energy consumption (for example, some personal services). Secondly,
technological progress in energy production and consumption means that there is more
efficiency in both formal and informal economies, and this could bias estimates of the informal
sector size downward. This can become a serious limitation if unitary elasticity estimates are
used, that is, if we assume that changes in income are matched by equal percentage changes in
electricity. Peters (2017) attempted to lessen the impact of this limitation by using actual
estimated elasticities of electricity/GDP for the countries in the sample.
Table 3 shows the estimates of the size of the informal sector for Trinidad and Tobago, using the
Electricity Consumption/Macro-electric Approach (Peters 2017). The period average estimates
of the informal sector show that it ranges from 31.3 to 41.1 percent of total economic activity
when a unitary elasticity19
assumption is employed, and 32.3 to 37.7 percent of total economic
activity when an estimated elasticity20
is used.
17
Kaufmann, D. and A. Kaliberda. 1996. “Integrating the Unofficial Economy into the Dynamics of Post-Socialist
Economies: A Framework of Analyses and Evidence.” World Bank Policy Research Working Paper 1691.
Washington, DC: World Bank. 18
Lackó, M. 1998. “The Hidden Economies of Visegrad Countries in International Comparison: A Household
Electricity Approach.” In: L. Halpern and C. Wyplosz, editors. Hungary: Towards a Market Economy. Cambridge,
MA: Cambridge University Press. 19
The assumption of unitary elasticity says that on average electricity consumption and total economic activity
grow at the same rate. 20
These refer to actual estimated elasticities for the country.

8
The Table also reflects Peters’ (2017) use of two base years. Generally, when a base year is
chosen it is the first of a series of years in an economic or financial index. New, up-to-date base
years are periodically introduced to keep data current in a particular index.
Table 3: Trinidad and Tobago’s Relative Share of Informal Sector GDP, 1990–2014
Year Unitary elasticity
(Base year: 1999)
Unitary elasticity
(Base year: 2007)
Estimated elasticity
(Base year: 1999)
Estimated elasticity
(Base year: 2007)
1990 …. …. …. ….
1991 31.2 41.0 26.7 32.6
1992 37.4 46.3 34.2 39.4
1993 38.0 46.8 34.7 39.9
1994 37.7 46.5 34.7 40.0
1995 39.9 48.4 48.4 42.8
1996 38.8 47.5 37.2 42.2
1997 41.3 49.6 40.8 45.5
1998 38.7 47.4 38.5 43.4
1999 34.7 43.9 34.7 39.9
2000 33.1 42.6 33.6 38.9
2001 32.4 42.0 33.3 38.6
2002 27.0 37.4 28.0 33.7
2003 28.9 39.0 31.5 37.0
2004 22.4 33.4 25.2 31.2
2005 25.1 35.7 28.9 34.6
2006 18.3 29.8 22.8 29.0
2007 20.2 31.5 25.6 31.5
2008 18.4 30.0 24.0 30.1
2009 22.5 33.5 27.9 33.6
2010 28.9 38.9 34.7 39.9
2011 31.4 41.1 37.5 42.5
2012 33.3 42.8 39.6 44.4
2013 32.5 42.1 38.9 43.8
2014 31.4 41.1 37.8 42.8
Period
Average 31.3 41.1 32.3 37.7
Source: Peters (2017).
For purposes of this study our interest will mainly be in the fourth column of Table 3, which
shows the estimated elasticity estimates for the more recent base year, 2007. Trinidad and
Tobago appears to have smooth electricity consumption profiles with long-run growth rates that
appear consistent with the evolution of the country’s productive capacity (see Figure 1).

9
Figure 1: Real GDP and Growth in Electricity
1996 2006 2016
Long term
Electricity trend
Long term GDP trend
Figure1 shows that the two long term trends in GDP and in Electricity are very close indeed. It
is therefore reasonable to assume that the Table 3 estimates of informal sector size should be
based on the growth of electricity consumption and on the assumption that electricity
consumption and total economic activity move in tandem. To arrive at an estimate for 2015,
moving averages were used to forecast one period using estimated elasticity for 1999 and 2007
base years, giving estimates of 38.8 and 43.7 percent of GDP, respectively. Applying similar
moving averages using 1999 and 2007 base years produced estimates for the year 2016, as 38.5
and 43.4 percent of GDP, respectively.
l
-10
-5
0
5
10
15
20
25
30
35
40
1
Real GDP Growth -Electricity & Water
Real GDP Growth -Total

10
4.0 The Informal Sector and the Tax Gap
Having derived estimates for the size of the informal sector we are now able to produce
estimates for the Tax Gap. Because unrecorded economic activity is untaxed, there will be a
shortfall between actual and potential tax revenue. In this context, Giles (1999)21
proposed that
the total “tax-gap” can be estimated by multiplying the hidden GDP/measured GDP ratio
by total tax revenue. This assumes that the hidden GDP/measured GDP ratio would be the
same as the Tax Gap/Revenue Collected ratio. We can refer to this hidden GDP/measured GDP
ratio as a non-compliance ratio. The Tax Gap as a percentage of total tax liability, based on this
non-compliance ratio, is expected to increase as the size of the informal sector increases.
Using the Giles (1999) proposal, we proceed to estimate the size of the informal sector by
applying both the Currency Demand and Electricity Consumption approaches. The results are
summarized in Table 4.
Table 4: Comparative Tax Gap Computations
Year Currency Demand Approach Macro-Electric Approach
Size of
Informal Sector,
%GDP
Tax Gap, $Bn.
Size of
Informal Sector,
% GDP
Tax Gap, $Bn.
2015 28.2 13.1 43.7 17.8
2016 28.6 11.7 43.4 17.5
4.1 Discussion
Based on the Currency Demand Approach, the size of the informal economy was estimated to
be 28.24 percent and 28.62 percent of GDP for 2015 and 2016 respectively. This produced an
unaddressed Tax liability, or Tax Gap, for the Trinidad and Tobago Economy of TT$13.1
billion for 2015 and TT$11.7 billion for 2016. Similarly, using the Macro-electric method,
with base year 2007, the informal sector was estimated at 43.7 percent of GDP in 2015 and 43.4
percent in 2016, with the Tax Gap at TT$ 17.8 billion for 2015 and TT$ 17.5 billion for 2016.
Based on our estimates the range of the tax Gap for 2015 is between TT$ 13.1 billion and TT$
17.8 billion, with the range for 2016 between TT$ 11.7 billion and TT$ 17.5 billion.
21
Giles, E., A., Giles 1999. “Modelling the Hidden Economy and the Tax-Gap in New Zealand”. Department of
Economics, University of Victoria Canada.

11
We have already mentioned that one feature of these estimation methods is the tendency to
underestimate the size of the informal sector, and hence, the Tax Gap itself. It is noteworthy
that, even if we are more comfortable with the lower estimates of TT$13.1 billion for 2015 and
TT$11.7 billion for 2016, it remains true that successfully tackling the Tax Gap will
significantly address the fiscal deficit of the country.
A review of the literature suggests that most studies that estimate informal sector size utilize one
of the methods used in this study. However, both methods are used here in an attempt to
measure the extent of recorded activity, while obtaining different dimensions of the informal
sector. Further, using two approaches allows either more robust conclusions in the case of
similarities in the estimates or, in the case of substantive differences, leads to a more cautious
interpretation of the results.
It is worth noting, as we have seen earlier, that the Currency Demand approach produced an
estimate of 28.6 percent of GDP in 2016 for Trinidad and Tobago, whereas the electricity
consumption approach produces an estimate of 43.4 percent of GDP using the 2007 base years.
Other estimates in the literature range from early estimates of 20 percent by Maurin, Sookram,
Watson (2006)22
for 1999, to 25 percent of GDP by Vuletin (2008)23
for 2000. More recently,
Schneider et. al (2010) produced an estimate of 35 percent of GDP. This present study has
concluded that the informal sector in Trinidad and Tobago most likely ranges from 28.2 percent
to 43.7 percent. It is interesting that the midpoint of these estimates (36.2 percent) is very close
to the Schneider et al. (2010) estimate of 35 percent.
Using this midpoint informal sector figure instead of the lower Currency Demand estimate used
above, the targeted level of the Tax Gap will be closer to TT$15 billion. This can be used as
the upper bound of the Tax Gap, with the previous TT$11.7 billion as the lower bound.
22
Maurin, A., S. Sookram, and P. K. Watson. 2006. "Measuring the Size of the Hidden Economy in Trinidad and
Tobago, 1973–1999." International Economic Journal 20 (3): 321–341. 23
Vuletin, G. J. 2008. "Measuring the Informal Economy in Latin America and the Caribbean." IMF Working
Paper WP/08/102. Washington, DC: International Monetary Fund.
12
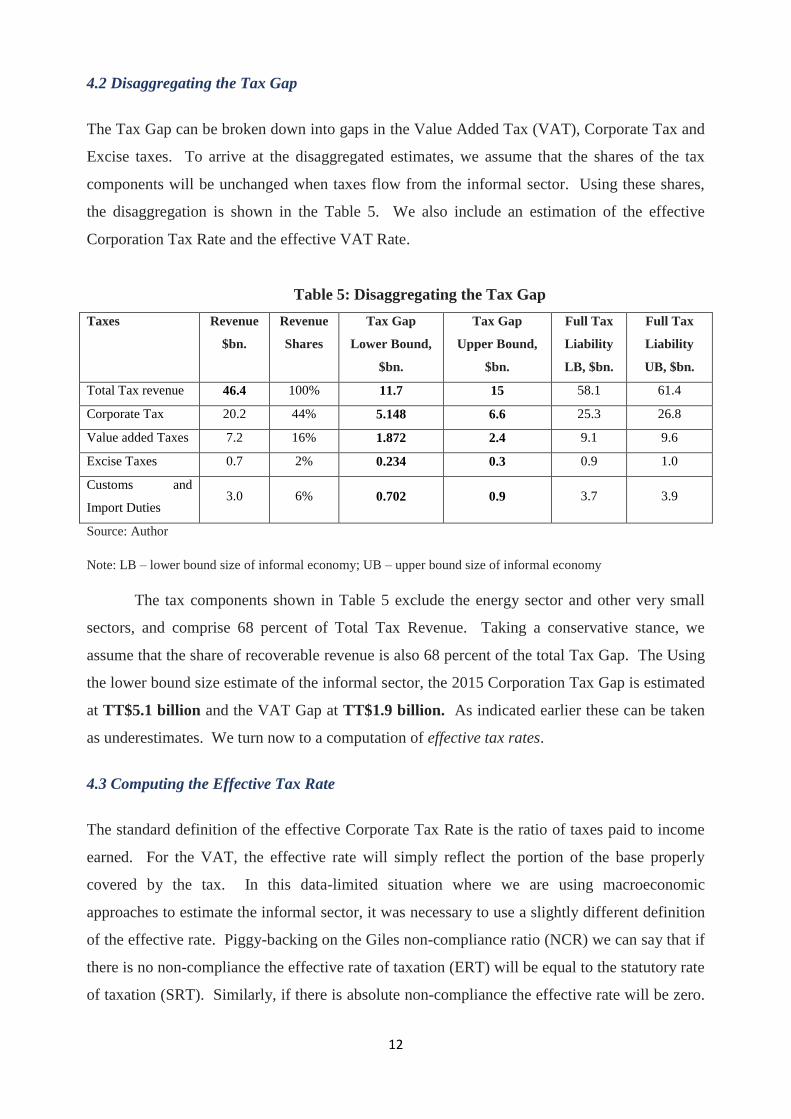
4.2 Disaggregating the Tax Gap
The Tax Gap can be broken down into gaps in the Value Added Tax (VAT), Corporate Tax and
Excise taxes. To arrive at the disaggregated estimates, we assume that the shares of the tax
components will be unchanged when taxes flow from the informal sector. Using these shares,
the disaggregation is shown in the Table 5. We also include an estimation of the effective
Corporation Tax Rate and the effective VAT Rate.
Table 5: Disaggregating the Tax Gap
Taxes Revenue
$bn.
Revenue
Shares
Tax Gap
Lower Bound,
$bn.
Tax Gap
Upper Bound,
$bn.
Full Tax
Liability
LB, $bn.
Full Tax
Liability
UB, $bn.
Total Tax revenue 46.4 100% 11.7 15 58.1 61.4
Corporate Tax 20.2 44% 5.148 6.6 25.3 26.8
Value added Taxes 7.2 16% 1.872 2.4 9.1 9.6
Excise Taxes 0.7 2% 0.234 0.3 0.9 1.0
Customs and
Import Duties 3.0 6% 0.702 0.9 3.7 3.9
Source: Author
Note: LB – lower bound size of informal economy; UB – upper bound size of informal economy
The tax components shown in Table 5 exclude the energy sector and other very small
sectors, and comprise 68 percent of Total Tax Revenue. Taking a conservative stance, we
assume that the share of recoverable revenue is also 68 percent of the total Tax Gap. The Using
the lower bound size estimate of the informal sector, the 2015 Corporation Tax Gap is estimated
at TT$5.1 billion and the VAT Gap at TT$1.9 billion. As indicated earlier these can be taken
as underestimates. We turn now to a computation of effective tax rates.
4.3 Computing the Effective Tax Rate
The standard definition of the effective Corporate Tax Rate is the ratio of taxes paid to income
earned. For the VAT, the effective rate will simply reflect the portion of the base properly
covered by the tax. In this data-limited situation where we are using macroeconomic
approaches to estimate the informal sector, it was necessary to use a slightly different definition
of the effective rate. Piggy-backing on the Giles non-compliance ratio (NCR) we can say that if
there is no non-compliance the effective rate of taxation (ERT) will be equal to the statutory rate
of taxation (SRT). Similarly, if there is absolute non-compliance the effective rate will be zero.

13
So, the effective rate can be defined as the unit value minus the impact of non-compliance. We
therefore have the formula for the effective rate given by,
ERT = (1 – NCR)*SRT
The intuitive explanation is that the effective rate of taxation is really a combination of the
extent of compliance and the statutory rate of taxation.
From our estimates, we have lower bound and upper bound NCR values of 28.62 and 43.7
percent for 2015. For a Corporation Tax Rate of 25 percent the corresponding effective rates
will be 0.25 *(1 - 0.29) and 0.25*(1 - 0.44). This gives ERT values of 0.18 and 0.14. In other
words, when the SRT of Corporation Tax is 25 percent, the ERT would be somewhere between
14 percent and 18 percent. With the rate applied is 30 percent, as it is for businesses with
income of more than one million dollars, the expected effective rate will similarly computed
between 17 percent and 21 percent.
For the previous VAT of 15 percent the lower bound NCR of 28.62 percent will generate and
ERT equivalent to 0.15*(1 - 0.29) = 0.11. The upper bound NCR of 43.7 percent will yield an
ERT value of 0.15*(1 - 0.44) = 0.08. So, for the 15 percent VAT the effective rate was in the
range 8 percent to 11 percent. With the current VAT of 12.5 percent the range of the expected
effective rate of taxation would be between 0.125*(1 - 0.29) and 0.125*(1 - 0.44), that is,
between 7 percent and 9 percent.
These results are presented in Table 6 below.
Table 6: Computing Effective Tax Rates
Taxes Revenue
$bn.
Original
Statutory
Rates, LB
Modified
Statutory
Rates, LB
Original
Statutory Rates,
UB
Modified
Statutory Rates,
UB
Total tax
revenue 46.4
25% 15% 30% 12.5% 25% 15% 30% 12.5%
Corporate
Taxes 20.2
20% 24% 19% 23%
Value added
Taxes 7.2
12% 10% 11% 9%
Excise Taxes 0.7 n.a n.a n.a n.a
Customs and
Import Duties 3.0
n.a n.a n.a n.a
Source: Author
Note: LB – lower bound of Tax Gap; UB – upper bound of Tax Gap
n.a. – not available

14
Concluding Statement
Apart from the data difficulties which were evident, and which will need to be addressed if
serious work of this nature is to be carried out for the Ministry of Finance, what the study has
shown is the absolute need to purposefully address the revenue collection problem in the
country. The truth is that for several reasons, the estimates provided are most likely
underestimates of the true picture. What this means is that both the institutional developments
proposed and the administrative improvements being considered are to be treated as matters of
urgency.