calculating the relative permittivity constants of various ... · calculating the relative...
TRANSCRIPT

Calculating the Relative Permittivity Constants of Various
Dielectric Materials Using a Parallel Plate Capacitor
Jonathan Markell∗
Science Department, All Saints Episcopal School,
2695 South Southwest Loop 323, Tyler, TX 75709 USA
Emily Baker, Garrett Gu, Isaac Joseph, Carson Lansdowne,
Rishabh Thakkar, Elizabeth Zhou, and Rebecca Zhou
Quarknet Students
Jingbo Ye†
Physics Department, Southern Methodist University, Dallas, TX 75275 USA
(Dated: July 22, 2016)
Abstract
Two experimental setups involving an adjustable and fixed parallel plate capacitor are used to
measure the relative permittivities (εr) of paper and two oils. Adjustments for errors, such as
edge effects, body capacitance and tilt effects, are performed for both experiments. The resulting
relative permittivity value for paper falls within an accepted range, and the relative permittivities
of the oils fall within 3% of verified values. The accuracy of these experiments after corrections
allows for hands-on inquiries to be conducted in the classroom on an otherwise abstract concept
in electrostatics.
1

I. INTRODUCTION
A common, albeit error-prone, electrostatics experiment is to study the relationship be-
tween the capacitance of a parallel plate capacitor and the dielectric. The equation describing
the capacitance of an ideal capacitor with a dielectric is:
C =εrε0A
d(1)
where C is capacitance, A is plate overlap area, d is separation distance of the plates, and εr is
the relative permittivity of the dielectric material. This relation lends itself to investigations
on the effects of variable areas, plate separations, and the addition of dielectric materials
within the capacitor. However, Eq. (1) applies only to ideal capacitors - devices comprised
of two conducting plates that are infinitely large, infinitely thin, and perfectly parallel.
Measured capacitance values differ from the ideal because of multiple factors, as detailed
by Wells, et al.1 In addition, when using dielectrics, it is assumed that the material fills the
entire gap between the parallel plates. Unfortunately, this ignores the effects of air between
the plates and the dielectric and is not practical for any dielectric material whose thickness
is on the order of the capacitor’s tilt.
In this study, two experiments are performed. The first is to find the relative permittivity
of a thin, solid dielectric material: paper. Calculating an accurate value presents a challenge
for several reasons. The thickness of the paper, humidity of the environment, and variable
composition of paper all have an effect on its relative permittivity.2 To keep these conditions
constant, only printer paper from the same package is used, and only measurements taken
from the same day are compared. Paper’s roughness also results in air gaps that must be
incorporated into our calculations. The second experiment studies liquid dielectrics and a
method to calculate their relative permittivities. An issue that must be considered is the
capillary effect between the metal plates and the liquid dielectric. The calculated relative
permittivities are then applied to find the depth of the liquids in a container. This method
can be used to find the depth of liquids in opaque containers or in situations where the
depths cannot be measured directly.
2

II. DEVICE DESCRIPTION
Experiment 1 utilizes a horizontally and vertically adjustable cm x 10 cm parallel plate
capacitor with a 2.0 mm plate thickness. The top plate is fixed to an insulating frame, while
the bottom plate is attached to a mobile optical stage. The overlap area of the plates can
be adjusted from 0 cm2 to 100 cm2. The separation between the two plates can be set using
an adjustable micrometer head with 0.01 mm precision from 0 mm to 10 mm. The accuracy
of this device is discussed by Wells, et al.1
FIG. 1. The instrument used in Experiment 1.
The capacitor in Experiment 2 has two 10 cm x 10 cm metal plates of roughly a 1.0 mm
fixed separation attached by four acrylic screws. An open acrylic container (12.5 cm x 2.5
cm x 12.5 cm) holds the capacitor plates and the liquid under study.
FIG. 2. The instrument used in Experiment 2.
The capacitance in each experiment is measured using a digital capacitance meter capable
3

of measuring down to tenths of picofarads with a relative precision of 0.5%.
III. APPARATUS ERRORS
A. Edge Effects
Edge effects, or fringe effects, describe the accumulation of charge at the edge of the
capacitor’s plates, resulting in non-uniform charge densities. Due to these edge effects, the
electric field between the plates is less than expected for an ideal capacitor and thus the
capacitance is increased. Edge effects can be represented by a ratio of measured capacitance
to ideal capacitance, α = CC0
.1,3,4 A method for calculating this ratio is given by Nishiyama
and Nakamura, where b is the aspect ratio of the plate separation to the side length.3
α = 1 + 2.367b0.867 (2)
Since the aspect ratios used in this experiment fall within the range of b ≤ 0.1, this
correction should produce little error.1,8
B. Tilt Effects
Distance separation varies across the plates since they cannot be perfectly parallel. Plate
separation d is set at zero for the distance at which the capacitor’s resistance reaches zero.
However, this only signifies the minimum separation; the average distance is greater. The
error due to tilt effect can be represented by the ratio ∆dd
by defining ∆d as the average
deviation in plate separation distance above d. The instrument manual gives ∆d as 0.03mm.5
This value is calculated to range between 0.03 to 0.07mm for our devices.
C. Body Capacitance
Though it is relatively small, extra charge from the apparatus’ materials causes an in-
crease in measured capacitance values. In Experiment 1, the body capacitance is calculated
by removing the bottom stage from the apparatus to eliminate the possibility of an electric
field that could accumulate at the edge of the plates when separated inside of the apparatus.
4

The body capacitance in Experiment 1 ranges from approximately 5 pF to 7 pF. In Exper-
iment 2, the capacitance of the metal plates outside of the acrylic box is subtracted from
the capacitance of the metal plates inside the acrylic box. The body capacitance measured
ranges up to 1.8 pF.
D. Capillary Action
Liquids have the ability to flow against gravity due to strong intermolecular forces, adhe-
sive properties, and cohesive properties. This effect is prominent when liquids are placed in
narrow spaces and can be a significant source of error when dealing with liquid dielectrics.
E. Screws
In the fixed plate capacitor, the four acrylic screws that secure the metal plates together
change the capacitance as a result of their dielectric properties and the area that they
occupy, approximately 1% of the total area of the plates. In addition, the screws obstruct
measurements of the capillary action between the plates.
IV. EXPERIMENT 1: RELATIVE PERMITTIVITY OF PAPER
This experiment’s purpose is to measure the relative permittivity of paper using the
adjustable parallel plate capacitor. Previously, Grove, Masters, and Miers use a self-designed
capacitor of particle board and aluminum foil to calculate Teflon’s relative permittivity. They
choose Teflon rather than paper because of paper’s varying εr value.2 Our experimentation
allows precise measurements of a thin dielectric to be obtained and systematic errors to be
accounted for, which they acknowledge but do not consider.
The paper’s thickness, as measured by a caliper, is 100 µm, which is in range of the tilt
effect. It would be inaccurate to follow the conventional method of sandwiching the paper
between the plates because of the paper’s thinness.6 With the tilt effect, there could still be
a large air gap between the plates and the paper, which may cause errors in excess of 30%.
If instead several sheets of paper are used to fill the separation between the plates, then the
air gaps between the sheets of paper must still be accounted for in addition to the tilt effect.
5

To limit these effects, the plates are separated at distances from 0.5 mm to 4.0 mm (using
0.5 mm increments) and a varying number of sheets of paper is placed on the bottom plate.
Up to half of the maximum number of papers that can fit into the plate separation is used
to leave an air gap that minimizes the tilt effect error. Plate overlap is kept at a consistent
100 cm2. As seen from Fig. 4 from Ref. 2, the capacitance through the air gaps and pieces
of paper can be combined and treated as individual blocks of dielectric respectively. The
measured capacitance (Cm) is thus defined as the capacitance of each block - capacitance
through air (Ca) and through paper (Cp) - connected in series.
1
Cm
=1
Ca
+1
Cp
(3)
where Cm is measured capacitance, Ca is capacitance through air, and Cp is capacitance
through paper. In terms of the capacitor’s physical properties, this can be written as:
1
Cm
=d0 − nd1
ε0A+
nd1
εrε0A(4)
1
Cm
=nd1
ε0A(
1
εr− 1) +
d0
ε0A(5)
where d0 is the plate separation, d1 is the thickness of one sheet of paper, n is the number
of sheets of paper, and A is the plate overlap area. When 1Cm
is plotted versus n, the slope
m of that graph can be represented as:
m =d1
ε0A(
1
εr− 1) (6)
Eq. (6) can then be manipulated to solve for εr.
εr =d1
ε0Am+ d1
(7)
This method yields an εr of 2.451, considerably smaller than the given 3.7 value.7 There-
fore, multiple combinations of error corrections are applied to the measured capacitance in
order to find a more accurate relative permittivity value.
A. Error Corrections
In order to improve upon the initial value obtained from Experiment 1, edge effects,
body capacitance (Cbody), and tilt are accounted for in the measured capacitance value.
6
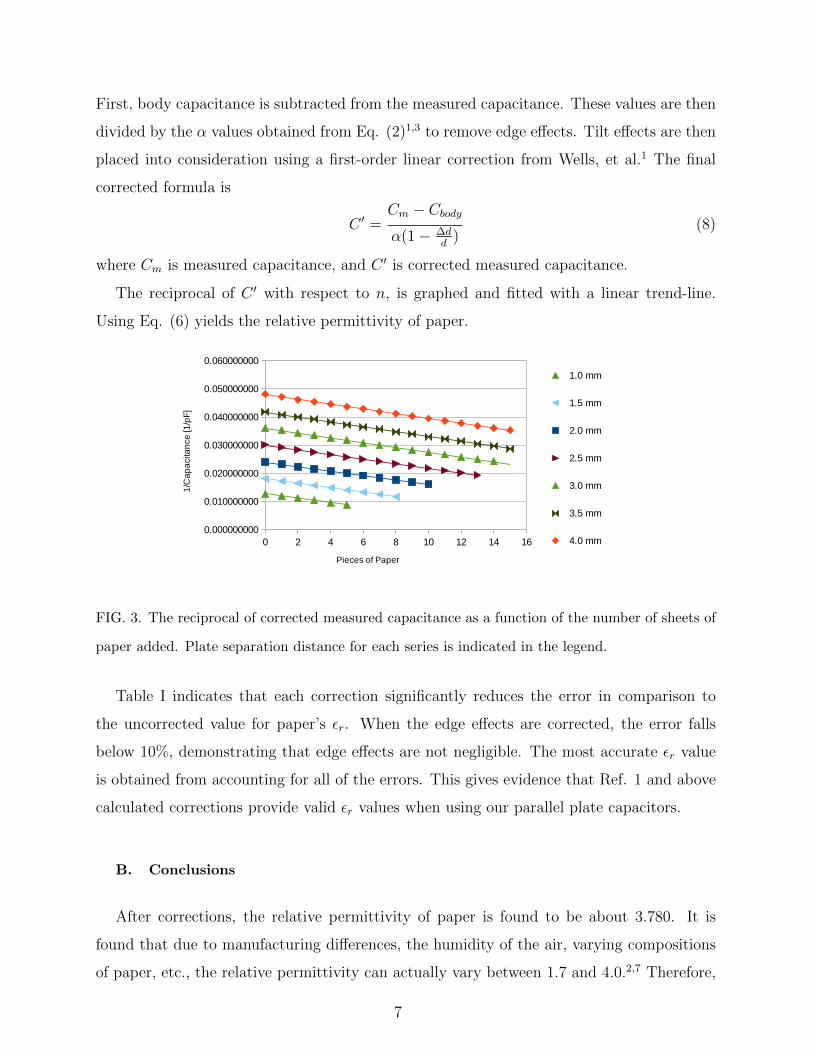
First, body capacitance is subtracted from the measured capacitance. These values are then
divided by the α values obtained from Eq. (2)1,3 to remove edge effects. Tilt effects are then
placed into consideration using a first-order linear correction from Wells, et al.1 The final
corrected formula is
C ′ =Cm − Cbody
α(1 − ∆dd
)(8)
where Cm is measured capacitance, and C ′ is corrected measured capacitance.
The reciprocal of C ′ with respect to n, is graphed and fitted with a linear trend-line.
Using Eq. (6) yields the relative permittivity of paper.
FIG. 3. The reciprocal of corrected measured capacitance as a function of the number of sheets of
paper added. Plate separation distance for each series is indicated in the legend.
Table I indicates that each correction significantly reduces the error in comparison to
the uncorrected value for paper’s εr. When the edge effects are corrected, the error falls
below 10%, demonstrating that edge effects are not negligible. The most accurate εr value
is obtained from accounting for all of the errors. This gives evidence that Ref. 1 and above
calculated corrections provide valid εr values when using our parallel plate capacitors.
B. Conclusions
After corrections, the relative permittivity of paper is found to be about 3.780. It is
found that due to manufacturing differences, the humidity of the air, varying compositions
of paper, etc., the relative permittivity can actually vary between 1.7 and 4.0.2,7 Therefore,
7

Combination of Error Adjustment
Corrections
Measured Relative Permittivity
(Averaged Over Multiple Trials)
Percentage Error
from 3.7
No Errors Corrected 2.451 33.76%
Only Body Capacitance Corrected 3.114 15.84%
Edge Effects and
Body Capacitance Corrected3.990 7.838%
Tilt Effect and
Body Capacitance Corrected3.027 18.20%
All Errors Corrected 3.780 2.162%
TABLE I. Resultant calculated relative permittivity values according to measurements after varying
combinations of error adjustments and their percent differences from a reference value.
3.780 is a valid value for the relative permittivity of paper.
V. EXPERIMENT 2: RELATIVE PERMITTIVITY OF OIL
A.
The purpose of this experiment is to determine the relative permittivities of soybean and
canola oil. A fixed capacitor is placed into an empty acrylic container and its capacitance
is measured. The container is then filled with oil, and the capacitance is measured again.
The idealized equations for the capacitor completely filled with air and oil are given below,
respectively:
Cair = ε0A
d+ Cbody (9)
Coil = εrε0A
d+ Cbody (10)
The ratio of these equations solves for the dielectric constant εr.
Coil − Cbody
Cair − Cbody
= εr (11)
After several trials and correcting for body capacitance, the relative permittivity of canola
oil and soybean oil are measured to be 3.16 and 3.22, respectively. According to Fig. 1 from
Ref. 9, the relative permittivity of these oils at room temperature (25 °C) are 3.08 and 3.13,
which gives an error of 2.60% and 2.88%.
8

B.
The dielectric constant obtained from Part A is used to calculate the oil depth based
on the measured capacitance. The calculated depths are then compared to the measured
values. In the experiment, the parallel plate capacitor can be considered as two capacitors
in parallel, one with an oil medium and the other with an air medium. The measured
capacitance is then a sum of the two capacitances:
Cm = Cair + Coil (12)
Cm =ε0l(l − h)
d+ε0εrlh
d(13)
where l is the side length, h is the oil depth, and d is the plate separation. Eq. (13) can
then be manipulated to solve for oil depth h:
h =1
ε0 − 1(Cmd
ε0l− l) (14)
The percent difference between the calculated and measured depths is graphed in Figure
4a. As shown in the figure, there is a significant discrepancy between the measured and
calculated oil depths. The trials are conducted again after capillary action is observed
(as pictured by Figure 5), which differs from the measured oil depths by up to 5.0 mm.
Instead, comparing the calculated results to the measured capillary depths results in a large
decrease in error as seen in Figure 4b. However, this difference is still quite large and leads
to questions of other possible sources of error, such as the cleanliness of the plates and
actual plate separation. Plate cleanliness is tested by disassembling one of the capacitors,
cleaning the residual oil from between the plates, and allowing it to dry overnight. The
capacitor is reassembled and the measured capacitance is compared to values from previous
measurements. The residual oil is found to have a negligible effect. The plate separation is
then measured and found to be slightly less than 1 mm for each capacitor. Unfortunately,
the exact plate separation varies on each side of the capacitor by a slight amount. The
average separation is instead calculated using the ideal capacitance formula with corrections
for body capacitance and edge effects. Using this corrected plate separation in Eq. (14)
produces the results seen in Figure 4c.
9

a)
b)
c)
FIG. 4. Percent difference between calculated oil depth from capacitance values and measured oil
depth as a function of measured oil depth. Each graph includes extra error corrections compared
to its immediate predecessor, as described in section V B.
C. Experimental Conclusion
After accounting for all of the applicable issues, the mean error of the measured and
calculated oil depths, where εr is equal to the accepted value for each oil tested, is 2.83%.
10

1mm
Capillary
Action
FIG. 5. Side image of experimental setup, with capillary action indicated.
We expect that the remaining error is attributed to the screws in the capacitor plates.
VI. APPLICATIONS/CONCLUSIONS
The results from both experiments produce accurate values for the relative permittivities
measured for paper, canola oil, and soybean oil. After corrections, the calculated εr are
within 3% of their respective values. This proves that the apparatus and methods utilized
to correct the data can work with a variety of materials. We have demonstrated that Exper-
iment 1’s methodology accurately produces results for thin dielectric constants. Calculating
the oil depth in Experiment 2 presents a novel way of measuring depth of other liquids,
especially those in opaque containers or opaque liquids themselves. A continuation of this
research might involve calculating the relative permittivity of the acrylic screws and finding
a reliable method to approximate capillary action. This lab provides a hands-on demon-
stration for dielectrics in a classroom while also applying an ideal formula in a nonideal
environment.
ACKNOWLEDGMENTS
This work is supported by the QuarkNet program with funds provided by the National
Science Foundation and Department of Energy.
We thank Southern Methodist University, Dr. Jingbo Ye and Beau Wells for provid-
ing supplemental instruction. We also gratefully acknowledge eCube Instruments LLC for
11

manufacturing the adjustable parallel plate capacitor apparatus designed by Dr. Jingbo Ye,
which is used in Experiment 1.
1 Wells B. et al.,”An Adjustable Parallel Plate Capacitor Instrument and
Test of the Theoretical Capacitance Formula Obtained from Gauss’s Law
www.physics.smu.edu/sdalley/quarknet/2015/talks/Wells Adjustable PPC Paper.pdf .(2015)
2 Grove, T. T., Masters, M. F., & Miers, R. E. ”Determining dielectric constants using a parallel
plate capacitor”, Am. J. Phys. American Journal of Physics, 73(1), 52–56 (2005).
3 Nishiyama, H., & Nakamura, M. ”Form and capacitance of parallel-plate capacitors”. IEEE
Transactions on Components, Packaging, and Manufacturing Technology: Part A. A, 17(3),
477-484. (1994)
4 Parker, G. W, ”Electric Field Outside A Parallel Plate Capacitor” Am. J. Phys. 70 (502),
(2002).
5 J. Ye, Experiments with Parallel Plate Capacitors to Evaluate the Capacitance and Gauss Law
in Electricity, and to Measure the Dielectric Constants of a Few Solid and Liquid Samples,
Southern Methodist University Lab Handout (Unpublished).
6 Tereshchenko, O. V., Buesink, F. J., & Leferink, F. B. ”An overview of the techniques for
measuring the dielectric properties of materials”. XXXth URSI General Assembly and Scientific
Symposium (2011).
7 Serway, R. A., & Beichner, R. J. Physics for Scientists and Engineers (5th ed.). (Saunders
College Publishing, Orlando, FL, 2000), pp. 819
8 Curtis, H. I., & Scott, A. H. ”Edge correction in the determination of dielectric constant”.
Journal of Research of the National Bureau of Standards, 22, 747-775. (1939)
9 Corach, J., Sorichetti, P., & Romano, S (2013, December 4). ”Electrical properties of vegetable
oils between 20 Hz and 2 MHz.” International Journal of Hydrogen Energy, 39(16), 8754-8758
(2013).
12