calculating final gravity beforeyou ferment it set • requires a diverse and reliable data set •...
TRANSCRIPT

Calculating Final
Gravity Before You
Ferment It

Background
• Predict final gravity to control
– Sweetness/dryness
– ABV
– Mouth-feel
– Hops dosing
• The primary effectors on these outcomes include
– Mash Temperature
– Original Gravity
– Yeast Strain

Data Set
• Requires a diverse and reliable Data Set
• “Brewing Classic Styles” by Jamil Zainasheff and John Palmer.
• Recipes for basic British and American Ales, subject to the following criteria:
– British Ales fermented with WLP002, W1968, or Fermentis S-04 (attenuation range = 63%-75%)
– American Ales fermented with WLP001, W1056, or Fermentis US-05 (attenuation range = 73%-80%)
– The recipes could not include excipients.

Data Set (Continued)
• Extracted data included:
– Starting Gravity (original gravity, OG)
– Final Gravity
– Mash Temperature
– Fermenting Yeast
• Data transformations and calculations
– Starting Gravity transformed to points/gal (ppg)
– Final Gravity to transformed to ppg
– % Attenuation = 1-(Final ppg/Starting ppg)

Yeast
Strain
British (WLP002/W1968/S04) American (WLP001/W1056/US-05
Attenuation 63%-75% 73%-80%
Mash Temp Substyle Attenuation (%) Substyle Attenuation (%)
149 American IPA 82%
151 Premium Bitter 74%
152 Strong Bitter 73% American Pale 77%
152 Ordinary Bitter 71% American Brown 1 77%
153 South English Brown 68% Robust Porter 77%
154 Mild English Brown 69% American Stout 76%
154 American Brown 2 76%
154 American Amber 75%

Abbreviated Enzymology of Mashing
α-amylase
β-amylase
limit dextrinase

Linear Regression for % Attenuation as
a Function of Mash Temperature
y = -0.019x + 3.6072
R² = 0.7145
y = -0.0114x + 2.5018
R² = 0.9283
65%
67%
69%
71%
73%
75%
77%
79%
81%
83%
148 149 150 151 152 153 154 155
Safale 04
Safale 05
Mash Temperature (F)
% A
tte
nu
ati
on
(1
-F p
pg
/S p
pg
)*1
00


Conclusions from Linear
Regression Analysis
• Attenuation by British and American Ale yeast correlates inversely with mash temperature.
– British: r2 = 0.7145
– American: r2 = 0.9283
• The crystal, toasted and roasted components of the grain bill do not significantly affect the regression.
• The separation of the curves indicates that the two yeast types have different abilities to attenuate wort.

Is The Difference in Attenuation Ability
of British and American Ale Yeast Real?
Basic Descriptive Statistics
Attenuation by N Mean
Attenuation
St. Dev Median
Safale 04 5 71% 2% 71%
Safale 05 7 77% 2% 77%
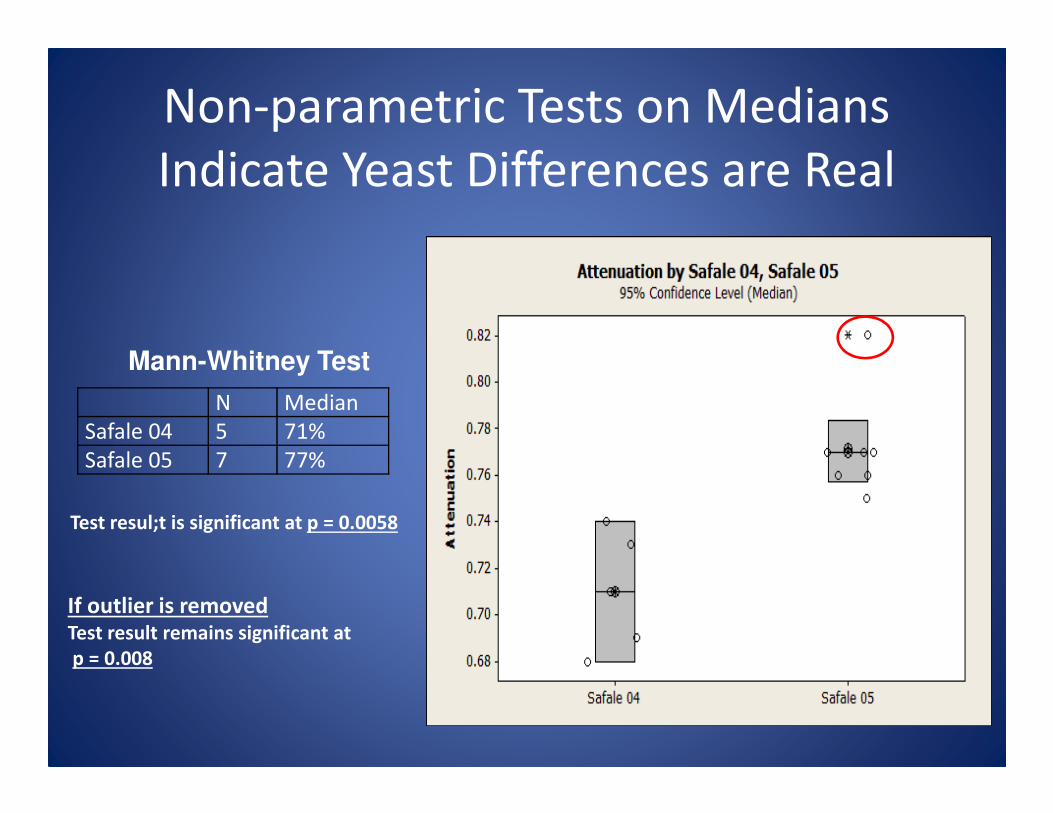
Non-parametric Tests on Medians
Indicate Yeast Differences are Real
N Median
Safale 04 5 71%
Safale 05 7 77%
Test resul;t is significant at p = 0.0058
Mann-Whitney Test
If outlier is removedTest result remains significant at
p = 0.008
Is this Difference also Seen when the
Means are Analyzed?
• Several Tests are Required to Establish if
Evaluating Means is Valid:
– Normally distributed: Kolmogorov-Smirnov test
– Have equal variances: F-test and Levine’s test
– For both, the number of observations are
sufficient to give a statistical power of 90% (i.e.
the probability of rejecting the difference if it is
not true).
• It is valid to compare the means

Two Sample Student’s T-Tests on Means
• T-Test of difference = 0 (vs not =): T-Value = -4.31, P-Value = 0.003
If the outlier is removed:The two sample no longer have equal variences and therefore the means can not be
compared
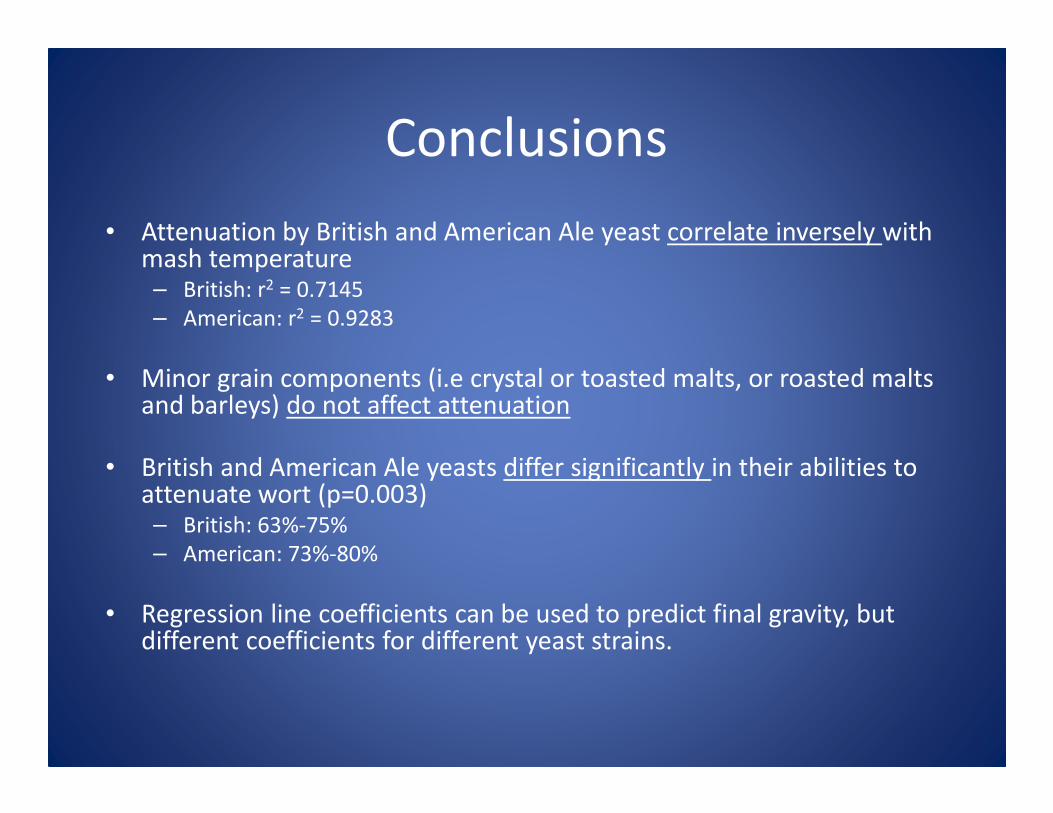
Conclusions
• Attenuation by British and American Ale yeast correlate inversely with mash temperature– British: r2 = 0.7145
– American: r2 = 0.9283
• Minor grain components (i.e crystal or toasted malts, or roasted malts and barleys) do not affect attenuation
• British and American Ale yeasts differ significantly in their abilities to attenuate wort (p=0.003)– British: 63%-75%
– American: 73%-80%
• Regression line coefficients can be used to predict final gravity, but different coefficients for different yeast strains.

A Tool for Calculating FG for Basic
British and American Ales
Estimation of Final Gravity from Mash Temperature, % Attenuation and
Yeast Strain
Safale 05
Brew Parameters Recommended Target Achieved
OG 64 64 64
Target Temp 153 153 154
% Atten 76% 76% 75%
Final Grav 15.1 15.1 16.1
m -0.015 -0.015 -0.015
b 3.089 3.089 3.089
% Attenuation vs. Mash Temp
Yeast m (slope) b (intercept)
Safale 04 -0.0190 3.6072
Safale 05 -0.0152 3.089