calculang essen&al biodiversity variables (ebv) for ... · calculang essen&al biodiversity...
TRANSCRIPT
Calcula&ngEssen&alBiodiversityVariables(EBV)forspeciespopula&onabundance–acasestudyfrom
planktonmonitoringdataintheBal&cSea
Ma#hiasObst1,BengtKarlson2,ChristosArvandi:s3,KlaasDeneudt4
Contact:[email protected]
1DepartementofMarineSciences,GöteborgUniversity2SwedishMeteorologicalandHydrologicalIns&tute
3HellenicCentreforMarineResearch,Greece4FlandersMarineIns&tute(VLIZ),Belgium

WhatisanEBV?
Essen:alBiodiversityVariables(EBVs)aredefinedasderivedmeasurementsrequiredtostudy,report,andmanagebiodiversitychange,focusingonstatusandtrendinelementsofbiodiversity.

Source:Avanza.se
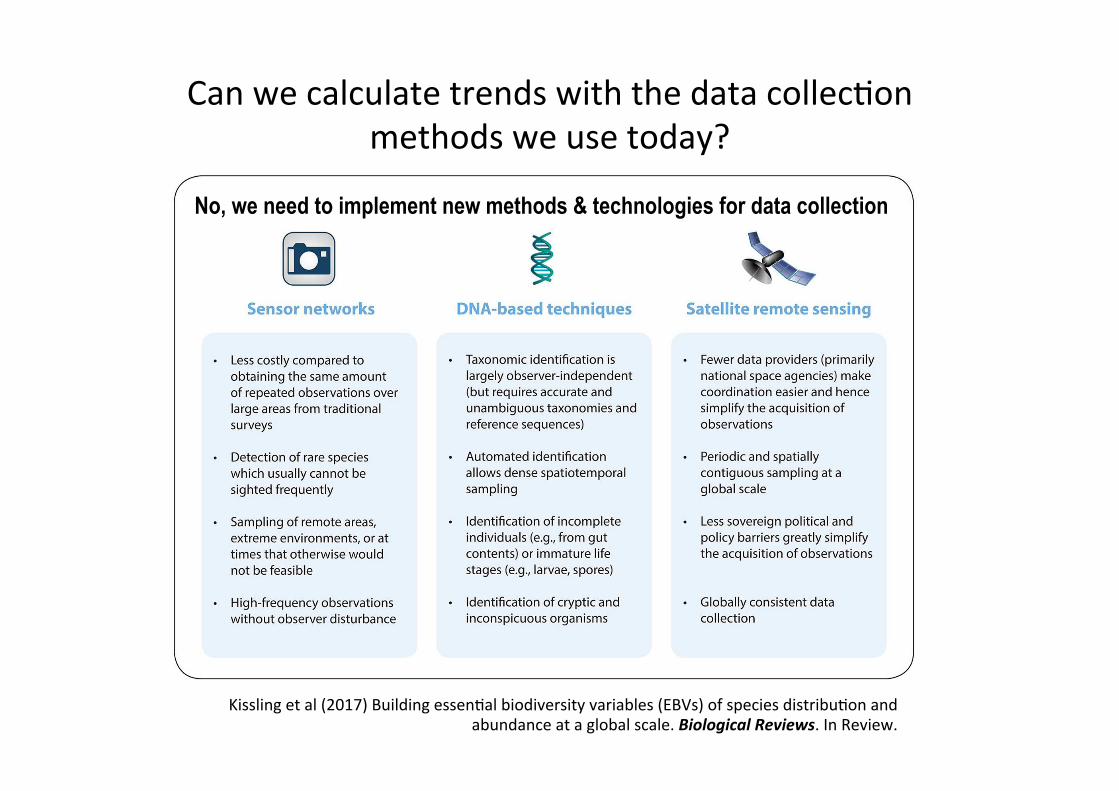
Canwemeasuretrendsfornaturalcapitalinthesamewayaswemeasuretrendsforeconomiccapital?
AmajorproblemisthatspeciesdonotreporttheirperformancedataCanwecalculatesuchtrendswiththedatacollec&onmethodsweusetoday?
Assets(species,habitats,ecosystems)
Performanceofasingleassetsover&me
Performanceofallassetsinaregionover&me

http://geobon.org
Collect & publish data
Integrate & process data
Build models
Test & validate
Visualize trends
EBV data package
M1 M2
M1 M2 M3
M1
M2 M1
Abu
ndan
ce /
dist
ribut
ion
Usable data set
Monitoring
Observations
Taxonomy
Indicators
Group on Earth Observations Biodiversity Observation Network
Calcula&ngEssen&alBiodiversityVariables(EBV) Taking the pulse of the biosphere
Collections

18 JANUARY 2013 VOL 339 SCIENCE www.sciencemag.org 278
POLICYFORUM
tion. However, EBVs relating to species popu-lations or traits and to genetic or community composition require representative sampling across taxonomic groups or community types. These EBVs need to balance specifi city and generality, enabling valid aggregation of data from multiple monitoring programs, while allowing for fl exibility in the species or taxo-nomic groups addressed by these programs.
Variables selected as EBVs fi ll a niche not covered by global observation initiatives looking at environmental pressures [e.g., GCOS ( 8), Essential Ocean Variables ( 18)]. An EBV such as species abundance provides data for indicators such as the Living Planet, Wild Bird, and Red List indices (LPI, WBI, and RLI) (see the table). Assessing ecosystem services (ES) requires knowledge of changes in benefi cial species, functional groups, or ecosystem processes; additional physical, social, and economic data (fi g. S1) can be obtained from valuation studies, surveys, and national statistics ( 19). Complemen-tary spatial information on responses imple-mentation (e.g., coverage of protected areas) can inform indicators of the effectiveness of policy and management (fi g. S1). This fun-damental, but fl exible, role of EBVs confers robustness to the system: EBVs are insulated from changing technologies at the observa-tion level and from changing approaches at the indicator level.
Building Consensus and Capacity
Identifi cation of EBVs and defi nition of sam-pling protocols are done by an open process that requires engagement of scientifi c, pol-icy, and other communities. Major roles can be played by IPBES, national biodiversity authorities, space agencies, nongovernmen-tal organizations, and citizen-science com-munities. Information on the EBV process is updated at ( 11); written contributions can be sent to GEO BON. Side events will be organized in scientifi c and policy meetings over the next year. This will refi ne the EBV list, which, once stable, will periodically be updated by GEO BON in a process similar to that used for ECVs ( 8).
Coordination of sampling schemes by GEO BON across countries and scales can minimize costs and improve spatial repre-sentativeness. Developing suitable fi nancial mechanisms to share costs between develop-ing countries, where most biodiversity occurs, and developed countries, which share in the benefi ts but drive many of the pressures ( 20), will play a key role in the development of a truly global system. We hope that EBVs will catalyze investment in biodiversity observa-tions, as ECVs have done for climate.
References and Notes
1. S. H. M. Butchart et al., Science 328, 1164 (2010). 2. CBD, Decision X/2, The Strategic Plan for Biodiversity
2011–2020 and the Aichi Biodiversity Targets, Nagoya,
Japan, 18 to 29 October 2010. 3. H. M. Pereira, L. M. Navarro, I. S. Martins, Annu. Rev.
Environ. Resour. 37, 25 (2012). 4. R. J. Scholes et al., Curr. Opin. Environ. Sustain. 4, 139
(2012). 5. R. P. Guralnick et al., Ecol. Lett. 10, 663 (2007). 6. L. J. Martin et al., Front. Ecol. Environ 10, 195 (2012). 7. C. K. Feld et al., Oikos 118, 1862 (2009). 8. GCOS, Implementation Plan for the Global Observing
System for Climate in Support of the UNFCCC (2010 Update) (World Meteorological Organization, Geneva, 2010), p. 180.
9. Secretariat of the CBD, Report of the Ad Hoc Technical Expert Group on indicators for the Strategic Plan for Bio-diversity 2011–2020 (SCBD, Montreal, Canada, 2011).
10. P. Bubb et al., National Indicators, Monitoring and Reporting for the Strategic Plan for Biodiversity 2011–2020 (UNEP-WCMC, Cambridge, 2011).
11. GEO BON, EBVs; www.earthobservations.org/geobon_ebv.shtml.
12. R. D. Gregory et al., Philos. Trans. R. Soc. London Ser. B 360, 269 (2005).
13. D. P. Turner, Front. Ecol. Environ 9, 111 (2011). 14. S. Ferrier, Bioscience 61, 96 (2011). 15. W. Jetz et al., Trends Ecol. Evol. 27, 151 (2012). 16. H. M. Pereira et al., Science 330, 1496 (2010). 17. E. O. Wilson, Science 289, 2279 (2000). 18. IOC, A framework for ocean observing—Consultative
draft v.7 (UNESCO, Paris, 2011), p. 26. 19. H. Tallis et al., Bioscience 62, 977 (2012). 20. M. Lenzen et al., Nature 486, 109 (2012).
Acknowledgments: NASA, DIVERSITAS, GEO, ESA-ESRIN, and the Department of Science and Technology (South Africa) pro-vided resources. H.M.P. was supported by FCT grant PTDC/AAC-AMB/114522/2009. M. Paganini helped organize a workshop. H.M.P., S.F., M. Walters, G.N.G., R.H.G.J., R.J.S., D.P.F., C.H., R.H., R.S., S.N.S., and M. Walpole are on the GEO BON steering committee. Abbreviations spelled out in SM.
Examples of candidate Essential Biodiversity Variables
Allelic diversityGenetic
composition
EBV
class
EBV
examples
Measurement and scalability Temporal
sensitivity
Feasibility Relevance for CBD targets
and indicators (1,9)
Generationtime
1 to 5 years
Genotypes of selected species (e.g., endangered, domesticated) at representative locations.
Data available for many species and for several locations, but little global systematic sampling.
Targets: 12, 13.Indicators: Trends in genetic diversity of selected species and of domesticated animals and cultivated plants; RLI.
Taxonomicdiversity
Communitycomposition
5 to >10years
Ongoing at intensive monitoring sites (opportunities for expansion). Metagenomics and hyperspectral RS emerging.
Targets: 8, 10, 14. Indicators: Trends in condition and vulnerability of ecosystems; trends in climatic impacts on community composition.
Consistent multitaxa surveys and metagenomics at select locations.
Habitatstructure
Ecosystemstructure
RS of cover (or biomass) by height (or depth) globally or regionally.
Global terrestrial maps available with RS (e.g., Light Detection and Ranging). Marine and freshwater habitats mapped by combining RS and in situ data.
Targets: 5, 11, 14, 15.Indicators: Extent of forest and forest types; mangrove extent; seagrass extent; extent of habitats that provide carbon storage.
Abundancesand distributions
Species populations
PhenologySpecies traits
1 to >10years
Counts or presence surveys for groups of species easy to monitor or important for ES, over an extensive network of sites, complemented with incidental data.
Standardized counts under way for some taxa but geographically restricted. Presence data collected for more taxa. Ongoing data integration efforts (Global Biodiversity Information Facility, Map of Life).
Targets: 4, 5, 6, 7, 8, 9, 10, 11, 12, 14, 15.Indicators: LPI; WBI; RLI; population and extinction risk trends of target species, forest specialists in forests under restoration, and species that provide ES; trends in invasive alien species; trends in climatic impacts on populations.
1 yearTiming of leaf coloration by RS, with in situ validation.
Several ongoing initiatives (Phenological Eyes Network, PhenoCam, etc.)
Targets: 10, 15.Indicators: Trends in extent and rate of shifts of boundaries of vulnerable ecosystems.
Nutrientretention
Ecosystemfunction
1 yearNutrient output/input ratios measured at select locations. Combine with RS to model regionally.
Intensive monitoring sites exist for N saturation in acid-deposition areas and P retention in affected rivers.
Targets: 5, 8, 14. Indicators: Trends in delivery of multiple ES; trends in condition and vulnerability of ecosystems.
10.1126/science.1229931
Supplementary Materials
www.sciencemag.org/cgi/content/full/339/6117/277/DC1
Published by AAAS
on
Janu
ary
17, 2
013
ww
w.s
cien
cem
ag.o
rgD
ownl
oade
d fro
m
Pereiraetal(2013)Science

2013). Version 20 of the ENM workflow was used in our
analyses. The ENM workflow uses occurrence and environ-
mental data to model ecological niches using a web service
based on openModeller, a library that provides a variety of
algorithms to model species distribution patterns (http://
openmodeller.sf.net/) (Mu~noz et al., 2011). The second
workflow, the ENM Statistical Difference Workflow (ESW
DIFF) (http://purl.ox.ac.uk/workflow/myexp-3959.2; accessed
23 January 2014) allows the spatial computation of changes
in PD maps by calculating the differences between two raster
layers using the R statistical environment 3.0.2 (R Core
Team, 2013).
Occurrence data
Occurrence data for all species were extracted from GBIF
(Global Biodiversity Information Facility; http://gbif.org/)
during spring 2013 (see Appendix S1 in Supporting Informa-
tion) (Table 1). For the Idotea spp., additional occurrence
records were gathered through an extensive literature survey
and manually geo-referenced (Appendix S2) as well as
obtained from museum collections (FMNH Helsinki; GOM
Stralsund; SMF Frankfurt; SMNH Stockholm; ZIN St. Peters-
burg; ZMB Berlin; ZMH Hamburg) and through our own
sampling (Appendix S3). For F. vesiculosus and F. radicans,
GBIF records were either concentrated in a small area of the
Baltic that is not representative of the species’ full distribution
range, or were too few (< 50). Consequently, additional occur-
rence points were created by geo-referencing in the known dis-
tribution range from the literature (Bonsdorff, 2006;
Schagerstr€om, 2013) (Table 1, Appendix S2). All occurrence
data collected for this study have been submitted to the OBIS
database (http://www.iobis.org/) (http://www.vliz.be/nl/imis?
module=dataset&dasid=4607; title of data set ‘Observations of
three Idotea species (I. balthica, I. chelipes and I. granulosa) in
northern Europe, including the Baltic Sea’).
Environmental data
Environmental layers that are likely to affect the distribution
of the species were chosen based on the literature (Table 1).
Global marine layers came from Bio-Oracle (http://www.
bio-oracle.ugent.be/; data downloaded 14 August 2013) at a
resolution of 5 arc-minutes (Tyberghein et al., 2012), and
from AquaMaps (http://www.aquamaps.org/download/main.
php; data downloaded 1 April 2008) at a resolution of 30
arc-minutes (Kaschner et al., 2010). Layers for mean annual
sea-surface salinity (SSS) and sea-surface temperature (SST)
were available at a resolution of 5 arc-minutes for the pres-
ent only, so we combined them with 30 arc-minute layers
from AquaMaps for sea ice concentration (SIC), mean dis-
tance to land (DL) and maximum depth (MD) (Table 1).
For the 2050 projection, only 30 arc-minute layers from
AquaMaps were used. Present-day datasets from AquaMaps
were built from long-term averages of temporally varying
environmental variables (Ready et al., 2010), whereas BioO-
racle layers were based on monthly level-3 pre-processed
satellite data from NASA (Tyberghein et al., 2012). For the
PD under 2050 climate conditions, the AquaMaps layers
were derived from the ECHAM5 A1B climate change sce-
nario (Jungclaus et al., 2006; IPCC et al., 2007).
To address the question of which environmental factors
mostly influence the distribution range of the grazers, we used
a jackknife leave-one-out procedure (Peterson et al., 2011)
based on area under the curve of a receiver operating charac-
teristic plot (AUC) values for SIC, SST and SSS for the Baltic
and the known distribution area of the species (Table 2). In
this procedure, for each environmental variable a model was
created without it, and then model assessments were com-
pared across the different layer sets. The most influential vari-
able was considered the one that, when not included in the
model, produced the lowest assessment value.
Occurrence point filtering
Occurrence data were filtered for environmentally unique
points by running an initial BioClim workflow also based on
the openModeller web service, using the same environmen-
tal layers as in the ENM workflow. This procedure avoids
passing redundant information to niche modelling algo-
rithms later. Besides filtering the points, the workflow gener-
ated a BioClim model (Busby, 1986; Nix, 1986) to calculate
the environmental range for each variable (Table 3). The
Figure 1 Study area of the meso-grazer guild. Mean sea-surfacesalinity values show the characteristic salinity gradient of theBaltic Sea. psu = practical salinity unit.
ª 2014 The Authors. Journal of BiogeographyPublished by John Wiley & Sons Ltd.
3
Ecological niche modelling for a guild of meso-grazers
EBVclass• SpeciesabundanceDatatype• monitoringdata,basedondetailed
andoYenharmonizedprotocolsThestudyregion• differenthydrologicalcondi&ons• strongsalinitygradientSpa&allevel• Regional(Bal&c)• Sub-regional(KaAegaA-Skagerrak,
Bal&cProper,UpperBothnianBay,LowerBothnianBay)
Bal&cEBVtestcase

Weusedthesedataandanalysedabundancetrendsacrossspaceand&me.

Thedataset- 26monitoringsta&ons- 1979-2013- 4sub-regions- 60,511observa&onrecords

Samplingvarianceacross&me(no.ofsamples/yr)
LowerBothnianBay UpperBothnianBay
● ● ● ● ● ● ● ● ● ● ● ● ● ●
● ● ● ● ●
●
●
●
● ● ● ●
●
● ● ● ●
●
● ●
1980 1985 1990 1995 2000 2005 2010
05
1015
2025
30
B3
year
no o
f sam
ples
● ● ● ● ● ● ● ● ● ● ● ● ● ●
● ● ● ●
●
●
● ● ● ● ● ● ●
●
● ● ●
● ● ●
1980 1985 1990 1995 2000 2005 2010
05
1015
2025
30
A13
year
no o
f sam
ples
● ● ● ● ● ● ● ● ● ● ● ● ● ● ● ●
●
● ● ● ● ● ● ● ● ● ●
●
●
●
●
●
●
●
1980 1985 1990 1995 2000 2005 2010
05
1015
2025
30
BY15
year
no o
f sam
ples
Bal&cProperKaAegaA/Skagerrak
● ● ● ● ● ● ● ● ● ● ● ● ● ● ● ● ● ● ● ● ● ● ● ● ● ● ●
●
●
●
●
●
●
●
1980 1985 1990 1995 2000 2005 2010
05
1015
2025
30
A17
year
no o
f sam
ples

Samplingvarianceacrossseasons(no.ofsamples/month)
●
● ●
●
●
●
●
●
●
●
●
●
2 4 6 8 10 12
05
1015
2025
3035
A13
month
no o
f sam
ples
●
●
● ● ●
●
●
●
●
● ●
●
2 4 6 8 10 12
05
1015
2025
3035
A17
month
no o
f sam
ples
● ●
●
●
●
●
●
●
●
●
●
●
2 4 6 8 10 12
05
1015
2025
3035
B3
month
no o
f sam
ples
● ●
● ●
●
●
●
●
●
●
●
●
2 4 6 8 10 12
05
1015
2025
3035
BY15
month
no o
f sam
ples
UpperBothnianBay
Bal&cProperKaAegaA/Skagerrak
LowerBothnianBay

Overallsamlingday&me
Baltic
daytimenu
mbe
r of o
bser
vatio
ns0 5 10 15 20
010
0020
0030
0040
0050
0060
00
Almosthalfofthesamplesdidnothave&mestampsWethereforeincludedthediurnalvarianceintheabundancecalcula&ons,butcheckedthattherewasnosystema&cbiasinsamplingday&meacrosssta&ons

Annualvariance.Inordertobeabletocomparetrendsamongthesub-regions,wechosetoincludeonlydatafrom2006-2013.Seasonalvariance.Becauseoftheseasonalvaria&onwecomparedonlymeasurementsfromtheearlysummerandlumpedallabundancerecordsfromApril-July.Diurnalvariance.Weincludeddiurnalvariance.Depthvariance.Welumpedalldepthslices.Taxonomicvariance.WeusedtheWoRMStaxonomicnameservicetosynonymiseallspeciesnames.Lifehistoryvaria:on.Weonlyincludedadultlifestages.Visualisa:on.WeploAedboxplotsfromallabundancevalues(numberofindividuals/m3).
Summaryofdataprocessing

Replicates and depth slices. Field codes in the original dataset suggested that at some sites more than one replicate was taken. We standardized all measurements by dividing the abundance counts by the number of replicates. Taxonomic variance. Taxonomic inconsistencies were removed manually after inspecting the species abundances across stations. We used the World Register of Marine Species (WoRMS) taxonomic name service to synonymise all species names. Life history variation. The data set included both measurements of adult and non-adult stages (eggs, juveniles, larvae). We excluded all records of non-adult life stages from the analysis. Visualisation. We plotted boxplots from all abundance values (number of individuals/m3) during April-July at the stations in the sub-region for all years. The mean abundance values were connected in the graph with a line over the years 2007–2013. The same approach was used for creating boxplots for the entire region. Data storage. All input files, output files, R code, and geographic coordinates of the stations are stored at https://ecds.se/ under file identifier: ccc84507-49c1-43df-9887-97d2232bcb89 (https://ecds.se/dataset/calculating-essential-biodiversity-variables-for-species-population-abundance-in-the-baltic-sea). Table S1. Principal steps of the information supply chain to build Essential Biodiversity Variable (EBV) datasets as applied to the Baltic Sea zooplankton monitoring (BALTIC) dataset with indication of abundance records and taxa available for trend analysis.
Generic steps
Specific data processing steps applied to BALTIC
No. of abundance records
No. of taxa
Sampling (raw observations)
Assembly and integration of raw data from different plankton monitoring programs in the Baltic region
60,511 217
EBV-usable dataset
Taxonomic refinement and basic cleaning, e.g. making location and species names consistent
59,374 181
EBV-ready dataset
Cropping the dataset to relevant seasons and years
18,856 135
Derived & modelled EBV data
Cropping the dataset to comparable species observations with >100 measurements (no modelling)
7,067 33
Summary of workflows On the following pages we summarize how the mentioned projects (i.e., eBird, TEAM, LPI, and BALTIC) relate to the workflow steps presented in the main text.

2006 2009 2012
020
0060
0010
000
1400
0
Cyclopoida.indet.
year
abun
danc
e in
ind/
m3
2006 2009 2012
−1.0
−0.5
0.0
0.5
1.0
Eurytemora.affinis
year
abun
danc
e in
ind/
m3
2006 2009 2012
050
0010
000
1500
020
000
Eurytemora.indet.
year
abun
danc
e in
ind/
m3
2006 2009 2012
050
010
0015
0020
00
Evadne.nordmanni
year
abun
danc
e in
ind/
m3
2006 2009 2012
−1.0
−0.5
0.0
0.5
1.0
Gastropoda.indet.
year
abun
danc
e in
ind/
m3
2006 2009 2012
02
46
8
Harpacticoida.indet.
year
abun
danc
e in
ind/
m3
2006 2009 2012
010
0020
0030
0040
0050
0060
00
Keratella.quadrata
year
abun
danc
e in
ind/
m3
2006 2009 2012
−1.0
−0.5
0.0
0.5
1.0
Lamellibranchiata.indet.
year
abun
danc
e in
ind/
m3
2006 2009 2012
010
020
030
040
050
060
0
Cyclopoida.indet.
year
abun
danc
e in
ind/
m3
2006 2009 2012
020
4060
8010
0
Eurytemora.affinis
year
abun
danc
e in
ind/
m3
2006 2009 2012
050
0015
000
2500
035
000
Eurytemora.indet.
year
abun
danc
e in
ind/
m3
2006 2009 2012
010
0030
0050
0070
00
Evadne.nordmanni
year
abun
danc
e in
ind/
m3
2006 2009 2012
0.0
0.2
0.4
0.6
0.8
Gastropoda.indet.
year
abun
danc
e in
ind/
m3
2006 2009 2012
020
4060
80
Harpacticoida.indet.
year
abun
danc
e in
ind/
m3
2006 2009 2012
0e+0
02e
+04
4e+0
46e
+04
8e+0
41e
+05
Keratella.quadrata
year
abun
danc
e in
ind/
m3
2006 2009 2012
−1.0
−0.5
0.0
0.5
1.0
Lamellibranchiata.indet.
year
abun
danc
e in
ind/
m3
2007 2010 2012
020
040
060
080
0
Cyclopoida.indet.
year
abun
danc
e in
ind/
m3
2007 2010 2012
050
0010
000
1500
020
000
Eurytemora.affinis
year
abun
danc
e in
ind/
m3
2007 2010 2012
−1.0
−0.5
0.0
0.5
1.0
Eurytemora.indet.
year
abun
danc
e in
ind/
m3
2007 2010 2012
010
0020
0030
0040
0050
00
Evadne.nordmanni
year
abun
danc
e in
ind/
m3
2007 2010 2012
050
010
0015
00
Gastropoda.indet.
year
abun
danc
e in
ind/
m3
2007 2010 20120
500
1000
1500
Harpacticoida.indet.
year
abun
danc
e in
ind/
m3
2007 2010 2012
050
0010
000
1500
0
Keratella.quadrata
year
abun
danc
e in
ind/
m3
2007 2010 2012
020
0040
0060
0080
00
Lamellibranchiata.indet.
year
abun
danc
e in
ind/
m3
UpperBothnian
LowerBothnian
Bal&cProper
Bal&c
TrendsofincreasingabundanceCyclopoidasp.(Copepoda)
2006 2009 2012
020
0060
0010
000
1400
0Cyclopoida.indet.
year
abun
danc
e in
ind/
m3
2006 2009 2012
050
0010
000
1500
020
000
Eurytemora.affinis
year
abun
danc
e in
ind/
m3
2006 2009 2012
050
0015
000
2500
035
000
Eurytemora.indet.
year
abun
danc
e in
ind/
m3
2006 2009 2012
050
0010
000
1500
020
000
2500
0
Evadne.nordmanni
year
abun
danc
e in
ind/
m3
2006 2009 2012
050
0010
000
1500
020
000
2500
0
Gastropoda.indet.
year
abun
danc
e in
ind/
m3
2006 2009 2012
010
0020
0030
0040
0050
00
Harpacticoida.indet.
year
abun
danc
e in
ind/
m3
2006 2009 2012
0e+0
02e
+04
4e+0
46e
+04
8e+0
41e
+05
Keratella.quadrata
year
abun
danc
e in
ind/
m3
2006 2009 2012
020
0040
0060
0080
00
Lamellibranchiata.indet.
yearab
unda
nce
in in
d/m
3
2006 2009 2012
050
100
150
200
250
300
Cyclopoida.indet.
year
abun
danc
e in
ind/
m3
2006 2009 2012
−1.0
−0.5
0.0
0.5
1.0
Eurytemora.affinis
year
abun
danc
e in
ind/
m3
2006 2009 2012
05
1015
20
Eurytemora.indet.
year
abun
danc
e in
ind/
m3
2006 2009 2012
050
0010
000
1500
020
000
2500
0
Evadne.nordmanni
year
abun
danc
e in
ind/
m3
2006 2009 2012
050
0010
000
1500
020
000
2500
0
Gastropoda.indet.
year
abun
danc
e in
ind/
m3
2006 2009 2012
010
0020
0030
0040
0050
00
Harpacticoida.indet.
year
abun
danc
e in
ind/
m3
2006 2009 2012
010
020
030
040
050
0
Keratella.quadrata
year
abun
danc
e in
ind/
m3
2006 2009 2012
−1.0
−0.5
0.0
0.5
1.0
Lamellibranchiata.indet.
year
abun
danc
e in
ind/
m3
KaAegat/Skagerrak
2006 2009 2012
020
0060
0010
000
1400
0
Cyclopoida.indet.
year
abun
danc
e in
ind/
m3
2006 2009 2012
050
0010
000
1500
020
000
Eurytemora.affinis
year
abun
danc
e in
ind/
m3
2006 2009 2012
050
0015
000
2500
035
000
Eurytemora.indet.
year
abun
danc
e in
ind/
m3
2006 2009 2012
050
0010
000
1500
020
000
2500
0
Evadne.nordmanni
year
abun
danc
e in
ind/
m3
2006 2009 2012
050
0010
000
1500
020
000
2500
0
Gastropoda.indet.
year
abun
danc
e in
ind/
m3
2006 2009 2012
010
0020
0030
0040
0050
00
Harpacticoida.indet.
year
abun
danc
e in
ind/
m3
2006 2009 2012
0e+0
02e
+04
4e+0
46e
+04
8e+0
41e
+05
Keratella.quadrata
year
abun
danc
e in
ind/
m3
2006 2009 2012
020
0040
0060
0080
00
Lamellibranchiata.indet.
year
abun
danc
e in
ind/
m3
2006 2009 2012
020
0060
0010
000
1400
0
Cyclopoida.indet.
year
abun
danc
e in
ind/
m3
2006 2009 2012
050
0010
000
1500
020
000
Eurytemora.affinis
year
abun
danc
e in
ind/
m3
2006 2009 2012
050
0015
000
2500
035
000
Eurytemora.indet.
year
abun
danc
e in
ind/
m3
2006 2009 2012
050
0010
000
1500
020
000
2500
0
Evadne.nordmanni
year
abun
danc
e in
ind/
m3
2006 2009 2012
050
0010
000
1500
020
000
2500
0
Gastropoda.indet.
year
abun
danc
e in
ind/
m3
2006 2009 2012
010
0020
0030
0040
0050
00
Harpacticoida.indet.
year
abun
danc
e in
ind/
m3
2006 2009 2012
0e+0
02e
+04
4e+0
46e
+04
8e+0
41e
+05
Keratella.quadrata
year
abun
danc
e in
ind/
m3
2006 2009 2012
020
0040
0060
0080
00
Lamellibranchiata.indet.
year
abun
danc
e in
ind/
m3
Cyclopoidcopepod.Source:Wikipedia

KaAegat/Skagerrak
TrendsofdecreasingabundanceHarpac&coidscopedopds
2006 2009 2012
050
100
150
200
250
300
Cyclopoida.indet.
year
abun
danc
e in
ind/
m3
2006 2009 2012
−1.0
−0.5
0.0
0.5
1.0
Eurytemora.affinis
year
abun
danc
e in
ind/
m3
2006 2009 2012
05
1015
20
Eurytemora.indet.
year
abun
danc
e in
ind/
m3
2006 2009 2012
050
0010
000
1500
020
000
2500
0
Evadne.nordmanni
year
abun
danc
e in
ind/
m3
2006 2009 2012
050
0010
000
1500
020
000
2500
0
Gastropoda.indet.
year
abun
danc
e in
ind/
m3
2006 2009 2012
010
0020
0030
0040
0050
00
Harpacticoida.indet.
year
abun
danc
e in
ind/
m3
2006 2009 2012
010
020
030
040
050
0
Keratella.quadrata
year
abun
danc
e in
ind/
m3
2006 2009 2012
−1.0
−0.5
0.0
0.5
1.0
Lamellibranchiata.indet.
year
abun
danc
e in
ind/
m3
2006 2009 2012
020
0060
0010
000
1400
0
Cyclopoida.indet.
year
abun
danc
e in
ind/
m3
2006 2009 2012
−1.0
−0.5
0.0
0.5
1.0
Eurytemora.affinis
year
abun
danc
e in
ind/
m3
2006 2009 2012
050
0010
000
1500
020
000
Eurytemora.indet.
year
abun
danc
e in
ind/
m3
2006 2009 2012
050
010
0015
0020
00
Evadne.nordmanni
year
abun
danc
e in
ind/
m3
2006 2009 2012
−1.0
−0.5
0.0
0.5
1.0
Gastropoda.indet.
year
abun
danc
e in
ind/
m3
2006 2009 2012
02
46
8
Harpacticoida.indet.
year
abun
danc
e in
ind/
m3
2006 2009 2012
010
0020
0030
0040
0050
0060
00
Keratella.quadrata
year
abun
danc
e in
ind/
m3
2006 2009 2012
−1.0
−0.5
0.0
0.5
1.0
Lamellibranchiata.indet.
year
abun
danc
e in
ind/
m3
2006 2009 2012
010
020
030
040
050
060
0
Cyclopoida.indet.
year
abun
danc
e in
ind/
m3
2006 2009 2012
020
4060
8010
0
Eurytemora.affinis
year
abun
danc
e in
ind/
m3
2006 2009 2012
050
0015
000
2500
035
000
Eurytemora.indet.
year
abun
danc
e in
ind/
m3
2006 2009 2012
010
0030
0050
0070
00
Evadne.nordmanni
year
abun
danc
e in
ind/
m3
2006 2009 2012
0.0
0.2
0.4
0.6
0.8
Gastropoda.indet.
year
abun
danc
e in
ind/
m3
2006 2009 2012
020
4060
80
Harpacticoida.indet.
year
abun
danc
e in
ind/
m3
2006 2009 2012
0e+0
02e
+04
4e+0
46e
+04
8e+0
41e
+05
Keratella.quadrata
year
abun
danc
e in
ind/
m3
2006 2009 2012
−1.0
−0.5
0.0
0.5
1.0
Lamellibranchiata.indet.
year
abun
danc
e in
ind/
m3
2007 2010 2012
020
040
060
080
0
Cyclopoida.indet.
year
abun
danc
e in
ind/
m3
2007 2010 2012
050
0010
000
1500
020
000
Eurytemora.affinis
year
abun
danc
e in
ind/
m3
2007 2010 2012
−1.0
−0.5
0.0
0.5
1.0
Eurytemora.indet.
year
abun
danc
e in
ind/
m3
2007 2010 2012
010
0020
0030
0040
0050
00
Evadne.nordmanni
year
abun
danc
e in
ind/
m3
2007 2010 2012
050
010
0015
00
Gastropoda.indet.
year
abun
danc
e in
ind/
m3
2007 2010 2012
050
010
0015
00
Harpacticoida.indet.
year
abun
danc
e in
ind/
m3
2007 2010 2012
050
0010
000
1500
0
Keratella.quadrata
year
abun
danc
e in
ind/
m3
2007 2010 2012
020
0040
0060
0080
00
Lamellibranchiata.indet.
year
abun
danc
e in
ind/
m3
UpperBothnian
LowerBothnian
Bal&cProper
Harpac:coidcopepod.Source:wikipedia
2006 2009 2012
020
0060
0010
000
1400
0
Cyclopoida.indet.
year
abun
danc
e in
ind/
m3
2006 2009 2012
050
0010
000
1500
020
000
Eurytemora.affinis
yearab
unda
nce
in in
d/m
3
2006 2009 2012
050
0015
000
2500
035
000
Eurytemora.indet.
year
abun
danc
e in
ind/
m3
2006 2009 2012
050
0010
000
1500
020
000
2500
0
Evadne.nordmanni
year
abun
danc
e in
ind/
m3
2006 2009 2012
050
0010
000
1500
020
000
2500
0
Gastropoda.indet.
year
abun
danc
e in
ind/
m3
2006 2009 2012
010
0020
0030
0040
0050
00Harpacticoida.indet.
year
abun
danc
e in
ind/
m3
2006 2009 2012
0e+0
02e
+04
4e+0
46e
+04
8e+0
41e
+05
Keratella.quadrata
year
abun
danc
e in
ind/
m3
2006 2009 2012
020
0040
0060
0080
00
Lamellibranchiata.indet.
year
abun
danc
e in
ind/
m3
Bal&c

LowerBothnian
Bal&cProperKaAegat/Skagerrak
RegionalvssubregionaltrendsLimnocalanusmacrurus(Copepoda)
2006 2009 2012
050
010
0015
00
Limnocalanus.macrurus
year
abun
danc
e in
ind/
m3
2006 2009 2012
−1.0
−0.5
0.0
0.5
1.0
Oithona.indet.
year
abun
danc
e in
ind/
m3
2006 2009 2012
020
040
060
080
010
00
Podon.polyphemoides
year
abun
danc
e in
ind/
m3
2006 2009 2012
−1.0
−0.5
0.0
0.5
1.0
Pseudocalanus.elongatus
year
abun
danc
e in
ind/
m3
2006 2009 2012
−1.0
−0.5
0.0
0.5
1.0
Pseudocalanus.indet.
year
abun
danc
e in
ind/
m3
2006 2009 2012
020
0040
0060
0080
00
Synchaeta.indet.
year
abun
danc
e in
ind/
m3
2006 2009 2012
−1.0
−0.5
0.0
0.5
1.0
Temora.longicornis
year
abun
danc
e in
ind/
m3
2006 2009 2012
050
010
0015
0020
0025
00
Limnocalanus.macrurus
year
abun
danc
e in
ind/
m3
2006 2009 2012
−1.0
−0.5
0.0
0.5
1.0
Oithona.indet.
year
abun
danc
e in
ind/
m3
2006 2009 2012
050
0010
000
1500
0
Podon.polyphemoides
year
abun
danc
e in
ind/
m3
2006 2009 2012
−1.0
−0.5
0.0
0.5
1.0
Pseudocalanus.elongatus
year
abun
danc
e in
ind/
m3
2006 2009 2012
−1.0
−0.5
0.0
0.5
1.0
Pseudocalanus.indet.
year
abun
danc
e in
ind/
m3
2006 2009 2012
020
000
4000
060
000
Synchaeta.indet.
year
abun
danc
e in
ind/
m3
2006 2009 2012
−1.0
−0.5
0.0
0.5
1.0
Temora.longicornis
year
abun
danc
e in
ind/
m3
2007 2010 2012
050
010
0015
0020
0025
00
Limnocalanus.macrurus
year
abun
danc
e in
ind/
m3
2007 2010 2012
−1.0
−0.5
0.0
0.5
1.0
Oithona.indet.
year
abun
danc
e in
ind/
m3
2007 2010 2012
020
0040
0060
0080
00
Podon.polyphemoides
year
abun
danc
e in
ind/
m3
2007 2010 2012
010
000
2000
030
000
Pseudocalanus.elongatus
year
abun
danc
e in
ind/
m3
2007 2010 2012
−1.0
−0.5
0.0
0.5
1.0
Pseudocalanus.indet.
year
abun
danc
e in
ind/
m3
2007 2010 20120
5000
010
0000
1500
00
Synchaeta.indet.
year
abun
danc
e in
ind/
m3
2007 2010 2012
010
000
3000
050
000
Temora.longicornis
year
abun
danc
e in
ind/
m3
2006 2009 2012
−1.0
−0.5
0.0
0.5
1.0
Limnocalanus.macrurus
year
abun
danc
e in
ind/
m3
2006 2009 2012
0e+0
01e
+05
2e+0
53e
+05
4e+0
5
Oithona.indet.
year
abun
danc
e in
ind/
m3
2006 2009 2012
−1.0
−0.5
0.0
0.5
1.0
Podon.polyphemoides
year
abun
danc
e in
ind/
m3
2006 2009 2012
−1.0
−0.5
0.0
0.5
1.0
Pseudocalanus.elongatus
year
abun
danc
e in
ind/
m3
2006 2009 2012
050
000
1500
0025
0000
Pseudocalanus.indet.
year
abun
danc
e in
ind/
m3
2006 2009 2012
010
000
3000
050
000
Synchaeta.indet.
year
abun
danc
e in
ind/
m3
2006 2009 2012
050
0010
000
1500
020
000
Temora.longicornis
year
abun
danc
e in
ind/
m3
UpperBothnian
Sub-regionaltrendsinUpper&LowerBothnianBaydissapearonaregionalscale.
2006 2009 2012
050
010
0015
0020
0025
00
Limnocalanus.macrurus
year
abun
danc
e in
ind/
m3
2006 2009 2012
0e+0
01e
+05
2e+0
53e
+05
4e+0
5
Oithona.indet.
year
abun
danc
e in
ind/
m3
2006 2009 2012
050
0010
000
1500
0
Podon.polyphemoides
year
abun
danc
e in
ind/
m3
2006 2009 2012
010
000
2000
030
000
Pseudocalanus.elongatus
year
abun
danc
e in
ind/
m3
2006 2009 2012
050
000
1500
0025
0000
Pseudocalanus.indet.
year
abun
danc
e in
ind/
m3
2006 2009 2012
050
000
1000
0015
0000
Synchaeta.indet.
year
abun
danc
e in
ind/
m3
2006 2009 2012
010
000
3000
050
000
Temora.longicornis
year
abun
danc
e in
ind/
m3
Limnocalanusmacrurus.Source:hAp://ci.unh.edu
Bal&c

2006 2009 2012
050
0010
000
1500
0
Acartia bifilosa
year
abun
danc
e in
ind/
m3
2006 2009 2012
050
0010
000
2000
0
Acartia.indet.
year
abun
danc
e in
ind/
m3
2006 2009 20120
2000
6000
1000
014
000
Acartia.longiremis
year
abun
danc
e in
ind/
m3
2006 2009 2012
010
0030
0050
00
Appendicularia.indet.
year
abun
danc
e in
ind/
m3
2006 2009 2012
020
000
6000
010
0000
1400
00
Bivalvia.indet.
year
abun
danc
e in
ind/
m3
2006 2009 2012
010
000
3000
050
000
Bosmina..Eubosmina..coregoni.maritima
year
abun
danc
e in
ind/
m3
2006 2009 2012
050
0010
000
1500
0
Centropages.hamatus
year
abun
danc
e in
ind/
m3
2006 2009 2012
0e+0
01e
+05
2e+0
53e
+05
Copepoda.indet.
year
abun
danc
e in
ind/
m3
2006 2009 2012
02
46
8
Acartia.bifilosa
year
abun
danc
e in
ind/
m3
2006 2009 2012
050
100
150
Acartia.indet.
year
abun
danc
e in
ind/
m3
2006 2009 2012
−1.0
−0.5
0.0
0.5
1.0
Acartia.longiremis
year
abun
danc
e in
ind/
m3
2006 2009 2012
−1.0
−0.5
0.0
0.5
1.0
Appendicularia.indet.
year
abun
danc
e in
ind/
m3
2006 2009 2012
010
2030
Bivalvia.indet.
year
abun
danc
e in
ind/
m3
2006 2009 2012
010
000
3000
050
000
Bosmina..Eubosmina..coregoni.maritima
year
abun
danc
e in
ind/
m3
2006 2009 2012
−1.0
−0.5
0.0
0.5
1.0
Centropages.hamatus
year
abun
danc
e in
ind/
m3
2006 2009 2012
01
23
45
6
Copepoda.indet.
year
abun
danc
e in
ind/
m3
2006 2009 2012
010
0020
0030
0040
0050
00
Acartia.bifilosa
year
abun
danc
e in
ind/
m3
2006 2009 2012
020
0040
0060
0080
00
Acartia.indet.
year
abun
danc
e in
ind/
m3
2006 2009 2012
0.0
0.2
0.4
0.6
0.8
1.0
1.2
Acartia.longiremis
year
abun
danc
e in
ind/
m3
2006 2009 2012
−1.0
−0.5
0.0
0.5
1.0
Appendicularia.indet.
year
abun
danc
e in
ind/
m3
2006 2009 2012
050
0010
000
1500
0
Bivalvia.indet.
year
abun
danc
e in
ind/
m3
2006 2009 2012
050
0010
000
2000
0
Bosmina..Eubosmina..coregoni.maritima
year
abun
danc
e in
ind/
m3
2006 2009 2012
−1.0
−0.5
0.0
0.5
1.0
Centropages.hamatus
year
abun
danc
e in
ind/
m3
2006 2009 2012
010
2030
4050
Copepoda.indet.
year
abun
danc
e in
ind/
m3
2007 2010 2012
050
0010
000
1500
0
Acartia.bifilosa
year
abun
danc
e in
ind/
m3
2007 2010 2012
050
0010
000
2000
0
Acartia.indet.
year
abun
danc
e in
ind/
m3
2007 2010 2012
020
0060
0010
000
1400
0
Acartia.longiremis
year
abun
danc
e in
ind/
m3
2007 2010 2012
010
0030
0050
00
Appendicularia.indet.
year
abun
danc
e in
ind/
m3
2007 2010 2012
−1.0
−0.5
0.0
0.5
1.0
Bivalvia.indet.
year
abun
danc
e in
ind/
m3
2007 2010 2012
−1.0
−0.5
0.0
0.5
1.0
Bosmina..Eubosmina..coregoni.maritima
year
abun
danc
e in
ind/
m3
2007 2010 2012
050
0010
000
1500
0
Centropages.hamatus
year
abun
danc
e in
ind/
m3
2007 2010 2012
−1.0
−0.5
0.0
0.5
1.0
Copepoda.indet.
year
abun
danc
e in
ind/
m3
2006 2009 2012
050
010
0015
0020
0025
0030
00
Acartia.bifilosa
year
abun
danc
e in
ind/
m3
2006 2009 2012
050
0010
000
1500
020
000
2500
0
Acartia.indet.
year
abun
danc
e in
ind/
m3
2006 2009 2012
010
0020
0030
0040
00
Acartia.longiremis
year
abun
danc
e in
ind/
m3
2006 2009 2012
020
040
060
080
010
00
Appendicularia.indet.
year
abun
danc
e in
ind/
m3
2006 2009 2012
020
000
6000
010
0000
1400
00
Bivalvia.indet.
year
abun
danc
e in
ind/
m3
2006 2009 2012
−1.0
−0.5
0.0
0.5
1.0
Bosmina..Eubosmina..coregoni.maritima
year
abun
danc
e in
ind/
m3
2006 2009 2012
010
0030
0050
0070
00
Centropages.hamatus
year
abun
danc
e in
ind/
m3
2006 2009 2012
0e+0
01e
+05
2e+0
53e
+05
Copepoda.indet.
year
abun
danc
e in
ind/
m3
TaxonomicproblemsAcar&aspp.
Acar:alongiremis.Source:Arc:cOceanDiversity
UpperBothnian
LowerBothnian
Bal&cProper
KaAegat/Skagerrak
A.bifilosa A.longiremisA.indet.
A.bifilosa A.longiremisA.indet.
Bal&c

2006 2009 2012
050
0010
000
1500
0
Acartia bifilosa
year
abun
danc
e in
ind/
m3
2006 2009 2012
050
0010
000
2000
0
Acartia.indet.
year
abun
danc
e in
ind/
m3
2006 2009 2012
020
0060
0010
000
1400
0
Acartia.longiremis
year
abun
danc
e in
ind/
m3
2006 2009 2012
010
0030
0050
00
Appendicularia.indet.
year
abun
danc
e in
ind/
m3
2006 2009 2012
020
000
6000
010
0000
1400
00
Bivalvia.indet.
year
abun
danc
e in
ind/
m3
2006 2009 2012
010
000
3000
050
000
Bosmina..Eubosmina..coregoni.maritima
year
abun
danc
e in
ind/
m3
2006 2009 2012
050
0010
000
1500
0
Centropages.hamatus
year
abun
danc
e in
ind/
m3
2006 2009 2012
0e+0
01e
+05
2e+0
53e
+05
Copepoda.indet.
year
abun
danc
e in
ind/
m3
2006 2009 2012
02
46
8
Acartia.bifilosa
year
abun
danc
e in
ind/
m3
2006 2009 2012
050
100
150
Acartia.indet.
year
abun
danc
e in
ind/
m3
2006 2009 2012
−1.0
−0.5
0.0
0.5
1.0
Acartia.longiremis
year
abun
danc
e in
ind/
m3
2006 2009 2012
−1.0
−0.5
0.0
0.5
1.0
Appendicularia.indet.
year
abun
danc
e in
ind/
m3
2006 2009 2012
010
2030
Bivalvia.indet.
year
abun
danc
e in
ind/
m3
2006 2009 2012
010
000
3000
050
000
Bosmina..Eubosmina..coregoni.maritima
yearab
unda
nce
in in
d/m
3
2006 2009 2012
−1.0
−0.5
0.0
0.5
1.0
Centropages.hamatus
year
abun
danc
e in
ind/
m3
2006 2009 2012
01
23
45
6
Copepoda.indet.
year
abun
danc
e in
ind/
m3
2006 2009 2012
010
0020
0030
0040
0050
00
Acartia.bifilosa
year
abun
danc
e in
ind/
m3
2006 2009 2012
020
0040
0060
0080
00
Acartia.indet.
yearab
unda
nce
in in
d/m
32006 2009 2012
0.0
0.2
0.4
0.6
0.8
1.0
1.2
Acartia.longiremis
year
abun
danc
e in
ind/
m3
2006 2009 2012
−1.0
−0.5
0.0
0.5
1.0
Appendicularia.indet.
year
abun
danc
e in
ind/
m3
2006 2009 2012
050
0010
000
1500
0
Bivalvia.indet.
year
abun
danc
e in
ind/
m3
2006 2009 2012
050
0010
000
2000
0Bosmina..Eubosmina..coregoni.maritima
year
abun
danc
e in
ind/
m3
2006 2009 2012
−1.0
−0.5
0.0
0.5
1.0
Centropages.hamatus
year
abun
danc
e in
ind/
m3
2006 2009 2012
010
2030
4050
Copepoda.indet.
year
abun
danc
e in
ind/
m3
2007 2010 2012
050
0010
000
1500
0
Acartia.bifilosa
year
abun
danc
e in
ind/
m3
2007 2010 2012
050
0010
000
2000
0
Acartia.indet.
year
abun
danc
e in
ind/
m3
2007 2010 2012
020
0060
0010
000
1400
0
Acartia.longiremis
year
abun
danc
e in
ind/
m3
2007 2010 2012
010
0030
0050
00
Appendicularia.indet.
year
abun
danc
e in
ind/
m3
2007 2010 2012
−1.0
−0.5
0.0
0.5
1.0
Bivalvia.indet.
year
abun
danc
e in
ind/
m3
2007 2010 2012
−1.0
−0.5
0.0
0.5
1.0
Bosmina..Eubosmina..coregoni.maritima
year
abun
danc
e in
ind/
m3
2007 2010 2012
050
0010
000
1500
0
Centropages.hamatus
year
abun
danc
e in
ind/
m3
2007 2010 2012
−1.0
−0.5
0.0
0.5
1.0
Copepoda.indet.
year
abun
danc
e in
ind/
m3
2006 2009 2012
050
010
0015
0020
0025
0030
00
Acartia.bifilosa
year
abun
danc
e in
ind/
m3
2006 2009 2012
050
0010
000
1500
020
000
2500
0
Acartia.indet.
year
abun
danc
e in
ind/
m3
2006 2009 2012
010
0020
0030
0040
00
Acartia.longiremis
year
abun
danc
e in
ind/
m3
2006 2009 2012
020
040
060
080
010
00
Appendicularia.indet.
year
abun
danc
e in
ind/
m3
2006 2009 2012
020
000
6000
010
0000
1400
00
Bivalvia.indet.
year
abun
danc
e in
ind/
m3
2006 2009 2012
−1.0
−0.5
0.0
0.5
1.0
Bosmina..Eubosmina..coregoni.maritima
year
abun
danc
e in
ind/
m3
2006 2009 2012
010
0030
0050
0070
00
Centropages.hamatus
year
abun
danc
e in
ind/
m3
2006 2009 2012
0e+0
01e
+05
2e+0
53e
+05
Copepoda.indet.
year
abun
danc
e in
ind/
m3
UpperBothnian
LowerBothnian
Bal&cProperKaAegat/Skagerrak
Taxawithvaryingcoun;ngeffortamongsta;onsAppendiculariaspp.
2006 2009 2012
050
0010
000
1500
0
Acartia bifilosa
year
abun
danc
e in
ind/
m3
2006 2009 2012
050
0010
000
2000
0
Acartia.indet.
year
abun
danc
e in
ind/
m3
2006 2009 2012
020
0060
0010
000
1400
0
Acartia.longiremis
year
abun
danc
e in
ind/
m3
2006 2009 2012
010
0030
0050
00
Appendicularia.indet.
year
abun
danc
e in
ind/
m3
2006 2009 2012
020
000
6000
010
0000
1400
00
Bivalvia.indet.
year
abun
danc
e in
ind/
m3
2006 2009 2012
010
000
3000
050
000
Bosmina..Eubosmina..coregoni.maritima
year
abun
danc
e in
ind/
m3
2006 2009 2012
050
0010
000
1500
0
Centropages.hamatus
year
abun
danc
e in
ind/
m3
2006 2009 2012
0e+0
01e
+05
2e+0
53e
+05
Copepoda.indet.
year
abun
danc
e in
ind/
m3
JuvenileAppendicularian.Source:scripps.ucsd.edu
Bal&c

Results&Conclusion
• InprincipleitispossibletoobtainEBVdataproductsfromaggregatedmarinedatasets,butonlyforafewabundantandtypicalindicatorspecies
• MonitoringdataareneithersufficientnorconsistentenoughtocalculateEBVsforrarespecies,specieswithtaxonomicuncertain&es,andspeciesrequiringspecialistsforiden&fica&on
• WiththecurrentlyavailabledataEBV’smayonlybecalculatedforfewwell-
recognisedandabundantspecies.
• EBVsneedtobecalculatedatseveralspa&alscalessimultaneously,becausedifferentsub-regionaltrendsmaycounteractanotheronahigherspa&allevel.
• amajorproblemisthelack&inconsistencyofbasictaxonomicknowledgeacrossspaceand&me,makingaggregateddatasetslesscomparable.
• Itisworthtoretroac&velyimprovedocumenta&onandmetadataformonitoringmeasurements(e.g.add&mestamps).ThiswillenhancethequalityofEBVs.
For Review Only
Page 1
Figure 5 1737
1738
Page 62 of 67Biological Reviews
123456789101112131415161718192021222324252627282930313233343536373839404142434445464748495051525354555657585960
Kisslingetal(2017)Buildingessen&albiodiversityvariables(EBVs)ofspeciesdistribu&onandabundanceataglobalscale.BiologicalReviews.InReview.
Canwecalculatetrendswiththedatacollec&onmethodsweusetoday?
No, we need to implement new methods & technologies for data collection

Thank you for your attention!