calbee group financial results...march 2009 march 2010 march 2011 march 2012 march 2013 sales +...
TRANSCRIPT

0Copyright © 2012 CALBEE, Inc. All rights reserved.
Calbee Group Financial Results for the fiscal
year ended March 31, 2012
April 1, 2011 ー
March 31, 2012
May 8, 2012

Copyright © 2012 CALBEE, Inc. All rights reserved.
Calbee Group’s Growth Strategies
Akira Matsumoto
Chairman of the Board & CEO

2Copyright © 2012 CALBEE, Inc. All rights reserved.
March 11, 2011: New beginnings
Listed on the first section of the Tokyo Stock
Exchange
The Great East Japan Earthquake

3Copyright © 2012 CALBEE, Inc. All rights reserved.
Strategy for continued growth and high
profitability
1. Expand overseas business
2. Develop new products
3. Expand domestic market share
4. Strengthen alliance with PepsiCo.
5. Pursue licensing and acquisition
6. Develop new businesses

4Copyright © 2012 CALBEE, Inc. All rights reserved.
Expanding overseas business
Phase Ⅰ
Phase Ⅱ(April 2012 , Begin
formulating strategies )
Phase Ⅲ(April 2014, Begin
formulating strategies)
Aiming to be a global company
with an overseas sales ratio over 30%

5Copyright © 2012 CALBEE, Inc. All rights reserved.
Key success factors
Costs
Partners
Localization

6Copyright © 2012 CALBEE, Inc. All rights reserved.
Business development in China
Promote JV,supply materials
Establish JV company with Master Kong Instant Foods
and Itochu in July 2012
Targeting net sales of 50 billion yen and an operating margin of
over 10% by March 2018
New product development,
production and marketing
Marketing, sales and
supply of materials

7Copyright © 2012 CALBEE, Inc. All rights reserved.
Business development in North America
Start preparing for the sales of Jagabee
from April 2013
■
Begin constrcution
of Jagabee plant
US$26 million capital expenditure
■
Confirm sales strategy
Partners
Product design

8Copyright © 2012 CALBEE, Inc. All rights reserved.
Business development in Asia
Hong Kong
Established JV company with Four Seas in 1994
No. 1 market share in Hong Kong
Achieved further growth
Thailand
Entered in 1980
Increased investment in 2010
Strengthened business development through Calbee's
leadership
South
Korea
Established JV company with HAITAI Confectionary & Foods in July 2011Launched sales of Jagabee, January 2012Aiming to expanded sales
Taiwan
Established alliance with Lian
Hwa
Foods
in 2002
Ended contract in June 2011
Aiming to redevelop business
9Copyright © 2012 CALBEE, Inc. All rights reserved.
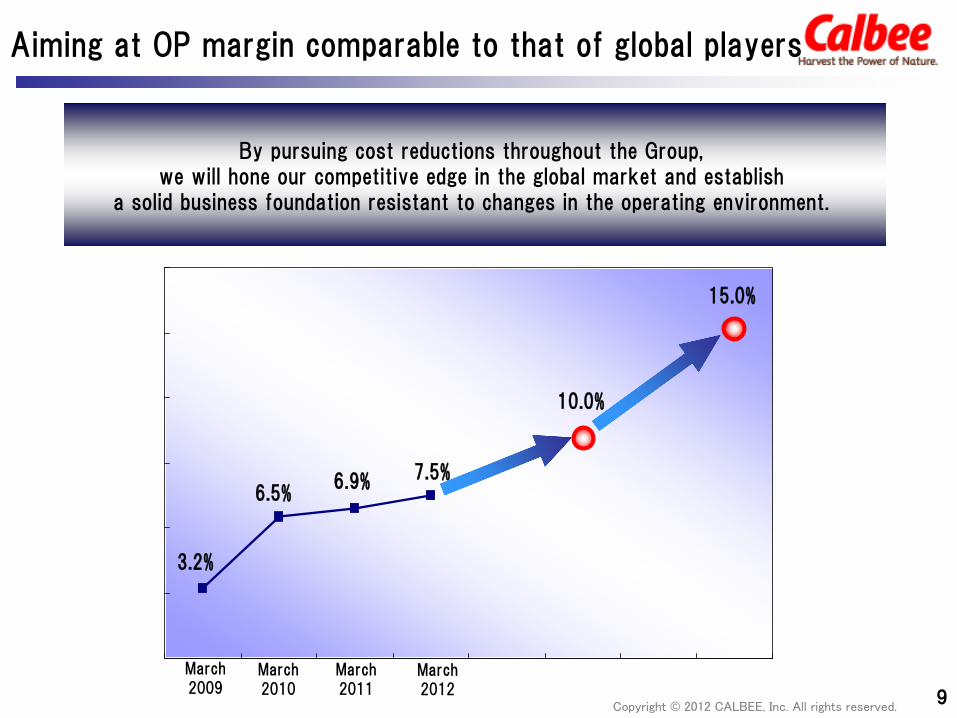
15.0%
10.0%
7.5%6.9%6.5%
3.2%
0.0%
3.0%
6.0%
9.0%
12.0%
15.0%
18.0%
March 2008 March 2009 March 2010 March 2011
Aiming at OP margin comparable to that of global players
By pursuing cost reductions throughout the Group, we will hone our competitive edge in the global market and establish
a solid business foundation resistant to changes in the operating environment.
March 2011
March 2012
March 2009
March 2010

Copyright © 2012 CALBEE, Inc. All rights reserved.
Review of fiscal year ended March 2012 Management Policy for fiscal year ending March 2013
Shuji
Ito
President & COO

11Copyright © 2012 CALBEE, Inc. All rights reserved.
Outcomes
■
Further expand domestic market share
■
Expand overseas business
■
Grow sales of new products, Vegips, etc.
■
Achieve further cost reductions
FY to March 31, 2012 overview and future plans
Initiatives going forward
■
Expanded domestic market share
・
Grew Potato Chips market share: (prior period) 62.5% →(current) 63.2%
→
Grew confectionary market share: 48.9% (up 0.4% percentage
points Y-on-Y)
■
Cost reductions
・
COGS (target) 58.7%
→(actual) 57.7%
Source: Intage
SRI; nationwide retail sales Prior period: 2010/4~2011/3
Current period: 2011/4~2012/3Confectionary market share: Total of Calbee and Japan Frito-Lay

12Copyright © 2012 CALBEE, Inc. All rights reserved.
FY 2011 FY 2012Change
In %
Comparison
with plan
Net Sales
Million Yen
155,529
Million Yen
163,268
%
+ 5.0
%
102.0
Gross Profit 65,047 69,081 + 6.2 104.5
SG&A 54,329 56,833 + 4.6 103.1
Selling 20,180 21,590 +7.0 106.7
Distribution 11,372 12,171 +7.0 103.1
Labor 14,536 15,183 +4.5 100.8
Others 8,240 7,888 △4.3 98.6
Operating
income10,717 12,247 +14.3 111.3
Ordinary
income10,570 12,486 +18.1 117.8
Extraodinary
income /loss
△2,238 448 ー 754.3
Net Profit 4,253 7,096 +66.8 118.3
FY2012: Financial highlights
Renewed records for sales and income
Net salesDriven by potato-based snacks, new products (Vegips) and overseassales
Gross profitImproved profit ratio by 0.5% fromeffects of cost reductions
SG&AActive investment in sellingexpenses aiming to expand marketshare
Other expenses reduced through costreductions
Extraordinary income (loss)Loss of disaster of 2,162 million yenrecorded in previous term

13Copyright © 2012 CALBEE, Inc. All rights reserved.
■
Potato-based snacks
JagaricoBig hit with limited-period product
Salted cod roe & Butter flavor
■
Flour-based snacks
Sales growth through product renewals and newly developed flavors
■
New products
Strong sales of Vegips
→
Expanded regional sales
■ OverseasStrong sales in South Korea, North America and Thailand
FY2012: Factors increasing sales
80.0%
90.0%
100.0%
110.0%
120.0%
1Q 2Q 3Q 4Q
■
Items of increasing sales
Sales + 7,739
Jagarico + 1,556
Patato-based snacks + 1,599
Flour,Corn
based Snacks + 990
New products (Vegips, etc.) + 1,175
Overseas + 2,081
Bread/Cereals + 1,174
Others + 717
Million yen
Market growth
■
Y-on-Y change in consolidated sales
Y-onY
Calbee consolidated sales
Source: Intage
SRI (All Domestic Industry Sectors) Basis: Sales

14Copyright © 2012 CALBEE, Inc. All rights reserved.
Million Yen
↑3,236
↓799
↓1,409↑351
↑797
↓646
Higher selling expenses
Higher distribution
Higher Labor 12,247
Others
Positive impact
Negative impact
10,717
Lowercosts
Higher sales
FY ended March 2011
FY ended March 2012
Increased costs of raw materials
↓1,290
Cost reductions from central purchasing ↑1,001
Reduction of depreciation expense ↑
291
Utilization ratio improvements ↑
795
FY2012: Factors increasing operating income

15Copyright © 2012 CALBEE, Inc. All rights reserved.
Quarterly results for the year ended
March 2012
43,25544,028
40,294
35,690
3,578
4,775
2,508
1,384
8.3
10.8
6.2
3.9
0
10,000
20,000
30,000
40,000
50,000
1st Quarter 2nd Quarter 3rd Quarter 4rd Quarter
0
2
4
6
8
10
12
14Sales
Operating income
Operating income ratio
(%)(Millions of yen)

16Copyright © 2012 CALBEE, Inc. All rights reserved.
FY2012
results
FY2013
forecasts
Change
In %
Net sales
Million yen
163,268
Million yen
170,000
%
+ 4.1
Gross profit 69,081 72,800 + 5.4
SG&A 56,833 59,200 + 4.2
Selling 21,590 22,480 +4.1
Distribution 12,171 12,620 +3.7
Labor 15,183 16,000 +5.4
Others 7,888 8,100 +2.7
Operating income
12,247 13,600 +11.0
Ordinary income 12,486 13,600 + 8.9
Extraordinary
income/loss448 -200 ー
Net profit 7,096 7,500 + 5.7
FY2013: Full year forecasts
Target an 8% operating margin
Net salesStrengthen overseas business, potato-based snacks and new products (Vegips)
Gross profitExpect increase in price of raw materialsfood oils, etc.
Anticipate 0.5% rise in gross margindue to benefits of cost reduction
SG&AForecast net sales to SG&A ratio to be broadly in line with FY2012
Focus on efficiencies and benefits of selling expenses

17Copyright © 2012 CALBEE, Inc. All rights reserved.
■
Potato-based snacks
Potato chips
・Strengthen product line up of
Kata-age
・Launched Salt and sweet chipsnationwide
Jagabee
・Grew sales of Butter Shouyu
flavor・Launched new flavors and packages
■
New productsIncrease production of Vegips
aiming for nationwide
development by autumn
■ OverseasStrengthen South Korea, US sales
Expected Factors of Increased Sales in the Year Ending March 2013
0
5,000
10,000
March 2009 March 2010 March 2011 March 2012 March 2013
Sales + 6,732
Potato chips + 1,887
Jagabee + 1,593
Potato-based snacks + 2,435
New Product (Vegips
, etc) + 2,097
Overseas + 1,716
Others + 484
Million yen
Million yen
■
Factors increasing sales
■
Trends in overseas sales

18Copyright © 2012 CALBEE, Inc. All rights reserved.
Continue to provide new products
Launch 3 products annually
Cultivate strong brands
20 items that generate over 5.0 billion yen annually
Further new products development
New products for FY ended Mar 2012
New product area
New process
Coming Soon
New products for FY ended Mar 2012
*7 items for FY ended March 2012

19Copyright © 2012 CALBEE, Inc. All rights reserved.
Million yen
Sales increase
Lower costs
Increased costs of raw materials ↓1,100
Benefit of Cost reduction ↑1,970
Higher sellingexpenses
Higher distribution
Higher labor
13,600Others
Positive impact
Negative impact
↑2,848
↓448
↓816
12,247
↑870
↓889
↓211
FY ended March 2012
(actual)
FY endingMarch 2013(forecasts)
FY2013: Factors increasing operating income

Copyright © 2012 CALBEE, Inc. All rights reserved.
Reference material

21Copyright © 2012 CALBEE, Inc. All rights reserved.
VISIONMission
Calbee Group’s
Basic Values
We are committed
to harnessing nature’s gifts,
to bringing taste and fun, and
to contributing to healthy
life styles.
We must become a company to be
respected, admired and
loved
firstly
by customers, suppliers and distributors,
secondly by our employees
and their families,
thirdly by communities,
and finally by stockholders.

22Copyright © 2012 CALBEE, Inc. All rights reserved.
0
20,000
40,000
60,000
80,000
100,000
120,000
140,000
160,000
1949 1959 1969 1979 1989 1999 2009
1989
Began marketing cereal products
1989
Began marketing cereal products
1954
Kappa Arare
1954
Kappa Arare
1949
Incorporated in Hiroshimaas a caramel manufacturer
1949
Incorporated in Hiroshimaas a caramel manufacturer
1964
Kappa Ebisenshrimp crackers
1964
Kappa Ebisenshrimp crackers
1972
Sapporo Potato, first potato-based
snack
1972
Sapporo Potato, first potato-based
snack
1976
Potato Chips
1976
Potato Chips
1974
Establishment of
potatoprocurement arrangement
began
1974
Establishment of
potatoprocurement arrangement
began
1980
Calbee Potato(formerly potato materials division)
established
1980
Calbee Potato(formerly potato materials division)
established
1995
Jagarico
1995
Jagarico
1996
Bakery business began
1996
Bakery business began
1998
Fruit granola
1998
Fruit granola
2004
R&DDE Center for research and development
established
2004
R&DDE Center for research and development
established
2009
Management reform,Strategic alliance with PEPSICO,
Japan Frito-Lay made a subsidiary
2009
Management reform,Strategic alliance with PEPSICO,
Japan Frito-Lay made a subsidiary
2006
Jagabee
2006
Jagabee
History and salesHistory and sales
Founding daysFounding days Growth periodGrowth period Renewed growthperiod
Renewed growthperiod
History of Growth
(Yen in millions)
Transitionalperiod
1950
1960
1970
1980
1990
2000 2010
(consolidated numbers from FY2005)

23Copyright © 2012 CALBEE, Inc. All rights reserved.
Sales by product
(Million of yen)
Change
in %
94,155 60.5% 95,755 58.6% +1.7%
Potato chips 58,983 37.9% 58,750 36.0% - 0.4%
Jagarico 24,758 15.9% 26,314 16.1% +6.3%
Jagabee 8,055 5.2% 8,394 5.1% +4.2%
Flour-based snacks 19,592 12.6% 20,092 12.3% +2.5%
Corn-based snacks 12,771 8.2% 13,262 8.1% +3.8%
Vegips,other new snacks 1,110 0.7% 2,285 1.4% +105.9%
Overseas 5,074 3.3% 7,155 4.4% +41.0%
Other 2,453 1.6% 2,697 1.7% +9.9%
135,157 86.9% 141,248 86.5% +4.5%
13,015 8.4% 13,375 8.2% +2.8%
5,333 3.4% 6,147 3.8% +15.3%
18,349 11.8% 19,523 12.0% +6.4%
Service 2,022 1.3% 2,495 1.5% +23.4%
155,529 100.0% 163,268 100.0% +5.0%
Fiscal year to March 31,2011 Fiscal year to March 31,2012
Potato-based snacks
Amount AmountComposition Composition
Snacks
Other foods
Total Sales
Bread
Cereals

24Copyright © 2012 CALBEE, Inc. All rights reserved.
2,500
3,000
3,500
4,000
4,500
5,000
5,500
2004 2005 2006 2007 2008 2009 2010 20112.2
2.4
2.6
2.8
3.0
3.2
3.4
Snack foods market : Domestic
Calbee46.1%
Japan Frito-lay
2.8%
Domestic confectionery market
Confectionery retail sales 3.2 trillion
Chocolate
444.0
bnChocolate
444.0
bn
Snacks
406.5
bnSnacks
406.5
bn
Rice snacks 335.6
bnRice snacks 335.6
bn
100 million yen trillion yen
Source: All Nippon Kashi
Association
Source: Intage SRI (nationwide retail sales) Basis: Sales April 2011 to March 2012
Share of domestic Snack foods market

25Copyright © 2012 CALBEE, Inc. All rights reserved.
Snack foods market : China
Others37%
Orion5%
15%
WantWant22%
2011
-2017
CAGR 14%
Liwayway11%DaLi
10%
Market share(¥
bn)
*Source for market scale and market share: Nielsen
Scale and trends in the
snack foods market in China
0
100
200
300
400
2009 2010 2011 (est.) 2012 (est.) 2013(est.) 2014(est.) 2015(est.) 2016(est.) 2017(est.)

26Copyright © 2012 CALBEE, Inc. All rights reserved.
Name Calbee (Tianjin) Foods Co., Ltd.
Capital US $20
million
Ownership ratio CALBEE,Inc.
Master Kong Instant Foods Investment (China) Co., Ltd. *A 100% owned subsidiary of Master Kong Bakery (BVI) Co.,
Ltd.
Itochu Corporation
51%
45%
4%
Location China, Tianjin City
Representative Director Akira Matsumoto
Date established July, 2012 (planned)
Start of
business December, 2012 (planned)
Products Flour-based snacks, potato chips, Jagarico, Jagabee*Planned as dual brands with Master Kong Instant Foods Investment
Capital investment 4.4 billion yen
Future plans Aiming to expand in Huadong, Hainan and Huashi
sequentially
Establishing JV in China with Master Kong Instant Foods Investment and Itochu