calamos global growth and income fund - calamos ... data as of 12/31/17 growth of $10k:...
TRANSCRIPT

NOT FDIC INSURED | MAY LOSE VALUENO BANK GUARANTEE
GLOBAL/INTERNATIONAL DATA AS OF 3/31/18
YTD 2018
0.63%
-0.91
2017
20.05%
24.62
2016
0.67%
8.48
2015
0.68%
-1.84
2014
1.81%
4.71
2013
13.01%
23.44
2012
6.97%
16.80
2011
-2.50%
-6.86
2010
14.56%
13.21
2009
31.59%
35.41
GROWTH OF $10K: OUTPERFORMANCE SINCE INCEPTION
The chart below shows how a hypothetical $10,000 investment in the fund outperformed the benchmark MSCI ACWI Index since thefund’s inception.
Performance is for the Fund’s Class A shares at net asset value and does not include the Fund’s maximum front-end sales charge of 4.75%—had it been in-cluded, the Fund’s return would have been lower. Results are before taxes on fund distributions and assume reinvestment of dividends and capital gains. In-dex data shown is from 8/31/96, since comparative index data is available only for full monthly periods. Source: State Street Corporation and Lipper, Inc.
CALENDAR YEAR RETURNS
Calamos Global Growth and Income Fund A Shares - at NAV
MSCI ACWI Index
Calendar year returns measure net investment income and capital gain or loss from portfolio investments for each period specified. Aver-age annual total return measures net investment income and capital gain or loss from portfolio investments as an annualized average.All performance shown assumes reinvestment of dividends and capital gains distributions. The Fund also offers Class C shares, the per-formance of which may vary. In calculating net investment income, all applicable fees and expenses are deducted from the returns.Class I shares are offered primarily for direct investment by investors through certain tax-exempt retirement plans (including 401(k) plans,457 plans, employer-sponsored 403(b) plans, profit sharing and money purchase pension plans, defined benefit plans and non-qualifieddeferred compensation plans) and by institutional clients, provided such plans or clients have assets of at least $1 million. Class I sharesmay also be offered to certain other entities or programs, including, but not limited to, investment companies, under certain circum-stances.
AVERAGE ANNUAL RETURNS
Calamos Global Growth and Income Fund
I Shares - at NAV (Inception–9/18/97
A Shares - at NAV (Inception–9/9/96)
A Shares - Load adjusted
MSCI ACWI Index
MSCI World IndexMorningstar World Allocation Category
1-YEAR
15.22%
14.90
9.43
15.36
14.13
3-YEAR
6.09%
5.78
4.10
8.68
8.56
5-YEAR
6.55%
6.25
5.23
9.77
10.30
10-YEAR
5.28%
5.02
4.51
6.14
6.50
SINCE ASHARE
INCEPTION
N/A%
8.03
7.78
7.10
7.14
SINCE ISHARE
INCEPTION
7.45%
N/A
N/A
6.18
6.19
Calamos Global Growth and Income Fund (A Shares at NAV) BBgBarc Global Aggregate Bond Index
-10%
0%
10%20%30%40%50%60%70%80%
63.54
-3.79
5.34
-4.54
12.080.65
20.77
-1.62
18.54
-1.41
10.95
-3.01
18.75
-0.43
2.63
-8.18OCT '98 -JAN '00
NOV '01 -APR '02
JUN '03 -JUN '04
JUN '05 -JUN '06
DEC '08 -JUN '09
OCT '10 -FEB '11
JUL '12 -DEC '13
JUL '16 -DEC '16
YieldIncrease
(BPS)
263 122 176 134 187 134 157 123
3/31/1812/31/1012/31/0512/31/009/9/96
Calamos Global Growth and Income Fund (A Shares at NAV) MSCI ACWI Index
$49,989
$42,435
$10,000
$20,000
$3,0000
$40,000
$50,000
$60,000
12/31/14
Notable Outperformance vs. Bonds in the Face of Rate IncreasesThe chart below shows fund’s outperformance versus the Bloomberg Barclays Global Aggregate Bond Index during periods when the 10-year Treasury bond yields rose more than 100 basis points.
Data as of 3/31/18. Rising rate environment periods from troughs to peak from October 1998 to December 2016. A basis point equals 1/100th of 1%
Calamos Global Growth and Income Fund
8.74 4.20 4.93 4.74 6.42 5.60
★★★★MORNINGSTAR OVERALL RATING™†
Among 376 World Allocation Funds The fund’s load-waived Class I shares had 4 stars for 3 years, 4 stars for 5 years, and 3 stars for 10 years out of 376, 329 and 151 World Allocation Funds, respec-tively, for the period ended 3/31/18.
OVERVIEWThe fund invests primarily in global equity and convertible securities in an attempt to balance risk/reward while providing growth and income.
KEY FEATURES» Combines equity and convertible
holdings in order to limitdownside risk while potentiallycapturing upside equityparticipation
» Provides a core holding optionthat aims to maintain a consistentrisk posture throughout the marketcycle
» Seeks to participate in the upsidemovements of the global equitymarket while lessening thedamage of down periods
PORTFOLIO FITThe fund can provide a long-termcore allocation to global equities withthe potential for lower volatility overmarket cycles.
FUND TICKER SYMBOLSA Shares C Shares I SharesCVLOX CVLCX CGCIX
There can be no assurance that the Fund willachieve its investment objective.
†Morningstar ratings shown are for Class Ishares and do not include any front-end salesload. Not all investors have access to or may investin the share class shown. Other share classes withfront-end or back-end sales charges may have dif-ferent ratings than the ratings shown.
Performance data quoted represents past performance, which is no guarantee of future results. Current performance may belower or higher than the performance quoted. The principal value and return of an investment will fluctuate so that yourshares, when redeemed, may be worth more or less than their original cost. Performance reflected at NAV does notinclude the Fund’s maximum front-end sales load of 4.75%. Had it been included, the Fund’s return would have beenlower. For the most recent fund month-end performance information visit www.calamos.com.
GLOBAL/INTERNATIONAL DATA AS OF 3/31/18
Calamos Financial Services LLC, Distributor2020 Calamos Court | Naperville, IL 60563-2787800.582.6959 | www.calamos.com | [email protected]© 2018 Calamos Investments LLC. All Rights Reserved.Calamos® and Calamos Investments® are registered trademarks ofCalamos Investments LLC.
GGIFCT 605 0318Q R
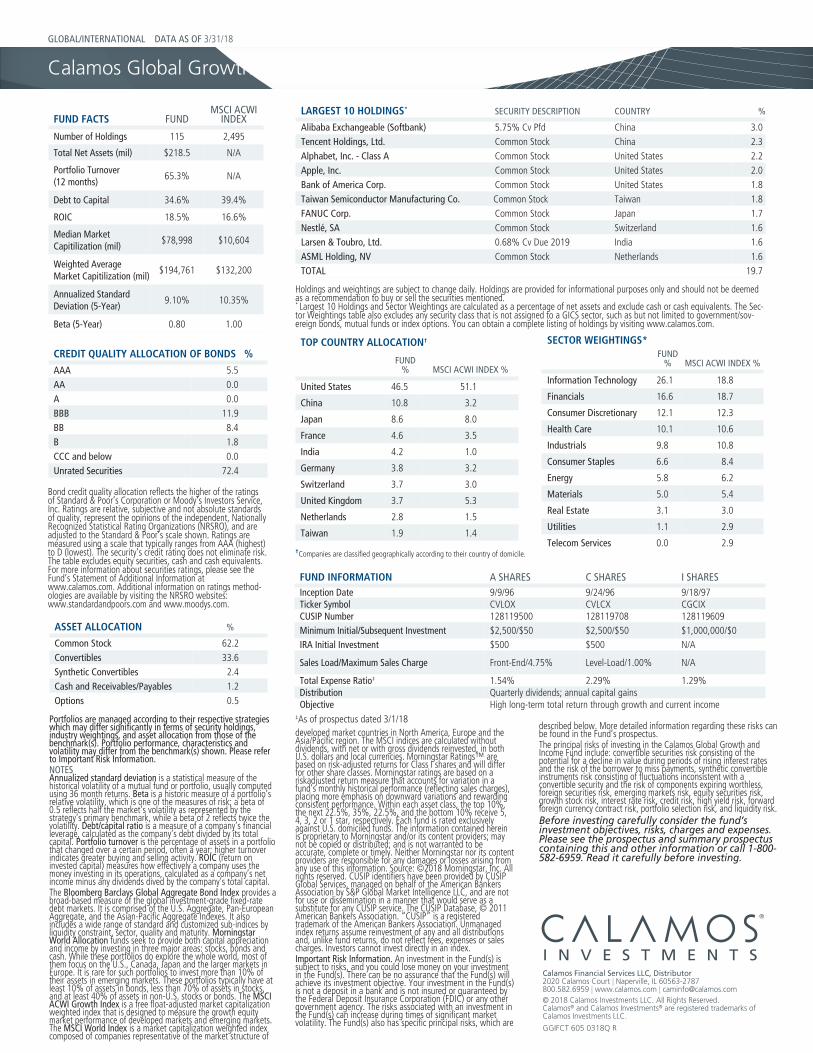
FUND FACTS FUNDMSCI ACWI
INDEX
Number of Holdings 115 2,495
Total Net Assets (mil) $218.5 N/A
Portfolio Turnover(12 months)
65.3% N/A
Debt to Capital 34.6% 39.4%
ROIC 18.5% 16.6%
Median MarketCapitilization (mil)
$78,998 $10,604
Weighted AverageMarket Capitilization (mil)
$194,761 $132,200
Annualized StandardDeviation (5-Year)
9.10% 10.35%
Beta (5-Year) 0.80 1.00
CREDIT QUALITY ALLOCATION OF BONDS %
AAA 5.5AA 0.0A 0.0BBB 11.9BB 8.4B 1.8CCC and below 0.0Unrated Securities 72.4
LARGEST 10 HOLDINGS* SECURITY DESCRIPTION COUNTRY %
Alibaba Exchangeable (Softbank) 5.75% Cv Pfd China 3.0Tencent Holdings, Ltd. Common Stock China 2.3Alphabet, Inc. - Class A Common Stock United States 2.2Apple, Inc. Common Stock United States 2.0Bank of America Corp. Common Stock United States 1.8Taiwan Semiconductor Manufacturing Co. Common Stock Taiwan 1.8FANUC Corp. Common Stock Japan 1.7Nestlé, SA Common Stock Switzerland 1.6Larsen & Toubro, Ltd. 0.68% Cv Due 2019 India 1.6ASML Holding, NV Common Stock Netherlands 1.6TOTAL 19.7
Holdings and weightings are subject to change daily. Holdings are provided for informational purposes only and should not be deemedas a recommendation to buy or sell the securities mentioned.* Largest 10 Holdings and Sector Weightings are calculated as a percentage of net assets and exclude cash or cash equivalents. The Sec-tor Weightings table also excludes any security class that is not assigned to a GICS sector, such as but not limited to government/sov-ereign bonds, mutual funds or index options. You can obtain a complete listing of holdings by visiting www.calamos.com.
TOP COUNTRY ALLOCATION†
FUND% MSCI ACWI INDEX %
United States 46.5 51.1
China 10.8 3.2
Japan 8.6 8.0
France 4.6 3.5
India 4.2 1.0
Germany 3.8 3.2
Switzerland 3.7 3.0
United Kingdom 3.7 5.3
Netherlands 2.8 1.5
Taiwan 1.9 1.4
SECTOR WEIGHTINGS*FUND
% MSCI ACWI INDEX %
Information Technology 26.1 18.8
Financials 16.6 18.7
Consumer Discretionary 12.1 12.3
Health Care 10.1 10.6
Industrials 9.8 10.8
Consumer Staples 6.6 8.4
Energy 5.8 6.2
Materials 5.0 5.4
Real Estate 3.1 3.0
Utilities 1.1 2.9
Telecom Services 0.0 2.9
ASSET ALLOCATION %
Common Stock 62.2Convertibles 33.6Synthetic Convertibles 2.4Cash and Receivables/Payables 1.2Options 0.5
�Bond credit quality allocation reflects the higher of the ratingsof Standard & Poor’s Corporation or Moody’s Investors Service,Inc. Ratings are relative, subjective and not absolute standardsof quality, represent the opinions of the independent, NationallyRecognized Statistical Rating Organizations (NRSRO), and areadjusted to the Standard & Poor’s scale shown. Ratings aremeasured using a scale that typically ranges from AAA (highest)to D (lowest). The security’s credit rating does not eliminate risk.The table excludes equity securities, cash and cash equivalents.For more information about securities ratings, please see theFund’s Statement of Additional Information atwww.calamos.com. Additional information on ratings method-ologies are available by visiting the NRSRO websites:www.standardandpoors.com and www.moodys.com.
FUND INFORMATION A SHARES C SHARES I SHARESInception Date 9/9/96 9/24/96 9/18/97Ticker Symbol CVLOX CVLCX CGCIXCUSIP Number 128119500 128119708 128119609Minimum Initial/Subsequent Investment $2,500/$50 $2,500/$50 $1,000,000/$0IRA Initial Investment $500 $500 N/A
Sales Load/Maximum Sales Charge Front-End/4.75% Level-Load/1.00% N/A
Total Expense Ratio‡ 1.54% 2.29% 1.29%Distribution Quarterly dividends; annual capital gainsObjective High long-term total return through growth and current income
Portfolios are managed according to their respective strategieswhich may differ significantly in terms of security holdings,industry weightings, and asset allocation from those of thebenchmark(s). Portfolio performance, characteristics andvolatility may differ from the benchmark(s) shown. Please referto Important Risk Information.NOTESAnnualized standard deviation is a statistical measure of thehistorical volatility of a mutual fund or portfolio, usually computedusing 36 month returns. Beta is a historic measure of a portfolio’srelative volatility, which is one of the measures of risk; a beta of0.5 reflects half the market’s volatility as represented by thestrategy’s primary benchmark, while a beta of 2 reflects twice thevolatility. Debt/capital ratio is a measure of a company’s financialleverage, calculated as the company’s debt divided by its totalcapital. Portfolio turnover is the percentage of assets in a portfoliothat changed over a certain period, often a year; higher turnoverindicates greater buying and selling activity. ROIC (return oninvested capital) measures how effectively a company uses themoney investing in its operations, calculated as a company’s netincome minus any dividends dived by the company’s total capital.The Bloomberg Barclays Global Aggregate Bond Index provides abroad-based measure of the global investment-grade fixed-ratedebt markets. It is comprised of the U.S. Aggregate, Pan-EuropeanAggregate, and the Asian-Pacific Aggregate Indexes. It alsoincludes a wide range of standard and customized sub-indices byliquidity constraint, sector, quality and maturity. MorningstarWorld Allocation funds seek to provide both capital appreciationand income by investing in three major areas: stocks, bonds andcash. While these portfolios do explore the whole world, most ofthem focus on the U.S., Canada, Japan and the larger markets inEurope. It is rare for such portfolios to invest more than 10% oftheir assets in emerging markets. These portfolios typically have atleast 10% of assets in bonds, less than 70% of assets in stocks,and at least 40% of assets in non-U.S. stocks or bonds. The MSCIACWI Growth Index is a free float-adjusted market capitalizationweighted index that is designed to measure the growth equitymarket performance of developed markets and emerging markets.The MSCI World Index is a market capitalization weighted indexcomposed of companies representative of the market structure of
developed market countries in North America, Europe and theAsia/Pacific region. The MSCI indices are calculated withoutdividends, with net or with gross dividends reinvested, in bothU.S. dollars and local currencies. Morningstar Ratings™ arebased on risk-adjusted returns for Class I shares and will differfor other share classes. Morningstar ratings are based on ariskadjusted return measure that accounts for variation in afund’s monthly historical performance (reflecting sales charges),placing more emphasis on downward variations and rewardingconsistent performance. Within each asset class, the top 10%,the next 22.5%, 35%, 22.5%, and the bottom 10% receive 5,4, 3, 2 or 1 star, respectively. Each fund is rated exclusivelyagainst U.S. domiciled funds. The information contained hereinis proprietary to Morningstar and/or its content providers; maynot be copied or distributed; and is not warranted to beaccurate, complete or timely. Neither Morningstar nor its contentproviders are responsible for any damages or losses arising fromany use of this information. Source: ©2018 Morningstar, Inc. Allrights reserved. CUSIP identifiers have been provided by CUSIPGlobal Services, managed on behalf of the American BankersAssociation by S&P Global Market Intelligence LLC, and are notfor use or dissemination in a manner that would serve as asubstitute for any CUSIP service. The CUSIP Database, © 2011American Bankers Association. “CUSIP” is a registeredtrademark of the American Bankers Association. Unmanagedindex returns assume reinvestment of any and all distributionsand, unlike fund returns, do not reflect fees, expenses or salescharges. Investors cannot invest directly in an index.Important Risk Information. An investment in the Fund(s) issubject to risks, and you could lose money on your investmentin the Fund(s). There can be no assurance that the Fund(s) willachieve its investment objective. Your investment in the Fund(s)is not a deposit in a bank and is not insured or guaranteed bythe Federal Deposit Insurance Corporation (FDIC) or any othergovernment agency. The risks associated with an investment inthe Fund(s) can increase during times of significant marketvolatility. The Fund(s) also has specific principal risks, which are
described below. More detailed information regarding these risks canbe found in the Fund’s prospectus.The principal risks of investing in the Calamos Global Growth andIncome Fund include: convertible securities risk consisting of thepotential for a decline in value during periods of rising interest ratesand the risk of the borrower to miss payments, synthetic convertibleinstruments risk consisting of fluctuations inconsistent with aconvertible security and the risk of components expiring worthless,foreign securities risk, emerging markets risk, equity securities risk,growth stock risk, interest rate risk, credit risk, high yield risk, forwardforeign currency contract risk, portfolio selection risk, and liquidity risk.Before investing carefully consider the fund’sinvestment objectives, risks, charges and expenses.Please see the prospectus and summary prospectuscontaining this and other information or call 1-800-582-6959. Read it carefully before investing.
Calamos Global Growth and Income Fund
‡As of prospectus dated 3/1/18
†Companies are classified geographically according to their country of domicile.