cal x: an x ray radiography tool for high · pdf filethroughput coreflood experimentation....
TRANSCRIPT

SCA2017-012 1/12
1
CAL-X: AN X-RAY RADIOGRAPHY TOOL FOR HIGH
THROUGHPUT COREFLOOD EXPERIMENTATION.
APPLICATIONS IN THE EOR CONTEXT.
Souhail Youssef, Matthieu Mascle, Yannick Peysson, Olga Vizika
IFP Energies nouvelles, 1&4 avenue de Bois-Préau, Rueil-Malmaison, France
This paper was prepared for presentation at the International Symposium of the Society of
Core Analysts held in Vienna, Austria 28 August - 1 September 2017
ABSTRACT To speed up coreflood experiments, we have developed a state of the art
experimental setup (CAL-X) designed for high throughput coreflood
experimentation. The setup is composed of an X-ray radiography facility, a fully
instrumented multi-fluid injection platform and a dedicated X-ray transparent core
holder. The equipment was designed to handle small samples of 10 mm in diameter
and 20 mm in length, and can be operated at up to 150 bar and 150 °C. The X-ray
facility consists of a high-power X-ray tube and a high speed-low noise detector
allowing real-time radiography acquisition and offering sufficient density
resolution to use dopant-free fluids. The injection platform is fully automated and
allows the control and monitoring of different parameters (pressure, temperature,
flow rate…). 1-D and 2-D saturation profiles are followed in real-time, allowing a
precise determination of the recovery curve, reducing thus drastically time-
consuming effluent measurements. Using this setup, a typical coreflood experiment
can be run in less than a day. To validate the setup, we have run a series of
experiments on water-wet sandstone samples to determine capillary desaturation
curve, steady-state relative permeabilities and recovery factor for a formulation
designed for high temperature conditions (110°C). The results show good
repeatability as well as good agreement when compared to standard coreflood
experiments. In the recovery factor experiment, during surfactant injection, the
formation and displacement of an oil bank was observed, yielding a recovery factor
of 92% OOIP.
INTRODUCTION Demonstrating the viability of a chemical EOR project requires a meticulous and
intensive laboratory study that involves complex, time-consuming workflows and
optimization processes. These workflows include successive or iterative steps
starting from reservoir fluid and rock characterizations followed by surfactant
formulation screening and optimization, coreflood validation and simulation, and
sensitivity studies [1]. In this context, High Throughput Experimentations (HTE)
are necessary to decrease time and cost of laboratory studies [2]. On the chemical

SCA2017-012 2/12
2
side, formulation design is already performed via an efficient High Throughput
Screening (HTS) methodology using a robotic platform. On the petrophysical side,
fast coreflood experiments are also needed to measure EOR related petrophysical
properties on different rock-facies and evaluate the efficiency of the selected
formulations at reservoir conditions.
To develop HTE, three main concepts are used: automation, parallelization and
sample size reduction [3]. In the field of core analysis, automation has been
developed since the 80’s to accelerate workflow [4,5]. A work recently reported
[6] describes a fully automated coreflood laboratory based on standard core plugs
sizes. With regards to size reduction, miniaturization of coreflood experiments
have been also developed recently [7–9]. In these works, the objective was to
image pore scale mechanisms and local fluid saturation and not experimental time
reduction. Yet, it has allowed to overcome some technical challenges related to
core holder miniaturization and physical properties measurement. In the present
work, we combined automation and miniaturization to accelerate SCAL
measurements. To that purpose we developed a dedicated setup (CAL-X) that
allows to measure different properties needed in an EOR workflow like capillary
desaturation curve (CDC), relative permeability and recovery factor while reducing
by an order of magnitude the time needed to run these experiments.
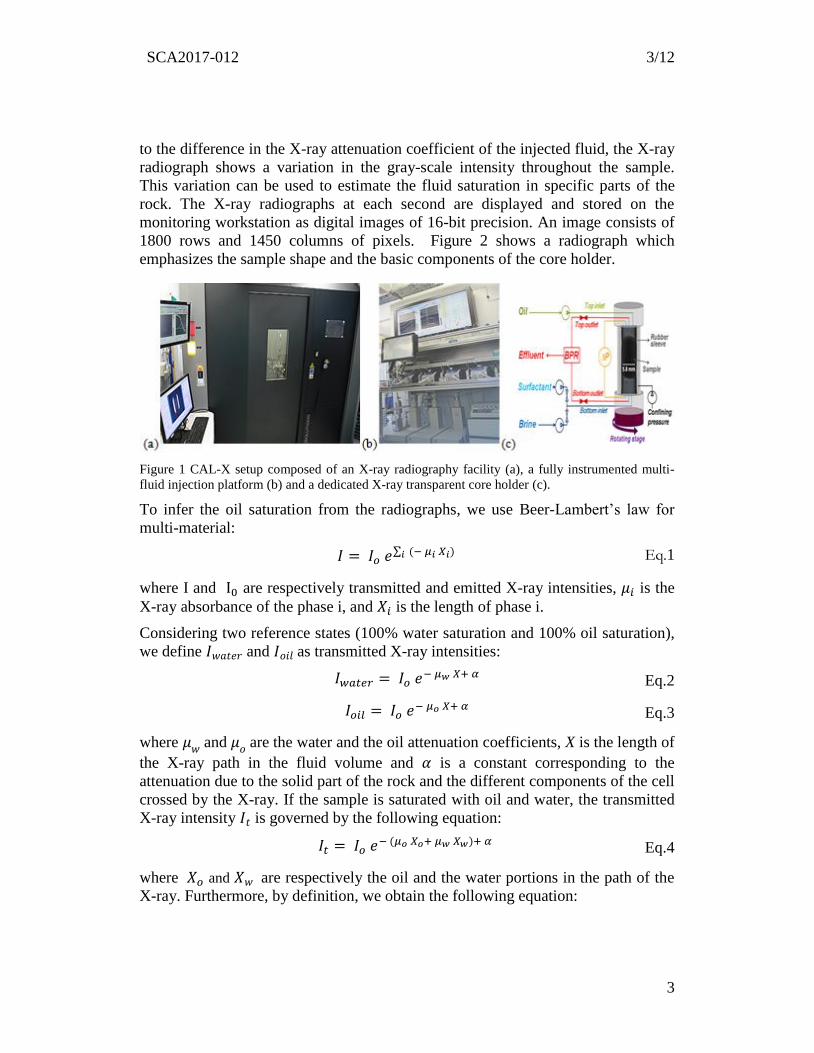
MATERIAL AND METHODS Experimental setup
The setup is composed of an X-ray radiography facility, a fully instrumented multi-
fluid injection platform and a dedicated X-ray transparent core holder. The X-ray
facility consists of a high-power X-ray tube (up to 150 kV and 500 µA) and a high
speed-low noise detector allowing real-time radiography acquisition (up to 30 fps)
and offering sufficient density resolution to use dopant-free fluids. The different
components are embedded in a large X-ray protection cabinet (see Figure 1.a). The
core holder was adapted to small samples (mini-plug) of 10 mm in diameter and 20
mm in length, and can be operated at up to 150 bar and 150 °C. The core holder
body was made of beryllium to guarantee maximum X-ray transparency and
temperature resistance. Each side of the core holder is equipped with three ports
(inlet, outlet and pressure tap) as well as a temperature transducer. Figure 1.c
shows a possible connection configuration. The injection platform (see Figure 1.b)
is equipped with eight pumps and is fully automated allowing the control and
monitoring of different parameters (absolute and differential pressure, temperature,
flow rate…).
X-ray Radiograph Processing
The radiographs were captured using an energy of 60 kV and current of 300 µA.
The use of low voltage allows for a higher contrast between components. The
spatial resolution was set to 30 µm. Radiographs were captured each second. Due
SCA2017-012 3/12
3
to the difference in the X-ray attenuation coefficient of the injected fluid, the X-ray
radiograph shows a variation in the gray-scale intensity throughout the sample.
This variation can be used to estimate the fluid saturation in specific parts of the
rock. The X-ray radiographs at each second are displayed and stored on the
monitoring workstation as digital images of 16-bit precision. An image consists of
1800 rows and 1450 columns of pixels. Figure 2 shows a radiograph which
emphasizes the sample shape and the basic components of the core holder.
Figure 1 CAL-X setup composed of an X-ray radiography facility (a), a fully instrumented multi-
fluid injection platform (b) and a dedicated X-ray transparent core holder (c).
To infer the oil saturation from the radiographs, we use Beer-Lambert’s law for
multi-material:
𝐼 = 𝐼𝑜 𝑒∑ (− 𝜇𝑖 𝑋𝑖)𝑖 Eq.1
where I and I0 are respectively transmitted and emitted X-ray intensities, 𝜇𝑖 is the
X-ray absorbance of the phase i, and 𝑋𝑖 is the length of phase i.
Considering two reference states (100% water saturation and 100% oil saturation),
we define 𝐼𝑤𝑎𝑡𝑒𝑟 and 𝐼𝑜𝑖𝑙 as transmitted X-ray intensities:
𝐼𝑤𝑎𝑡𝑒𝑟 = 𝐼𝑜 𝑒− 𝜇𝑤 𝑋+ 𝛼 Eq.2
𝐼𝑜𝑖𝑙 = 𝐼𝑜 𝑒− 𝜇𝑜 𝑋+ 𝛼 Eq.3
where 𝜇𝑤 and 𝜇𝑜 are the water and the oil attenuation coefficients, X is the length of
the X-ray path in the fluid volume and 𝛼 is a constant corresponding to the
attenuation due to the solid part of the rock and the different components of the cell
crossed by the X-ray. If the sample is saturated with oil and water, the transmitted
X-ray intensity 𝐼𝑡 is governed by the following equation:
𝐼𝑡 = 𝐼𝑜 𝑒− (𝜇𝑜 𝑋𝑜+ 𝜇𝑤 𝑋𝑤)+ 𝛼 Eq.4
where 𝑋𝑜 and 𝑋𝑤 are respectively the oil and the water portions in the path of the
X-ray. Furthermore, by definition, we obtain the following equation:

SCA2017-012 4/12
4
𝑋𝑜 + 𝑋𝑤 = 𝑋 Eq.5
The oil saturation 𝑆𝑜 can be obtained as follows:
ln (
𝐼𝑤𝑎𝑡𝑒𝑟𝐼0
) − ln (𝐼𝑡𝐼0)
ln (𝐼𝑤𝑎𝑡𝑒𝑟𝐼0
) − ln (𝐼𝑜𝑖𝑙𝐼0) =
−𝜇𝑤 𝑋 + 𝜇𝑜 𝑋𝑜 + 𝜇𝑤 𝑋𝑤
−𝜇𝑤 𝑋 + 𝜇𝑜 𝑋= 𝑋𝑜𝑋= 𝑆𝑜 Eq.6
The transmitted X-ray intensity is measured by each pixel of the X-ray detector and
represented by a proportional gray value. Therefore, Eq.6 can be applied directly to
the gray level images to estimate local and average saturations. The results of the
image processing are presented as illustrated in Figure 2.b. The upper left
quadrants represent the 2D saturation map. The upper right quadrant represents the
saturation profile along the sample and the lower quadrant corresponds to the
evolution of mean saturation as a function of time. The radiographs are processed
instantaneously allowing a real-time monitoring of experiments.
(a)
( b )
Figure 2: (a) Raw radiograph showing
the sample shape and the basic
components of the core holder.
Illustration (b) shows an example of
real-time saturation monitoring where
the upper left quadrant represent the 2D
saturation map. The upper right quadrant
represents the saturation profile along
the sample and the lower quadrant
corresponds to the evolution of mean
saturation as a function of time.

SCA2017-012 5/12
5
Rock samples
Samples used in this work are water wet outcrop sandstones from different quarries
with porosity ranging from 12% to 23% and permeability ranging from 200 mD to
2030 mD (see Table 1). Samples are cored with a diamond core drill with 1 cm
internal diameter and cut to a length of 2 cm. Then, they are dried in an oven for at
least 48 hours at a temperature of 60 °C.
Table 1 Petrophysical properties of the plugs used in this work
Plug name Benth_28 Benth_12 Clash_22 GDF_15
Origin Bentheimer Clashach Fontainebleau
Porosity (%) 23% 22% 14% 12%
Permeability (mD) 2030 1350 950 200
APPLICATIONS AND RESULTS Steady state relative permeability
Relative permeabilities are fundamental properties required to describe an
immiscible two-phase flow using Darcy’s equations. Relative permeabilities are
functions of the saturation and the capillary number at which the immiscible
displacement occurs. When neglecting gravity effect, Darcy’s equation can be
written as:
𝑞𝑖 =𝐾𝑎𝑘𝑟𝑖(𝑆𝑖, 𝑁𝑐)𝑆
𝜇𝑖∗Δ𝑃𝑖𝐿
Eq.7
where 𝑞𝑖 is the volumetric flow rate of the phase i (m3/s), 𝐾𝑎 is the absolute
permeability (m2), 𝑘𝑟𝑖 is the relative permeability of the phase 𝑖, 𝜇𝑖 is the fluid
viscosity (Pa.s), 𝑆𝑖 the saturation of the phase 𝑖, Δ𝑃𝑖 the differential pressure
measure in the phase 𝑖, between the outlet and the inlet of the plug (Pa), 𝐿 the
length of the plug (m) and 𝑆 the cross section (m2).
In the case of two phase flow, Steady State Method (SSM) can be used to derive
relative permeability. The SSM method involves the injection of both fluids at the
inlet of the plug while measuring the differential pressure and the saturation within
the core. Eq.7 can then be solved analytically if capillary pressure is neglected.
This condition can be assessed when fluids are injected at high flow rate. Yet,
negligible capillary effect and laminar flow (i.e Reynolds number less than 10)
have to be confirmed. Laminar condition is verified since a linear relation between
flow rate and pressure drop is respected in mono-phasic injection. To neglected
capillary pressure (Pc=0) we verify that the saturation at steady state condition is

SCA2017-012 6/12
6
uniform along the sample (see example on Figure 2 (b)). In this case relative
permeability can be derived from Eq.7 for each fluid as:
where indices w and nw refer respectively to wetting and non-wetting fluids. If
capillary end effects is observed, simulations must be used to derive the relative
permeabilities by data history matching.
The Steady State method is usually considered as one of the most reliable methods
to perform relative permeability measurements, but one of its limitations is the time
required to conduct such an experiment, ranging from several days to several
weeks for classical core-plug sizes. With CAL-X, the size of plugs has been
decreased to reduce experimental time by an order of magnitude (i.e. few hours to
few days). An example of SSM imbibition relative permeability measurement
protocol is presented in Figure 3. The experiment is conducted on a water-wet
Bentheimer sandstone at ambient temperature, using 25 bars of confinement
pressure and 15 bars of pore pressure. For this experiment we used a 33 g/l NaCl
brine and dodecane synthetic oil with respectively a viscosity of 1.07 cP and 1.52
cP. In this example, the sample is first saturated with brine for absolute
permeability measurement. Then, the oil is injected at a rate of 1cc/min until steady
saturation reached. Next, oil and brine are co-injected at a total flow rate of
1cc/min corresponding to a capillary number of 5 10-6. The saturation 𝑆𝑤 was
computed from the X-ray imaging, the differential pressure (Δ𝑃𝑤) was measured
and the fluid flow rates were imposed. The relative permeabilities were measured
for different saturations, 𝑆𝑤, by varying the fractional flow (fi) of each phase while
maintaining the total flow rate constant and then resolving Eq.8.
Figure 3 : Example of differential pressure (𝚫𝑷), water saturation (𝑺𝒘) and water fractional flow
(𝒇𝒘) acquisition for kr measurement using SSM. The 3 steps mentioned on the 1st plot refer to the
{
𝑘𝑟𝑤(𝑆𝑤,𝑁𝑐) =
𝜇𝑤𝐿
𝐾𝑎𝑆∗𝑞𝑤
Δ𝑃𝑤
𝑘𝑟𝑛𝑤(𝑆𝑤,𝑁𝑐) =𝜇𝑛𝑤𝐿
𝐾𝑎𝑆∗𝑞𝑛𝑤
Δ𝑃𝑤
Eq.8

SCA2017-012 7/12
7
experimental protocol. During step 3, 𝒌𝒐𝒓(𝑺𝒘), 𝒌𝒓𝒘(𝑺𝒘) are measured for each 𝒇𝒘 value, when the
system reaches the steady state. The acquisition was conducted on a water-wet Bentheimer
sandstone, with 𝒒𝒕𝒐𝒕𝐢𝐧𝐣= 𝟏 𝐜𝐜/𝐦𝐢𝐧 during step 3.
Left graph of Figure 3 illustrates the parameters measured during the experiment. It
shows that the total time needed to run the full injection sequence is few hours. For
each fractional flow, steady state is reached in about tens of minutes.
Relative permeabilities illustrated on the right graph of Figure 3 have a typical
shape of Relative permeabilities measured on water-wet homogeneous sandstone.
To validate the representativeness of the measurements, results are compared to
macro-scale experiment. Figure 4 shows a superimposition of relative
permeabilities for Benth_12 measured in this work and for a 40 mm in diameter
Bentheimer plug documented in [12]. Results show a very good agreement. They
demonstrate that for this homogeneous case a mini-plug can be considered to be
above the representative elementary volume (REV) for multiphase flow behaviour.
Figure 4: Relative permeability measurements conducted on the mini-plug Benth_12 compared to
the ones conducted on a standard macro-plug extracted from the work of Oren et al [12].
Capillary Desaturation Curves (CDC)
The Capillary Desaturation Curve expresses the saturation of the trapped oil in a
porous medium (usually expressed as the reduction of the remaining oil in place
𝑆𝑜𝑟(𝑁𝑐)/𝑆𝑜𝑟𝑤) with the increase of the capillary number Nc [10]. Capillary number
value is adjusted varying the injection flow rate or fluid/fluid interfacial tension.
For example, by adding surfactants in the brine the interfacial tension is decreased
leading to an increase of the capillary number.
In a typical CDC measurement workflow, the plug is initially fully saturated with
brine. The absolute permeability can be measured at this step. Then the plug is set

SCA2017-012 8/12
8
to residual water saturation (Swr) by injecting oil (dodecane) from the top of the
plug to reduce the impact of gravity on the fluid displacements. Brine is first
brought in contact with the plug by leaching the bottom face to perform a
spontaneous imbibition and then injected at 0.05 cc/min, to set the plug to residual
oil saturation (Sorw). Finally, surfactant solution is injected at increasing flow
rates, from 0.005 cc/min to 1 cc/min. The reduction of the interfacial tension and
the increase of the injection flow rate contribute to progressively produce the
trapped oil. At each step, the corresponding capillary number and the average
saturation are calculated. An illustration of saturation monitored during a CDC
measurement is given in Figure 5. The CDC is measured using the saturation
computed from radiographs. The saturation profile So(z) can be used to correct the
measured average saturation from capillary end effects. The time needed to
measure a CDC is in the range of hundreds of minutes (see Figure 5). The protocol
described above to perform CDC measurements has been applied on various
homogenous water-wet rock types previously presented in Table 1.
The interfacial tensions between the surfactant solutions and oil for each test are
listed in Table 2. The experimental CDC presented below are fitted using an
analytical solution expressed as follows [11]:
𝑆𝑜𝑟(𝑁𝑐)
𝑆𝑜𝑟𝑤=1
2erfc [𝑎. ln (
𝑁𝑐𝑁𝑐0
)] Eq.9
where erfc(𝑥) is the complementary error function, 𝑎 and 𝑁𝑐0 are two fitting
parameters. The four measured CDC for the different mini-plugs are given in
Figure 6 with the analytical fit (solid redline). Results show that all CDC have
comparable tendencies with the residual oil starting to be produced for capillary
Figure 5: Example of data monitored
during a CDC measurements. The
experiment is conducted at ambient
temperature, on a Fontainebleau
sandstone.

SCA2017-012 9/12
9
numbers higher than 10−5, and half of the residual oil produced close to 𝑁𝑐 =1.3 10−4.
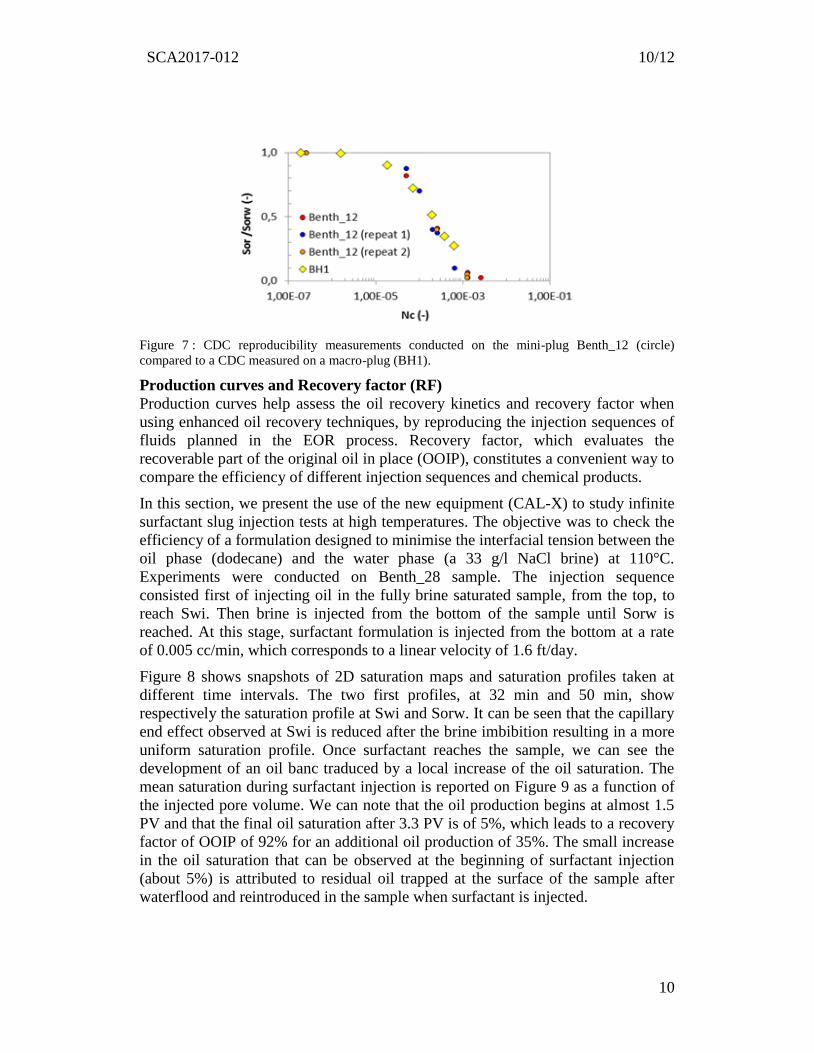
Reproducible measurements have also been conducted to assess the robustness of
the protocol on sample (Benth_12). The results, given in Figure 7 show very good
reproducibility of the experimental CDC. To validate the representativeness of the
measurements, results are compared to macro-scale experiment. The aim is to
demonstrate that neither the reduced size of the mini-plugs used with CAL-X nor
the measurement protocol impact the quality of the measurements. A CDC was
measured on a 33 mm diameter Bentheimer sample (BH1), more detail on the
experiment can be found in [13]. The results show a very good agreement between
the CDC measured on mini- and macro-plug (see Figure 7).
Table 2 : The interfacial tension (IFT) is measured between the wetting phase (surfactants
formulation) and the non-wetting phase (dodecane). Residual Oil Saturation reached with the brine
water flush (Sorw) for the different CDC measurements. The two parameters (Nc0 and a)
correspond to the fitting parameters of the analytical CDC expression.
Benth_28 Benth_12 Clash_22 GDF_15
IFT (mN/m) 0.45 0.10 0.10 0.50
Sorw 0.36 0.4 0.4 0.4
Nc0 1. 10−4 1.8 10−4 2. 10−4 1.3 10−4
a 0.8 0.5 0.5 0.7
Figure 6 : Experimental CDC measured on four rock-types. The residual oil saturation Sorw
reached before injecting the surfactants are given in Table 2. The four experimental curves are fitted
using Eq 9, the fitting parameters are given in Table 2.
SCA2017-012 10/12
10
Figure 7 : CDC reproducibility measurements conducted on the mini-plug Benth_12 (circle)
compared to a CDC measured on a macro-plug (BH1).
Production curves and Recovery factor (RF)
Production curves help assess the oil recovery kinetics and recovery factor when
using enhanced oil recovery techniques, by reproducing the injection sequences of
fluids planned in the EOR process. Recovery factor, which evaluates the
recoverable part of the original oil in place (OOIP), constitutes a convenient way to
compare the efficiency of different injection sequences and chemical products.
In this section, we present the use of the new equipment (CAL-X) to study infinite
surfactant slug injection tests at high temperatures. The objective was to check the
efficiency of a formulation designed to minimise the interfacial tension between the
oil phase (dodecane) and the water phase (a 33 g/l NaCl brine) at 110°C.
Experiments were conducted on Benth_28 sample. The injection sequence
consisted first of injecting oil in the fully brine saturated sample, from the top, to
reach Swi. Then brine is injected from the bottom of the sample until Sorw is
reached. At this stage, surfactant formulation is injected from the bottom at a rate
of 0.005 cc/min, which corresponds to a linear velocity of 1.6 ft/day.
Figure 8 shows snapshots of 2D saturation maps and saturation profiles taken at
different time intervals. The two first profiles, at 32 min and 50 min, show
respectively the saturation profile at Swi and Sorw. It can be seen that the capillary
end effect observed at Swi is reduced after the brine imbibition resulting in a more
uniform saturation profile. Once surfactant reaches the sample, we can see the
development of an oil banc traduced by a local increase of the oil saturation. The
mean saturation during surfactant injection is reported on Figure 9 as a function of
the injected pore volume. We can note that the oil production begins at almost 1.5
PV and that the final oil saturation after 3.3 PV is of 5%, which leads to a recovery
factor of OOIP of 92% for an additional oil production of 35%. The small increase
in the oil saturation that can be observed at the beginning of surfactant injection
(about 5%) is attributed to residual oil trapped at the surface of the sample after
waterflood and reintroduced in the sample when surfactant is injected.

SCA2017-012 11/12
11
Figure 8 Snapshots of 2D saturation maps and saturation profiles taken at different time intervals for
the 110°C experiment (left to right then down left to right). The two first profiles at 32 min and 50
min show respectively saturation profile at Swi and Sorw. Profiles from 1h:22 min to 5h:33 min
correspond to surfactant injection at a linear velocity of 1.6 ft/day.
Figure 9 Production curve during the surfactant formulation injection obtained at 110°C.
Experiments were conducted on the mini-plug Benth_28.
CONCLUSIONS In this work, we have presented a new setup and methodologies designed to speed
up coreflood experiments by an order of magnitude. The setup (CAL-X) was
designed to run experiments on small sample size of 10mm diameter and 20mm
length. To validate the setup, we have run a series of experiments on water-wet
sandstone samples to determine capillary desaturation curves, steady-state relative
permeabilities and recovery factors. Results were satisfactorily compared to
standard size core experiments. Integrating this setup in a chemical EOR validation

SCA2017-012 12/12
12
workflow will not only shorten experimental durations and give quick insights, but
also enable exploring a greater parameter space for minimizing uncertainties in the
model calibration. Complementary studies are ongoing to extend the workflow to
heterogeneous rock type and altered wettability cases.
REFERENCES [1] Bazin B; Morvan M; Douarche F. and Tabary R. “An Integrated Workflow for
Chemical EOR Pilot Design”. SPE IOR Symposium, Tulsa, Oklahoma, USA (2010).
[2] Newsam J. M. “High Throughput Experimentation (HTE) Directed to the Discovery,
Characterization and Evaluation of Materials”. Oil Gas Sci. Technol (2015); 70:437.
[3] Selekman J. A; Qiu J; Tran K; Stevens J; Rosso V; Simmons E. and Xiao Y. et al.
“High-Throughput Automation in Chemical Process Development”. Annual Review
of Chemical and Biomolecular Engineering (2017); 8.
[4] Keelan D. K. "Automated core measurement system for enhanced core data at
overburden conditions" Rocky Mountain Regional Meeting of the Society of
Petroleum Engineers, Billings, Montana. (1986) SPE-15185.
[5] Maloney D. “X-ray imaging technique simplifies and improves reservoir-condition
unsteady-state relative permeability measurements”. Petrophysics (2003); 44.
[6] Griffiths D, Gagea B, Couves J, Spearing M, Webb K. “The Advantages of the
Application of Automated Work Flows to Coreflood Testing: Introducing the Next
Generation of BP's Advanced EOR Testing Capability” International Petroleum
Exhibition and Conference, Abu Dhabi, UAE (2015).
[7] Berg S; Ott H; Klapp S. A; Schwing A; Neiteler R; Brussee N. and Makurat A. et al.
“Real-time 3D imaging of Haines jumps in porous media flow”. Proceedings of the
National Academy of Sciences of the United States of America (2013); 110:3755–9.
[8] Youssef S; Deschamps H; Dautriat J; Rosenberg E; Oughanem R; Maire E. and
Mokso R; "4D imaging of fluid flow dynamics in natural porous media by ultra-fast
X-ray microtomography", Int. Sym. of the Society of Core Analysts Napa Valley,
California; (2013).
[9] Youssef S; Bauer D; Bekri S; Rosenberg E. and Vizika O; "Towards a better
understanding of Multiphase flow in porous media: 3D In-Situ fluid distribution
imaging at the pore scale", Int. Sym. of the Society of Core Analysts, Noordwijk aan
Zee, The Netherlands; (2009).
[10] Oughanem R; Youssef S; Bauer D; Peysson Y; Maire E. and Vizika O. “A Multi-
Scale Investigation of Pore Structure Impact on the Mobilization of Trapped Oil by
Surfactant Injection”. Transport in Porous Media (2015); 109:673–92.
[11] Douarche F; Da Veiga S; Feraille M; Enchéry G; Touzani S. and Barsalou R.
“Sensitivity analysis and optimization of surfactant-polymer flooding under
uncertainties”. Oil Gas Sci. Technol. – Rev. IFP Energies nouvelles (2014); 63.
[12] Oren P.-E; Bakke S. and Arntzen O. J. “Extending predictive capabilities to network
models”. SPE journal (1998); 3:324–36.
[13] Oughanem R; Youssef S; Peysson Y; Bazin B; Maire E. and Vizika O. “Pore-scale to
core-scale study of capillary desaturation curves using multi-scale 3D imaging”. Int.
Sym. of the Society of Core Analysts (2013).