cal -b/cactive transportation model 6 · cal-b/cactive transportation model 6.2 ... applications to...
TRANSCRIPT

Cal-B/C Active Transportation Model 6.2 User’s Guide
December 2017
In Association with System Metrics Group, Inc.

hdrinc.com 201 California Street, Suite 1500, San Francisco, CA 94111-5002 (415) 546-4200
i
TABLE OF CONTENTS
1. USER REQUIREMENTS ................................................................................................................................. 2
2. OPERATING SYSTEM AND SOFTWARE REQUIREMENTS .................................................................................. 2
3. MODEL OVERVIEW ....................................................................................................................................... 2
4. WORKSHEET DETAILS AND PROJECT ANALYSIS ............................................................................................. 6
4.1 PROJECT INFORMATION WORKSHEETS (INFRASTRUCTURE AND NON-INFRASTRUCTURE)............................... 6
4.1.1 PROJECT INFORMATION WORKSHEET ...................................................................................................... 6
4.1.2 NON-INFRASTRUCTURE PROGRAM INFORMATION WORKSHEET ............................................................... 16
4.2 MODEL INPUTS WORKSHEET .................................................................................................................... 17
4.3 RESULTS WORKSHEET............................................................................................................................. 20

hdrinc.com 201 California Street, Suite 1500, San Francisco, CA 94111-5002 (415) 546-4200
ii
LIST OF EXHIBITS
EXHIBIT 1: CAL-B/C GRAPHICAL USER INTERFACE ............................................................................................ 3
EXHIBIT 2: RESULTS WORKSHEET .................................................................................................................... 4
EXHIBIT 3: PROJECT INFORMATION DATA ENTRY BOXES ................................................................................... 6
EXHIBIT 4: PROJECT INFORMATION DATA ENTRY SECTION LOCATIONS .............................................................. 7
EXHIBIT 5: PROJECT INFORMATION (BOX 1A) .................................................................................................... 8
EXHIBIT 6: PROJECT INFORMATION (BOX 1D) ................................................................................................... 9
EXHIBIT 7: EXISTING/NEW IMPROVEMENTS AND TRIP VOLUMES (BOXES 1B/1E) ............................................... 11
EXHIBIT 8: DAILY TRIP GROWTH RATE ESTIMATION ......................................................................................... 12
EXHIBIT 9: INTERSECTION IMPROVEMENTS (BOX 1C) ...................................................................................... 13
EXHIBIT 10: PROJECT COSTS (BOX 1F/1G) .................................................................................................... 15
EXHIBIT 11: DATA CHECKS (BOX 1H) ............................................................................................................. 16
EXHIBIT 12: NON-INFRASTRUCTURE PROJECT INFORMATION WORKSHEET (BOX 1I) ......................................... 17
EXHIBIT 13: MODEL INPUT WORKSHEET ........................................................................................................ 18
EXHIBIT 14: MODEL INPUT BOXES ................................................................................................................. 18
EXHIBIT 15: RESULTS WORKSHEET - FINAL MODEL OUTPUT ........................................................................... 20
EXHIBIT A-1: PROJECT AND SITE CHARACTERISTICS ...................................................................................... 24
EXHIBIT A-2: EXISTING AND NEW FACILITY IMPROVEMENTS AND TRIP VOLUMES .............................................. 25
EXHIBIT A-3: INTERSECTION IMPROVEMENTS - TIME SAVINGS AND ACCIDENT REDUCTION DATA ...................... 27
EXHIBIT A-4: GENERAL USER CHARACTERISTICS ........................................................................................... 28
EXHIBIT A-5: INFRASTRUCTURE PROJECT COSTS ........................................................................................... 29
EXHIBIT A-6: NON-INFRASTRUCTURE PROGRAM COSTS ................................................................................. 30
EXHIBIT A-7: DATA CHECKS .......................................................................................................................... 31
EXHIBIT A-8: NON-INFRASTRUCTURE PROGRAM CHARACTERISTICS (PART 1) ................................................. 32
EXHIBIT A-9: NON-INFRASTRUCTURE PROGRAM CHARACTERISTICS (PART 2) ................................................. 33
EXHIBIT A-10: FINAL RESULTS ...................................................................................................................... 34

Caltrans | Cal-B/C 6.2 AT Model User’s Guide
hdrinc.com 201 California Street, Suite 1500, San Francisco, CA 94111-5002 (415) 546-4200
1
elcome to the User’s Guide for the California Life-Cycle Benefit/Cost Analysis Model (Cal-B/C) Active Transportation (AT) Version 6.2. The California Department of Transportation (Caltrans) uses Cal-B/C to conduct benefit-cost analyses (BCAs) of
projects proposed for the interregional portion of the State Transportation Improvement Program (STIP), the State Highway Operations and Protection Program (SHOPP), applications to the Active Transportation Program (ATP), and other ad hoc analyses requiring benefit-cost analysis.
As a suite of Microsoft Excel spreadsheet-based tools, the various previous packages of Cal-B/C can be used to prepare multi-modal analyses of highway, transit, bicycle, pedestrian, Intelligent Transportation System (ITS), operational improvement, and passenger rail projects.
This version of Cal-B/C performs basic economic analyses of active transportation projects that improve travel options and conditions for cyclists and pedestrians. Users enter data into the tool, which computes lifecycle costs, annual and total benefits in several key categories, net present value, benefit-cost ratio, internal rate of return, and payback period. Benefits are also estimated for children as part of Safe Route to School (SRTS) initiatives.
In addition to the benefit-cost tool, a data entry form is provided to assess non-infrastructure initiatives. The tool uses attributes of these initiatives in a multi-criteria scoring system to provide a common basis of comparison. Results of this scoring system are presented alongside the monetized benefits computed in the Cal-B/C AT.
The addition of Cal-B/C AT to the Cal-B/C suite of analytical tools represents Caltrans’ commitment to active transportation. This version of the model reflects recommended updates to a first-generation BCA model that Caltrans developed in 2014 for use in ATP project selection process. Although the new model is a second generation, it is labeled 6.2 to be consistent with other Cal-B/C models.
Refinements to the methods and data of the original Cal-B/C Active Transportation model have been developed through a comprehensive literature review and in coordination several organizations, including the Caltrans Economic Analysis Branch, Caltrans Sustainable Community Planning, Caltrans Multi-Modal System Planning, the Division of Traffic Operations, and the California Department of Public Health.
Cal-B/C 6.2 provides several features including estimates for changes in:
• Journey quality impacts for cyclists and pedestrians from facility improvements • Additional travel time savings where bike facilities cross improved intersections • User accident risks at improved intersections on existing facilities • Auto accident costs due to diversions to active transportation • Health benefits for employers due to reduced absenteeism based on increased productivity • User benefits associated with reduced risks of mortality • Highway emissions costs from diversions to active transportation.
W

Caltrans | Cal-B/C 6.2 AT Model User’s Guide
hdrinc.com 201 California Street, Suite 1500, San Francisco, CA 94111-5002 (415) 546-4200
2
This quick-start manual introduces users to important features of Cal-B/C 6.2 AT and leads the user through the analysis of a hypothetical project. The Technical Supplement to the User’s Guide provides details of the methodologies and analytical framework used for the model.
1. User Requirements At a minimum, the user of Cal-B/C should have a working knowledge of spreadsheets, particularly Microsoft Excel. To use Cal-B/C, the reader of this User’s Guide must be able to navigate through a multiple-sheet workbook and understand basic principles, functions, and the terminology used when discussing spreadsheets.
The user should also understand lifecycle benefit-cost analysis and be able to interpret the results in a transportation planning context. The reader should refer to the User’s Guide Technical Supplement to learn more about the concepts used to develop Cal-B/C. The basic lifecycle benefit-cost framework is presented in Volume 1, while concepts specific to active transportation projects are discussed in Volume 4.
2. Operating System and Software Requirements Cal-B/C is a Microsoft Excel Macro-Enabled Workbook (.xlsm) called Cal-BC 62 AT. The file is approximately 600 KB in size and is provided in a template format to avoid accidental changes to the base model. Although designed for a Windows environment, Cal-B/C should work on all compute platforms running Excel.
3. Model Overview Cal-B/C 6.2 AT provides economic benefit-cost analysis for a range of active transportation projects. The model provides constant dollar economic impacts for five benefit categories:
• Journey Quality • Additional Delay Savings • Additional Safety Benefits • Health Benefits • Emission Cost Savings.
In addition, Cal-B/C AT reports a subset of benefits specific to Safe Routes to School in three categories:
• Journey Quality • Additional Delay Savings • Additional Safety Benefits.
The Cal-B/C AT model consists of a cover page and 15 worksheets in an Excel workbook. Exhibit 1 shows where these sheets are located in Cal-B/C AT.

Caltrans | Cal-B/C 6.2 AT Model User’s Guide
hdrinc.com 201 California Street, Suite 1500, San Francisco, CA 94111-5002 (415) 546-4200
3
Exhibit 1: Cal-B/C Graphical User Interface
The first three pages include the cover page, a worksheet with concise instructions for how to use Cal-B/C AT, and a sheet with key active transportation and tool definitions.
The next four sheets are data entry and summary results sheets. These are generally the only worksheets that users will need to use to produce results. The final nine worksheets perform calculations or store defaults and economic parameters. These last worksheets should be used by advanced users only.
Cal-B/C AT requires few user inputs, but allows the user to enter many more when project details are available. Cells in the worksheets are color-coded. Green cells indicate required data (i.e., the user must input values for the model to work). Red cells provide default values, such as bicycle facility classification, that the use can change if needed. Blue cells contain values calculated by the model, which can be changed if more detailed data are available.
The first worksheet after the cover page provides Instructions. The instructions include short descriptions of the steps in performing a basic analysis and hints on how to avoid potential pitfalls.
The Definitions worksheet clarifies several key terms used to evaluate active transportation facility use with respect to trip types and user types. In addition, not all users benefit from projects in the same way, so benefit category definitions are also provided in this worksheet.
The Project Information and Non-Infrastructure Program Information worksheets are the main data-entry locations. Users enter descriptive information such as:
• Project and site characteristics • Existing/future segment improvements and trip volumes
Introduction Worksheets• Title• Instructions• Definitions
Project Input & Results Worksheets• 1a) Project Information• 1b) Non-Infrastructure Program Info.• 2) Model Inputs• 3) Results
Analysis Worksheets• Journey Quality• Intersection Delay• Intersection Safety• Auto Accident Costs• Health - Absenteeism• Health - Reduced Mortality• Emissions• Final Calculations• PARAMETERS
Caltrans | Cal-B/C 6.2 AT Model User’s Guide
hdrinc.com 201 California Street, Suite 1500, San Francisco, CA 94111-5002 (415) 546-4200
4
• Intersection improvements - time savings and accident reduction data • General user characteristics • Project and program costs and requested funds • Non-infrastructure program characteristics (e.g., target audience and messaging impacts).
The Model Inputs page is where the user enters bicycle and pedestrian daily trips for existing facilities, new segments, and SRTS projects. This worksheet will need updating only if the user has better active transportation annual trip volumes, data on facility users, and annual mileage.
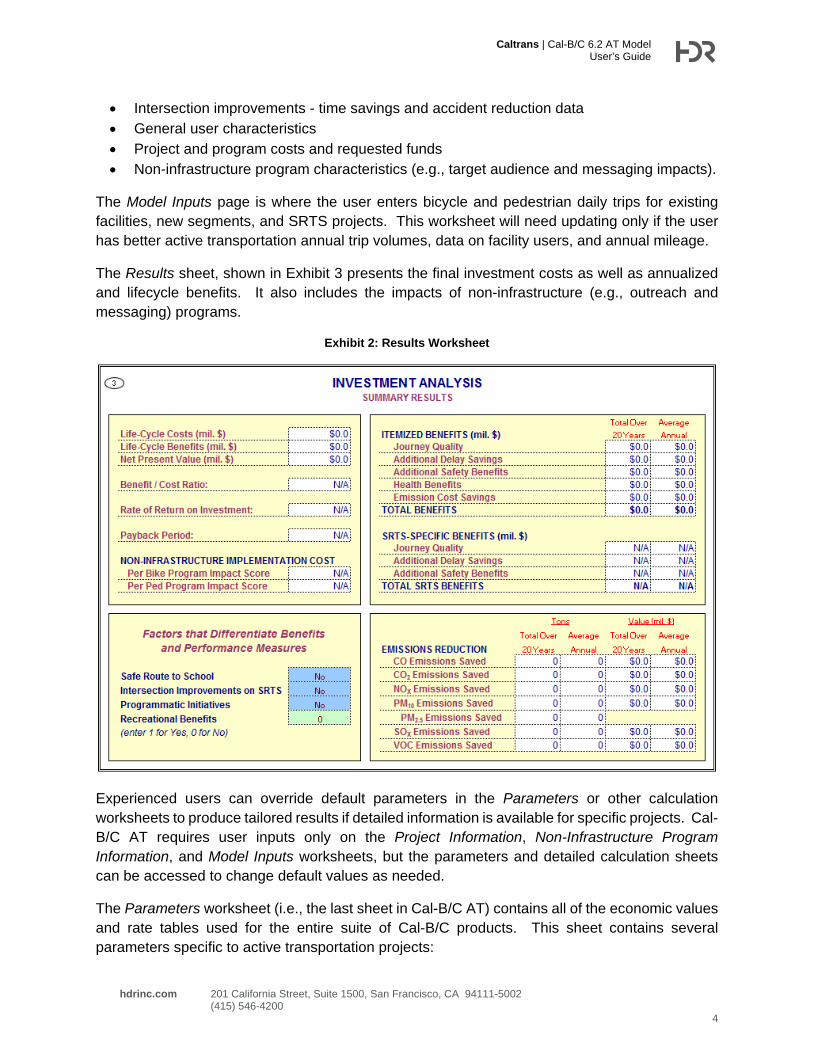
The Results sheet, shown in Exhibit 3 presents the final investment costs as well as annualized and lifecycle benefits. It also includes the impacts of non-infrastructure (e.g., outreach and messaging) programs.
Exhibit 2: Results Worksheet
Experienced users can override default parameters in the Parameters or other calculation worksheets to produce tailored results if detailed information is available for specific projects. Cal-B/C AT requires user inputs only on the Project Information, Non-Infrastructure Program Information, and Model Inputs worksheets, but the parameters and detailed calculation sheets can be accessed to change default values as needed.
The Parameters worksheet (i.e., the last sheet in Cal-B/C AT) contains all of the economic values and rate tables used for the entire suite of Cal-B/C products. This sheet contains several parameters specific to active transportation projects:

Caltrans | Cal-B/C 6.2 AT Model User’s Guide
hdrinc.com 201 California Street, Suite 1500, San Francisco, CA 94111-5002 (415) 546-4200
5
• General Travel Activity Characteristics (cycling, walking, and school days per year) • Active Transportation User Characteristics (cycling and walking speed, auto diversion rates) • Journey Quality parameters for cycling and walking by bike facility classification and other
roadway characteristics (e.g., curb height, crowding) • Health (Absenteeism and Mortality Reduction).
Other parameters included in this worksheet are:
General Economic Values • Year of current dollars for model • Economic update factor • Real discount rate
Highway Operations Measures • Maximum volume-capacity (v/c) ratio • Percent ADT in peak period • Capacity per lane by road type • Parameters for speed estimation • Queue departure rates • Annualization factor
Travel Time Values • Automobile, truck, and transit • Out-of-vehicle and incident-related travel
User Operating Costs • Fuel cost per gallon • Non-fuel cost per mile (automobile and truck)
Highway Accident Costs • Cost of a fatality • Cost of an injury (Level A Severe, Level B
Moderate, Level C Minor) • Cost of a highway accident (fatal, injury, and
PDO) • Statewide highway accident rates (fatal, injury,
PDO)
Transit Accident Rates and Costs • Highway injury severity frequency • Highway accident type distribution • Light-rail and bus accident rates and
costs • Passenger train accident rates and costs • Highway-rail grade crossing incidents • Passing lane accident reduction factors
Highway Emissions Rates • CO, CO2, NOX, PM10, PM2.5, SOX, and
VOC • Automobile, truck, and bus
Rail Emissions Rates • CO, NOX, PM10, and VOC • Passenger train and light-rail
Emissions Health Costs • Urban Southern California, urban
Northern California, and rural California • CO, CO2e, NOX, PM10, SOX, and VOC • Automobile, truck, and bus
Other Values • Demand for travel in peak period • Fuel consumption rates for autos and
trucks • Transportation Management System
(TMS) adjustment factors

Caltrans | Cal-B/C 6.2 AT Model User’s Guide
hdrinc.com 201 California Street, Suite 1500, San Francisco, CA 94111-5002 (415) 546-4200
6
4. Worksheet Details and Project Analysis The following sections describe the four primary Cal-B/C AT worksheets and walk the user through a hypothetical project. The main text in each section introduces the user to an element of the model and the project examples provide details on how to enter data.
4.1 Project Information Worksheets (Infrastructure and Non-Infrastructure) Users enter data primarily on the Project Information or Non-Infrastructure Program Information sheets, depending on project type. The Project Information is where users provide information for infrastructure projects (e.g., bicycle lane expansions) and cost/funding information for infrastructure projects and non-infrastructure programs. The Non-Infrastructure Program Information is where users enter information (beyond program costs) for programs intended to reach target audiences through a variety of outreach and training mechanisms.
Both sheets are discussed in detail in the following sections.
4.1.1 Project Information Worksheet The user can analyze most projects by entering limited data on the Project Information sheet. There are several sections of the worksheet called “boxes” where information pertaining to specific project elements are entered. Exhibit 3 summarizes the eight boxes in the worksheet while Exhibit 4 illustrates where these boxes are found in the worksheet.
Exhibit 3: Project Information Data Entry Boxes
Data Entry Boxes Location/ Cell Range
1A/(1D) Project and Site/(General User) Characteristics B6:J27/ (L6:T27)
1B/(1E) Existing/(New) Segment Improvements and Trip Volume B29:J80 / (L29:T80)
1C Intersection Improvements - Time Savings and Accident Reduction Data B80:J132 1F/(1G) Project/(Program) Costs and Requested Funds V6:AH48 /
(V50:AH92) 1H Data Checks - Project Length, Daily Trips AJ6:AR21

Caltrans | Cal-B/C 6.2 AT Model User’s Guide
hdrinc.com 201 California Street, Suite 1500, San Francisco, CA 94111-5002 (415) 546-4200
7
Exhibit 4: Project Information Data Entry Section Locations
At the top of the worksheet, the user can provide the Caltrans District where the project is located, a descriptive name for the project, an Expenditure Authorization (EA), or a Caltrans project planning number (PPNO).1
The subsections that follow provide data entry instructions for each of the boxes described above. Project and user characteristics (1A and 1D) are presented together since these two boxes are closely related. This approach also applies to the existing and new segment information and trip volume boxes (1B and 1E) and for the two cost and funds boxes (1F and 1E) since these boxes require similar information.
PROJECT AND SITE CHARACTERISTICS (BOX 1A)/GENERAL USER CHARACTERISTICS (BOX 1D) Box 1A is where the user inputs basic information about the type of project proposed for implementation and is shown in Exhibit 5. Box 1B, discussed below, presents information calculated by Cal-B/C AT based on inputs from Box 1A.
1 Expenditure Authorization (EA) is a unique, 5-digit number assigned by Caltrans for projects. A Project Planning Number (PPNO) is an identification number assigned by Caltrans District offices for all STIP and bond projects.
1D
1A1G
1B
1E
1C
1F
1H
Caltrans | Cal-B/C 6.2 AT Model User’s Guide
hdrinc.com 201 California Street, Suite 1500, San Francisco, CA 94111-5002 (415) 546-4200
8
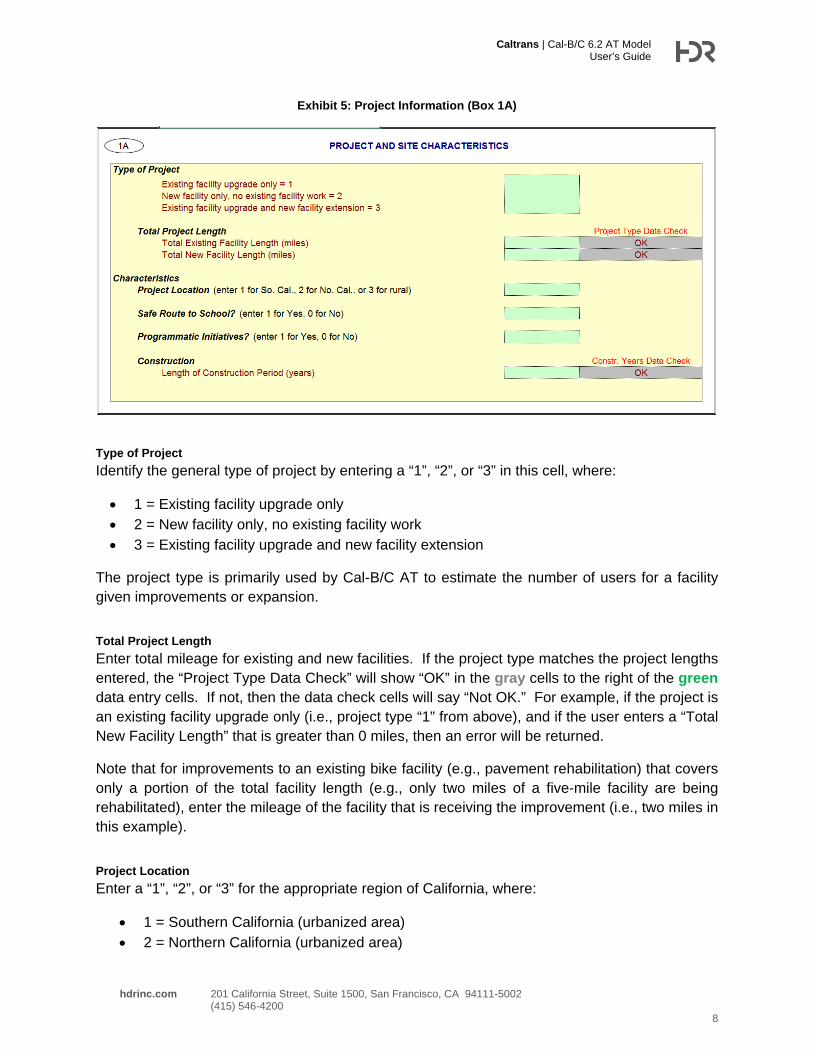
Exhibit 5: Project Information (Box 1A)
Type of Project Identify the general type of project by entering a “1”, “2”, or “3” in this cell, where:
• 1 = Existing facility upgrade only • 2 = New facility only, no existing facility work • 3 = Existing facility upgrade and new facility extension
The project type is primarily used by Cal-B/C AT to estimate the number of users for a facility given improvements or expansion.
Total Project Length Enter total mileage for existing and new facilities. If the project type matches the project lengths entered, the “Project Type Data Check” will show “OK” in the gray cells to the right of the green data entry cells. If not, then the data check cells will say “Not OK.” For example, if the project is an existing facility upgrade only (i.e., project type “1” from above), and if the user enters a “Total New Facility Length” that is greater than 0 miles, then an error will be returned.
Note that for improvements to an existing bike facility (e.g., pavement rehabilitation) that covers only a portion of the total facility length (e.g., only two miles of a five-mile facility are being rehabilitated), enter the mileage of the facility that is receiving the improvement (i.e., two miles in this example).
Project Location Enter a “1”, “2”, or “3” for the appropriate region of California, where:
• 1 = Southern California (urbanized area) • 2 = Northern California (urbanized area)

Caltrans | Cal-B/C 6.2 AT Model User’s Guide
hdrinc.com 201 California Street, Suite 1500, San Francisco, CA 94111-5002 (415) 546-4200
9
• 3 = Rural (non-urbanized area).
This information is used to estimate the percent of daily bicycle and pedestrian trips taken for different trip purposes (i.e., commute, recreational, other) in Box 1D for the “No Build” scenario. The “No Build” scenario is the base case under which no project is implemented. [Note: Benefits calculated by Cal-B/C AT are the differences in impacts for a future time which the project is built (i.e., the “Build” scenario) and the No Build scenario.]
The project location is also used by Box 1D to estimate the average distance per trip for SRTS and other trips for both cyclists and pedestrians. Box 1D reports on mode-specific trip characteristics for walking and cycling for a new or existing facility. Reported default values on trip purpose by percentage of total and average distance traveled per trip are provided. Separate trip distances are provided for children and can be used as default values for SRTS initiatives. Other default values (e.g., ages of users, diversion of riders from personal vehicles, and traveling speeds) are included in the Parameters worksheet.
Exhibit 6 illustrates how the No Build Box 1D is updated by referencing the data input in the Project Location cell. In that exhibit, if the user enters a “2” for a project in an urbanized area of Northern California, the appropriate cell in Box 1D looks up the appropriate value in the Parameters worksheet. (Please see Volume 4 of the Technical Supplement for details regarding these and other parameters used in Cal-B/C AT.)
Exhibit 6: Project Information (Box 1D)
1D GENERAL USER CHARACTERISTICS (BASED ON PROJECT LOCATION)
Cycling
Trip Purpose No Build Build
Commuting Trip Purpose (%) 11% 11%Recreational Trip Purpose (%) 13% 13%Other Destinations Trip Purpose (%) 76% 76%
General Trip CharacteristicsOverall Average Distance Traveled / Trip (mi) 2.21 2.21Children - SRTS - Distance Traveled / Trip (mi) 1.10 1.10
PedestrianTrip Purpose
Commuting Trip Purpose (%) 9% 9%Recreational Trip Purpose (%) 10% 10%Other Destination Trip Purpose (%) 81% 81%
General Trip CharacteristicsOverall Average Distance Travelled / Trip (mi) 0.77 0.77Children - SRTS - Distance Traveled / Trip (mi) 0.59 0.59
1A PROJECT AND SITE CHARACTERISTICS
Type of Project
1
Total Project Length Project Type Data CheckTotal Existing Trail Length (miles) Not OKTotal New Trail Length (miles) OK
CharacteristicsProject Location (enter 1 for So. Cal., 2 for No. Cal., or 3 for rural) 2
Safe Route to School? (enter 1 for Yes, 0 for No)
Programmatic Initiatives? (enter 1 for Yes, 0 for No)
Construction Constr. Years Data CheckLength of Construction Period (years) OK
Existing trail upgrade only = 1 New trail only, no existing trail work = 2Existing trail upgrade and new trail extension = 3
2
Box 1A
Box 1DUser types in “2” for urban Northern California in Box 1A
Urban Northern California is referenced in the parameters worksheet (see cell range AG58:AI76)
Appropriate cell is updated in Box 1D in the No Build scenario

Caltrans | Cal-B/C 6.2 AT Model User’s Guide
hdrinc.com 201 California Street, Suite 1500, San Francisco, CA 94111-5002 (415) 546-4200
10
Note that the blue cells in Box 1D indicates cells that can be manually overwritten by the user if data better than the default values provided in the Parameters worksheet are available. However, if the user changes the percentages, they must total to 100 percent.
As a default, the “Build” or with project values are assumed to be the same as the “No Build” values. However, the user is free to override any values in this box should better estimates be available for the project under analysis.
Safe Route to School Enter either a “0” or a “1” to indicate if the project involves a Safe Route to School, where
• 0 = No, the project does not involve a SRTS • 1 = Yes, the project does involved a SRTS.
This information is used to evaluate the journey quality and intersection delay impacts of projects.
Programmatic Initiatives Enter either a “0” or a “1” to indicate whether the project includes any non-infrastructure, programmatic initiatives, where
• 0 = No, the project does not involve non-infrastructure, programmatic initiatives • 1 = Yes, the project does involved these additional initiatives.
This information is used to activate the features of the Non-Infrastructure Program Information worksheet that reports non-infrastructure program implementation impact scores for cyclists and pedestrians. That worksheet and its results are discussed in sections below.
Construction Insert the number of construction years before benefits begin. This must be a whole number (round to the next higher integer for a conservative estimate of the years). The number of years should correspond with the cost data entered in Boxes 1F and 1G. For example, if the construction of a bike facility is expected to take two years, there should be two years of construction cost data in Boxes 1F and 1G.
As with the mileage entered above, the “Construction Years Data Check” will return “OK” in the gray cells to the right of the green data entry cells if the construction years equal the number of years with construction cost data in Boxes 1F and 1G.
EXISTING SEGMENT IMPROVEMENTS AND TRIP VOLUME (BOX 1B)/NEW FACILITY IMPROVEMENTS AND TRIP VOLUME (BOX 1E) Box 1B is where the user enters information about improvements to an existing facility. Box 1E is similar to Box 1B. However, Box 1E is where data is entered for a newly constructed facility. Exhibit 7 shows boxes 1B and 1E.

Caltrans | Cal-B/C 6.2 AT Model User’s Guide
hdrinc.com 201 California Street, Suite 1500, San Francisco, CA 94111-5002 (415) 546-4200
11
Exhibit 7: Existing/New Improvements and Trip Volumes (Boxes 1B/1E)
Existing Facility Length Enter lengths for each class of bike facility, where appropriate, for the existing segment (Box 1B) and for any improvements (Box 1E). Note that Box 1E does not have a location to enter “No Build” values since this box is for entering information for a proposed facility to be constructed in the future.
Cal-B/C AT recognizes the four classes of bicycle facilities:
I. Bike Paths II. Bike Lanes
III. Bike Routes IV. Separated Bikeways/Cycle Tracks.
The sums of the facility lengths in the No Build and Build scenarios should equal the total length of existing facility in Box 1A. If the total miles are entered correctly, and match mileage of potentially different bike facility classes, the data entry indicators will read “OK.” Otherwise, the adjacent gray cell will read “Not OK.”
Note bicycle classifications in the Red colored cells cannot be changed.
Pedestrian Improvements Indicate if the project design includes one or more pedestrian elements by entering a “1” in the appropriate locations. These features are assumed to be located throughout the bike facility so all facility users will have the opportunity to use them.

Caltrans | Cal-B/C 6.2 AT Model User’s Guide
hdrinc.com 201 California Street, Suite 1500, San Francisco, CA 94111-5002 (415) 546-4200
12
The elements or features of the existing segment include:
• Street lighting • Curb level • Crowding • Pavement evenness • Information panels • Benches • Directional signage.
Trip Data Enter the current number of one-way trips and the expected annual growth rate in trips in the No Build and Build scenarios for both cyclists and pedestrians. These parameters are used to estimate trips in the first year after construction (depending on the expected number of years until construction is completed) and 20 years after construction. Growth rates are calculated using the compound annual growth rate (CAGR) formula. This growth rate is illustrated in Exhibit 8.
Blue cells can be overwritten if better data are available (e.g., an expectation that demand jumps in the first year of operations).
Exhibit 8: Daily Trip Growth Rate Estimation
INTERSECTIONS IMPROVEMENTS – TIME SAVINGS AND ACCIDENT REDUCTION (BOX 1C) Improvements at existing intersections between bike facilities and roadways can generate benefits from time savings by avoiding delays and from reduced crashes. This section allows the user to enter the data required to estimate these benefits. Box 1C is shown in Exhibit 9.
Ope
ning
Day
20-Year LifecycleConstructionPeriod
CurrentDailyTrips
Years from Opening Day
Year 20 Daily Trips(post-construction)
Year 1 Daily Trips(post-construction)
Daily
Trip
s

Caltrans | Cal-B/C 6.2 AT Model User’s Guide
hdrinc.com 201 California Street, Suite 1500, San Francisco, CA 94111-5002 (415) 546-4200
13
Exhibit 9: Intersection Improvements (Box 1C)
Reduced Delay Due to Intersection Improvements These data are used to compute the number of intersections crossed by users (based on average trip lengths discussed in Box 1D) and the reduced delay at intersections.
Improvements can include signals for users as well as bridges for bike facilities over roadways. The average number of intersections crossed is computed from the number of intersections improved and average distance per trip.
First, enter the number of improved intersections along the bike facility.
1C INTERSECTION IMPROVEMENTS - TIME SAVINGS AND ACCIDENT REDUCTION DATA
Reduced Delay Due to Intersection ImprovementsTime Savings Parameters
Number of Improved IntersectionsTime Savings per Improved Intersection (min.)Intersection improvements on SRTS? (enter 1 for Yes, 0 for No)
Accident Rate - Current Conditions
Cyclists Count (No.) Rate per YearNumber of Years of Data
Existing ConditionsTotal Number of Accidents (Tot) 0 0.0Number of Fatal Accidents (Fat) 0.0Number of Injury Accidents (Inj) 0.0Number of \Property Damage Only (PDO) Accidents 0.0Annual Growth Rate in Accidents (%/year) 0
Pedestrians Count (No.) Rate per YearNumber of Years of Data
Existing ConditionsTotal Number of Accidents (Tot) 0 0.0Number of Fatal Accidents (Fat) 0.0Number of Injury Accidents (Inj) 0.0Number of \Property Damage Only (PDO) Accidents 0.0Annual Growth Rate in Accidents (%/year) 0
Safety Countermeasures (improvements to existing facilities only)
Signalized Intersection Yes =1Pedestrian Countdown Signal HeadsPedestrian CrossingAdvance Stop Bar before CrosswalkInstall Overpass/Underpass
Unsignalized IntersectionRaised Medians/Refuge IslandsPedestrian Crossing (new signs and markings only)Pedestrian Crossing (safety features/curb extensions)Pedestrian Signals
Roadways - relevant for pedestrian improvements, such as sidewalksSidewalk/Pathway (to avoid walking along roadway)Pedestrian Crossing (with enhanced safety features)Pedestrian Crossing
Other Reduction Factor Countermeasures
Caltrans | Cal-B/C 6.2 AT Model User’s Guide
hdrinc.com 201 California Street, Suite 1500, San Francisco, CA 94111-5002 (415) 546-4200
14
Estimate the time savings in minutes at each improved intersection. This analysis will need to be performed outside of Cal-B/C AT and based on intersection traffic conditions and the crossing characteristics of the existing bike facility.
Indicate if the intersection improvements occur for children as part of an SRTS initiative.
Accident Rates – Current Conditions For existing facilities with explicit safety improvements, enter five-year average data for accidents involving cyclists or pedestrians. Baseline data should indicate the number of fatality, injury, and property damage only (PDO) accidents.
If available, data on the annual percent growth in accidents should be provided. Annual accident rates are determined based on the years available, if other than five years.
Improvements at intersections can take several forms (e.g., signals and lane markings). Each improvement provides a different accident reduction rate. The three most effective measures are used to estimate reductions in accidents and the associated monetized benefits.
Provide baseline accident rates for crashes involving cyclists and pedestrians in terms of:
a. Number of Years of Data b. Fatal Accidents (Fat) (#) c. Injury Accidents (Inj) (#) d. PDO Accidents (#) e. Annual Growth Rate in Accidents (%).
Safety Countermeasures (improvements to existing facilities only) Indicate which countermeasures are included in the facility improvement by entering a “1” in each green cell with that particular countermeasure. The available countermeasures include:
• Signalized Intersection o Pedestrian Countdown Signal Heads o Pedestrian Crossing o Advance Stop Bar before Crosswalk o Install Overpass/Underpass
• Unsignalized Intersection o Raised Medians/Refuge Islands o Pedestrian Crossing (new signs and markings only) o Pedestrian Crossing (safety features/curb extensions) o Pedestrian Signals
• Roadways – relevant for pedestrian improvements, such as sidewalks o Sidewalk/Pathway (to avoid walking along roadway) o Pedestrian Crossing (with enhanced safety features) o Pedestrian Crossing
• Other Reduction Factor Countermeasures.

Caltrans | Cal-B/C 6.2 AT Model User’s Guide
hdrinc.com 201 California Street, Suite 1500, San Francisco, CA 94111-5002 (415) 546-4200
15
INFRASTRUCTURE PROJECT COSTS (BOX 1F)/NON-INFRASTRUCTURE PROGRAM COSTS (BOX 1G) These boxes allow the user to input costs for infrastructure projects and non-infrastructure programs and is shown in Exhibit 10.
Exhibit 10: Project Costs (Box 1F/1G)
1F
Col. no.
TOTAL COSTS (in dollars)
Year Construction Project Maint./ Constant PresentYears Support R / W Construction Op. Rehab. Dollars Value
Infrastructure Program Costs1 0 <-- Must enter a cost $0 $02 0 0 03 0 0 04 0 0 05 0 0 06 0 0 07 0 0 08 0 0 0
Annual Infrastructure O&M Costs1 $0 $02 0 03 0 04 0 05 0 06 0 07 0 08 0 09 0 0
10 0 011 0 012 0 013 0 014 0 015 0 016 0 017 0 018 0 019 0 020 0 0
Total $0 $0 $0 $0 $0 $0 $0
Total
1G
Year Construction Project Maint./ Constant PresentYears Support R / W Construction Op. Rehab. Dollars Value
Non-Infrastructure Program Costs1 <-- Must enter a cost $0 $02 0 03 0 04 0 05 0 06 0 07 0 08 0 0
Annual Non-Infrastructure O&M Costs1 $0 $02 0 03 0 04 0 05 0 06 0 07 0 08 0 09 0 0
10 0 011 0 012 0 013 0 014 0 015 0 016 0 017 0 018 0 019 0 020 0 0
Total $0 $0 $0 $0 $0 $0 $0
Total ATP REQUESTED FUNDS
PROGRAM COSTS AND REQUESTED FUNDS (enter in thousands of dollars)
DIRECT PROJECT COSTSINITIAL COSTS SUBSEQUENT COSTS TOTAL COSTS (in dollars)
PROJECT COSTS AND REQUESTED FUNDS (enter in thousands of dollars)
ATP REQUESTED FUNDS
INITIAL COSTS
DIRECT PROJECT COSTS
SUBSEQUENT COSTS

Caltrans | Cal-B/C 6.2 AT Model User’s Guide
hdrinc.com 201 California Street, Suite 1500, San Francisco, CA 94111-5002 (415) 546-4200
16
Total project costs should be entered in the years they are expected to occur. Costs should be included for the construction period and for a subsequent a 20-year operating period after construction or program implementation has been completed.
Construction Year 1 is the first year that any capital costs are incurred. Note that all costs should be in thousands of dollars.
For both boxes, input the project’s initial costs in constant dollars for project development, right-of-way (R/W), and construction. The number of construction years should equal the length of the construction period as described in the discussion for Box 1A.
Following construction or implementation, there will be ongoing, incremental maintenance, operating, and rehabilitation costs. These also need to be enter in constant dollars for each of the 20 years after the project or program is open. Include any additional costs that are not already captured in the data entry.
DATA CHECKS - PROJECT LENGTH, DAILY TRIPS (BOX 1H) This section provides data checks to make sure that data are entered correctly. An example is shown in Exhibit 11. The user does not need to enter anything in this table. The data checks evaluate No Build and Build project lengths for each type of relevant project (e.g., new and existing facilities). All of these cells should read “OK.” Errors indicate that prior inputs should be modified.
Exhibit 11: Data Checks (Box 1H)
4.1.2 Non-Infrastructure Program Information Worksheet Non-infrastructure programs are intended to reach target audiences through a variety of outreach and training mechanisms. The Non-Infrastructure Program Information sheet collects information about the proposed initiative and applies a scoring framework to determine the overall program score per cost. This worksheet is shown in Exhibit 12.

Caltrans | Cal-B/C 6.2 AT Model User’s Guide
hdrinc.com 201 California Street, Suite 1500, San Francisco, CA 94111-5002 (415) 546-4200
17
Exhibit 12: Non-Infrastructure Project Information Worksheet (Box 1I)
The impact score is based on the number of people reached who are not currently using active transportation. The model uses four criteria to assess the effectiveness of the initiative, each with a different measure of relative value. The criteria have equal weights. The scoring system is designed to provide a maximum potential score of 1.0, with values ranging as percentages from 0% to 100%. The percentage is applied to the number of currently non-active transportation mode users, to develop a total program impact score.
Program costs should be entered in Box 1G the Project Information sheet (discussed above). If a proposed program does not include capital investments, the anticipated impact on user demand from the program can be entered as trip volumes in Box 1B. If the program is combined with an infrastructure project, it is assumed that the demand impact is already captured by the infrastructure project.
To avoid overestimating demand, no additional demand from the program alone should be included in the Project Information sheet. Non-infrastructure initiatives are assumed to stimulate demand and safety for 20 years. If this is not the case, adjustments should be made for the appropriate number of years in each benefit calculation page. In this case, the project type should be set to “1” to reflect the use of existing facilities only.
4.2 Model Inputs Worksheet The Model Inputs worksheet contains information about annual cycling and pedestrian annual trips, number of facility users, and annual mileage. This worksheet allows users to check the data estimated by the model and override those values if better data are available. The user does not have to make any changes in this worksheet for Cal-B/C AT to produce results. Exhibit 13
1I NON-INFRASTRUCTURE PROGRAM CHARACTERISTICS
Programmatic Initiatives? No
Scale of InitiativeParticipants / Beneficiaries Data Check on Initiative
Numbers of People Reached per Year OKAverage Percentage of Current Active Bicyclists Reached per YearAverage Percentage of Current Active Pedestrians Reached per Year
Scoring CriteriaTotal Number of Criteria 4Total Criteria Weight Sum 100%
Criteria Weight1) Target Audience 25%
Indicators (mark as %; sum must equal 100%) Indicator WeightYounger than 10 ` 10%10-12 20%13-24 25%25-55 15%55+ 5%
Indicator-Weighted Score Sum must equal 100%
Criteria Weight2) Characteristics Promotional Effort 25%
Indicators (enter 1 for Yes on all that apply) Indicator WeightEffort Targets 5 E's or 5 P's 5%Knowledgeable Staff/Educator 5%Partnership/Volunteers 5%Creates Community Ownership/Relationship 5%Part of Bigger Effort (e.g., political support) 5%
Indicator-Weighted Score 0
Criteria Weight3) Type of Impact and Messaging 25%
Indicators (enter 1 for Yes on all that apply) Indicator WeightOutreach is Hands-on (self-efficacy) 5%Overcome Barriers (e.g., dist., time, etc.) 5%Eliminates Hazards/Threats (speed, crime, etc.) 5%Connected or Addresses Connectivity Challenges 5%Creating Value in Using Active Transportation 5%
Indicator-Weighted Score 0
Criteria Weight4) Frequency of Outreach Effort 25%
Indicators (enter 1 for Yes for only one option) Indicator WeightOne Day 5%One Month 10%One Year 15%Multiple Years 20%Continuous Effort 25%
Indicator-Weighted Score 0
Projected New Active Transportation CyclistsNumber of Potential New Trail Users 0Weighted Impact Score of OutreachProgram Impact ScoreYears of Outreach 0.0Multi-year Program Impact Score
Cost EffectivenessTotal Discounted Cost $0Cost per Program Impact Score
Projected New Active Transportation PedestriansNumber of Potential New Trail Users 0Weighted Impact Score of OutreachProgram Impact ScoreYears of Outreach 0.0Multi-year Program Impact Score
Cost EffectivenessTotal Discounted Cost $0Cost per Program Impact Score

Caltrans | Cal-B/C 6.2 AT Model User’s Guide
hdrinc.com 201 California Street, Suite 1500, San Francisco, CA 94111-5002 (415) 546-4200
18
illustrates some of the key features of the Model Inputs worksheet. Exhibit 14 summarizes the boxes used to input information in the worksheet.
Exhibit 13: Model Input Worksheet
Exhibit 14: Model Input Boxes
Data Entry Boxes Location/ Cell Range
2A/(2E) Existing Facility Segment - Cycling/(Pedestrian) B2:K54/ (M2:V54)
2B/(2F) New Facility Segment - Cycling/(Pedestrian) B57:K109 / (M57:V109)
2C/(2G) New Safe Routes To School - Cycling/(Pedestrian) B111:K137/ M111:V137
2D/(2H) Existing Safe Routes To School - Cycling/(Pedestrian) V139:K168/ (M139:V168)
Although this worksheet contains a lot of information, it is structured to facilitate updates. The left columns in the worksheet (columns “B” through “K”) are used to modify data about cyclists and the columns “M” through “V” are for entering information about pedestrian travel.
Each box allows information to be entered for one of three bike facility types: Existing Segments, New Facilities, and SRTS Facilities. Within each box the inputs are arranged according to scenario (i.e., “No Build”, or “Build”), and then by model year (i.e., Year 1 after project opening, and Year 20 after project opening).
Cycling Information Pedestrian Information
• Scenario(No Build, Build)• Year(Year 1, Year 20)
Data by Trip Type• Annual Trips• Users (Annual trips/#unlinked trips per day /365 days per year)• Total Miles (Annual Trips * Avg. Trip Dist.)
Cal B/C estimated values based on Project
Information user inputs
User Overrides, if needed
Data used to calculate benefits

Caltrans | Cal-B/C 6.2 AT Model User’s Guide
hdrinc.com 201 California Street, Suite 1500, San Francisco, CA 94111-5002 (415) 546-4200
19
The blue cells in columns “F” and “Q” are calculated by Cal-B/C. The green cells (columns “G” and “R”) can be edited by the user if better data are available, and the gray un-editable cells (columns “H” and “S”) are the values used by Cal-B/C to calculate benefits. The gray cells are updated by default using the value in the blue cells unless the user makes a change in the green cells.
Data are provided for each of the three user trip types: Commuter, Recreational, and Other. The data that can be updated in the Model Inputs worksheet are:
Annual Trips are the total number of cycling or walking trips per year by user trip type. Annual trips are based on the current daily trips input by the user in the Project Information worksheet. In that worksheet, current trips are projected to Year 1 and Year 20 daily trips by using the projected annual growth rate (see Exhibit 8 and related discussion on Box 1B in Section 4.1.1 for an illustration of this growth).
These new total daily projections are then multiplied by the percent of each trip type (e.g., commute) from the Project Information worksheet in Box 1D. They are also multiplied by the average number of days cycling, walking or number of school days per year. The average days can be found in the Active Transportation Parameters section of the Parameters worksheet (cell range R17:W22).
Annual Users are the total number of users of a facility per year, including either pedestrians or cyclists. Since users often make a number of separate unlinked trips in one journey, it is necessary to divide the number of trips by the number of unlinked trips to estimate the number of users. In addition, annual trips represents a single person’s trips over an annual period, so it is necessary to divide annual trips by the number of days per year. As such, Cal-B/C AT calculates the number of users by dividing annual trips by the number of unlinked trips and 365, for the number of days per year (and corresponds ultimately to the CA Statewide Travel Survey data on user characteristics). The number of unlinked trips for cyclists and pedestrians can also be found in the Parameters worksheet (cell range T31:U32).
Annual Miles are the total annual miles ridden or walked by trip-makers. This value is calculated in the Model Inputs worksheet by taking the total annual trips described above and multiplying that value by the average trip distance taken. The average trip distance can be found in Box 1D of the Project Information worksheet.

Caltrans | Cal-B/C 6.2 AT Model User’s Guide
hdrinc.com 201 California Street, Suite 1500, San Francisco, CA 94111-5002 (415) 546-4200
20
4.3 Results Worksheet The final worksheet covered in this User’s Guide is the Results Worksheet. This is where Cal-B/C outputs the results of the benefit-cost assessment. Exhibit 15 shows an example of this output.
Exhibit 15: Results Worksheet - Final Model Output
The bottom of the Results worksheet includes a toggle to select whether benefits for recreational users are included in the analysis. A more detailed breakdown of the results by year and benefit type is available on the Final Calculations sheet.
Cal-B/C provides several summary results, which highlight different aspects of an AT infrastructure project:
• Life-Cycle Costs are the present values of all net project costs, including initial and subsequent costs in real current dollars.
• Life-Cycle Benefits are the sum of the present value of benefits for the project.

Caltrans | Cal-B/C 6.2 AT Model User’s Guide
hdrinc.com 201 California Street, Suite 1500, San Francisco, CA 94111-5002 (415) 546-4200
21
• Net Present Value equals the lifecycle benefits minus the lifecycle costs. The value of benefits exceeds the value of costs for a project with a positive net present value.
• Benefit/Cost Ratio shows the benefits relative to the costs of a project. A project with a benefit-cost ratio greater than one has a positive economic value.
• Rate of Return on Investment is the discount rate at which benefits and costs are equal. For a project with a rate of return greater than the discount rate, the benefits are greater than costs and the project has a positive economic value. The user can use rate of return to compare projects with different costs and different benefit flows over different time periods. This is particularly useful for project staging.
• Payback Period is the number of years it takes for the undiscounted net benefits (lifecycle benefits minus lifecycle costs) to equal the initial construction costs. For a project with a payback period longer than the project lifecycle, initial construction costs are not recovered. The payback period varies inversely with the benefit-cost ratio. A shorter payback period yields a higher benefit-cost ratio.
At present, methods and data are not sufficiently developed to accurately estimate the economic value of AT non-infrastructure programs, so Cal-B/C AT includes non-infrastructure program implementation impact scores for bicycle and pedestrian programs.
The effectiveness of these programs depends on many characteristics, such as the knowledge of staff, extent of outreach effort, duration of program, and direct linkage to specific AT facilities or networks. Cal-B/C AT assumes that projects with accompanying AT non-infrastructure programs have a qualitatively higher level of value than a similar project without such programs, but Cal-B/C AT does not monetized these as benefits.
The impact scores are influenced by the number of people reached who are not currently using active transportation. In addition, four program performance criteria are established to assess the effectiveness of the initiative, each with different measures of relative value that are reported in the Non-Infrastructure Project Information worksheet.
For infrastructure benefits that can be monetized, Cal-B/C provides five itemized benefits:
• Journey Quality represents the primary value of mobility gained by active transportation users and can be derived from their sense of journey ambiance, ease of use, and feeling of safety (from vehicles). Higher values are observed for active transportation facilities with greater separation from conflicting modes, safety features, and aesthetic value. Journey quality can be associated with different trip purposes, including users with a specific destination (e.g. work or school) and those with a purely recreational purpose whose trips begin and end in the same place – so-called “loop” trips.
• Additional Delay Savings represent the reductions in travel time for cyclists or pedestrians where a bike facility crosses improved highway intersections. These delay savings are in addition to those included in the journey quality measure.

Caltrans | Cal-B/C 6.2 AT Model User’s Guide
hdrinc.com 201 California Street, Suite 1500, San Francisco, CA 94111-5002 (415) 546-4200
22
• Additional Safety Benefits occur when accident rates decline because drivers shift to cycling or walking simply because there are fewer cars on the road. Other safety benefits occur when accident risk are reduced at improved highway intersections. Developing reasonable estimates of these benefits depends on the availability of local data on accident rates in the corridor where an active transportation project is implemented. The economic value of a change in accident rates is estimated with an average cost per accident severity.
To estimate the impact of a transportation project on accident costs, Cal-B/C compares accident costs under two scenarios: with the project and without the project. Accident costs are compared over the lifetime of the project, which is assumed to be twenty years. Accident benefits are summed over the twenty-year period to derive the total impact. Individual projects may improve or adversely impact vehicle accidents, so the net result may be positive or negative.
• Health Benefits present the benefits from reduced absenteeism and mortality due to physical activity that can reduce short-term sick leave by at least six percent. Mortality benefits represent a reduction in the relative risk of death for users due to improved health conditions. The estimated reduction in risk for cycling and walking activity has been parameterized in a simplified form that is based on the distance traveled by mode. For cycling, there is a 4.5% reduction in risk for every 365 miles traveled per year. For walking, the annual risk reduction per 365 miles traveled is 9%. In addition, risk reduction is maximized at 30% for cycling and 45% for walking.
• Emission Cost Savings report the public benefits of reduced vehicle use due to shifts of travelers to active transportation that reduces the externalities of air emissions. Cal-B/C AT applies methods consistent with other Cal-B/C tools to measure these benefits.
Below the itemized project benefits, Cal-B/C displays:
• Person-Hours of Time Saved shows the reduction in person-hours of travel time due to the project. A positive value indicates a net benefit.
• Emissions Reduction shows the itemized change in emissions for CO, CO2, NOX, PM10, PM2.5, SOX, and VOC. A positive value indicates a reduction in emissions, while a negative value indicates an increase in emissions. The change in emissions are reported in tons and millions of dollars. PM2.5 is reported only in tons because a generally accepted economic value was not available at the time of the model update.
Cal-B/C AT also lists benefits specific to safe routes to school (SRTS) projects. These benefits are a subset of the itemized benefits and included in the total benefits for the project:
• Journey Quality • Additional Delay Savings • Additional Safety Benefits.

Caltrans | Cal-B/C 6.2 AT Model User’s Guide
hdrinc.com 201 California Street, Suite 1500, San Francisco, CA 94111-5002 (415) 546-4200
23
APPENDIX A: PROJECT EXAMPLE
UPGRADE EXISTING FACILITY AND CONSTRUCT NEW MULTI-USE TRAIL
For this example, let’s assume that we want to upgrade an existing 4-mile Class III bike route in Santa Barbara in Southern California to a Class II bike lane, but we also want to connect this lane with a new 2 mile to a fully-separated, paved multi-use Class I facility to better integrate an elementary school to the local neighborhood as part of a larger Safe Routes to School (SRTS) program.
As part of this program, we are going to add amenities to the existing location (e.g., lighting, pavement improvements, signage) to improve the quality of travel along the facility. We are also going to improve an arterial intersection along the path. Finally, as part of the overall program, we will provide two years of outreach to the school and to the general community.
STEP 1: Input Project Data into Infrastructure Project Information Worksheet
All data entry for project analysis begins in the “Project Info” worksheet tabs. There are two tabs: 1a) Project Info, and 1b) Non-Inf Program Info. The first worksheet is where infrastructure construction information, existing user volumes and future forecasts, user characteristics, and accident information is input. Project construction and on-going program related costs are also entered into this worksheet.
The second worksheet is where non-infrastructure related information is inputted to evaluate the potential effectiveness of community outreach to encourage the use of active transportation modes and to inform the school-age children, university students, and the general public about -the benefits of using the multi-use facilities. The information inputted is used to calculate a “Cost per Program Impact” score. The project data entry can be done in the following steps:
(1) Project and Site Characteristics (Box 1A). Enter the information as shown in Exhibit A-1 below. In our example, we are upgrading a 4-mile existing facility, and constructing a new 2 mile facility. Therefore, type a “3” in the green-colored Type of Project cell to indicate an “existing facility upgrade and new facility extension”. Remember that green cells are for user data entry, but you can leave a green cell empty and Cal-BC will interpret that empty cell as a “0”.
In the Total Project Length cells, type in the existing and new mileage as shown in the exhibit. The gray boxes provide a quality control check to ensure that distances entered are consistent throughout Cal-BC. This box will initially indicate “Not OK”, until you enter in the project lengths in the “No Build” and “Build” facility improvement location in boxes 1B and 1E. These boxes will be discussed as part of the next step below. Once all project data are inputted, you should review these data check boxes to make sure they give you the “OK”.
This project takes place in Southern California, so type a “1” in the Project Location cell. This will be used to calculate the emissions benefits of the project given that air pollution differs by region of California due to different ambient air conditions.
Since this is a SRTS project, type a “1” in the Safe Routes to School box. This will be used to calculate the benefits of that program to school-age children using the facility to commute to school.

Caltrans | Cal-B/C 6.2 AT Model User’s Guide
hdrinc.com 201 California Street, Suite 1500, San Francisco, CA 94111-5002 (415) 546-4200
24
We will include public outreach as part of this program, so type a “1” in the Programmatic Initiatives box.
Finally, enter the total construction period in whole years. Round up to the next nearest year. For example, if the construction period is actually going to take 18 months, or 1½ years, then round up to two years. This is used to estimate the Year 1 and Year 20 forecasts for user volumes, which will be used to estimate user benefits in future years. Please refer to Exhibit 8 in the User’s Guide above to see an illustration of how the construction year is used in forecasting volumes.
Exhibit A-1: Project and Site Characteristics
(2) Existing and New Facility Improvements and Trip Volumes. These two boxes, 1B and 1E, are where you enter the existing facility and new facility distances under the “No Build” (i.e., no new project will be constructed) and the “Build” (i.e., future improvements will be implemented) scenarios.
You also input a “1” to indicate if any pedestrian amenities, safety features, or journey quality enhancements will be included in the project. Finally, you enter existing and future volumes for adult/children pedestrians and bicyclists.
In our project, we are going to improve the existing one-mile Class I facility. Therefore, in the Existing Facility Length cell input a “1” for both the “No Build” and the “Build” cases. As mentioned above, the gray box will tell you if the distances are consistent.

Caltrans | Cal-B/C 6.2 AT Model User’s Guide
hdrinc.com 201 California Street, Suite 1500, San Francisco, CA 94111-5002 (415) 546-4200
25
Exhibit A-2: Existing and New Facility Improvements and Trip Volumes
Existing Segment (Box 1B)
For our project, let’s assume that we are going to repave the path as part of the upgrade to improve the pavement evenness on our existing facility. We will also add lighting and directional signage as additional amenities. Type a “1” in the appropriate cells in the “Build” scenario column as shown in Exhibit A-2 above. Do not put anything in the “No Build” column since we will not be making any improvements under a “No Build” or base case.
We will need to break out existing bicycle and pedestrian demand into “adults” and “children”. Unless existing data are available, this step will require manual counts to be performed as part of the analysis.
In our case, we counted 151 current adult bicyclists and 18 children using the bike lane on an average day. Since this is a bike lane, we didn’t count any adult pedestrians. However, we did find 24 intrepid elementary school students who walked to school adjacent to the bike lane.
For the existing segment (box 1B), we expect low growth to occur under the “No Build” scenario, on the order of 0.50% per year since the facility is currently not conducive to growth in users. However, let’s assume that if we upgrade the existing location from a Class III to a Class II bike lane, this will encourage more cyclists to use the facility, particularly school children whose parents believe that the new improvements will make them safer (In our example we will also make safety improvements to an intersection that may also enhance safety, which will be discussed below). Type the growth percentages in the appropriate cells (Exhibit 8 above shows how growth is forecasted in Cal-BC AT).
Note that the blue cells are calculated cells, but these can be overwritten if you have better growth forecasts from another source. Say, for example, you performed a more detailed user forecast outside Cal-BC and have estimates of pedestrian and bicycle volumes. Also, if you have more detailed results you can also enter those existing and forecast volumes in the “2) Model Inputs” worksheet tab.

Caltrans | Cal-B/C 6.2 AT Model User’s Guide
hdrinc.com 201 California Street, Suite 1500, San Francisco, CA 94111-5002 (415) 546-4200
26
New Segment (Box 1E)
For our newly constructed segment, we are going to build 2 miles of Class I multi-use facility, so type that in the appropriate cell under the Bike Paths (miles) section as shown in Exhibit A-2 above. Note that the gray cell will show an “OK” if the lengths are consistent between Box 1E and Box 1A as illustrated in Exhibit A-2, above.
For our project, let’s assume that our bike/ped counts indicate that 100 adult cyclists traverse arterials along this segment. Also, let’s assume the same number of children ride and walk (18 and 24, respectively) along this new segment on their way to school. However, along the new 2 mile segment we also estimated that 75 adult pedestrians would potentially use the new facility if it were available today.
On our new “Build” facility, we estimate that annual growth in path use will be around 3% per year because of its improved condition. Type “3%” in the appropriate cells. As discussed above, if you have better forecast volumes, you can type them in the blue cells as needed.
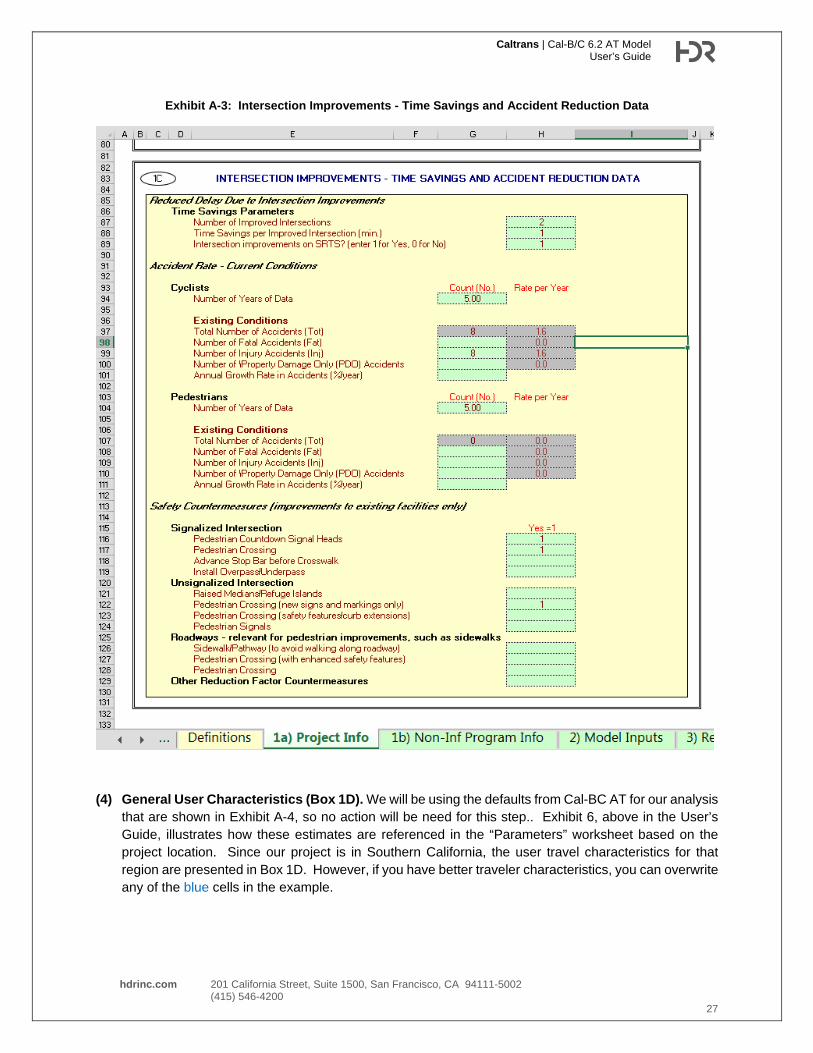
(3) Intersection Improvements - Time Savings and Accident Reduction. Box 1C is used to address any intersection improvements that may done as part of the project. The data to be entered are shown in Exhibit A-3 on the following page.
For our project, we are going to improve a single intersection, so type a “1” in the appropriate cell in the Number of Improved Intersections location. To be conservative, assume that there will be no time savings due to the intersection improvements (since we will not be adjusting signal timings), so type a “0” in the Time Savings… cell. Since this intersection improvement is on a Safe Route to School type a “1” in the SRTS cell.
Cal-BC uses existing accident data and estimates future accident reductions depending on the type of intersection improvement being implemented. Bicycle and pedestrian accident data can be readily obtained from local sources or from the California Highway Patrol (CHP) Statewide Integrated Traffic Records System (SWITRS) website located at https://www.chp.ca.gov/programs-services/services-information/switrs-internet-statewide-integrated-traffic-records-system or from the University of California , Berkeley Transportation Injury Mapping System (TIMS) located at https://tims.berkeley.edu/.
Regardless of the source of incident data, enter the number of years of accident data available in the appropriate cells. In our example, let’s assumed that we downloaded five years of bicycle and pedestrian accident data from SWITRS or TIMS.
In our case, let’s say there were 8 cyclists injured in accidents at our intersection over the past five years (a rate of 1.6 per year, which is shown in the calculated gray cell to the right of the green input cell). Fortunately, we did not experience any pedestrian incidents at our intersection over the past five years.
To mitigate against future accidents, let’s add Pedestrian crossing and countdown signal heads and Pedestrian Crossing (new signs and markings only) as safety countermeasures, so input a “1” in the appropriate places in Signalized Intersection and a “1” in the Unsignalized Intersection sections of Box 1C.
Caltrans | Cal-B/C 6.2 AT Model User’s Guide
hdrinc.com 201 California Street, Suite 1500, San Francisco, CA 94111-5002 (415) 546-4200
27
Exhibit A-3: Intersection Improvements - Time Savings and Accident Reduction Data
(4) General User Characteristics (Box 1D). We will be using the defaults from Cal-BC AT for our analysis that are shown in Exhibit A-4, so no action will be need for this step.. Exhibit 6, above in the User’s Guide, illustrates how these estimates are referenced in the “Parameters” worksheet based on the project location. Since our project is in Southern California, the user travel characteristics for that region are presented in Box 1D. However, if you have better traveler characteristics, you can overwrite any of the blue cells in the example.

Caltrans | Cal-B/C 6.2 AT Model User’s Guide
hdrinc.com 201 California Street, Suite 1500, San Francisco, CA 94111-5002 (415) 546-4200
28
Exhibit A-4: General User Characteristics
(5) Infrastructure Project Costs (Box 1F). Initial project construction and subsequent on-going maintenance and operating costs are inputted in this location of the worksheet. Cal-BC AT will automatically calculate the constant dollars and net present value for you. Note that costs must be entered in thousands (i.e., $3,000,000 will be entered as 3000). Also note that project support, right of way, and/or construction costs must be entered for each year of the construction period and must match the number entered in Box 1A discussed above. For example, since we indicated earlier that our project would take two years to construct, we must include construction costs for Years 1 and 2 as shown in Exhibit A-5.
For our project, input $500 in the R/W cost cell for construction Year 1. We are also going to spend $2,000,000 on construction in Year 1 and in Year 2, so type a “2000” in each of the appropriate cells.
We anticipate spending approximately $5,000 per year over the next twenty years to maintain our 2.2 miles of active transportation facility as shown by entering a “5” in each year of the Subsequent Costs section of Box 1F. Our total constant dollars to build, operate and maintain this project will be $4.6 million with a present value total cost of $4.5 million shown in the calculated totals at the bottom.

Caltrans | Cal-B/C 6.2 AT Model User’s Guide
hdrinc.com 201 California Street, Suite 1500, San Francisco, CA 94111-5002 (415) 546-4200
29
Exhibit A-5: Infrastructure Project Costs
(6) Non-Infrastructure Program Costs (Box 1G). If we are going to include additional program support through community outreach to educate the public on the benefits of active transportation and to encourage use of the newly upgraded and built facility, then include the costs in the box shown in Exhibit A-6, below. These costs will be used by the “Non-Infrastructure Program Information” worksheet tab to calculate the cost effectiveness of the program.
For our project, let’s assume that we will need $1,000 in Year 1 for program support to initiate the program, so enter a “1” in the appropriate Year 1 cell under “Project Support”. It will cost $5,000 per year for the two-year outreach program. Under subsequent costs type a “5” in each of the Year 1 and Year 2 cells under “Maint./Op.” since these costs will be incurred after the project opens.

Caltrans | Cal-B/C 6.2 AT Model User’s Guide
hdrinc.com 201 California Street, Suite 1500, San Francisco, CA 94111-5002 (415) 546-4200
30
Exhibit A-6: Non-Infrastructure Program Costs
This concludes the activities needed to set up infrastructure and total program costs. It is important to verify any data that has been input. A quick quality summary is provided in Cal-BC AT to ensure that inputs have been accurately entered. Exhibit A-7 shows the data check for our project.
For most active transportation projects this may be the only worksheet that requires data entry. If you have better forecast or model data, the “Model Inputs” worksheet can be used to make any edits for existing or future users. In our example, we will not be discussing the Model Inputs worksheet, but we will be using the “1b) Non-Inf Program Info” worksheet to evaluate the cost effectiveness of our outreach program. This will be discussed in the following section.

Caltrans | Cal-B/C 6.2 AT Model User’s Guide
hdrinc.com 201 California Street, Suite 1500, San Francisco, CA 94111-5002 (415) 546-4200
31
Exhibit A-7: Data Checks
STEP 2: Input Non-Infrastructure Program Information
Worksheet 1b) Non-Inf Program Info is used to evaluate the effectiveness of our outreach program. The information entered in Box 1G described above provides program costs, and this worksheet will be used to input specific program features and anticipated target audiences to identify cost effectiveness impact. Exhibit A-8 shows the inputs for our example for the first three elements of this worksheet. Exhibit A-9 is a continuation of the worksheet and shows the lower part of the worksheet.
1) For our example, assume that we expect to reach 2,500 people during our outreach effort. We expect that through focused targeting we’ll reach around 5% of bicyclists in the area, and around 1% of potential pedestrians.
2) We will focus our efforts on two target audiences: elementary school children and young adults at the local university, so input 45% and 44%, respectively. Enter the other percentages as shown in the exhibit. Make sure that the totals equal 100%.
3) Our messaging efforts will focus on three areas, so input a “1” for the following target promotional areas: • 5 E’s (Education, Enforcement, Encouragement, Engineering, Evaluation) and the 5Ps
(Preparation, Promotion, Programs, Policy, and Physical Projects) • Knowledgeable Staff/Educator (to better reach the elementary school students and parents in
our example project) • Creates Community Ownership/Relationship (emphasizing the integration of the local
community.

Caltrans | Cal-B/C 6.2 AT Model User’s Guide
hdrinc.com 201 California Street, Suite 1500, San Francisco, CA 94111-5002 (415) 546-4200
32
Exhibit A-8: Non-Infrastructure Program Characteristics (Part 1)
4) Exhibit A-9 shows the last input section for the worksheet. As indicated in the non-infrastructure program cost input box from the discussion above, we will provide two years of outreach. Therefore, enter a “1” for the cell corresponding to the Multiple Years option.
5) The results are presented at the bottom of the worksheet. For our $10,808 investment, we receive an impact score of 2,674 for reaching cyclists and 2,787 for pedestrians, which results in a $4 per impact point.

Caltrans | Cal-B/C 6.2 AT Model User’s Guide
hdrinc.com 201 California Street, Suite 1500, San Francisco, CA 94111-5002 (415) 546-4200
33
Exhibit A-9: Non-Infrastructure Program Characteristics (Part 2)
STEP 3: Review Final Results
The “3) Results” worksheet provides the final benefit-cost results and summarizes the benefits for the project. Exhibit A-10 shows the results for our project. For our $4.5 million investment, we receive $5.5 million in benefits that result a benefit to cost ratio of 1.2. The largest benefit categories include journey quality, safety and health benefits for users.

Caltrans | Cal-B/C 6.2 AT Model User’s Guide
hdrinc.com 201 California Street, Suite 1500, San Francisco, CA 94111-5002 (415) 546-4200
34
Exhibit A-10: Final Results