cahier de recherche 2007-01 - uqam
TRANSCRIPT
1
Cahier de recherche2007-01
DISCLOSURE VERSUS RECOGNITION IN STOCK OPTION REPORTING: ARE USERS’ PERCEPTIONS AND DECSIONS INFLUENCED BY THE
DISCLOSURE FORMAT?
Rejean Belzile [email protected]
Chantal Viger *
Professors of Accounting University of Quebec at Montreal
C.P. 8888, Succursale Centre-Ville Montréal (Québec), Canada H3C 3P8
Asokan Anandarajan Associate Professor of Accounting
School of Management New Jersey Institute of Technology
Newark, NJ 07102-1982 [email protected]
Anthony P. Curatola Joseph F. Ford Professor of Accounting
Le Bow College of Business Drexel University
Philadelphia PA 19104 [email protected]

2
DISCLOSURE VERSUS RECOGNITION IN STOCK OPTION REPORTING: ARE USERS’ PERCEPTIONS AND DECSIONS INFLUENCED BY THE
DISCLOSURE FORMAT?
Abstract
The recently passed Statement of Accounting Standard (SAS) 123R mandates that stock option compensation costs should be recognized in the income statement. This supersedes SFAS 148 and the earlier SFAS 123 which required only disclosure in the notes to the financial statements. The motivation of the FASB was to increase transparency in reporting of financial statements. The objective of this paper is to test the functional fixation hypothesis using mandated legislation relating to stock options. We used members of the Institute of Management Accountants (IMA) as the subjects in this study. Our results show that sophisticated users estimated, in the presence of recognition versus disclosure, a (1) higher perceived risk, (2) lower expected accounting return, (3) more pessimistic overall perception, (4) more negative future stock price direction and (5) lower stock price valuation. We conclude that information content is accentuated in the presence of recognition relative to disclosure. The findings support the stance of the FASB and the functional fixation hypothesis that investors are fixated by numbers reported in the financial statements. Keywords: Stock option expensing, stock option recognition, disclosure, SFAS 123R.
Résumé Dans le but d’améliorer la transparence des états financiers, le FASB a imposé récemment l’obligation aux sociétés américaines de porter en charge aux résultats le coût des options d’achat d’actions attribuées à titre de rémunération. Jusqu’alors cette information pouvait être présentée par voie de note aux états financiers. Notre étude expérimentale a testé à l’impact relatif de la comptabilisation des options et de la simple présentation en note auprès d’un échantillon des membres de l’Institute of Management Accountants (IMA). Nos résultats sont à l’effet que la comptabilisation des options à titre de charge influence les perceptions et jugements des utilisateurs sophistiqués différemment de la simple présentation par voie de note. Les répondants qui ont reçu la version des états financiers où les options étaient passées en charge ont perçu un risque plus élevé, estimé un rendement comptable futur inférieur, porté un jugement global plus pessimiste, assigné une valeur inférieure et projeté une progression future plus négative de l’action ordinaire de la société. Nous concluons, en accord avec le FASB, que le contenu informationnel de la comptabilisation est plus fort que celui d’une note aux états financiers.

3
INTRODUCTION In December 2004, the Financial Accounting Standards Board (FASB) issued
Statement of Financial Accounting Standard (SFAS) 123R reasserting its position
requiring the recognition of stock option expensing in the income statement. This latest
pronouncement is effective for statements in the first reporting period after June 15,
2005. However, the SEC deferred the compliance date for companies to the beginning
of the next fiscal year. Prior to this on March 31, 2004, FASB issued an exposure draft
entitled Accounting for Share Based Payments, which mandated the recognition of the
expense associated with employee stock options and it was met with considerable
controversy. In fact, there was an attempt in Congress to have this rescinded. The
effort, however, failed due to a lack of support in the Senate.
The motivation for the latest ruling is aptly summarized by Robert Herz, Chairman of the
FASB testifying before a subcommittee in Congress on April 20, 2004 in which he said:
“Recent events have served as a reminder to all of us that clear credible and
comparable financial information is essential to the health and vitality of our
capital market system. In the wake of the market meltdown and corporate
reporting scandals, the FASB has received numerous requests from individual
and institutional investors, financial analysts and many others urging the Board to
mandate the expensing of the compensation cost relating to employee stock
options.” (Herz, 2004)
Robert Herz also noted that recognition as opposed to disclosure of stock option costs
and its impact on profits in the notes to the financial statements (hereafter referred to as
disclosure) provides greater transparency to financial statement users and hence the
demand for recognition. A move to require expensing also can be seen as another step
towards the convergence of U.S and international accounting standards.1 The objective
1 The SFAS 123R is in accordance with the international standard on stock-based payments (IASB 2004), which was adopted for application in the financial statements of fiscal periods beginning on or after January 1, 2005. The

4
of our study is two-fold. First, using regulation relating to stock options, our objective is
to examine if sophisticated financial statement readers are fixated on reported earnings
and second, to provide further evidence to the FASB to either corroborate their stance
regarding expensing of stock options.
Our sample was drawn from a membership list of the Institute of Management
Accountants (IMA). Each member was provided with one of two case studies of the
same company. One case provided information regarding stock option costs as a note
with an attached pro forma statement in the notes to the financial statements. The other
case recognized the stock option costs in the company’s income statement. We asked
respondents to indicate their underlying perceptions about the perceived investment
risk, the expected accounting return and their overall perception of risk associated with
this hypothetical company. Participants were also asked to indicate their primary
judgments on the expected (1) future stock price direction and (2) stock price value.
Overall we found that, when the expenses were recognized sophisticated users
estimated a higher perceived risk, lower expected accounting return, and a higher
overall perception. They also estimated a more pessimistic expected future stock price
direction and a lower stock value in the presence of recognition relative to disclosure.
These findings lend support to the functional fixation hypothesis indicating that even
sophisticated readers of financial statements are fixated with reported earnings.
Although participants found financial statements to be more helpful in the presence of
recognition versus disclosure, they did not consider recognition to make the financial
statements significantly less confusing, or to significantly increase the reliability and
increase the clarity of financial statements This is surprising that the subjects did not
perceive financial statements to be significantly of higher quality in the presence of
recognition as their underlying and primary investment judgments were significantly
influenced by it.
International Accounting Standard requires recognition of stock based compensation as an expense at grant date by using a fair value method.
5
BACKGROUND Accounting for stock options historically has been viewed as a form of non accounting
because companies were allowed to blur the potential bottom line impact of stock
options in a footnote to their financial statements. This form of reporting has been
viewed to ignore economic reality and to be inconsistent with accounting standards for
other types of compensation.
Regulations in stock option reporting date back to 1972. In that year APB Statement
No. 25 acknowledged that, because of measurement considerations, (the option
valuation models in use today were not yet developed) it did not require accrual of
compensation cost. By disregarding the option’s value, APB 25 ignored the fact that
options give employees valuable rights and that options are compensation for services
performed.
In 1995 FASB issued SFAS No. 123, which mandated footnote disclosure of pro forma
net income and EPS as if the expense (using the fair value method) had been
incorporated in the income statement if the intrinsic value was selected for the
measurement at the granting date2. The intent of adding the pro forma figures was to
provide a clearer signal to financial statement readers about the potential financial
impact of stock option expenses. SFAS 123 also encouraged firms to report expenses
in the income statement using the fair value method. Not surprisingly, few companies
elected to use the fair value method until the recent scandals of Enron and Worldcom. A
few firms such as DuPont, Conoco Philips, Gabelli Asset Management, Microsoft
Corporation, The Washington Post Company, and Coca Cola Corporation voluntarily
began expensing stock option costs in 2003. The majority of companies, however,
continued to show these costs as a footnote disclosure to their financial statements.
To provide guidance for the transition from pro forma footnote disclosure to mandatory
recognition in the income statement, FASB issued SFAS 148 entitled Accounting for
2 If the exercise price is equal or greater than to the market price at the granting date, then the intrinsic value of stock options is equal to zero.
6
Stock Based Compensation - Transition and Disclosure in December 2002. However, it
did not mandate recognition of expenses in the income statement. On March 31, 2004,
FASB issued an exposure draft entitled Accounting for Share Based Payments, which
mandated the recognition of the expense associated with employee stock options. The
motivation of the FASB was to ensure convergence with international accounting
standards which require expensing of stock option costs. The House of Representative,
sought to repeal this through the passage of the Stock Option Reform Act (HR 3574) in
May 2004. This Act basically espoused continuing the current treatment of footnote
disclosure only of stock option costs. The Senate did not show the same level of
interest as the House on this issue. In fact, this legislation caused controversy and
contentious debate in the Senate. Rep Pete Stark (D – California) noted “lets help the
rich get richer. Right now, companies can deduct the cost of stock options for income
tax purposes, but don’t have to report that value to shareholders.”
Despite the contention that arose, the latest standard, SFAS 123R, requires mandatory
expensing of stock option costs commencing as per the SEC directive from the
beginning of the first fiscal year after June 15, 2005. Public firms will now be required to
first estimate the fair value of stock options at the granting date and then expense it
(between the granting date and the exercise date) from revenues. In essence, all forms
of share-based payment to employees, including employee stock options, will now be
treated the same as other forms of compensation by recognizing the related cost in the
income statement.
RESEARCH QUESTION AND CONTRIBUTION Our research question is stated as follows: “Does recognition convey a clearer
message to readers of financial statements relative to disclosure in notes to the financial
statements?” The findings of our research provide several insights of the potential
consequences of SAS 123R. First, the findings of this study contribute to the debate on
the validity of the functional fixation hypothesis (which assumes that reported numbers
in the financial statements influences decisions and information in notes is disregarded)
7
vis-à-vis the efficient markets hypothesis (which assumes that the information disclosed
in the notes is taken into account into decisions) has not been concluded. The setting
related to stock options recognition provides a unique opportunity to study this issue. If
the functional fixation hypothesis holds, we would expect a significant difference in
judgments and valuations for recognition versus footnote disclosure. If the efficient
market hypothesis holds, we should not find any significant difference between
recognition and disclosure since the same information and earnings figures are
reported.
Second, the study’s findings corroborate the stance of the members of the FASB who
mandated recognition on the presumption that recognition enhances transparency
relative to disclosure. Likewise it is consistent with views expressed by the Financial
Accounting Standards Committee of the American Accounting Association (hereafter
the AAA Committee) which is charged with responding to requests for comment from
standard setters on issues relating to financial reporting. Recently, the AAA Committee
commented in Accounting Horizons that “the Committee strongly endorses the
conclusion that share-based payments should lead to expense recognition” (p. 103).
They also noted that “disclosure is not an adequate substitute for recognition” (p. 104).
LITERATURE REVIEW
Empirical research shows that placement of the option expense within the financial
statements, whether in the Income statement or only in the footnotes, makes little
difference to investors. The first studies in the area of footnote disclosure versus
recognition in the financial statements examined the information content of footnote
disclosures regarding pensions and post-retirement benefits. They examined stock
price reactions and concluded that footnote disclosure did have information content
(Barth 1991; Choi et al. 1997). These findings corroborate the efficient market
hypothesis, which implies that once information is disclosed investors are intelligent
enough to incorporate that information into their investment decision making. Initial
studies on the topic of interest in this paper, namely presentation of stock option

8
information, initially investigated the relationship between SFAS 123 annual option
values and stock prices. These studies sought to test whether the proforma disclosure
mandated by SFAS 123 had information content. The studies hypothesized that the
information would convey a significant negative signal to the market. Bell et al. (2002)
investigated a sample of 85 profitable companies from the software industry in the 3
year period 1996 to 1998. They failed to find their expected negative relation between
annual stock option expense disclosed in the footnotes and stock prices. Aboody et al
(2004) used the same 3 year sample period with 2,274 firm years and documented a
negative correlation between disclosed annual option expense and year end stock
prices. They concluded that pro forma disclosure does convey information to investors.
Aboody et al explained the differences in results by concluding that the Bell et al
findings were sample specific and could not be generalized to other samples. In a more
recent study Balsam et al. (2004) examined the same relationship for firms for the first
year SFAS 148 became effective. They add to the literature by examining the
information content of both recognition and pro forma footnote disclosure. They found
that placement of the stock option information (whether on the Income statement or only
in the footnotes as pro forma disclosure) made little difference to investors. In their
study, the cumulative abnormal return (CAR) were regressed on recognized option
expense and unrecognized option expense after controlling for variables shown by prior
research to explain stock returns. Their results indicate that, while both forms of
disclosure are value relevant, there is no significant difference in market reaction
between them. They concluded that, hence, the economic consequences of option
expense recognition are unlikely to be significant thereby addressing a major concern of
opponents of recognition of stock option costs in the income statement. Despite the
findings of research that indicate users consider information provided in financial
statement footnotes, the AAA Committee supported the position held by the FASB that
disclosure is not an adequate substitute for recognition.
From an experimental study point of view, the communication paradigm suggests that
location of information does have an influence on financial statements users’
perceptions and decisions. Hirst and Hopkins (1998) found that professional analysts

9
are more likely to discover earnings management when earnings components are
clearly reported in a performance statement than when they are disclosed in notes thus
requiring more analysis. Further, Hirst et al (2004) examined the influence of footnote
disclosure of fair value instruments and concluded that disclosure was not a substitute
for full fair value income measurement. This was also found to be true with respect to
placement and location of going concern information (Viger et al., 2004; Anandarajan, et
al,. 2002 among others) and disclosure of comprehensive income (Hirst, et al,. 2004
among others). In contrast, Frederickson and Miller (2004) examined the effect of pro
forma earnings disclosures on investors’ judgments. They concluded that, while
nonprofessional (less sophisticated) investors were misled by favorable non-GAAP pro
forma disclosures, analysts (sophisticated investors) acquired the information but were
shrewd enough not to be deceived by the same information. Thus the debate with
respect to professional users is still unresolved as revealed by two recent studies (Hirst
et al. 2004; Frederickson and Miller 2004). Assuming the location and placement of
information does influence financial statement users’ perceptions and decisions, we
should expect a significant difference between pro forma disclosure and recognition on
investors’ judgments and valuations.
Empirical studies, as noted above, focus on the reaction of the broader market and
therefore their results do not apply to individual investors. Experimental study like this
one adds to the extant literature by examining whether sophisticated individual investors
are influenced by the two methods of reporting stock options (recognition versus
disclosure). Most studies that used sophisticated users have investigated their job
related judgments and decision-making; in this study we focus on the judgments of
sophisticated users in the context of their personal investment decision-making. By
using members of the IMA as opposed to MBA students as surrogate to investors, this
study contrasts with previous experimental studies.
THEORY DEVELOPMENT AND HYPOTHESES An important tenet in the efficient market hypothesis is that investors learn to distinguish
between changes in reported accounting numbers that are caused by fundamental

10
economic factors that affect cash flows and those that are prompted purely by
accounting methods (Tinic 1990). In an efficient market, the theory states that stock
prices reflect all publicly available information. The efficient markets hypothesis was
challenged by Ou and Penman (1989) and Bernard (1993) among others.
It has been suggested that, alternatively, investors might interpret accounting
information without regard to the rules used to produce it. This is the essence of the
functional fixation hypothesis (FFH) which offers this alternative explanation. The FFH
has its origins in psychology and was introduced into the accounting literature by Ijiri,
Jaedicke and Knight (1966). Ijiri, Jaedicke and Knight stated that psychologists have
found that there appears to be “functional fixation” in most human behavior in which the
person attaches a meaning to a title or object and is unable to see alternative meanings
and uses. They also note that if the outputs from different accounting methods are
called by the same name such as profit, people will tend to neglect the fact that
alternate methods have been used to prepare financial statements. Functional fixation
was first applied in efficient market research by Beaver (1972) who extrapolated the
FFH to groups and larger entities. He concluded that the market is not functionally
efficient. In essence, FFH predicts that the stock prices will be mechanically related to
reported earnings numbers. FFH was however introduced to explain individual behavior
and not market behavior as a whole. Tinic (1990) notes that FFH has potentially
important implications for setting accounting standards and procedures and for the
mandated disclosure of accounting information.
Currently, both managerial and financial accounting research have examined whether
individuals fixate on reported accounting numbers or whether they can see through
alternative reporting formats in experimental settings (Luft and Shields 2001;
Arunachalam and Beck 2002). Experimental research provides evidence that financial
statement users are subject to functional fixation in individual settings (Hopkins 1996;
Hirst and Hopkins 1998; Hopkins, Houston and Peters 2000). In contrast the results
are not conclusive since some studies support functional fixation (Ashton 1976; Chang

11
and Birnberg) while other studies do not (Kachelmeier 1996; Waller, Shapiro and
Sevcik 1999).
Most experimental studies including all the studies mentioned above, used graduate
students as their subjects. Of the few studies that used non-students, Vergoossen
(1997) examined the functional fixation hypothesis using Dutch investment analysts.
They were considered sophisticated because investment analysts in the Netherlands
work as either portfolio managers or investment analysts. The research concluded that,
to a large extent, Dutch investment analysts appeared to be fixated on accounting
numbers.
Studies using market data also appear to corroborate the existence of functional
fixation. Studies by Hand (1990) and Harris and Ohlson (1990) both used stock market
data to test FFH. Hand suggested a modified version of the functional fixation
hypothesis which claimed that prices of some stocks at some points in time may be
determined by unsophisticated marginal investors who are fixated on the bottom line
accounting earnings. He concluded that the stocks of small capitalization firms (which
tend to be more heavily owned by individual investors) was priced by fixated investors
who did not understand the effects of accounting procedures on reported earnings.
Hence, evidence supported the existence of functional fixation for investors of small
capitalization firms. In a more recent empirical study, Chen and Schoderbek (2000)
used a sample of deferred tax adjustments resulting from the Omnibus Budget
Reconciliation Act of 1993 to explore the magnitude of analysts’ and investors’
functional fixation with reported accounting numbers. A one period adjustment could
have been estimated using deferred tax information in the notes to the financial
statements. Hence, fully rational investors should be able to react to it as a transitory
earnings component. In contrast functionally fixated investors should not be able to
distinguish the various components of reported earnings. They found that analysts did
not include the adjustments in their earnings forecasts. Chen and Schoderbek
concluded that investors did exhibit a degree of functional fixation.
12
Assuming the existence of functional fixation, we postulate that even sophisticated
investors may gravitate towards reported accounting numbers in the financial
statements. Thus, stock option cost information will be more apparent when the stock
option costs are reported in the income statement relative to when the same information
is disclosed in the notes to the financial statements.
If functional fixation applies then numbers reported in the financial statements may
affect perceptions and be incorporated in decision making relative to if the same
numbers are disclosed in the notes. Hence, investors’ judgment and perceptions of risk
should be affected by variations in reporting style (i.e., recognition versus disclosure in
which reported earnings are less favorable in the former than in the latter). Hence, our
first hypothesis is stated as follows for the underlying judgments:
H1: Individual’s overall underlying judgment of the company will be more pessimistic
when stock option costs are recognized in the income statement than when they
are disclosed in a footnote.
Overall underlying judgment of the company was examined using a variety of questions
relating to (1) perceived risk (which consist of the perceived investment risk, overall
financial condition, ability to pay its debts), (2) expected accounting return (which
consist of the expected return on equity and future net income direction) and (3) overall
perception (namely the perceived investment attractiveness), These questions were
used in previous research (Viger et al. 2006; Belzile et al. 2006; Elias and Johnston
2001; LaSalle and Anandarajan 1997; Bamber and Stratton 1997; Gul 1987; Bailey
1981; Libby 1979).
Tinic (1990) notes that the bottom line reported earnings number is the primary item of
functional fixation. Aboody et al. (2004) in an empirical study find that share prices are
negatively associated with stock based compensation recognized in the income
statement. They conclude that recognition may convey an impression of weaker
financial results to investors relative to disclosure. Similarly, Hirshleifer and Teoh
13
(2003) indicate that inattentive investors extrapolate reported earnings to formulate an
opinion on a company. The implication is that recognition of stock option compensation
may have an adverse impact on expected stock price. Based on the theory espoused
by Hirshleifer and Teoh and the findings of Aboody, we conclude that recognition will
have a more adverse impact on perceived stock price value relative to disclosure. Our
second and third hypotheses are stated as follows:
H2: Investors will predict a more pessimistic expected future stock price direction
when stock option costs are recognized in the income statement than when they
are disclosed in a footnote.
H3: Investors will estimate a lower stock price value when stock option costs are
recognized in the income statement then when they are disclosed in a footnote.
METHODOLOGY
Sample selection Our sample of participants was randomly drawn from a membership list of the IMA.
Members of the IMA represent a diverse mix of investors. They are heterogeneous and
perform a wide range and variety of tasks in a variety of accounting related jobs. This
makes this population particularly appealing for this task; they are qualified to see
through the stock option information and as such are deemed sophisticated users.
The data was collected for this study in two forms. A case study and survey instrument
was initially provided on a website. The sample for the website participation was a
random selection made by the headquarters of IMA. The members were requested to
enter the website, download the material, and after studying the case study, fill out the
survey instrument. An e-mail request was sent to a randomly selected group of 4,000
IMA members to voluntarily participate in our study. A total of 42 completed and usable
responses were downloaded from the website. We subsequently requested members
at an IMA meeting to participate in this study. A hard copy of the case was provided to
14
and collected from this group of participants; 26 hard copy responses were obtained
from this group. Our final sample of 68 participants can be criticized as not representing
the population of IMA members at large3. However, a test comparing the demographic
variables between the two experimental groups revealed no significant difference
between the groups.
Research design The research design is shown in Figure 1. Each participant received an experimental
package that included descriptive information on a hypothetical company. The financial
statements included a standard (unqualified) auditor’s report, a set of financial
statements for two fiscal periods including a balance sheet, income statement,
statement of retained earnings and statement of cash flow and accompanying notes.
The information in the two case studies was identical. The only variable that was
manipulated was the mode of communication of the stock option compensation. In one
case study the stock option compensation information is reported in the notes to the
financial statements (subjects receiving this case study are referred to as G1), which
also includes a pro forma net income and EPS as if the fair value of stock options had
been recognized. In the second case study the stock option compensation is
recognized in the income statement (subjects receiving this case study are referred to
as G2).
Insert Figure 1 here
Research instrument The methodology used in this study is based on prior experimental research that used
survey instruments to examine information content of various forms of
disclosure/reports. In those studies, significant variations in perception of risk and
financial health were taken as evidence that one form of disclosure/report format
3 An analysis was performed in order to compare the demographic variables between those who responded via the website and those who responded at the seminar. No significant differences was found between the two groups.

15
conveyed a “stronger signal” than another (Elias and Johnston 2001; LaSalle and
Anandarajan 1997; Bamber and Stratton 1997; Gul 1987; Bailey 1981; Libby 1979
among others). In line with these studies, we asked similar questions (albeit modified
for this study).
The response portion of the survey instrument included three sections. Section one
asked questions pertaining to respondents’ underlying and primary judgments as well
as questions related to their perception of quality of the accounting information provided
to them. The underlying judgments (H1) were measured using questions relating to the
perceived risk (which consists of the (1) perceived investment risk, (2) overall financial
condition, (3) ability to pay its debts), expected accounting return (which consists of the
(1) expected return on equity, (2) future net income direction and (3) growth prospect)
and the overall perception (namely the perceived investment attractiveness). The
primary judgment (H2 and H3) referred to the expected (1) future stock price direction
and (2) stock price value4
Sections II and III focused on demographic and manipulation questions. Specifically,
respondents were asked (1) whether ABC reported pro forma compensation cost figure
in the notes, (2) if ABC recorded a stock option expense in the financial statements and
(3) to recall the net income trend. The final section of the survey instrument requested
standard demographic information about the participants such as their education
background, risk tolerance and gender among others.
Figure 2 provides a framework to analyze the effects of the reporting format of stock
options (recognition or disclosure) on underlying and primary judgments. As shown it is
expected that the reporting format influences the information processing (which consist
of acquisition, evaluation and weighting of the information as suggested by Maines and
McDaniel, 2000). We examined whether information was properly acquired with our
4 Question one also requested whether subjects would be willing to invest in the company however, quite a number answered this question ambiguously using the work “perhaps” or “it depends”. Due to the many ambiguous or equivocal answers we could not include responses to this question in our statistical tests.
16
manipulation check questions described above. Once the information is acquired, the
information is then appraised (though the evaluation and weighting steps that are not
investigated in this study) which lead to specific performance assessment judgments.
We postulate, as shown in Figure 2, that the underlying judgments (related to the (1)
perceived risk, (2) expected accounting return and (3) overall perception) will influenced
the primary judgments of the expected (1) future stock price direction and (2) stock price
value.
Insert Figure 2 here
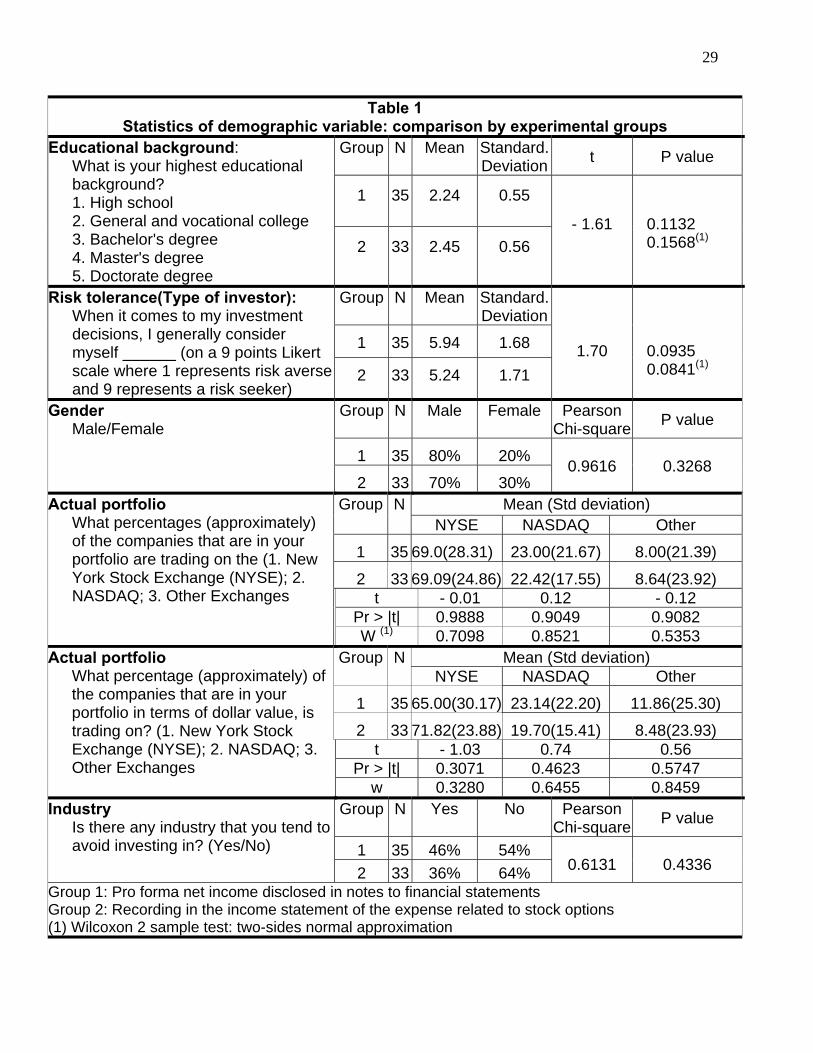
DISCUSSION OF RESULTS Preliminary check Descriptive statistics on demographic variables (see Table 1) indicate that
randomization was successful in obtaining equal distribution among the groups with
respect to all demographic variables. The difference between the groups was not
statistically significant in terms of educational background, risk tolerance, gender,
description of actual portfolio (in terms of percentage of companies and in dollar value
that is being traded on the NYSE, NASDAQ and other exchanges), industry they tended
to avoid investing in (with respective p value 0.1132. 0.0935, 0.3268, 0.9082, 0.5747
and 0.4336). Most of the respondents had at least general vocational college. With
respect to gender, the majority of participants in both groups were males (80% and
70%, in G1 and G2 respectively. Although the respondents in group 1 had a greater
number of subjects who categorized themselves as risk seekers (on a Likert scale
ranging from 1 (risk averse) to 9 (high risk seeker)) but the difference was only
marginally significant (p value 0.0935). On average, participants invested primarily in
NYSE (69% for both G1 and G2 in terms of percentage of companies traded in; 65% in
G1 and 71% in G2 in terms of dollar value). The results show that 54% in G1 and 64%
in G2 indicate that there was no industry they tended to avoid investing in.

17
Insert Table 1 here
We also conducted manipulation checks. As already noted, three questions were asked
of each participant to check the effectiveness of the manipulation. The results of these
three questions are shown in Table 2. Participants were first asked whether ABC
reported a pro forma figure in a note in the financial statements. For those participants
receiving case one (i.e., the pro forma note disclosure), an affirmative response was
given by all respondents, which is the correct response. For those participants receiving
case two (i.e., the income statement recognition), a negative response was given by
91% of the respondents, which is the correct response. Secondly participants were
asked whether the hypothetical company recorded stock option expense in the 2003
financial statements. For the participants receiving case one, the correct response was
given by 80% (28 of the 33 participants). For the participants receiving case two, the
correct response was given by 82% (27 out of 33 participants). With respect to the third
manipulation question, 94% (88%) of the participants in G1 (G2) correctly responded
that 2003 reported net income was superior (inferior) that its 2002 reported net income.
Our conclusion is that, overall, the manipulation was well perceived.
Insert Table 2 here
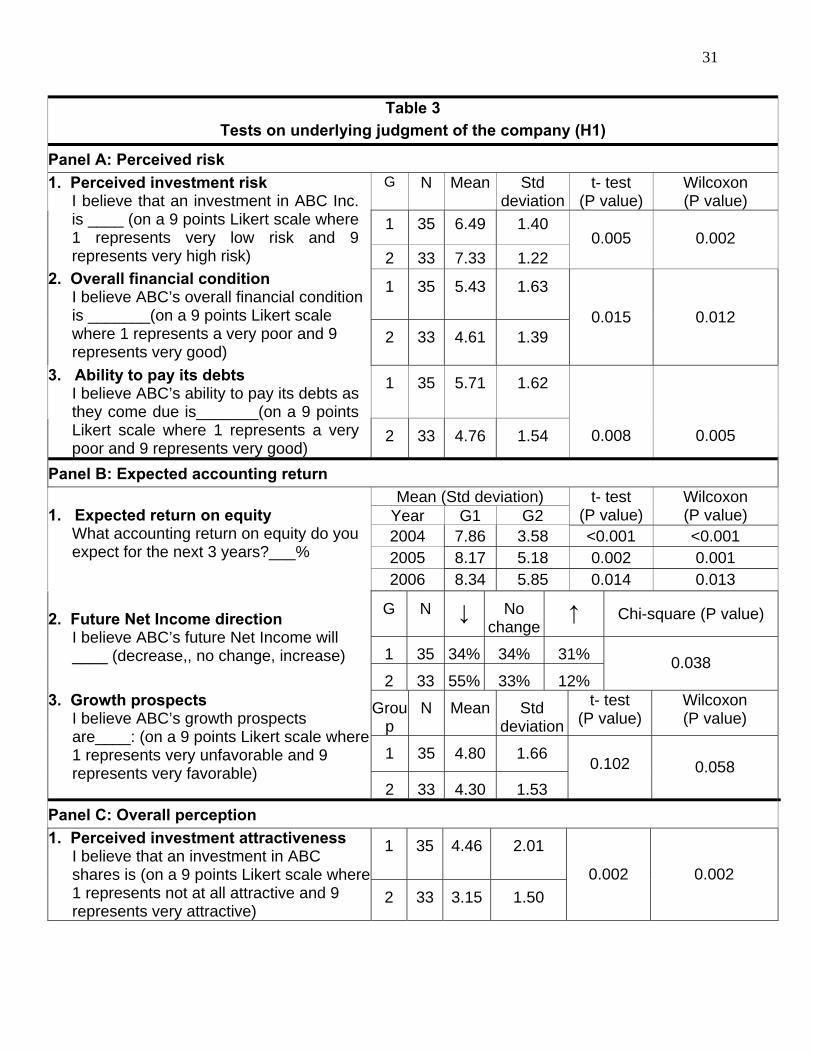
Tests on underlying judgments (H1) The results for questions pertaining to the underlying judgments are presented in Table
3. As mentioned before, the underlying judgments were measured using questions
relating to the perceived risk (Panel A), expected accounting return (Panel B) and the
overall perception (Panel C). As Panel A of Table 3 reveals the responses to the
questions relating to the perceived risk which consist of the (1) perceived investment
risk, (2) overall financial condition, (3) ability to pay its debts. The perceived investment

18
risk is greater (more pessimistic) for G2 (mean 7.33) than for G1 (mean 6.49). The
perceived overall financial condition is also more pessimistic (is lower) for G2 (mean
4.61) than for G1 (mean 5.43). Similarly, the judgments on the company’s ability to pay
its debts is more pessimistic (lower) for G2 (mean 4.76) as opposed to G1 (mean 5.71).
In all three questions, the differences between G1 and G2 are all highly significant (with
respective p value of 0.002, 0.012 and 0.005).
Panel B of Table 3 reveals the responses obtained for the questions pertaining to
expected accounting return which consists of the (1) expected return on equity, (2)
future net income direction and (3) growth prospects. The results for expected return on
equity show that in all three yearly forecasts expected return on equity were smaller for
G2 relative to G1. The difference is statistically significant at the one percent level for
each year. The response to future net income direction shows that 34 percent predicted
decrease in net income for G1 as opposed to 31 percent indicating increase and 12
percent indicating no change. For G2 55 percent predicted decrease as opposed to 12
percent predicting increase and 33% indicating no change. A chi square test indicated
that the differences were statistically significant between the groups (p value 0.038).
The responses to growth prospects show that the company’s anticipated growth
prospects are more pessimistic (smaller) for G2 (mean 4.30) relative to G1 (mean 4.80).
The results from a Wilcoxon test show that the difference is marginally significant
between the groups (p value 0.058). Panel C of Table 3 reveals the responses obtained
to the overall perception. On average, results showed that subjects of G2 (mean 3.15)
appeared feel their investment was less “attractive” relative to G1 (mean 4.46). The
difference was statistically significant (p value 0.002).
In summary, the results of Table 3 show that that, in the presence of recognition versus
disclosure, participants estimate more pessimistic underlying judgments (higher
perceived risk, lower expected accounting return, less favorable overall perception).
These results all provide evidence to support H1 which postulates that Individual’s
overall underlying judgment of the company will be more pessimistic when stock option

19
costs are recognized in the income statement than when they are disclosed in a
footnote.
Insert Table 3 here
Tests on primary judgments (H2 and H3) As mentioned before, the primary judgments pertain to the (1) expected future stock
price direction and (2) stock price value. The results are shown in Table 4. The mean
expected future direction in stock price for subjects in G2 (3.15) was more pessimistic
(lower) than the mean for subjects in G1 (4.80). The difference was statistically
significant (p value 0.001). This provides evidence to support H2 which postulates that
investors will predict a more pessimistic expected future stock price direction when
stock option costs are recognized in the income statement than when they are disclosed
in a footnote. Similarly, the mean estimated stock price value of subjects in G2 ($7.30)
was lower than the estimated mean for subjects in G1 ($24.43). The difference was
statistically significant (p value 0.001). This provides evidence to support H3 which
postulates that investors will estimate a lower stock price value when stock option costs
are recognized in the income statement then when they are disclosed in a footnote.
Insert Table 4 here
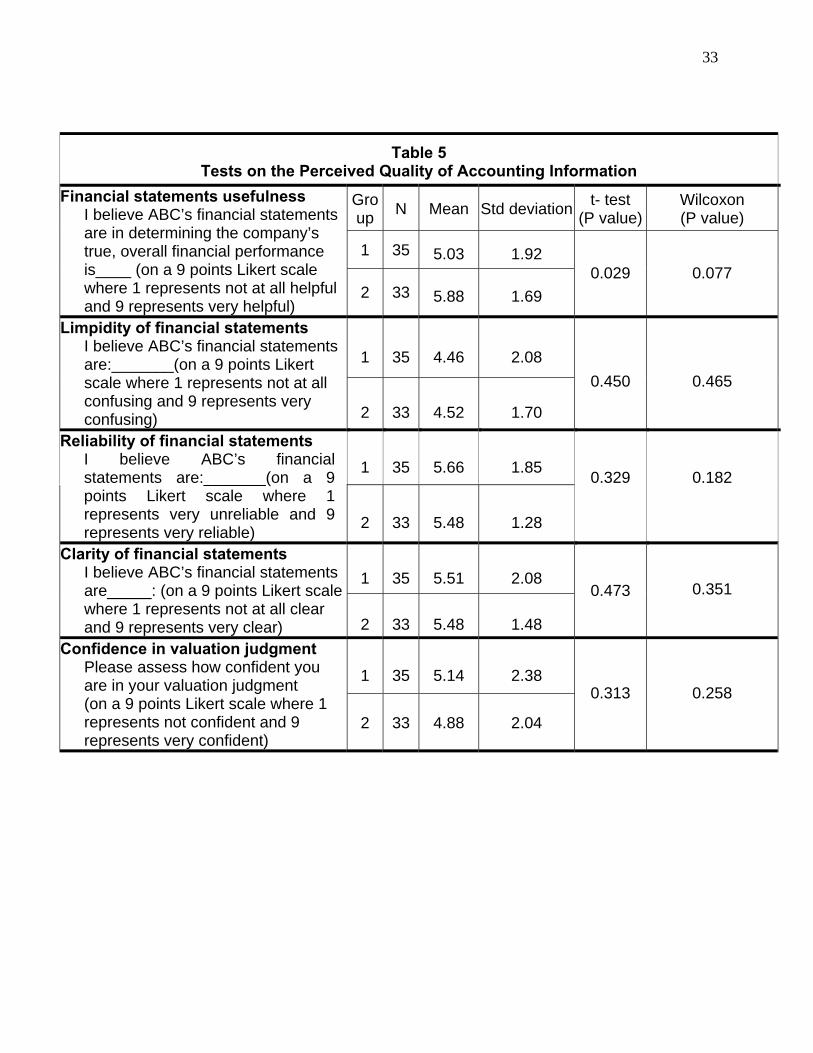
Supplementary tests on the perceived quality of accounting information We continued our analysis in order to investigate if users’ perceived quality of
accounting information is influenced by the stock option reporting format (recognition
versus disclosure). This perceived quality was measured using five questions relating to
the financial statement usefulness, limpidity, reliability and confidence in valuation
judgment. As with previous other measures, a nine point Likert scale is used for each
question. The results for this final section are presented in Table 5. Only one
perception, financial statement usefulness, is influenced by the reporting format.
Financial statement usefulness is perceived marginally higher for G2 (5.88) than for G1
(5.03) with a p value of 0.029. This result indicates that the financial statements were

20
seen more helpful in the presence of stock option costs recognition as opposed to a
note disclosure. None of the other qualities (clarity, reliability and confidence in
valuation judgment) was statistically different between the two experimental groups
(with p value of 0.450, 0.329, 0.473 and 0.313)5.
In summary we find that members of the IMA, in the presence of recognition versus
disclosure, estimate more pessimistic underlying judgments (higher perceived risk,
lower expected accounting return, worse overall perception) and primary judgments
(negative future stock price direction and lower stock price valuation). They also found
financial statements to be marginally more helpful in the presence of recognition versus
disclosure. This implies that members of the IMA were fixated on reported earnings in
the income statement. The findings of this study further add to the debate on the
validity of the functional fixation hypothesis versus the efficient markets hypothesis.
However, we also note that when questioned on the financial statements overall, the
respondents did not find recognition of stock options to make the financial statements
significantly less confusing, or to significantly increase the reliability and increase the
clarity of financial statements. We conclude that simply recognizing stock option costs
may not have been sufficient to significantly change their view points on the qualities of
financial statements even if it influenced significantly their underlying and primary
investment judgments.
Insert Table 5 here
CONCLUSIONS Most of the prior research has examined the consequences of stock option costs
disclosure by means of stock market studies examining the impact of pronouncements 5 The responses to question asking respondents’ perceptions about the perceived clarity of financial statements show that the financial statements were perceived slightly more confusing for group 2 (4.52) relative to group 1 (4.46); alternatively questioned, participant found that the financial statements were clearer for group 2 (5.48) relative to group 1 (5.51). Similarly, the responses to question asking respondents about the perceived reliability of financial statements showed a slightly higher mean for group 1 (5.66) relative to group 2 (5.48).

21
on share prices. We contribute to the literature by conducting an experiment and
examining the judgments and decision-making of a select group of accountants to the
two presentation methods of stock option cost information, namely, disclosure in the
notes versus recognition in the income statement. If the efficient markets hypothesis
holds, then financial statement users should not be influenced by different ways of
reporting the same information. On the other hand, if the functional fixation hypothesis
holds, then financial statement users would be more affected by the same earnings
recognized in the income statement than disclosed in the footnotes.
We use the mandated changes requiring expensing of stock option costs to test the
functional fixation hypothesis. Prior research suggests that unsophisticated investors
are functionally fixated on reported accounting numbers. Our results indicate that
sophisticated financial statement users exhibit functional fixation as well. Accounting for
stock option costs is a particularly valuable context to examine the presence of
functional fixation. First, it has broad policy implications. Our findings corroborate the
stance of the FASB that disclosure is not a substitute to recognition. Second, we
examine if individuals with accounting training and experience might reasonably be
expected to see through the disclosure since the disclosure versus recognition issue
has been widely publicized before the issuance of Statement 123R. By choosing the
stock options reporting issue, we provide a realistic setting to test functional fixation.
Experimental studies suggest that functional fixation results from lack of experience and
therefore, opportunities to acquire this experience should eliminate it (Chen and
Schoderbek 2000). Luft and Shields (2001), however, concluded that learning is not
necessarily a quick remedy for fixation because accounting can influence the process
itself. We find that even experienced and sophisticated users of financial statements
exhibit functional fixation.
As a regulatory body, FASB must be concerned with the informational content for
individuals, not just the whole market. In point of fact, Donald T. Nicholaisen, who was
appointed as the Chief Accountant of the SEC in August 2003 commented in an
interview given to the CPA journal (April 2004) that investors deserve financial
22
statements that are more transparent and easier to read. While talking in general
terms, (though his statement is applicable to stock option reporting as well) he stated
that in some cases excessively detailed accounting rules have given those who choose
to abuse the system a means to achieve better looking numbers in the financial
statements by circumventing the fundamental principles behind the rules. Not
recognizing stock option expenses as was allowed prior to the introduction of SFAS
123R is a perfect example of this form of circumventing. He noted that a dominant item
on his agenda was helping all investors (by implication large and small) to be better
informed. Subsequently, a year later in an interview in the Journal of Accountancy, he
noted that it was important to know if the “low hanging fruit” had in fact been plucked
before proceeding to other issues which need to be addressed. Our results suggest that
the SFAS 123R mandatory recording of stock options may prevent undesired
consequences due to functional fixation on net earnings.
23
REFERENCES Aboody, D., M.E. Barth, and R. Kasznik. 2004. SFAS No. 123 Stock based compensation expense and equity market values. The Accounting Review 79(2): 251-275. Accounting Principles Board (APB). 1972. Opinion No. 25 Accounting for stock issued to employees. American Accounting Association Financial Accounting Standards Committee. 2005. Response to the FASB’s exposure draft on share-based payment: An amendment of FASB statements no. 123 and no. 95. Accounting Horizons 19(2): 101-114. Anandarajan, A., C. Viger, and A.P. Curatola. 2002. The information content of alternative going concern reports: A Canadian experience. Canadian Accounting Perspectives 1(2): 141 – 162. Ashton, R.H. 1976. Cognitive changes induced by accounting changes: Experimental evidence on the functional fixation hypothesis. Journal of Accounting Research 14( Supplement): 1-17. Bailey, W.T., 1981, The effects of audit reports on chartered financial analysts’ perceptions of the sources of financial statement and audit report messages, The Accounting Review 55, 882-896. Balsam, S., E. Bartov, and J. Yin. 2004. Disclosure versus recognition of option expense: An experimental investigation of SFAS No. 148 and stock returns. Unpublished working paper, Temple University. Bamber, E. M., and R.A, Stratton. 1997, The information content of the uncertainty-modified audit report: Evidence from bank loan officers, Accounting Horizons 11(2), 1-11. Barth, M.E. 1991. Relative measurement errors among alternative pension asset and liability measures. The Accounting Review 66 (3): 433-464. Bell, T., W. Landsman, B. Miller, and S. Yeh. 2002. The valuation implication of employee stock option accounting for profitable software firms. The Accounting Review 77(4): 971 – 996. Belzile, R., A. Fortin, and C.Viger. 2006. Recognition versus disclosure of stock option compensation: An analysis of judgments and decisions of nonprofessional investors. Working Paper #16-2004, University of Quebec at Montreal.
24
Bernard, V. 1993. Stock price reactions to earnings announcements: A summary of recent anomalous evidence and possible explanations in Advances in Behavioral Finance edited by R.H. Thaler. New York: Russell Sage Foundation. Chang, D.L., and J.G. Birnberg. Functional fixity in accounting research: Perspective and new data. Journal of Accounting Research 15(2): 300-312. Chen, K.C.W., and M. Schoderbek. 2000. The 1993 tax rate increase and deferred tax adjustments: A test of functional fixation. Journal of Accounting Research 38(1): 23-44.; Choi, B., D.W. Collins, and W.B. Johnson. 1997. Valuation implications of reliability differences: The case of nonpension postretirement obligations. The Accounting Review 72(3): 351-383. Colson, R.H. 2004. Evolving regulations and oversight in the public interest. The CPA Journal (April).
Elias, R.Z., and J.G. Johnston. 2001, Is there incremental information content in the going concern explanatory paragraph? Advances in Accounting 18, 105-117.
Gul, F. A., 1987, The effects of uncertainty reporting on lending officers’ perception of risk and additional information required, ABACUS 23(2), 172-79. FASB 1995. Statement of Financial Accounting Standards (SFAS) No. 123. Accounting for stock based compensation. FASB 2002. SFAS No. 148. Accounting for stock based compensation – transition and disclosure – an amendment of FASB No. 123. FASB 2004. Proposed Statement of Financial Accounting Standards. Accounting for share based payments. Frederickson, J. R. and J. S. Miller. 2004. The Effects of Pro Forma Earnings Disclosures on Analysts’ and Nonprofessional Investors’ Equity Valuation Judgments. The Accounting Review 79 (3): 667-686. Hand, J.M. 1990. A test of the extended functional fixation hypothesis. The Accounting Review 85(4) October: 740-763. Harris, T.S., and J.A. Ohlson. 1990. Accounting disclosures and the market’s valuation of oil and gas properties: Evaluation of market efficiency and functional fixation. The Accounting Review 65 (October): 764-780.
25
Herz.R. 2004. Testimony before the subcommittee on financial management, the budget and international security. U.S. Congress. April Hirst, D.E., and P.E. Hopkins. 1998. Comprehensive income reporting and analysts’ valuation judgments. Journal of Accounting Research 36( Supplement): 47-75. Hirst, E., P. Hopkins and J. Wahlen. 2004. Fair values, Income Measurement, and Bank Analysts’ Risk and Valuation Judgments. The Accounting Review, Vol. 79(2) (April): 453-472. Hodge, F.D., J. Jollineau Kennedy, and L.A. Maines. 2004. Does Search-Facilitating Technology Improve the Transparency of Financial Reporting? The Accounting Review, Vol. 79(3) (April): 687- 703. Hopkins, P.E. 1996. The effect of financial statement classification of hybrid financial instruments on financial analysts’ stock price judgments . Journal of Accounting Research 34 (Supplement): 33-50. Hopkins, P.E., R.W. Houston, and M.F. Peters. 2000. Purchase, pooling, and equity analysts’ valuation judgments. The Accounting Review. 75(3): 257-281. Ijiri, Y., R.K. Jaedicke, and K.E. Knight. 1966. The effects of accounting alternatives on management decisions in R.K. Jaedicke, Y. Ijiri, and O. Nielson (Eds), Research in accounting measurement. American Accounting Association, Sarasota, Florida. Pp 186-199. International Accounting Standards Board (IASB). 2004. Share-based Payment. International Financial Reporting Standards (IFRS) 2. London: IASB Kachelmeier, S.J. 1996. Do cosmetic reporting variations affect market behavior? A laboratory study of the accounting emphasis on avoidable costs. Review of Accounting Studies 1(1): 115-140. Lasalle, R.E. and A. Anandarajan. 1997. Bank Loan Officers’ Reactions to Audit Reports Issued to Entities with Litigation and Going Concern Uncertainties. Accounting Horizons 11 (2): 33-40. Libby, R. 1979. The Impact of Uncertainty Reporting on the Loan Decision. Journal of Accounting Research 17 (Supplement): 35-57. Luft, J.I. and M.D. Shields. 2001. Why does fixation persist? Experimental evidence on the judgment performance effects of expensing intangibles. The Accounting Review 76(4): 561-587. Maines, L. A. and L. S. McDaniel. 2000. “Effects of Comprehensive-income Characteristics on Nonprofessional Investors’ Judgments: The Role of Financial-

26
Statement Presentation Format”. The Accounting Review, Vol. 75, No. 2 (April), pp. 179-207. Ou, J., and S. Penman. 1989. Financial statement analysis and the prediction of stock returns. Journal of Accounting and Economics (March): 295-330. Tinic, S.M. 1990. A perspective on the stock market’s fixation on accounting numbers. The Accounting Review 65(4): 781-796. Vergoossen, R.G. 1997. Changes in accounting policies and investment analysts’ fixation on accounting figures. Accounting, Organizations and Society 22(6): 589-607. Viger, C., A. Anandarajan, A.P. Curatola, and W. Ben Amar. 2004. Behavioral implications of alternative going concern reporting formats. Advances in Accounting Behavioral Research 7: 51-71. Viger, C., R. Belzile, A. Anandarajan and B. Lagrange. 2006. Disclosure versus recognition of stock option compensation: Effect on the credit decisions of loan officers. Unpublished working paper. University of Quebec at Montreal. Wall Street Journal. 2004. Accounting cops delay change. C1.

27
Figure 1 Experimental Design
Experimental groups
Group 1 Group 2
Experimental material
Each participant received an experimental package that included descriptive information on ABC Inc., a standard auditor report, a set of financial statements for two fiscal
periods including a balance sheet, income statement, retained earnings statement and cash flow statement, and
accompanying notes and information on a potential investment decision.
Mode of communication of the stock option compensation
The stock option compensation is reported with a descriptive note including pro forma net
income
The stock option compensation is
recognized in the income statement
2003
2002
2003
2002 Volatility
Net income for the year ended November 30
$159,071 $148,497 $41,586 $122,795

28
Figure 2 Framework for the effects of the reporting format of stock option costs on
underlying and primary judgments (adapted from Maine and McDaniels, 2000)
REPORTING FORMAT OF STOCK OPTION COMPENSATION COSTS
Format 1 The stock option compensation is
reported only with a descriptive note including pro forma net income
Format 2 The stock option compensation is reported with
a descriptive note and is recognized in the income statement
↓
INFORMATION PROCESSING
Information Acquisition
• Did ABC report a note on “Stock options” in its 2003 financial statements? • Did ABC report a pro forma net income figure in its 2003 financial statements? • Did ABC report an expense relative to “Stock options” in its 2003 income statement?
↓ Information Evaluation & Weighting ↓
PERFORMANCE ASSESSMENT JUDGMENT (PAJ)
Overall underlying judgment (H1)
↓ Primary investment judgment (H2 and H3)
Expected future stock price direction & Expected stock price value
• Perceived investment risk • Overall financial condition • Ability to pay its debt
• Expected return on equity • Future Net Income direction • Ability to sustain growth
Overall Perception Perceived investment attractiveness
Perceived risk Expected accounting return
29
Table 1 Statistics of demographic variable: comparison by experimental groups
Group N Mean Standard. Deviation t P value
1 35 2.24 0.55
Educational background: What is your highest educational background? 1. High school 2. General and vocational college 3. Bachelor's degree 4. Master's degree 5. Doctorate degree
2 33 2.45 0.56
- 1.61
0.1132 0.1568(1)
Group N Mean Standard. Deviation
1 35 5.94 1.68
Risk tolerance(Type of investor): When it comes to my investment decisions, I generally consider myself ______ (on a 9 points Likert scale where 1 represents risk averse and 9 represents a risk seeker)
2 33 5.24 1.71
1.70
0.0935 0.0841(1)
Group N Male Female Pearson Chi-square P value
1 35 80% 20%
Gender Male/Female
2 33 70% 30%
0.9616
0.3268
Mean (Std deviation) Group NNYSE NASDAQ Other
1 35 69.0(28.31) 23.00(21.67) 8.00(21.39)
2 33 69.09(24.86) 22.42(17.55) 8.64(23.92) t - 0.01 0.12 - 0.12
Pr > |t| 0.9888 0.9049 0.9082
Actual portfolio What percentages (approximately) of the companies that are in your portfolio are trading on the (1. New York Stock Exchange (NYSE); 2. NASDAQ; 3. Other Exchanges
W (1) 0.7098 0.8521 0.5353 Mean (Std deviation) Group N
NYSE NASDAQ Other
1 35 65.00(30.17) 23.14(22.20) 11.86(25.30)
2 33 71.82(23.88) 19.70(15.41) 8.48(23.93) t - 1.03 0.74 0.56
Pr > |t| 0.3071 0.4623 0.5747
Actual portfolio What percentage (approximately) of the companies that are in your portfolio in terms of dollar value, is trading on? (1. New York Stock Exchange (NYSE); 2. NASDAQ; 3. Other Exchanges
w 0.3280 0.6455 0.8459 Group N Yes No Pearson
Chi-square P value
1 35 46% 54%
Industry Is there any industry that you tend to avoid investing in? (Yes/No)
2 33 36% 64%
0.6131
0.4336
Group 1: Pro forma net income disclosed in notes to financial statements Group 2: Recording in the income statement of the expense related to stock options (1) Wilcoxon 2 sample test: two-sides normal approximation

30
Table 2 Statistics on Manipulations questions
Cross-Tabulation of Format and Acknowledgement Regarding Pro forma disclosure,
Income Statement Expense for Stock Options and net income trend Group N Yes No Pearson Chi-
square P value
1 35 100% 0% Pro forma disclosure Did ABC report a pro forma figure in its 2003 note on “Stock options (Yes/No)
2 33 9% 91%
3.3287
0.0681 0.1089(1)
Group N Yes No Pearson Chi-square P value
1 35 20% 80%
Expense relative to stock options Did ABC record a “Stock options” expense in its 2003 financial statements? (Yes/No)
2 33 82% 18%
25.9636
<0.0001
Group N < same > Pearson Chi-square P value
1 35 6% 0 94%
Net income trend ABC’s reported net income for fiscal year 2003 that was _____ than its reported net income in fiscal year 2002. (inferior, stable, superior)
2 33 88% 0 12%
46.2270
<0.0001
Group 1: Pro forma net income disclosed in notes to financial statements Group 2: Recording in the income statement of the expense related to stock options (1) Fisher Exact test two-sided
31
Table 3 Tests on underlying judgment of the company (H1)
Panel A: Perceived risk G N Mean Std
deviationt- test
(P value) Wilcoxon (P value)
1 35 6.49 1.40
1. Perceived investment risk I believe that an investment in ABC Inc. is ____ (on a 9 points Likert scale where 1 represents very low risk and 9 represents very high risk) 2 33 7.33 1.22
0.005
0.002
1 35 5.43 1.63 2. Overall financial condition I believe ABC’s overall financial condition is _______(on a 9 points Likert scale where 1 represents a very poor and 9 represents very good)
2 33 4.61 1.39 0.015 0.012
1 35 5.71 1.62 3. Ability to pay its debts I believe ABC’s ability to pay its debts as they come due is_______(on a 9 points Likert scale where 1 represents a very poor and 9 represents very good)
2 33 4.76 1.54
0.008
0.005
Panel B: Expected accounting return Mean (Std deviation)
Year G1 G2 t- test
(P value) Wilcoxon (P value)
2004 7.86 3.58 <0.001 <0.001 2005 8.17 5.18 0.002 0.001
1. Expected return on equity
What accounting return on equity do you expect for the next 3 years?___% 2006 8.34 5.85 0.014 0.013
G N ↓ No change
↑ Chi-square (P value)
1 35 34% 34% 31%
2. Future Net Income direction
I believe ABC’s future Net Income will ____ (decrease,, no change, increase)
2 33 55% 33% 12%
0.038
Group
N Mean Std deviation
t- test (P value)
Wilcoxon (P value)
1 35 4.80 1.66
3. Growth prospects I believe ABC’s growth prospects are____: (on a 9 points Likert scale where 1 represents very unfavorable and 9 represents very favorable)
2 33 4.30 1.53
0.102 0.058
Panel C: Overall perception
1 35 4.46 2.01 1. Perceived investment attractiveness I believe that an investment in ABC shares is (on a 9 points Likert scale where 1 represents not at all attractive and 9 represents very attractive)
2 33 3.15 1.50 0.002 0.002

32
Table 4 Tests on primary judgments (H2 and H3)
Group N Mean Std deviation t- test (P
value)
Wilcoxon (P value)
1
35
4.80
1.86
Expected future stock price directionAssume that the financial information for 2003 has just been publicly released and that the stock market is receiving this information for the first time. Please indicate what you believe will most likely happen to the stock price of ABC upon release of this information. (on a 9 points Likert scale where 1 represents significant price decrease and 9 represents significant price increase)
2
33
3.15
1.30
< 0.001 < 0.001
1
35
24.43
22.86
2
33
7.30
8.66
Stock price value Assume that ABC’s financial information for 2003 has just been publicly released. Please indicate what you believe to be a fair price for one share of ABC stock: ____$
2 33 4.27 1.66
0.001 0.001
33
Table 5 Tests on the Perceived Quality of Accounting Information
Group N Mean Std deviation t- test
(P value) Wilcoxon (P value)
1 35 5.03 1.92
Financial statements usefulness I believe ABC’s financial statements are in determining the company’s true, overall financial performance is____ (on a 9 points Likert scale where 1 represents not at all helpful and 9 represents very helpful)
2 33 5.88 1.69 0.029 0.077
1
35
4.46
2.08
Limpidity of financial statements I believe ABC’s financial statements are:_______(on a 9 points Likert scale where 1 represents not at all confusing and 9 represents very confusing)
2
33
4.52
1.70
0.450
0.465
1
35
5.66
1.85
Reliability of financial statements I believe ABC’s financial statements are:_______(on a 9 points Likert scale where 1 represents very unreliable and 9 represents very reliable)
2
33
5.48
1.28
0.329
0.182
1
35
5.51
2.08
Clarity of financial statements I believe ABC’s financial statements are_____: (on a 9 points Likert scale where 1 represents not at all clear and 9 represents very clear)
2
33
5.48
1.48
0.473 0.351
1
35
5.14
2.38
Confidence in valuation judgment Please assess how confident you are in your valuation judgment (on a 9 points Likert scale where 1 represents not confident and 9 represents very confident)
2 33 4.88 2.04
0.313 0.258