cafe standards beyond 2021 - latest analysis and … presentations/session 1... · aircraft wake...
TRANSCRIPT

CAFE Standards Beyond 2021 - Latest Analysis and Next Step
2nd Advanced Fuels and Engine Efficiency WorkshopSandia National Laboratories, Livermore, CA
The National Transportation Systems Center
Advancing transportation innovation for the public good
U.S. Department of TransportationOffice of the Secretary of TransportationJohn A. Volpe National Transportation Systems Center
November 1, [email protected]
2
Presentation Overview
About Volpe Corporate Average Fuel Economy ‐ a very brief history Recent publications and ongoing activity US DOT analysis framework Summary of “Draft Technology Assessment Report” findings
3
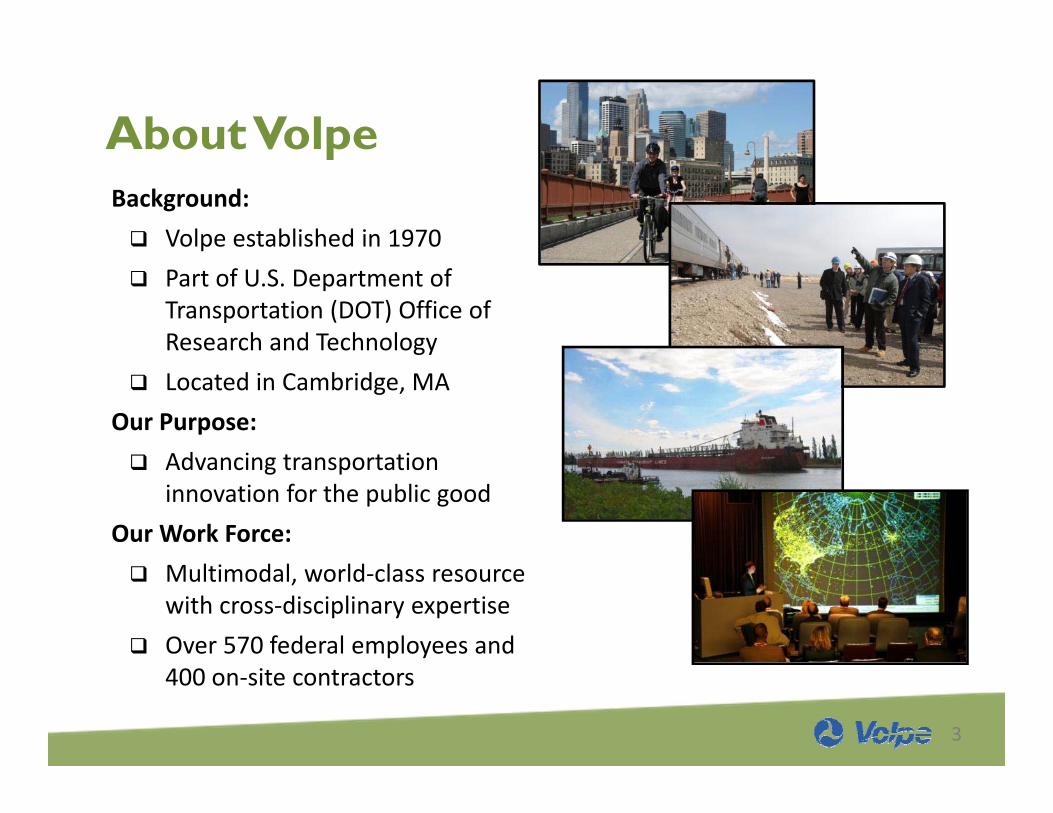
About VolpeBackground: Volpe established in 1970 Part of U.S. Department of
Transportation (DOT) Office of Research and Technology
Located in Cambridge, MAOur Purpose: Advancing transportation
innovation for the public goodOur Work Force: Multimodal, world‐class resource
with cross‐disciplinary expertise Over 570 federal employees and
400 on‐site contractors

4
Examples of work at Volpe
Maritime Safety and Security Information System (MSSIS) – DoD
Small Business Innovation Research Program – DOT Aircraft wake turbulence and aircraft separation – FAA
Improving grade crossing safety – FRA
Fuel economy research, analysis, and modeling (CAFE) – NHTSA
Connected vehicles evaluation and safety assessment – ITS JPO, NHTSA
Intelligent Transportation Systems policy and planning – ITS JPO
Remotely piloted aircraft technology assessments – FAA
Aviation Environmental Design Tool (AEDT) – FAA, NASA
Implementation of Strategic Highway Research Program (SHRP2) initiatives – FHWA

5
NHTSA has rule making authority for CAFE, and Volpe supports with analysis

6
Examples of work at Volpe

7
A very brief history of Corporate Average Fuel Economy
Originated in 1975 as part of the (Energy Policy and Conservation Act ‐ EPCA).
Long history of bi‐partisan support from many Congresses and Presidents.
Amended 2007 (Energy Independence and Security Act – EISA).
Requires Corporate Average Fuel Economy (CAFE) standards.
Requires DOT to set standards at maximum feasible levels for each fleet in each model year.
Requires DOT to enforce standards.
8
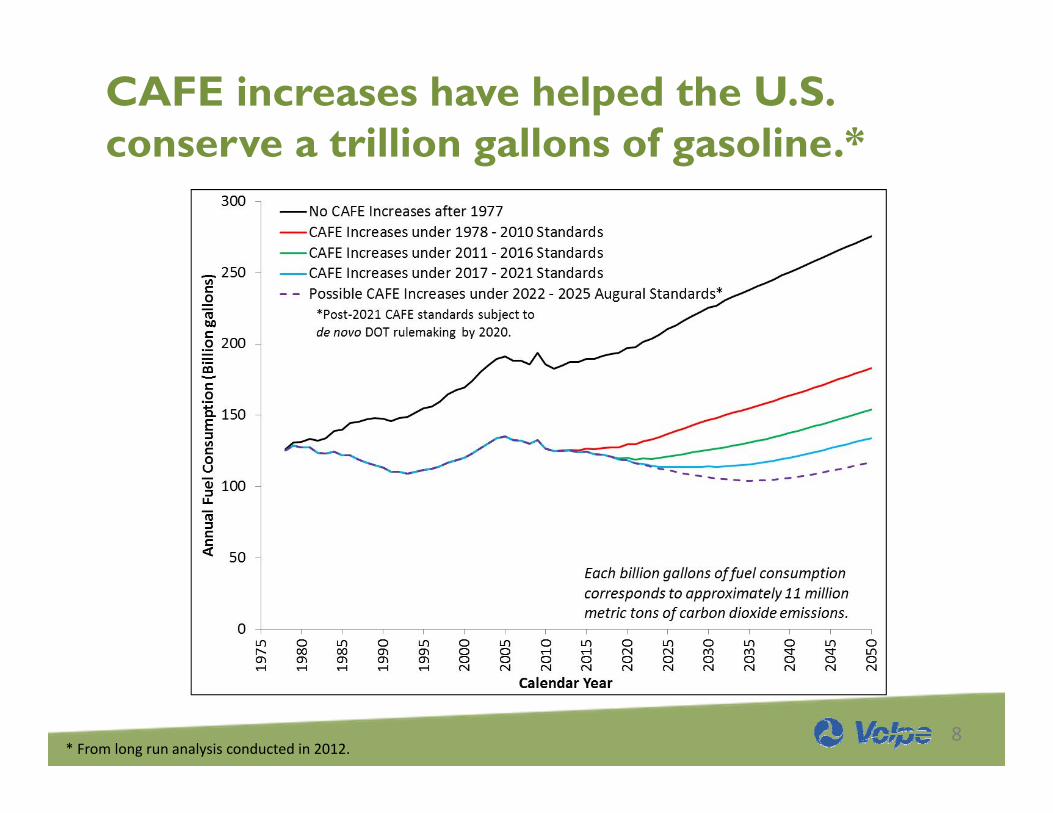
CAFE increases have helped the U.S. conserve a trillion gallons of gasoline.*
* From long run analysis conducted in 2012.

9
DOT has not yet proposed standards beyond 2021
Per EISA (2007), each CAFE rulemaking may cover at most 5 model years.
To establish final standards for model years 2022 and beyond, DOT must undertake a new rulemaking. The MY2017‐2021 light duty rule is final.
A July 2016 technical assessment (joint DOT, EPA, and CARB) began the process for 2022 and beyond.
DOT must consider a range of regulatory alternatives and cannot give any alternative special consideration.

10
The Light-Duty CAFE standards up through 2021 increase in stringency…

11
But Light-Duty CAFE standards are more complicated than one number…
Year‐by‐year fleet mix reallymatters

12
Recent CAFE activity (2016)
Late July 2016 ‐ EPA, NHTSA, and CARB published a “Draft Technology Assessment Report: Midterm Evaluation of Light‐Duty Vehicle Greenhouse Gas Emission Standards and Corporate Average Fuel Economy Standards for Model Years 2022‐2025”
Late September, 2016 ‐ Public comment period for Light Duty “Draft TAR” closed.
September 22, 2016 ‐ Congressional hearing for Light Duty CAFE.
August 16, 2016 – Medium duty / Heavy duty rule signed.

13
Let’s Talk Tech

14
DOT leverages best available information to inform analysis
Technology characterizations (engine maps, transmission efficiency maps, etc.)
Full vehicle simulations for more than 100,000 combinations of technologies and equipment.
Projected year‐by‐year application of technology as the observed fleet evolves in response to standards (projected response includes practical factors like refresh/redesign cycles, shared platforms, manufacturer product portfolio, etc.)
Technology costs (including R&D spending, tooling amortization, etc.)

15
NHTSA analysis relies on modeling and simulation tools from DOE and VOLPE
Full Vehicle Simulations Argonne National Labs
“Autonomie” Widely used tool in both
industry and academia
Fleet Evolution Volpe Model Model incorporates
feedback received during more than a decade of ongoing public review

16
The DOT analysis evaluates many (combinations of) technologiesAdvanced internal combustion engine technologies Turbo‐downsizing Cylinder deactivation Atkinson Cycle Diesel And in time will include other
emerging technologies (variable compression ratio, electronic valve control, etc.)
Advanced powertrain technologies Advanced transmissions Belt integrated starter‐
generator Hybrids and alternative fuel
vehicles
Vehicle technologies Mass reduction Rolling resistance Aerodynamic drag

17
Turbo engines, Hybrids, or Cylinder Deac. will be effective pathways for many cars
0%
10%
20%
30%
40%
50%
60%
70%
80%
90%
100%
2015 2016 2017 2018 2019 2020 2021 2022 2023 2024 2025
Market S
hare
Model Year
Draft TAR, Augural Standards ‐ Passenger Car Engine Systems
FCV/CNG
Electric Vehicle
PHEV
Strong Hybrid
Diesel
Atkinson Cycle
Turbo
Cylinder Deactivation
Naturally Aspirated Engine

18
Light Trucks may increasingly rely on Turbo-downsizing or cylinder deactivation
0%
10%
20%
30%
40%
50%
60%
70%
80%
90%
100%
2015 2016 2017 2018 2019 2020 2021 2022 2023 2024 2025
Market S
hare
Model Year
Draft TAR Analysis, Augural Standards ‐ Light Truck Engine Systems
FCV/CNG
Electric Vehicle
PHEV
Strong Hybrid
Diesel
Atkinson Cycle
Turbo
Cylinder Deactivation
Naturally Aspirated Engine

19
Belt Integrated Starter Generators (BISG) could be widely adopted by cars
0%
5%
10%
15%
20%
25%
2015 2016 2017 2018 2019 2020 2021 2022 2023 2024 2025
Draft TAR, Augural Standards ‐ BISG/CISG Penetration Rates
Cars
Light Trucks

20
Transmissions will add gears and reduce parasitic losses
0%
10%
20%
30%
40%
50%
60%
70%
80%
90%
100%
2015 2016 2017 2018 2019 2020 2021 2022 2023 2024 2025
Market S
hare
Model Year
Draft TAR Analysis, Augural Standards ‐ Car Transmission Systems*
MT7
MT6
MT5
CVT
DCT8
DCT6
AT8P
AT8
AT6P
AT6
AT5
* Non‐HEV transmissions

21
Transmissions will add gears and reduce parasitic losses
0%
10%
20%
30%
40%
50%
60%
70%
80%
90%
100%
2015 2016 2017 2018 2019 2020 2021 2022 2023 2024 2025
Market S
hare
Model Year
Draft TAR Analysis, Augural Standards ‐ Light Truck Transmission Systems*
MT7
MT6
MT5
CVT
DCT8
DCT6
AT8P
AT8
AT6P
AT6
AT5
* Non‐HEV transmissions

22
Additional levels of mass reduction are likely in Cars and Light Trucks
0%
5%
10%
15%
20%
25%
30%
35%
40%
45%
50%
MR1 MR2 MR3 MR4 MR5
Draft TAR, Augural ‐ LT Mass Reduction
2015 2025
0%
5%
10%
15%
20%
25%
30%
35%
40%
45%
50%
MR1 MR2 MR3 MR4 MR5
Draft TAR, Augural ‐ PC Mass Reduction
2015 2025

23
Additional aerodynamic improvements are likely in Cars and Light Trucks
0%
10%
20%
30%
40%
50%
60%
70%
80%
90%
CARS AERO10 CARS AERO20 LT AERO10 LT AERO20
Draft TAR, Augural Standards – Aerodynamics Improvements
2015 2025
24
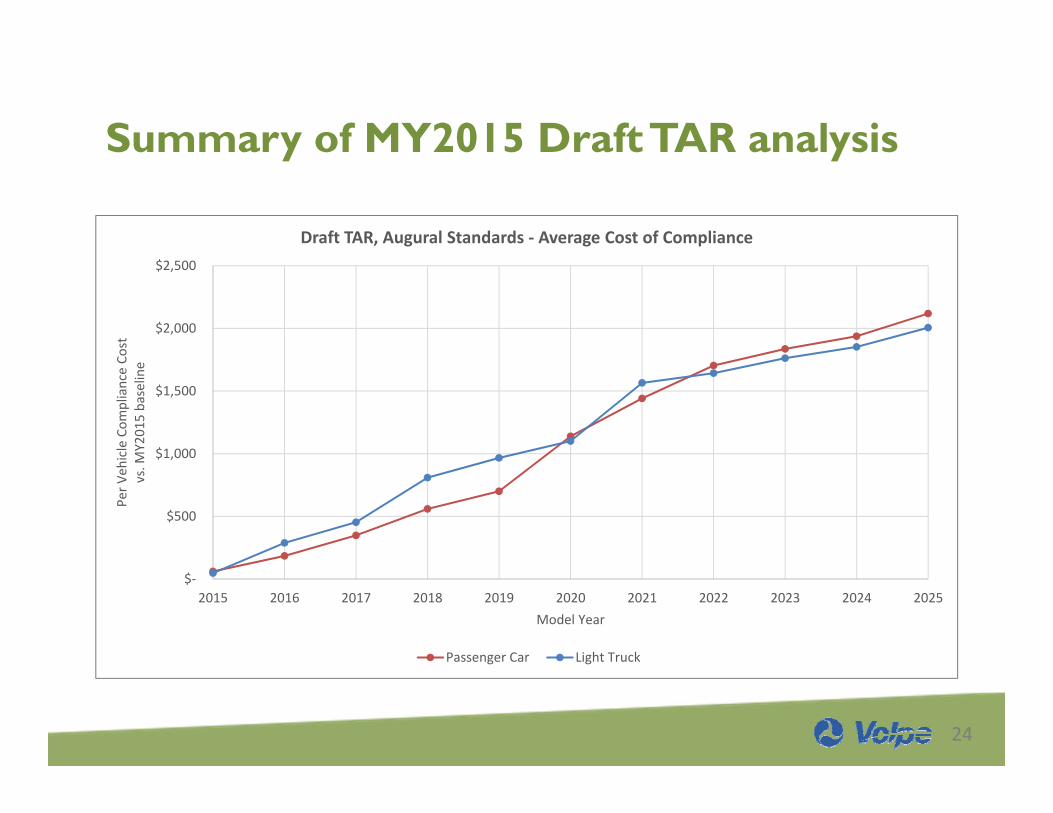
Summary of MY2015 Draft TAR analysis
$‐
$500
$1,000
$1,500
$2,000
$2,500
2015 2016 2017 2018 2019 2020 2021 2022 2023 2024 2025
Per V
ehicle Com
pliance Co
stvs. M
Y201
5 baseline
Model Year
Draft TAR, Augural Standards ‐ Average Cost of Compliance
Passenger Car Light Truck

25
DOT continues to align our analysis with observations of the fleet
26
Summary of pending DOT updates
MY2016 fleet Improved “baseline” vehicle classifications Re‐run engine maps with regular fuel Additional advanced transmissions (10‐speed, for example) Adjustments to final drive ratio for performance neutrality Updated technology costs Ongoing stakeholder engagement…

27
Thanks, and stay tuned!
Dan BogardTechnology Policy AnalystVolpe National Transportation Systems Center