cae · corporate profile cae annual report 2004 cae is a leading provider of integrated training...
TRANSCRIPT

Annual Report for the year ended March 31, 2004
ESSENTIAL FOCUS
www.cae.com
CA
E A
nn
ual R
epo
rt for th
e year end
ed M
arch 31, 2004
CAE ANNUAL REPORT 2004CORPORATE PROFILE
CAE IS A LEADING PROVIDER OF INTEGRATED TRAINING SOLUTIONS AND ADVANCED SIMULATIONAND CONTROLS TECHNOLOGIES TO CIVIL AVIATION, MILITARY AND MARINE CUSTOMERS. THECOMPANY HAS TRAINING FACILITIES AND OPERATIONS IN 19 COUNTRIES ON FIVE CONTINENTS, ANDGENERATES ANNUAL REVENUES IN EXCESS OF C$1 BILLION.
CAE CORPORATE PROFILE
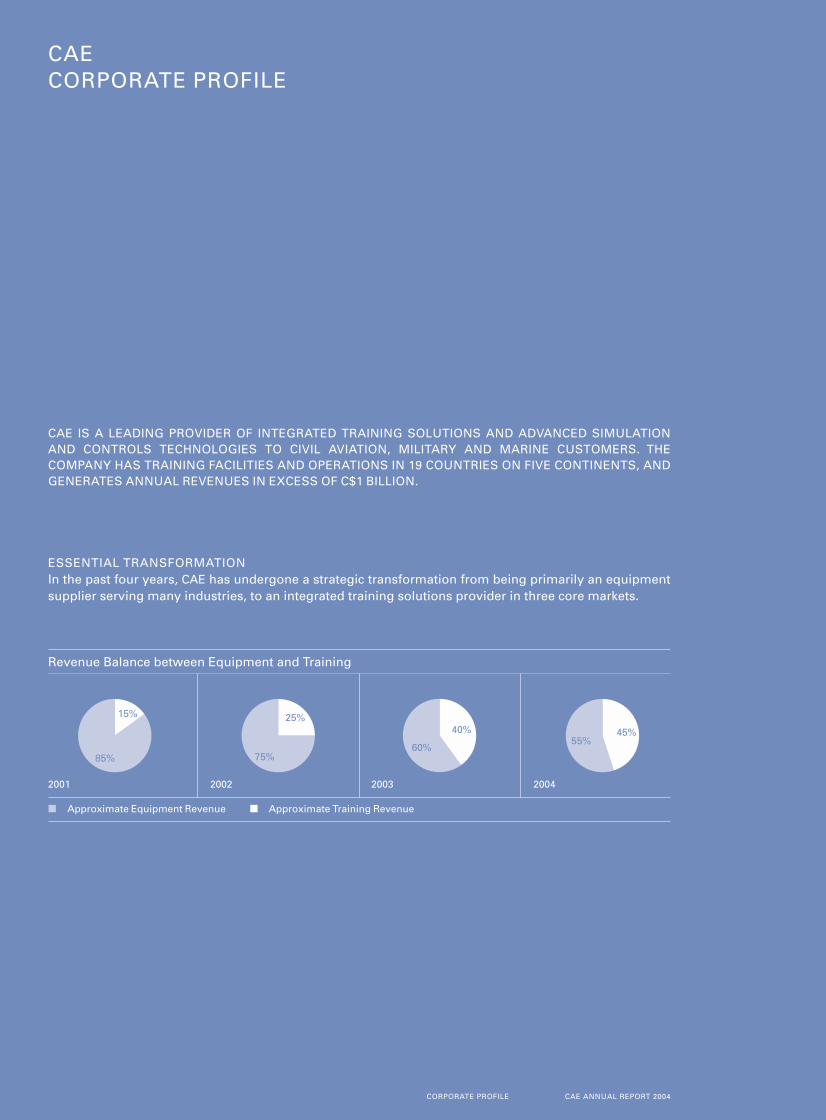
ESSENTIAL TRANSFORMATIONIn the past four years, CAE has undergone a strategic transformation from being primarily an equipmentsupplier serving many industries, to an integrated training solutions provider in three core markets.
Revenue Balance between Equipment and Training
■ Approximate Equipment Revenue ■ Approximate Training Revenue
15%
85%
25%
75%
40%
60%
45%55%
2001 2002 2003 2004
CAE ANNUAL REPORT 2004 SHAREHOLDER AND INVESTOR INFORMATION
SHAREHOLDER AND INVESTOR INFORMATION
CAE SHARES
CAE’s shares are traded on the Toronto Stock Exchange(TSX) under the symbol “CAE” and on the New YorkStock Exchange (NYSE) under the symbol “CGT” (CAE Global Training).
TRANSFER AGENT AND REGISTRAR
Computershare Trust Company of Canada100 University Avenue, 9th FloorToronto, Ontario M5J 2Y1Tel: (514) 982-7555 or 1-800-564-6253 (toll free in
Canada and the US)Fax: (514) 982-7635 or 1-866-249-7775 (toll free in
Canada and the US)E-mail: [email protected]
DIVIDEND REINVESTMENT PLAN
Canadian resident registered shareholders of CAE Inc.who wish to receive dividends in the form of CAE Inc.common shares rather than a cash payment may participate in CAE’s dividend reinvestment plan. In orderto obtain the dividend reinvestment plan form pleasecontact Computershare Trust Company of Canada.
DIRECT DEPOSIT DIVIDEND
Canadian resident registered shareholders of CAE Inc.who receive cash dividends may elect to have the dividend payment deposited directly to their bankaccounts instead of receiving a cheque. In order toobtain the direct deposit dividend form please contactComputershare Trust Company of Canada.
DUPLICATE MAILINGS
To eliminate duplicate mailings by consolidatingaccounts, registered shareholders must contactComputershare Trust Company of Canada; non-registered shareholders must contact their brokers.
FISCAL 2005 TENTATIVE QUARTERLY RESULTS
RELEASE DATES
• August 11, 2004• November 4, 2004• February 3, 2005• May 11, 2005
Quarterly and annual reports as well as other corporatedocuments are available on our website: www.cae.com.These documents can also be obtained from ourInvestor Relations department.
INVESTOR RELATIONS
Andrew C. ArnovitzDirector, Corporate Communications and Investor RelationsCAE Inc.8585 Cote-de-LiesseP.O. Box 1800Saint-Laurent, Quebec H4L 4X4Tel: [email protected]
VERSION FRANÇAISE
Pour obtenir la version française du rapport annuel,s’adresser à [email protected].
2004 ANNUAL MEETING
The Annual Meeting of Shareholders will be held at10:30 a.m. (local time), Wednesday, August 11, 2004, at the International Civil Aviation Organization, 999 University Street, Room 3, Montreal, Quebec. The meeting will also be webcast live on our website at www.cae.com.
AUDITORS
PricewaterhouseCoopers Chartered AccountantsMontreal, Quebec
TRADEMARKS
The CAE logo, and the terms CAE Simfinity, CAE Sim XXI,CAE Tropos and CAE Medallion-S are all trademarks ofCAE or its subsidiaries.
INT
ER
BR
AN
D,
TO
RO
NT
O
P
RIN
TE
D I
N C
AN
AD
A

CAE ANNUAL REPORT 2004 FINANCIAL HIGHLIGHTS 1
(amounts in millions except per share amounts) 2004 2003 2002
Operating resultsContinuing operations
Revenue 1,093.2 1,130.5 1,126.5Earnings 67.1 131.0 148.4
Net earnings 64.0 117.2 149.5
Financial positionTotal assets 2,293.3 2,356.5 2,378.4 Total long-term debt, net of cash 575.0 794.3 837.7
Per shareEarnings from continuing operations 0.29 0.60 0.68 Net earnings 0.27 0.53 0.69 Dividends 0.12 0.12 0.11 Shareholders’ equity 3.94 3.42 2.81
2004FINANCIAL HIGHLIGHTS
Geographic Distribution of Revenue
2004
Canada Europe
2003 2002
United States Other
12%
31%
39%
18%
8%
29%
38%
25%
9%
31%
35%
25%
Revenue by Business Segment
2004
Civil Marine
2003 2002
Military
42%
43%15%
46%
39%15%
48%
41%11%

2 CAE ANNUAL REPORT 2004CHAIRMAN’S MESSAGE
MESSAGE FROM THE CHAIRMAN
L.R. WilsonChairman of the Board
Since 2000, CAE has undergone a substantialtransformation, re-focusing assets deployed inadvanced technology manufacturing in severaldifferent industries into the provision of integratedsimulation-based training solutions in commercialaviation, military and marine markets.
Subsequent to the tragic events of September11, 2001, the Company’s main businesses havebeen affected by very difficult market conditions.During the past year, in spite of the continuingdownturn in civil aviation and the strongerCanadian dollar, the Company was able to improveits performance in the second half of the year.Total revenue was about the same as that of theprevious year, and CAE remained profitable, butbelow the prior period. Increased revenues fromour growing civil aviation training business par-tially offset a reduced contribution from simulationequipment sales. The Military and Marine unitsboth performed well.
Our priorities continue to be to improve mar-gins to bolster profits for each business segment,and to generate positive cash flow to furtherstrengthen our balance sheet.
CAE’s corporate transformation has beensuccessfully carried out during a period of unprece-dented turbulence in the civil aviation market. Thisis a testament to the dedication of all CAE employ-ees, led by an outstanding management team.Derek Burney, our Chief Executive, will be passingthe mantle of leadership to Robert Brown this sum-mer and formally retiring in October – five yearsafter taking the reins at CAE in the fall of 1999.
Driving change in a large, well-establishedorganization with a history of achievement isnever easy – it requires vision, determination andcommitment. On behalf of all CAE directors, share-holders and employees, I wish to express oursincere gratitude and admiration for Mr. Burney’stireless efforts on behalf of the Company duringfive action-packed years. He leaves CAE extremelywell-positioned for the future.
We welcome Mr. Brown to CAE and are confi-dent that his extensive aerospace experience aswell as his proven leadership skills will ensure theCompany’s continuing success.
L.R. WilsonChairman of the Board
CAE ANNUAL REPORT 2004 LETTER TO SHAREHOLDERS 3
LETTER TOSHAREHOLDERS
D.H. BurneyPresident and
Chief Executive Officer
Fiscal year 2004 was a challenging year for CAE inmany respects, with market highs and lows and a rapid and significant strengthening in theCanadian dollar relative to the US dollar, whichaffected revenue and EBIT for each of our businesssegments. In addition, our Civil Simulation andTraining unit encountered a “perfect storm” ofmarket conditions that eroded both margins andearnings and obscured an otherwise impressiveperformance in terms of full flight simulatororders and steady growth in training revenues.Marine Controls would have matched the prioryear’s results if foreign currency adjustments wereexcluded. Our Military Simulation and Trainingunit’s financial results were in line with expecta-tions, but the loss of two major contracts marredwhat was a solid year for them. All three unitsgenerated a stronger performance in the secondhalf of the year than the preceding six months andhope to maintain that traction into FY’05. TheCompany also reduced its net debt by more than$200 million during FY’04 and so enters FY’05 witha stronger balance sheet.
Despite the market turmoil, the key elementsof our transformation strategy are working and arepositioning CAE firmly for future growth. Civil isnow providing training in more than one hundredsimulators at more than 20 locations on four conti-nents. We are expanding in fast-growing marketslike the Middle East and China through joint ventures with Emirates and China Southern. OurPC-based CAE Simfinity™ technology is proving tobe a true market differentiator that adds value to arange of CAE’s training products and services. CAESimfinity™ is being incorporated into all Airbustraining programs, including the new Airbus A380– another dividend of our co-operation agreement.
The long-term agreement with the fractional business jet operator, Flight Options, represented amajor win for CAE SimuFlite over our competition.Training agreements with Iberia, and morerecently, LAN (Chile) and easyJet bode well forfuture arrangements with other carriers that havetraditionally met their training needs in-house.Adding a healthy balance to Civil’s performancewas its continuing market leadership in simulationequipment sales, winning 16 of 19 full flight simu-lator orders in FY’04, including prototypes for theA380 and the Embraer 170/190 family of aircraft.Our Visual systems captured a record 80% share ofthe civil market.
Military and Marine provided much-needed stability during Civil’s “perfect storm”. Marinecompleted a strong second half performanceenjoying notable success in Asia and in the con-struction of controls for next generation US navalvessels. Despite the Flight School XXI and the CF-18 contract setbacks, Military’s order bookexceeded $500 million. Orders in the second halfalone exceeded the full total from the previousyear. While the loss of the Canadian CF-18 contractwas discouraging, we believe the decision raisesmore questions about the Canadian government’sprocurement process than about CAE’s technologyand expertise. Significantly, almost 40% of Military’sorders came from the US, demonstrating theattraction of our leading edge technology to theUS Army Special Operations Forces as well as thestrength of our ongoing service and equipmentcontracts. Important as the US defence market maybe, CAE’s perspective is global. We enjoy a solidreputation and relationships worldwide, evidencedbest in 2004 by Military’s expanding service roles insupport of Australian and German defence forces.
4 CAE ANNUAL REPORT 2004LETTER TO SHAREHOLDERS
”I HAVE NO DOUBT THAT THE COMPANY IS BETTER OFF TODAY, WITH A MORE CERTAIN FUTURE,BECAUSE OF OUR STRATEGIC TRANSFORMATION.”
This will be my last Letter to Shareholders as CAE’s CEO. Robert Brown will be succeedingme at the Annual General Meeting in August and I am confident the Company will be in safe andsure hands. In order to help ensure a smooth tran-sition, I will continue to serve as Vice-Chairmanuntil my formal retirement in October.
When I look back at what has been achievedsince October of 1999 – in times more turbulentthan anyone might have expected – there aremany sources of genuine pride:
• The strategic move into training. We have come along way in a short time with greenfield centres,acquisitions, joint ventures and outsourcingagreements;
• Our re-entry and steady growth in the key USdefence market;
• The doubling in size of Marine through our moveinto commercial shipping and the rejuvenation ofour American operation; and
• The success of our new technologies in all busi-nesses, notably visuals, NETTS, CAE Simfinity™and CAE Sim XXI™.
CAE is now more focused, more global andmore balanced. I have no doubt that the Companyis better off today, with a more certain future,because of our strategic transformation. Militaryand Marine are already well positioned for growth.When the civil market recovers – and that day willcome – I am confident that our transformation andour considerable investment of money and effortin training will pay off.
Technology is our underlying strength but,ultimately, it is the people of CAE who have trans-formed the company and who are the basis for itsfuture success. I am very proud to have been asso-ciated with them in what has been a stimulatingadventure. I am also grateful for their steadfastsupport.
D.H. BurneyPresident and Chief Executive Officer

CAE ANNUAL REPORT 2004 ESSENTIAL FOCUS 5
CAE IS NOW MORE FOCUSED,MORE GLOBAL AND MOREBALANCED. DESPITE THE MARKETTURMOIL, THE KEY ELEMENTS OF OUR TRANSFORMATIONSTRATEGY ARE WORKING ANDARE POSITIONING CAE FIRMLYFOR FUTURE GROWTH.

6 CAE ANNUAL REPORT 2004ESSENTIAL FOCUS – CIVIL SIMULATION AND TRAINING
CIVIL SIMULATION AND TRAININGTRANSFORMING THE TRAINING EXPERIENCE
Delivering Value through the Power of ChoiceThe essence of the value proposition offered by CAE’s Civil Simulation and Training unit is choice. Airlineand business jet customers enjoy the flexibility to customize their own training solution from Civil’s suiteof innovative equipment and/or services – ranging from the use of Civil’s training facilities to instructionfrom CAE’s certified training officers. Regardless of the customer’s choice, access to the world-leadingCAE Simfinity™ training tool provides pilots and maintenance personnel with an enriched experiencefrom the outset of the learning process by bringing high fidelity aircraft simulation into the classroom.During fiscal 2004, airlines that continue to provide their own training in-house ordered 16 new full flightsimulators from CAE. Civil was also proud to be selected by one of the leading low-cost US carriers,JetBlue, as its preferred supplier of simulation training equipment.
Mike Barger, Vice President and Chief Learning Officer > >
JetBlue University, JetBlue Airways Corporation

CAE ANNUAL REPORT 2004 ESSENTIAL FOCUS – CIVIL SIMULATION AND TRAINING 7
Growing with DemandDuring fiscal year 2004, Civil grew its training networkfrom 89 to over 100 installed flight simulators in morethan 20 strategic locations on four continents, buildingits training backlog by signing several new trainingagreements, primarily with fast-growing regional air-lines, low-cost carriers and business jet fleet operators.Civil expanded its presence in two of the world’s fastestgrowing aviation markets through its joint ventures withChina Southern Airlines in Guangdong Province andwith Emirates, the world’s fastest growing interconti-nental full-service airline, in the Middle East hub ofDubai. Continuing price competition in air travel meansthat cost containment and the efficient use of capital aredaily imperatives for major international airlines. Ofsignificant strategic importance, therefore, was the path-breaking agreement between CAE and Iberia Airlines topool their Spanish-based training assets in a joint venture. CAE intends to forge mutually beneficial part-nerships with other major airlines in the future.
Close Co-operation with Aircraft ManufacturersA key to Civil’s success is close co-operation with originalaircraft manufacturers, exemplified by the production ofprototype simulators for new aircraft like the Airbus A380and Embraer’s 170/190 regional jets. During the fiscalyear, CAE and Airbus extended their Co-operation Agree-ment into the Airbus Corporate Jetliner (ACJ) family of aircraft and advanced plans to expand beyond thetraining of aircrews to maintenance personnel. CAE’sworld-leading PC-based CAE Simfinity™ training softwarecontinued to be integrated into the Airbus curricula, providing Airbus trainees with a high fidelity learningexperience from ground school to full flight simulation.
< < Michele Asmar, Manager
Integrated Training Solutions, CAE

8 CAE ANNUAL REPORT 2004ESSENTIAL FOCUS – MILITARY SIMULATION AND TRAINING
MILITARY SIMULATION AND TRAININGENABLING MISSION READINESS
Working with America’s EliteCAE’s acknowledged leadership in the field of military training systems helped the Military Simulationand Training unit secure over $500 million in new orders during fiscal year 2004. Military continued tobuild a special relationship with the US Army’s 160th Special Operations Aviation Regiment (Airborne),winning a series of contracts valued at over $100 million to provide sophisticated mission rehearsaland training systems. This important work in support of some of the US Army’s most elite forces involvesthe supply of a new MH-47 Chinook combat mission simulator (CMS), the design of a new MH-60 Black Hawk CMS and the development of complementary desktop and part task trainers based onCAE Simfinity™ technology. In addition, CAE commenced the design of a common environment/commondatabase (CE/CDB) architecture that promises to revolutionize the speed and accuracy of missionrehearsal. Military is currently building the world’s first AH/MH-6 Little Bird CMS pursuant to its role asprime contractor under the US Army’s “ASTARS” program, with delivery expected in early 2005.
Larry E. Grice, CW4, United States Army, Chief, Mission Training & Preparation Systems Branch > >
US Special Operations Command

CAE ANNUAL REPORT 2004 ESSENTIAL FOCUS – MILITARY SIMULATION AND TRAINING 9
A World Leader in Helicopter TrainingIn 2004, a joint venture company established by CAE andThales was selected to provide a range of NH90 heli-copter training systems to eight European countries ina program valued initially at $650 million. Military isalso upgrading additional US Army AH-64A Apachecombat mission simulators with the leading-edge CAE Medallion-S™ visual system. In addition, Military’sresponsibilities under its long-term training supportagreement with the Australian Defence Forces expandedsignificantly as the company won orders for CAESimfinity™ virtual maintenance trainers for the BlackHawk and Seahawk helicopters.
Readying to TransportCAE is playing a key role supporting the US Air Force’sand US Marine Corps’ future tactical airlift and tankercapabilities. Following a multi-year procurement of C-130J and KC-130J aircraft, CAE has been awarded subcontracts from Lockheed Martin valued in excess of$150 million. Military will be providing a range of train-ers for maintenance and aircrews, as well as operationand maintenance support. Long the world’s leadingprovider of both C-130 training and simulation equip-ment, Military trains C-130 personnel from over 20countries at its Tampa training centre.
< < David Graham, Director
Special Operations Forces Programs, CAE USA

10 CAE ANNUAL REPORT 2004ESSENTIAL FOCUS – MARINE CONTROLS
MARINE CONTROLSENSURING EFFECTIVE CONTROL
Cruise ControlsCAE’s Marine Controls unit continued to pursue a strategy of balanced growth in both naval and commer-cial markets. Installed in over 450 commercial marine vessels around the world, the Damatic™ systemsof Norway-based CAE Valmarine enable a single crewman to have full control of all shipboard machineryand equipment. During fiscal year 2004, CAE Valmarine systems were selected for installation in a varietyof existing and new Carnival Group cruise ships, as well as the world’s largest cruise ferry being con-structed for Norway’s Color Line. This is the same controls system being used in the world’s largestcruiseship, the Queen Mary 2, which completed its maiden voyage early in calendar year 2004.
Commodore Ronald Warwick, Master of Queen Mary 2 > >
Cunard Line
CAE ANNUAL REPORT 2004 ESSENTIAL FOCUS – MARINE CONTROLS 11
Reinforcing Strong Relationships in Asia Marine’s computer-based digital automation systemscan be found in the ships of 18 navies around the world,performing key functions while providing vital informa-tion to those charged with control. In fiscal year 2004,Marine continued to deepen its relationship with majornavies in the Asia-Pacific region. Following on its previ-ously contracted work in the Indian navy’s Project 17frigate program, Marine was chosen to supply propul-sion and damage control systems for three new landingships. Meanwhile, a CAE system is being installed in thelatest KDX-II destroyer destined for the Republic ofKorea Navy (ROKN) – the tenth selection of CAE’s controlsystems by the ROKN.
An Integral Part of the Next Generation US NavyThe technological leadership of CAE’s Marine Controlsunit was evidenced by its selection to provide key electri-cal plant control systems for use in both the US Navy’snext generation DD(X) destroyers and the largest andmost advanced warship in naval history, the Nimitz-classaircraft carrier, the USS George H.W. Bush. In addition,Marine is providing an engineering control systemfor the USS New York, the fifth of twelve plannedSan Antonio class amphibious transport docking ships.CAE has been awarded a Navy Excellence Award for itsefforts in connection with the latter program.
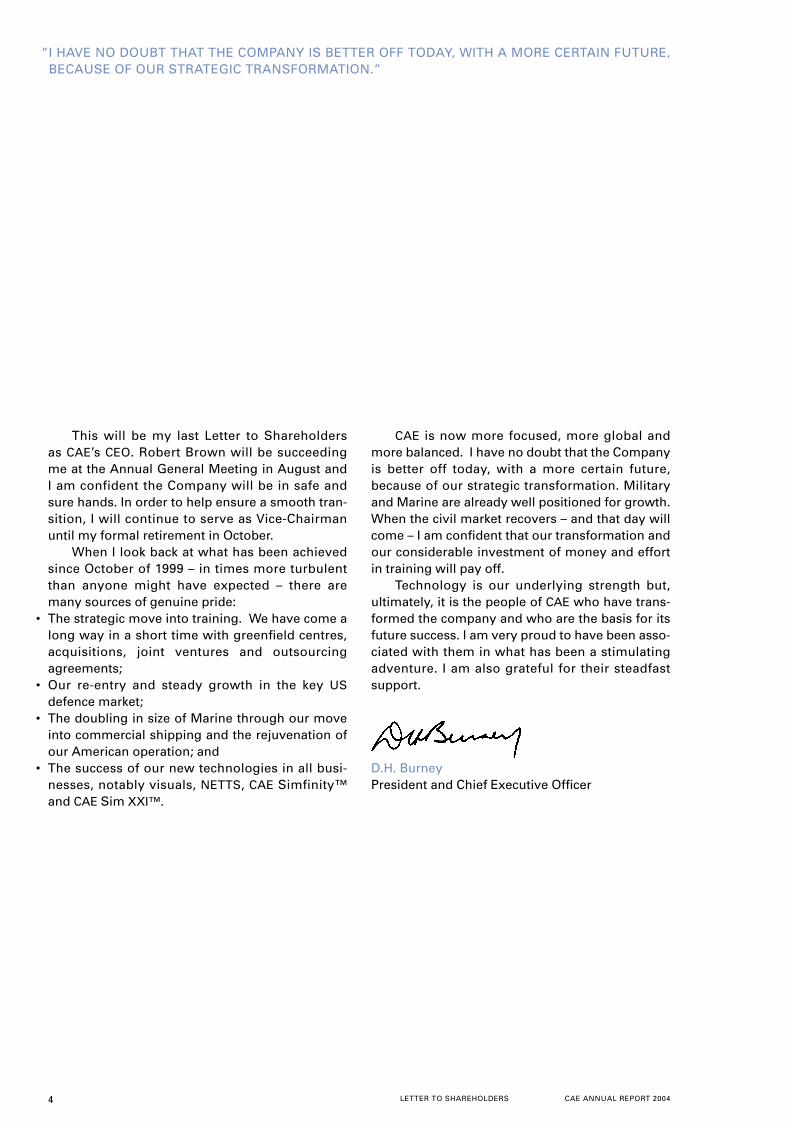
< < Odd Jorgensen, Vice President – Technical
CAE Valmarine

12 CAE ANNUAL REPORT 2004CEO EXCELLENCE AWARD RECIPIENTS 2004
RECOGNIZING OUR BEST
In October of 2003, CAE introduced the Distinction Award Program that honours up to 15 employees eachquarter who have promoted teamwork within CAE, exhibited innovative thinking that creates value for cus-tomers or the Company, or taken action that builds and strengthens a customer relationship. The programand nomination process will be fully operational at CAE locations around the world by October of 2004.
Since 2000, CEO Excellence Awards have recognized a select group of individuals each year who havedemonstrated consistent exemplary performance, inspired their co-workers and led by example. These arethe recipients of this prestigious award for fiscal year 2004.
Not shown:
Angel Gomez MartinTechnical ManagerAviation Training – Madrid CentreCivil Simulation & TrainingMadrid, Spain
Patrick WoutersProject ManagerMilitary Simulation & TrainingStolberg, Germany
Costa AlexiouManager, Business Development(Aviation Training)Civil Simulation & TrainingMontreal, Canada
Roberta JamesonProgram Manager, Training ServicesMilitary Simulation & TrainingTampa, Florida, USA
Alain Le BlancManager, Core Software and CommunicationMarine ControlsMontreal, Canada
Bruno CacciolaManager, Program DeploymentMilitary Simulation & TrainingMontreal, Canada
Dean WilliamsonProject Manager, EngineeringMarine ControlsLeesburg, Virginia, USA
Stéphane ClémentManager, Evaluation and Test OperationsMontreal, Canada

CAE ANNUAL REPORT 2004 FINANCIAL REVIEW 13
14
Management’sDiscussion andAnalysis
29
Management and Auditors’ Reports
30
ConsolidatedFinancialStatements
33
Notes to ConsolidatedFinancial Statements
64
Board ofDirectors and Officers
65
Shareholder and InvestorInformation
2004FINANCIAL REVIEW

14 CAE ANNUAL REPORT 2004MANAGEMENT’S DISCUSSION AND ANALYSIS
For purposes of this discussion, “CAE” or the “Company”refers to CAE Inc. and its subsidiaries.
This Management’s Discussion and Analysis(“MD&A”) contains commentary from CAE managementregarding strategy, operating results, and financial condition. Management is responsible for its accuracy,integrity and objectivity, and has developed, maintainsand supports the necessary systems and controls to provide reasonable assurance as to the comments con-tained therein.
CAE’s common shares are listed on the Torontoand New York stock exchanges. Except as otherwiseindicated, all financial information related herein isdetermined in accordance on the basis of Canadian gen-erally accepted accounting principles (“Canadian GAAP”).All dollar amounts referred to herein are Canadian dol-lars unless otherwise specified.
This MD&A is current as of May 11, 2004. Additionalinformation relating to the Company, including itsAnnual Information Form (“AIF”) is available online atwww.sedar.com, as well as at the Company’s website atwww.cae.com.
This MD&A should be read in conjunction with theaudited consolidated financial statements and notes tothe consolidated financial statements for the 2004 fiscalyear contained on pages 30 to 61. It focuses on the corebusiness segments of CAE: Civil Simulation and Training(“Civil”), Military Simulation and Training (“Military”)and Marine Controls (“Marine”).
CAUTIONARY STATEMENTS REGARDINGFORWARD-LOOKING INFORMATION
Certain information in this MD&A is forward-looking andis subject to important risks and uncertainties. Forward-looking information statements with respect to CAE andthe operations of each of its business segments includeinformation concerning the Company’s future financialperformance, business strategy, plans, goals and objec-tives. Statements preceded by the word “believe”,“expect”, “anticipate”, “intend”, “continue”, “esti-mate”, “may”, “will”, “should” and similar expressionsare forward-looking statements.
This MD&A is based on assumptions, which CAEconsidered reasonable at the time they were prepared.Any forward-looking statements, by their nature, neces-sarily involve risks and uncertainties that could causeactual results to differ materially from those contem-plated by the forward-looking statements. CAE cautionsthe reader that the assumptions regarding future events,many of which are beyond the control of CAE, may ulti-mately prove to be incorrect. The Company intends theforward-looking information to speak only as of the timefirst made and does not undertake to update or reviseit whether as a result of new information, future events,or otherwise. Factors that could cause actual results
or events to differ materially from current expectationsare discussed herein – see the Business Risksand Uncertainties section of this MD&A for additionalinformation.
BUSINESS OVERVIEW
In fiscal 2004, CAE faced numerous challenges. The com-bination of low demand in the commercial aerospacemarket, fierce competition and the 13% increase year overyear in the Canadian dollar against its American counter-part have contributed to a reduction in the margins foreach of the Company’s business segments.
Civil ended the fiscal year with 16 full flight simula-tor orders (compared to 11 orders in the prior year) anda training network with an installed base of 102 simula-tors located in 21 locations on four continents. Civilachieved a 20% year-over-year growth of its training revenue when excluding the impact of currency adjust-ments. While the 13% growth in airline passenger trafficduring fiscal 2004, the development of the new AirbusA380 and the rising level of new aircraft orders bodewell for the future of the civil aviation industry, fiscal2004 remained a year of recovery for the commercial air-line industry.
Military almost doubled the amount of new ordersin fiscal 2004 (over $500 million) versus fiscal 2003 andnearly 40% of these new orders came from the US mar-ket. Military’s growth prospects were marred by the lossof two significant projects – Flight School XXI in theUS and the Canadian CF-18 Advanced DistributedCombat Training System (“ADCTS”). The Canadian fed-eral government’s decision to grant the latter contract toa competitor was primarily responsible for CAE havingto lay off approximately 300 employees in April 2004,located mostly in Montreal, for which a restructuringcharge of $8.2 million was recorded in the fourth quarterof fiscal 2004. This amount, added to the $1.8 million ofseverance costs incurred earlier in the fourth quarter offiscal 2004, brought the total restructuring cost for theyear to $10.0 million.
Marine maintained its performance. The reductionin both revenue and earnings before interest, incometaxes and discontinued operations was primarily due tothe strengthening of the Canadian dollar against othercurrencies. Despite marginally lower revenues, Marinehas maintained its percentage margins at the same levelsas last year. Marine continued to record a high level ofcontract wins in its markets and its superior technologyand execution has helped it to remain a market leader.
While fiscal 2004 was a difficult year, managementremains determined to improve the Company’s prof-itability. More orders for Civil simulators in fiscal 2004and an increase in Civil training combined with thestronger order bookings for Military are encouraging.
MANAGEMENT’S DISCUSSION AND ANALYSIS
May 11, 2004

CAE ANNUAL REPORT 2004 MANAGEMENT’S DISCUSSION AND ANALYSIS 15
of training services by leveraging CAE’s technologyofferings. Military is also expected to build further onopportunities it has together with its partner Thales onthe European NH-90 helicopter program, for which theCAE-Thales team was recently selected. The total pro-gram is initially valued at $650.0 million for trainingequipment only. The contract contemplates trainingequipment requirements for 400 helicopters, however,CAE expects worldwide market demand may be morethan double this. Maintenance services and trainingsupport will also be required for the NH-90 programwhich could generate additional revenues of $1.0 billionor more over the next 20 years.
Marine’s strategic priorities will include expandingits scope of supply to include navigation sensors and/orelectrical and communication systems, and to maintain-ing its leadership in product innovation. Penetratingnew geographical markets, such as China, Japan, andKorea, together with winning a larger share of the mid-size commercial ships market will continue to be apriority as well.
BUSINESS RISKS AND UNCERTAINTIES
CAE operates in different industry segments that involvevarious risk factors and uncertainties, which are carefullyconsidered in the Company’s management policies.
CAE’s success in civil aviation, military and marinemarkets depends fundamentally on the reliability of itsproducts, the quality of its services and its ability toadapt, in a timely manner, to changing customer needsand industry standards. The Company operates in differ-ent industry segments and global markets that involvevarious risk factors and uncertainties, including world-wide economic and political trends and developments.
CAE operates in the civil simulation equipment andtraining services markets, both of which are heavilydependent on demand for air transportation and thefinancial condition of commercial airlines. The major air-line bankruptcies in Europe, the US, Canada and otherCAE markets pose risks to CAE as an unsecured vendorand/or service provider to these and other potentiallyinsolvent customers. Demand for simulation equipmenttends to follow the trend established in the commercialairline industry, particularly the delivery of new aircraft.Any reduced demand may in turn lead to reduced pro-duction levels, which impacts margins negatively. Theutilization of CAE’s installed base of simulators in its train-ing network depends on the extent to which simulatedaircraft types match the configuration of in-use aircraft, aswell as on the overall level of commercial air traffic.
CAE must comply with rules imposed by regulatoryauthorities that may change without notice, resulting inpotential disruptions to sales and operations. The sale orlicence of virtually all of CAE’s products is subject to vari-ous regulatory controls that change with some frequency.
CAE’s Military and Marine businesses depend heavily on government programs and contracts that ulti-mately reflect the level of government expendituresdirected towards national defence budgets (particularlycapital equipment programs), the priority of various pro-grams within defence budgets and, in certain instances,the maintenance of government programs supportingresearch and development. Programs may be only
BUSINESS PROFILE AND STRATEGY
CAE is a global leader in delivering “The Essential Edge”in safety, readiness and efficiency in three core markets:Civil, Military, and Marine. In the past four years, it hastransformed itself from an equipment supplier to anintegrated training solutions provider. In fiscal 2004, CAEderived 45% of its revenue from training services, com-pared to only 15% in fiscal 2001. This transformation hasbeen enabled by CAE’s strategic consolidation and intro-duction of new training capacity, innovative trainingcourses and technologies, combined with its leadingedge simulation equipment and software.
The Company is a leading civil aviation trainingsolutions provider via its Civil business segment, whichis a world leader in the design and production of com-mercial flight simulators and visual systems as well asthe second largest supplier of integrated aviation train-ing solutions to each market served – business aviation,regional and commercial airlines markets.
CAE is also a premier supplier of equipment,designer and manufacturer of military flight and land-based simulation, and of training services provided tomore than 30 militaries globally. Simulation equipmentand training are developed for a variety of military air-craft, including helicopters, transport planes and fighterjets. CAE has an extensive product range covering manyAmerican and European aircraft types.
The Company is also a leader in marine automationand control systems for both the naval and commercialmarkets, having been selected for the provision of con-trols for more than 140 warships in 18 navies and forover 450 high-end commercial vessels. These systemsmonitor and control the propulsion, electrical steering,ancillary, auxiliary and damage control machinery andsystems of ships, such as Cunard’s Queen Mary 2, theworld’s largest commercial cruiseship. Marine has alsomoved beyond the supply of equipment into the provi-sion of naval training services through participation inthe 30-year UK Royal Navy Astute Class SubmarineTraining Service program awarded in fiscal 2002. Marinealso designs and manufactures power plant trainingsimulators for the energy sector.
CAE’s strategy is to “Refine, Execute and Grow”.To do so, its three business segments are dedicated toincreasing their value proposition to customers, andmaintaining the strict cost containment and productivityguidelines to grow their business and improve theirprofitability.
Civil is expected to retain its number one ranking inproviding flight simulators and visual systems equip-ment to the commercial and business aviation markets –having won 84% of the competed full flight simulatororders during fiscal 2004. It expects to grow its secondplace position in training services, by consolidatingexisting training market capacity and selectively addingnew simulators as demand warrants. CAE also expectsto grow its training revenue by marketing a completetraining solution including courseware and instructors.CAE’s leading-edge technology in training delivery, CAESimfinity™, provides a basis for differentiating CAE’stotally integrated training solution.
Military intends to broaden its core market throughleveraging its recent success in the US with the US Army’sSpecial Operations Forces, and expanding its offering

16 CAE ANNUAL REPORT 2004MANAGEMENT’S DISCUSSION AND ANALYSIS
partially funded pending future appropriations and maycontain provisions permitting termination at the govern-ment’s convenience, in whole or in part, without priornotice, upon payment of limited compensation.Government-funded military programs are also heavilyregulated, with certain government purchasing regula-tions limiting the range of reimbursable costs infixed-price contracts, including most financing costs andthe amortization of various intangible assets.
CAE operates in intensely competitive markets.Some of its competitors, particularly in military markets,possess substantially greater resources, well-establishedrelationships with various procuring organizations and agreater in-country presence that may give them anadvantage in winning contracts.
CAE’s often lengthy and unpredictable sales cyclecould result in volatility in its operating results. TheCompany must invest significant amounts of time andresources educating and informing potential customersabout the benefits of products and services (particularlygovernment agencies with lengthy internal budgetingapproval and competitive evaluation processes), with noguarantee of compensatory revenue.
CAE’s business could be harmed if its products donot successfully integrate or operate with other sophisti-cated and continually evolving software, computing andcommunications systems. If CAE experiences difficultiesor does not meet project milestones in a timely manner,the Company could be obligated to devote more engi-neering and other resources to a particular projectthan originally anticipated. While CAE believes it hasrecorded adequate provisions for losses on fixed-pricecontracts, obligations under fixed-price and long-termsupply contracts could subject the Company to contractlosses in excess of provisions.
CAE’s ability to complete contracted sales includedin its order backlog is dependent on the long-term finan-cial condition of the contracting customers. In addition,approximately 60% of the backlog comprises long-termcontracts where revenues are guaranteed or expected,based on current customer requirements. Those con-tracts may be terminated unilaterally by the contractingcustomer.
CAE’s ability to protect its intellectual property islimited; and unauthorized parties may be able to useCAE’s technology or products in ways that weaken CAE’scompetitive position. Reliance on the intellectual prop-erty of others, including data concerning the functions,design and performance characteristics of a productor system in the process of being simulated, could pre-vent or delay performance. Future litigation related tothe defence of CAE’s intellectual property rights orinvolving infringement claims brought against CAE or acustomer could be lengthy and costly, with no assur-ance of success.
CAE is subject to the risks of doing business in for-eign countries, including: changes to laws andregulations in host countries; the cost and complexity ofusing foreign representatives and consultants; the impo-sition of tariffs, embargoes, controls and otherrestrictions impeding the free flow of goods, informa-tion and capital; the difficulties of managing andoperating an enterprise and complying with laws in mul-tiple jurisdictions; and general changes in economic andgeopolitical conditions. Fluctuations in the value of the
Canadian dollar relative to foreign currencies couldresult in currency exchange gains and losses. Currenthedging activities may not be successful.
Covenants in CAE’s debt agreements as well as thelevel of debt could restrict CAE’s ability to finance itsfuture operations or capital needs or to engage in otherbusiness activities that may be of interest. In addition,an inability to meet financial covenants regarding com-pliance with specified ratios and tests could cause therepayment of debt to be accelerated.
CAE may be subject to significant liabilities imposedby new environmental laws and regulations or contrac-tual indemnities; product liability and warranty claims;or liabilities arising out of accidents or disasters involv-ing aircraft, marine vessels or power plants for whichCAE has provided training products or services or controlsystems. CAE cannot be certain that existing insurancecoverage will be sufficient to cover one or more substan-tial claims.
CAE’s continued success will depend in part on theability to retain and attract key personnel with the rele-vant skills, expertise and experience. The Companyapplies a compensation policy designed to mitigatethis risk.
NON-GAAP FINANCIAL MEASURES
This MD&A provides comments as to how the impact ofthe appreciation of the Canadian dollar against itsUnited States counterpart affected the Company’sresults of fiscal 2004 as compared to fiscal 2003. TheCompany believes that this is useful supplemental infor-mation as it provides an indication of performanceexcluding such currency fluctuation. Readers should becautioned however that this information should not beconfused with or used as an alternate for performancedetermined in accordance with GAAP.
Free cash flow does not have any standardizedmeaning prescribed by GAAP. It is therefore unlikely tobe comparable to similar measures presented by othercompanies. Free cash flow is presented on a consistentbasis from period to period. CAE considers free cashflow to be an indicator of the financial strength and per-formance of its business as it shows how much cash isavailable to repay debt and to reinvest in the Company.
OVERALL PERFORMANCEREVENUEFor fiscal 2004, consolidated revenues decreased by 3%to $1.093 billion compared to the preceding year.Excluding the impact of the US dollar fluctuation againstthe Canadian dollar, consolidated revenue would haveexceeded that of the prior year by just over 4%.
Civil’s 11% or $55.4 million year-over-year revenuedecline was attributable to adverse market conditionsresulting in much lower equipment sales, partially offsetby higher training revenue. Excluding the impact of for-eign exchange fluctuations, Civil’s revenue for the yearwould have been $517.5 million, in line with last year.The 6% or $27.1 million increase in Military’s revenuewas attributable to higher activity from support servicesand on certain land-based programs in Germany.Military’s revenue for the year would have been
CAE ANNUAL REPORT 2004 MANAGEMENT’S DISCUSSION AND ANALYSIS 17
$496.1 million had it not been for the impact of foreignexchange. The $9.0 million or 5% decrease in Marine’srevenue is explained by the $10.0 million contributionlast year on the completion of the Frigate 124 programin Germany, combined with current delays on the Astuteand FAST Astute Class Training Services (ACTS) pro-grams, as the manufacturing of the submarine itself isbehind schedule. Revenue for Marine would have been$7.3 million higher than actual results when the impactof foreign exchange is excluded.
EARNINGS BEFORE INTEREST, INCOME TAXES ANDDISCONTINUED OPERATIONS (EBIT)Year-to-date EBIT amounted to $111.6 million comparedto $221.6 million reported in fiscal 2003. EBIT wasreduced by a $10.0 million restructuring charge relatedto the company’s workforce reductions. This chargerelates mainly to the workforce reduction in the Montrealplant of approximately 250 employees, following theCanadian government decision to attribute the CF-18simulation equipment contract to a competitor.
The results of all of CAE’s business segments werealso impacted for the year by the substantial and rapidappreciation of the Canadian dollar’s value relative to theUS dollar. This impact was approximately $28.9 million.
The decline in consolidated earnings before inter-est, income taxes and discontinued operations relativeto the prior year was attributable to a substantially lowercontribution from Civil, as the latter was affected by asignificant reduction in equipment volumes, lower sell-ing prices combined with the effect of a strongerCanadian dollar. Military’s earnings before interest,taxes and discontinued operations (EBIT) on a year-over-year basis was down by 29% as a result of lowermargins, which were expected based on the current mixof a significant number of new programs. Marinereported a 7% decrease in EBIT over the prior year,mostly due to the foreign exchange impact referred toabove.
Other contributing factors to lower EBIT were anincrease of $2.6 million in pension expense in the firsthalf of the fiscal year, caused by the decrease in the rateof return on plan assets for defined benefit pensionplans from 9.0% to 6.5%, combined with additional costsof $6.8 million for long-term incentive compensation.The latter increase was a result of the year-over-yearchange in value of outstanding deferred share units andfrom prospectively expensing stock options on April 1,2003 using the fair value method.
INTEREST AND INCOME TAXESFor the fiscal year, interest expense decreased to$23.9 million from $30.4 million in the prior year due tolower debt levels. The annual results benefited froma reduction in the income tax rate to 24% as comparedto 31% in fiscal 2003. The tax rate was influenced bytax benefits recorded on prior years’ tax losses inAustralia in the first quarter, as well as a change to themix of income for income tax purposes from variousjurisdictions.
DISCONTINUED OPERATIONSDuring the year, CAE incurred a loss from discontinuedoperations of $3.1 million or 2 cents a share comparedwith $13.8 million or 7 cents a share last year. TheCompany completed the sale of the last of its discontin-ued operations during fiscal 2004. The loss was causedby post-closing adjustments from the sale of CAE’s for-mer German Cleaning Technologies operations for$2.6 million and $0.5 million relating to the pension plancurtailment cost for the divestiture of the Canadian oper-ations of the former Forestry businesses.
NET EARNINGSYear-to-date consolidated net earnings amounted to$64.0 million compared to $117.2 million last year,reflecting the components discussed previously in thissection of the MD&A.
The results of all of CAE’s business segments werealso impacted by the substantial and rapid appreciationof the Canadian dollar’s value relative to the US dollar.Compared to the prior year, CAE’s earnings per sharewere reduced by 11 cents or approximately $24.6 millionin aggregate, as a result of that currency fluctuation.
CASH FLOW AND FINANCIAL CONDITIONCAE’s net debt, defined as long-term debt less cash andcash equivalents and short-term investments, decreasedby $216.7 million compared to March 31, 2003. Thereduction was accomplished from the receipt of approx-imately $168.0 million net of fees and expenses from theissuance of common shares and $122.5 million from saleand leaseback transactions. This was offset by lowercash from operations as compared to last year resultingfrom lower earnings and an increase in non-cash work-ing capital. Free cash flow (net cash provided bycontinuing operating activities less capital expendituresand dividends paid) improved by $10.4 million on ayear-over-year basis.
A lower level of accounts payable and accrued lia-bilities due to lower civil equipment activity mainlyexplains the increase in non-cash working capital.The latter was compounded by higher accounts receiv-able, from unbilled sales on certain Military and Marineprograms and by an increase in inventories, primarilyfor the advance build of Civil simulators.
Capital expenditures for the year amounted to$94.5 million, compared to $238.9 million in the prioryear. The majority of the expenditures were for theexpansion of the Civil training services business.
BACKLOGBacklog for comparative purposes has been restated.For a detailed discussion on the issues regarding therestatement see Civil’s section of this MD&A. CAE’s con-solidated backlog as at March 31, 2004, was $2.9 billion,$160.8 million higher than last year’s level.

18 CAE ANNUAL REPORT 2004MANAGEMENT’S DISCUSSION AND ANALYSIS
SELECTED ANNUAL INFORMATION
(amounts in millions of Canadian dollars except per share amounts) 2004 2003 2002
Operating resultsContinuing operations
Revenue $ 1,093.2 $ 1,130.5 $ 1,126.5Earnings 67.1 131.0 148.4
Net earnings 64.0 117.2 149.5
Financial positionTotal assets $ 2,293.3 $ 2,356.5 $ 2,378.4Total long-term debt, net of cash 575.0 794.3 837.7
Per shareEarnings from continuing operations $ 0.29 $ 0.60 $ 0.68Net earnings 0.27 0.53 0.69Dividends 0.12 0.12 0.11Shareholders’ equity 3.94 3.42 2.81
REVENUEIn fiscal 2004, consolidated revenues decreased by 3%to $1.093 billion compared to the preceding year and tofiscal 2002.
Civil’s revenue decline to $461.8 million this yearfrom $545.2 million in fiscal 2002 and $517.2 million infiscal 2003 was due to adverse market conditions result-ing in much lower equipment sales partially offset byhigher training revenue. Civil’s operations were greatlyinfluenced by the financial health of the commercial air-line industry. Over the past few years, the industry hasbeen affected by the impacts of terrorist attacks, SARS,and the Iraq war. The worst is likely over as evidencedby recent increases in passenger loads. These eventshave resulted in increased needs for, and for the trainingof, regional jet pilots. With its wide array regional jetFFS, Civil believes it is well positioned to take advantageof these future trends.
Military recorded a 6% and 2% increase in revenuecompared to fiscal 2003 and 2002 respectively, to reach$472.8 million in fiscal 2004. Military’s increases wereattributable to higher activity from support services andto land-based programs in Germany.
The decrease in Marine revenue of 5% compared tothe prior year was a result of the currency impact andfrom a significant contribution on the completion lastyear of the Frigate 124 program in Germany ($10.0 mil-lion). Marine’s increase of $48.1 million in fiscal 2003compared to fiscal 2002 was due to the growth of itsnaval control business with increasing contributionsfrom the Company’s activities on the Astute programand from increased contributions from the then newlyacquired CAE Valmarine.
The appreciation of the Canadian dollar against itsUS counterpart has had a significant impact on revenuesin fiscal years 2003 and 2004. The average US foreignexchange rate used by CAE was $1.35, $1.55 and $1.57for fiscal years 2004, 2003 and 2002 respectively, for atotal appreciation of 14% over that time period.
EBITConsolidated EBIT amounted to $111.6 million in fiscal2004 compared to $221.6 million reported in fiscal 2003and $241.0 million reported in fiscal 2002. The decreaseswere a result of a significant reduction in equipment volumes and lower selling prices in Civil, along with a
lower margin program mix in Military compared to theprior two fiscal years.
Civil’s EBIT dropped to $39.4 million down $76.8 mil-lion and $119.4 million compared to last year and fiscal2002 respectively. Military’s EBIT was down 29% to$52.6 million compared to last year and off by $13.0 mil-lion compared to fiscal 2002. Marine’s EBIT amounted to$29.6 million, off slightly from last year’s EBIT of$31.8 million, but 25% higher than in fiscal 2002.
On a consolidated basis, fiscal year 2004’s EBITbefore restructuring charges of $10.0 million was$121.6 million, down 45% compared to last year.Restructuring charges consist of severance and otherinvoluntary termination costs. These costs relatedmainly to the workforce reduction in the Montreal plantof approximately 250 employees, following theCanadian government decision to award the CF-18 simu-lation equipment contract to a competitor.
DISCONTINUED OPERATIONSLoss from discontinued operations amounted to $3.1 mil-lion or 2 cents a share compared with $13.8 million or7 cents a share last year and a gain of $1.1 million in fiscal 2002. See note 3 for detailed descriptions of signif-icant disposals, the majority of which were disposed ofin fiscal 2003.
SIGNIFICANT CHANGES IN ACCOUNTING POLICYIn fiscal 2004, the Company adopted the CICA HandbookSection 3870 Stock-based Compensation and OtherStock-based Payments issued in June 2003 andexpensed prospectively the cost of stock options grantedto employees using the fair value based method. A com-pensation expense is recognized for the Company’sportion of the contributions made under the EmployeeStock Purchase Plan and for amounts due under theDeferred Share Unit and Long-Term Incentive – DeferredShare Unit plans. In fiscal 2004, CAE recognized anexpense of $1.3 million as a result of the adoption of thisHandbook Section.
In fiscal 2003, the Company changed the amortiza-tion period for Civil simulation equipment from 20 yearsto 25 years, to reflect the approximated useful life of thesimulators. This change reduced the amortizationexpense by approximately $3.7 million in fiscal 2003compared to fiscal 2002.

CAE ANNUAL REPORT 2004 MANAGEMENT’S DISCUSSION AND ANALYSIS 19
In fiscal 2003, the Company adopted retroactivelythe new recommendations of the CICA Section 1650,Foreign Currency Translation. Under the provisions ofSection 1650 the Company no longer amortizes theexchange gains or losses arising on the translation oflong-term foreign currency debt. Exchange gains orlosses arising on translation are included in earnings asincurred. At March 31, 2002, the unamortized exchangeloss relating to the existing long-term foreign currencydenominated items amounted to $6.4 million net ofincome taxes of $2.8 million. Consequently, prior years’financial statements have been restated through acharge to fiscal 2002 opening retained earnings of$5.3 million, net of taxes of $2.3 million (2001 – $3.3 mil-lion, net of taxes of $1.3 million).
ACQUISITIONS AND DIVESTITURESDuring fiscal 2002, the Company completed four strate-gic acquisitions, two of which accelerated theCompany’s move into aviation training, one which sig-nificantly improved the Company’s access to the USdefence market and one which provided immediateentry into the commercial marine control systems mar-ket (refer to note 2 of the audited consolidated financialstatements).
From fiscal 2002 to fiscal 2004, CAE divested its non-core related businesses, mainly in the forestry andcleaning technologies markets (refer to note 3 of theaudited consolidated financial statements).
REPOSITIONING FOR VALUEOver the past three fiscal years CAE has continued toinvest in its installed simulator base. As a result, theCompany’s revenue is less subject to cyclical industryfluctuations typical of an equipment supplier. As trainingrevenue continues to grow, CAE‘s profile has changed tothat of a service provider where revenues are more con-sistent over the fiscal year. As the proportion of CAE’straining service revenue mounts, the third quarter isgradually becoming the Company’s strongest as a resultof seasonally high training volume during the fallmonths, recovering from the quieter summer periodwhen less training occurs as pilots are not available fortraining during the peak summer travel period. Further-more, CAE has now transformed itself from a puremanufacturer to an integrated manufacturing/serviceoffering business.
RESULTS OF OPERATIONS – FISCAL 2004CIVIL Civil is a world leader in the design and production ofcommercial flight simulators, visual systems and aworld-leading supplier of integrated aviation trainingsolutions. As at March 31, 2004, CAE has an installed baseof 102 FFS (89 FFS as at March 31, 2003) at 21 locations onfour continents, making it the second largest indepen-dent training company in the world in each segment –business aircraft, regional jets and wide body aircraft.CAE also remains the leading provider of FFS to the com-peted market.
Operational HighlightsCivil continues to grow its number two position in train-ing services, having grown its installed base of FFS by15% during fiscal 2004, which compares to 50% growthin fiscal 2003. The signature of several training servicescontracts validated this growth strategy during the year,most notably a $35.0 million award by Flight OptionsLLC, a leading provider of fractional shares in businessaircraft, of a three-year exclusive contract to train at CAESimuFlite’s Dallas training centre. About $20.0 millionworth of service contracts were won by CAE in the AsiaPacific region, along with more than $55.0 million oftraining services contracts signed in the Europe andMiddle East region, most notably at the Emirates-CAEFlight Training Centre in Dubai, United Arab Emirates.
Civil’s investment in the next generation technologyfor FFS, CAE Sim XXI™, designed to simplify assembly,testing and integration of FFS, and to reduce life cyclecosts for simulator operators, was validated. BothEurope’s Joint Aviation Authorities and the US FederalAviation Administration (“FAA”) approved in November2003 the first CAE Sim XXI™ level D-qualified simulator,a Gulfstream IV FFS located in the Emirates-CAE FlightTraining Centre. This first qualification was soon fol-lowed by others, a Gulfstream V FFS also located inDubai, and a Boeing 737-800 FFS located in Ryan Air’sEast Midlands Airport training facility, this time level D-qualified by the UK’s Civil Aviation Authority.
The CAE Simfinity™ products, high-fidelity simula-tion-based software that allows for advanced training onprocedure trainers in groundschool and over the Web,also proved to be another successful invention for CAE,as it has become a market differentiator for its integratedtraining solutions offering. Simfinity™-based deviceswere a key part of the range of training services offeredto Airbus as part of the development of the world’s firstA380 FFS. Furthermore, the FAA will also use a Boeing737-800 CAE Simfinity™ integrated procedure trainer inits own research.
During fiscal 2004, CAE signed a contract withAirbus to develop the world’s first A380 FFS. As part ofthis $55.0 million contract, a complete range of trainingdevices will be provided for the A380, including two FFS equipped with the CAE Tropos™ visual system andSimfinity™ software licences for desktop and laptoptrainers.
JetBlue Airways awarded CAE an $85.0 million con-tact, one of CAE’s largest-ever orders for FFS, for themanufacture of six FFS, and selected CAE as its exclusivesupplier for a period of 10 years. Southwest Airlinesselected CAE for a $25.0 million contract for a Boeing737-700 FFS and related flight training devices.
There were 16 FFS ordered this year (out of a totalpossible number of 19 FFS competed for), up from 11last year. CAE’s 84% FFS market share, together with its80% share of the visual systems market, gives Civil thenumber one ranking in providing flight simulators andvisual systems equipment to the competed commercialand business aviation markets.
20 CAE ANNUAL REPORT 2004MANAGEMENT’S DISCUSSION AND ANALYSIS
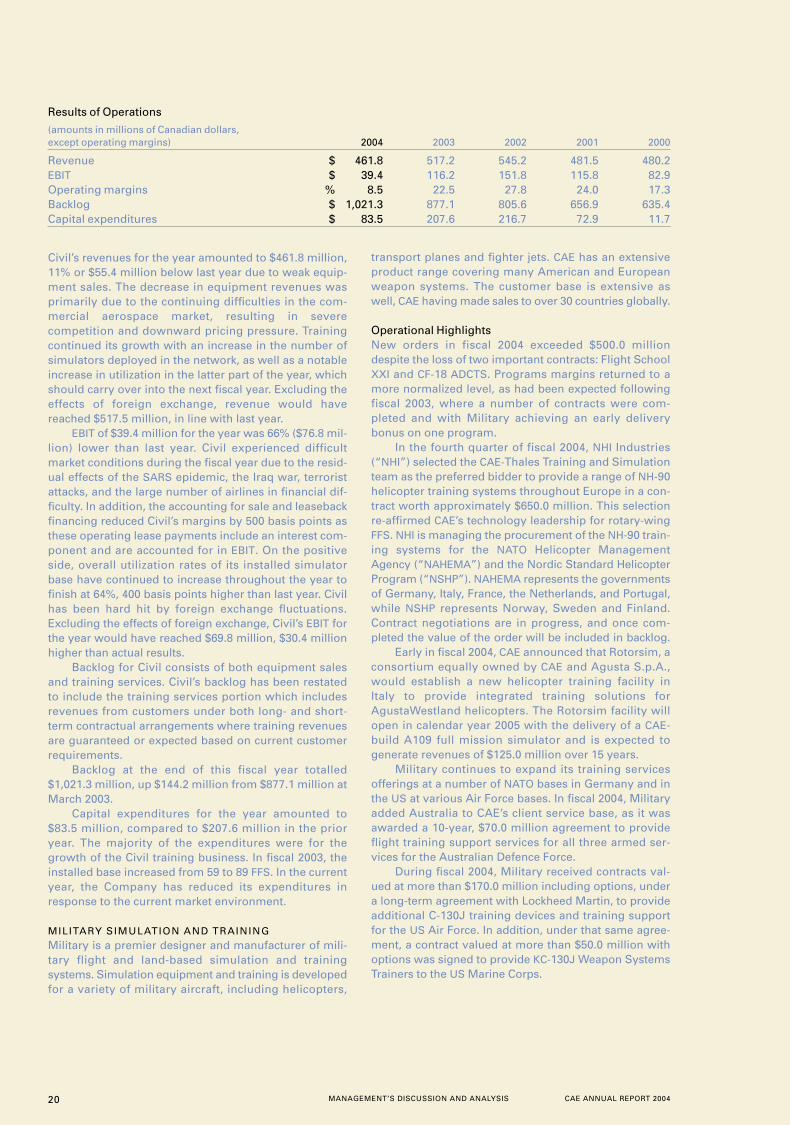
Civil’s revenues for the year amounted to $461.8 million,11% or $55.4 million below last year due to weak equip-ment sales. The decrease in equipment revenues wasprimarily due to the continuing difficulties in the com-mercial aerospace market, resulting in severecompetition and downward pricing pressure. Trainingcontinued its growth with an increase in the number ofsimulators deployed in the network, as well as a notableincrease in utilization in the latter part of the year, whichshould carry over into the next fiscal year. Excluding theeffects of foreign exchange, revenue would havereached $517.5 million, in line with last year.
EBIT of $39.4 million for the year was 66% ($76.8 mil-lion) lower than last year. Civil experienced difficultmarket conditions during the fiscal year due to the resid-ual effects of the SARS epidemic, the Iraq war, terroristattacks, and the large number of airlines in financial dif-ficulty. In addition, the accounting for sale and leasebackfinancing reduced Civil’s margins by 500 basis points asthese operating lease payments include an interest com-ponent and are accounted for in EBIT. On the positiveside, overall utilization rates of its installed simulatorbase have continued to increase throughout the year tofinish at 64%, 400 basis points higher than last year. Civilhas been hard hit by foreign exchange fluctuations.Excluding the effects of foreign exchange, Civil’s EBIT forthe year would have reached $69.8 million, $30.4 millionhigher than actual results.
Backlog for Civil consists of both equipment salesand training services. Civil’s backlog has been restatedto include the training services portion which includesrevenues from customers under both long- and short-term contractual arrangements where training revenuesare guaranteed or expected based on current customerrequirements.
Backlog at the end of this fiscal year totalled$1,021.3 million, up $144.2 million from $877.1 million atMarch 2003.
Capital expenditures for the year amounted to$83.5 million, compared to $207.6 million in the prioryear. The majority of the expenditures were for thegrowth of the Civil training business. In fiscal 2003, theinstalled base increased from 59 to 89 FFS. In the currentyear, the Company has reduced its expenditures inresponse to the current market environment.
MILITARY SIMULATION AND TRAININGMilitary is a premier designer and manufacturer of mili-tary flight and land-based simulation and trainingsystems. Simulation equipment and training is developedfor a variety of military aircraft, including helicopters,
transport planes and fighter jets. CAE has an extensiveproduct range covering many American and Europeanweapon systems. The customer base is extensive aswell, CAE having made sales to over 30 countries globally.
Operational HighlightsNew orders in fiscal 2004 exceeded $500.0 milliondespite the loss of two important contracts: Flight SchoolXXI and CF-18 ADCTS. Programs margins returned to amore normalized level, as had been expected followingfiscal 2003, where a number of contracts were com-pleted and with Military achieving an early deliverybonus on one program.
In the fourth quarter of fiscal 2004, NHI Industries(“NHI”) selected the CAE-Thales Training and Simulationteam as the preferred bidder to provide a range of NH-90helicopter training systems throughout Europe in a con-tract worth approximately $650.0 million. This selectionre-affirmed CAE’s technology leadership for rotary-wingFFS. NHI is managing the procurement of the NH-90 train-ing systems for the NATO Helicopter ManagementAgency (“NAHEMA”) and the Nordic Standard HelicopterProgram (“NSHP”). NAHEMA represents the governmentsof Germany, Italy, France, the Netherlands, and Portugal,while NSHP represents Norway, Sweden and Finland.Contract negotiations are in progress, and once com-pleted the value of the order will be included in backlog.
Early in fiscal 2004, CAE announced that Rotorsim, aconsortium equally owned by CAE and Agusta S.p.A.,would establish a new helicopter training facility inItaly to provide integrated training solutions forAgustaWestland helicopters. The Rotorsim facility willopen in calendar year 2005 with the delivery of a CAE-build A109 full mission simulator and is expected togenerate revenues of $125.0 million over 15 years.
Military continues to expand its training servicesofferings at a number of NATO bases in Germany and inthe US at various Air Force bases. In fiscal 2004, Militaryadded Australia to CAE’s client service base, as it wasawarded a 10-year, $70.0 million agreement to provideflight training support services for all three armed ser-vices for the Australian Defence Force.
During fiscal 2004, Military received contracts val-ued at more than $170.0 million including options, undera long-term agreement with Lockheed Martin, to provideadditional C-130J training devices and training supportfor the US Air Force. In addition, under that same agree-ment, a contract valued at more than $50.0 million withoptions was signed to provide KC-130J Weapon SystemsTrainers to the US Marine Corps.
Results of Operations
(amounts in millions of Canadian dollars, except operating margins) 2004 2003 2002 2001 2000
Revenue $ 461.8 517.2 545.2 481.5 480.2EBIT $ 39.4 116.2 151.8 115.8 82.9Operating margins % 8.5 22.5 27.8 24.0 17.3Backlog $ 1,021.3 877.1 805.6 656.9 635.4Capital expenditures $ 83.5 207.6 216.7 72.9 11.7
CAE ANNUAL REPORT 2004 MANAGEMENT’S DISCUSSION AND ANALYSIS 21
The US Army’s Program Executive Office –Simulation, Training and Instrumentation awarded CAEcontracts worth more than $70.0 million to provide anMH-47G Chinook combat mission simulator (“CMS”),begin design for refurbishment and upgrade of theexisting MH-60K Black Hawk CMS, and provide desktoptrainers and a reconfigurable part-task trainer for theChinook and Black Hawk helicopters.
CAE’s Magnetic Anomaly Detection (“MAD”) systemgenerated more than $20.0 million in orders in fiscalyear 2004. MAD was selected for the Turkish Navy’s
new CN235 aircraft and any additional maritime patrolaircraft procured by Turkey. It was also chosen forthe Canadian Forces CP-140 Aurora IncrementalModernization program in a contract worth approxi-mately $10.0 million. MAD will also be used in the newmaritime patrol aircraft for the Japan Defence Agency(“JDA”). The latter’s initial contract is valued at morethan $7.0 million, with potential follow-up business val-ued at over $30.0 million depending on the number ofaircraft procured by the JDA.
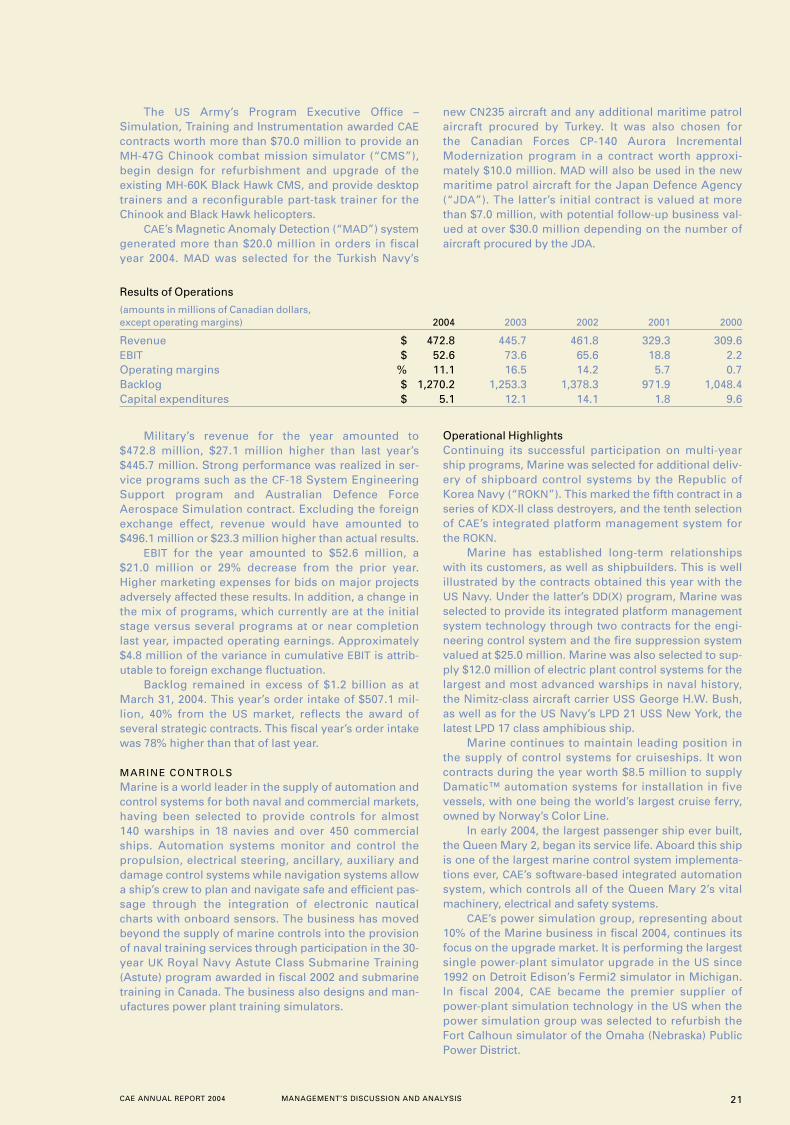
Results of Operations
(amounts in millions of Canadian dollars, except operating margins) 2004 2003 2002 2001 2000
Revenue $ 472.8 445.7 461.8 329.3 309.6EBIT $ 52.6 73.6 65.6 18.8 2.2Operating margins % 11.1 16.5 14.2 5.7 0.7Backlog $ 1,270.2 1,253.3 1,378.3 971.9 1,048.4Capital expenditures $ 5.1 12.1 14.1 1.8 9.6
Military’s revenue for the year amounted to$472.8 million, $27.1 million higher than last year’s$445.7 million. Strong performance was realized in ser-vice programs such as the CF-18 System EngineeringSupport program and Australian Defence ForceAerospace Simulation contract. Excluding the foreignexchange effect, revenue would have amounted to$496.1 million or $23.3 million higher than actual results.
EBIT for the year amounted to $52.6 million, a$21.0 million or 29% decrease from the prior year.Higher marketing expenses for bids on major projectsadversely affected these results. In addition, a change inthe mix of programs, which currently are at the initialstage versus several programs at or near completionlast year, impacted operating earnings. Approximately$4.8 million of the variance in cumulative EBIT is attrib-utable to foreign exchange fluctuation.
Backlog remained in excess of $1.2 billion as atMarch 31, 2004. This year’s order intake of $507.1 mil-lion, 40% from the US market, reflects the award ofseveral strategic contracts. This fiscal year’s order intakewas 78% higher than that of last year.
MARINE CONTROLSMarine is a world leader in the supply of automation andcontrol systems for both naval and commercial markets,having been selected to provide controls for almost140 warships in 18 navies and over 450 commercialships. Automation systems monitor and control thepropulsion, electrical steering, ancillary, auxiliary anddamage control systems while navigation systems allowa ship’s crew to plan and navigate safe and efficient pas-sage through the integration of electronic nauticalcharts with onboard sensors. The business has movedbeyond the supply of marine controls into the provisionof naval training services through participation in the 30-year UK Royal Navy Astute Class Submarine Training(Astute) program awarded in fiscal 2002 and submarinetraining in Canada. The business also designs and man-ufactures power plant training simulators.
Operational HighlightsContinuing its successful participation on multi-yearship programs, Marine was selected for additional deliv-ery of shipboard control systems by the Republic ofKorea Navy (“ROKN”). This marked the fifth contract in aseries of KDX-II class destroyers, and the tenth selectionof CAE’s integrated platform management system forthe ROKN.
Marine has established long-term relationshipswith its customers, as well as shipbuilders. This is wellillustrated by the contracts obtained this year with theUS Navy. Under the latter’s DD(X) program, Marine wasselected to provide its integrated platform managementsystem technology through two contracts for the engi-neering control system and the fire suppression systemvalued at $25.0 million. Marine was also selected to sup-ply $12.0 million of electric plant control systems for thelargest and most advanced warships in naval history,the Nimitz-class aircraft carrier USS George H.W. Bush,as well as for the US Navy’s LPD 21 USS New York, thelatest LPD 17 class amphibious ship.
Marine continues to maintain leading position inthe supply of control systems for cruiseships. It woncontracts during the year worth $8.5 million to supplyDamatic™ automation systems for installation in fivevessels, with one being the world’s largest cruise ferry,owned by Norway’s Color Line.
In early 2004, the largest passenger ship ever built,the Queen Mary 2, began its service life. Aboard this shipis one of the largest marine control system implementa-tions ever, CAE’s software-based integrated automationsystem, which controls all of the Queen Mary 2’s vitalmachinery, electrical and safety systems.
CAE’s power simulation group, representing about10% of the Marine business in fiscal 2004, continues itsfocus on the upgrade market. It is performing the largestsingle power-plant simulator upgrade in the US since1992 on Detroit Edison’s Fermi2 simulator in Michigan.In fiscal 2004, CAE became the premier supplier ofpower-plant simulation technology in the US when thepower simulation group was selected to refurbish theFort Calhoun simulator of the Omaha (Nebraska) PublicPower District.
22 CAE ANNUAL REPORT 2004MANAGEMENT’S DISCUSSION AND ANALYSIS
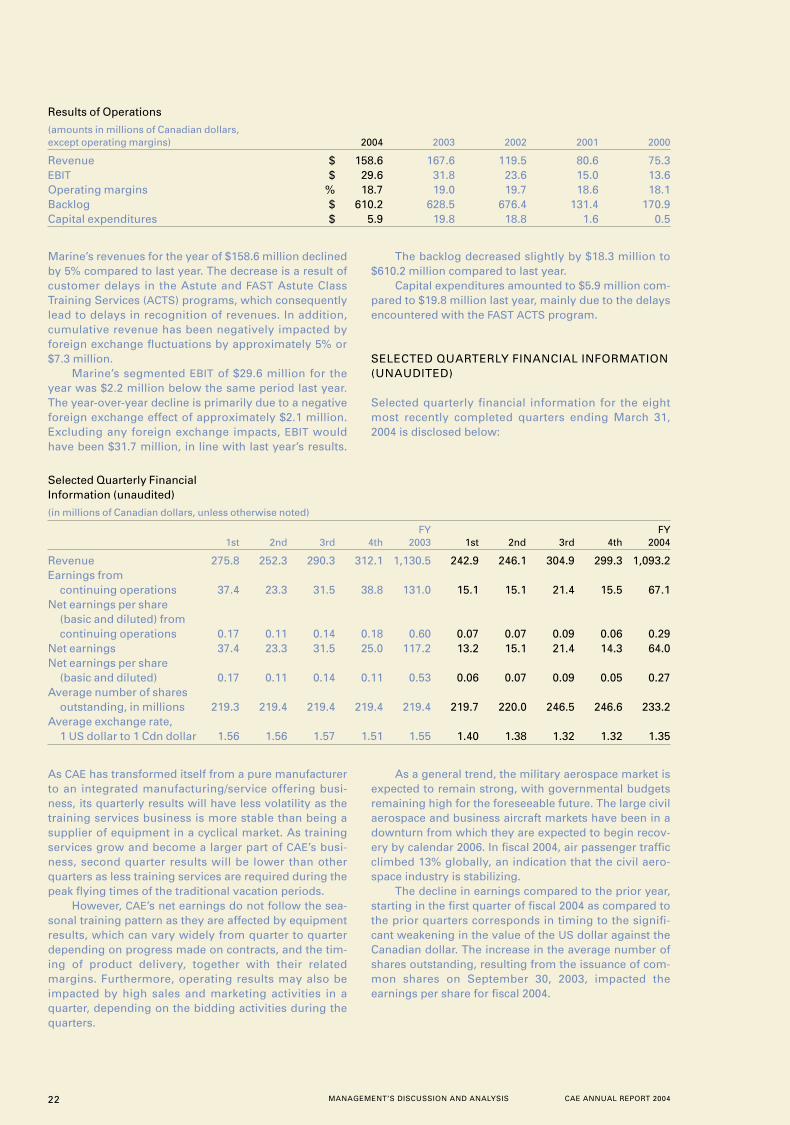
Marine’s revenues for the year of $158.6 million declinedby 5% compared to last year. The decrease is a result ofcustomer delays in the Astute and FAST Astute ClassTraining Services (ACTS) programs, which consequentlylead to delays in recognition of revenues. In addition,cumulative revenue has been negatively impacted byforeign exchange fluctuations by approximately 5% or$7.3 million.
Marine’s segmented EBIT of $29.6 million for theyear was $2.2 million below the same period last year.The year-over-year decline is primarily due to a negativeforeign exchange effect of approximately $2.1 million.Excluding any foreign exchange impacts, EBIT wouldhave been $31.7 million, in line with last year’s results.
The backlog decreased slightly by $18.3 million to$610.2 million compared to last year.
Capital expenditures amounted to $5.9 million com-pared to $19.8 million last year, mainly due to the delaysencountered with the FAST ACTS program.
SELECTED QUARTERLY FINANCIAL INFORMATION(UNAUDITED)
Selected quarterly financial information for the eightmost recently completed quarters ending March 31,2004 is disclosed below:
Results of Operations
(amounts in millions of Canadian dollars, except operating margins) 2004 2003 2002 2001 2000
Revenue $ 158.6 167.6 119.5 80.6 75.3EBIT $ 29.6 31.8 23.6 15.0 13.6Operating margins % 18.7 19.0 19.7 18.6 18.1Backlog $ 610.2 628.5 676.4 131.4 170.9Capital expenditures $ 5.9 19.8 18.8 1.6 0.5
Selected Quarterly Financial Information (unaudited)
(in millions of Canadian dollars, unless otherwise noted)
FY FY1st 2nd 3rd 4th 2003 1st 2nd 3rd 4th 2004
Revenue 275.8 252.3 290.3 312.1 1,130.5 242.9 246.1 304.9 299.3 1,093.2Earnings from
continuing operations 37.4 23.3 31.5 38.8 131.0 15.1 15.1 21.4 15.5 67.1Net earnings per share
(basic and diluted) from continuing operations 0.17 0.11 0.14 0.18 0.60 0.07 0.07 0.09 0.06 0.29
Net earnings 37.4 23.3 31.5 25.0 117.2 13.2 15.1 21.4 14.3 64.0Net earnings per share
(basic and diluted) 0.17 0.11 0.14 0.11 0.53 0.06 0.07 0.09 0.05 0.27Average number of shares
outstanding, in millions 219.3 219.4 219.4 219.4 219.4 219.7 220.0 246.5 246.6 233.2Average exchange rate,
1 US dollar to 1 Cdn dollar 1.56 1.56 1.57 1.51 1.55 1.40 1.38 1.32 1.32 1.35
As CAE has transformed itself from a pure manufacturerto an integrated manufacturing/service offering busi-ness, its quarterly results will have less volatility as thetraining services business is more stable than being asupplier of equipment in a cyclical market. As trainingservices grow and become a larger part of CAE’s busi-ness, second quarter results will be lower than otherquarters as less training services are required during thepeak flying times of the traditional vacation periods.
However, CAE’s net earnings do not follow the sea-sonal training pattern as they are affected by equipmentresults, which can vary widely from quarter to quarterdepending on progress made on contracts, and the tim-ing of product delivery, together with their relatedmargins. Furthermore, operating results may also beimpacted by high sales and marketing activities in aquarter, depending on the bidding activities during thequarters.
As a general trend, the military aerospace market isexpected to remain strong, with governmental budgetsremaining high for the foreseeable future. The large civilaerospace and business aircraft markets have been in adownturn from which they are expected to begin recov-ery by calendar 2006. In fiscal 2004, air passenger trafficclimbed 13% globally, an indication that the civil aero-space industry is stabilizing.
The decline in earnings compared to the prior year,starting in the first quarter of fiscal 2004 as compared tothe prior quarters corresponds in timing to the signifi-cant weakening in the value of the US dollar against theCanadian dollar. The increase in the average number ofshares outstanding, resulting from the issuance of com-mon shares on September 30, 2003, impacted theearnings per share for fiscal 2004.

CAE ANNUAL REPORT 2004 MANAGEMENT’S DISCUSSION AND ANALYSIS 23
LIQUIDITY
The Company’s financing needs are met through inter-nally generated cash flow, available funds under creditfacilities and direct access to capital markets for addi-tional long-term capital resources. CAE considers that itspresent and expected capital resources and current creditfacilities will enable it to meet all its current and expectedfinancial requirements for the foreseeable future.
The Company plans to generate sufficient cashfrom operating activities to pay for capital expendituresand dividends. CAE expects to be able to repay contrac-tual obligations maturing in 2005 and future yearsthrough cash on hand, cash generated from operationsor by issuing new debt.
DIVIDENDSCAE expects to pay annual dividends of approximately$30.0 million assuming the current number of commonshares outstanding and the current dividend policy.These dividends are equal to $0.12 per common shareon an annual basis, based on approximately 246 millioncommon shares at March 31, 2004.
CONTRACTUAL OBLIGATIONSThe table below is a summary of the Company’s con-tractual obligations as at March 31, 2004, that are due ineach of the next five years and thereafter.
Contractual Obligations (unaudited)
Less than 1 – 3 4 – 5 More than (amounts in millions of Canadian dollars) Total 1 Year Years Years 5 Years
Long-term debt 613.2 11.5 343.7 39.2 218.8Capital lease 23.7 2.0 4.1 3.2 14.4Operating leases 814.8 92.2 174.1 134.8 413.7Purchase obligations 73.7 27.0 20.2 17.1 9.4Other long-term obligations 17.3 4.0 5.2 4.3 3.8
Total 1,542.7 136.7 547.3 198.6 660.1
The long-term debt includes $305.3 million drawn underCAE’s committed credit facilities maturing in fiscal 2007.The total availability of the committed credit facilities isequal to $619.8 million.
Rental expense related to operating lease was$92.5 million in fiscal 2004 compared to $87.4 million infiscal 2003. The sale and leaseback of certain FFS installedin the Company’s global network of training centresaccounted for $41.7 million of the total rental expense.
Other purchase obligations are related to agree-ments to purchase goods or services that areenforceable and legally binding on CAE and that specifyall significant terms, including: fixed or minimum quan-tities to be purchased; fixed, minimum or variable priceprovisions; and the approximate timing of the transac-tion. Principally, the purchase obligations are related toagreements with subcontractors to provide services inthe context of long-term contracts with the Company’sclients.
Other long-term obligations include a total of$10.5 million of repayments under various governmentassistance programs.
At March 31, 2004, CAE had other long-term liabili-ties that were not included in the table. They consistedof some accrued pension liabilities and post-retirementbenefits, deferred revenue and gains on assets and vari-ous other long-term liabilities. Cash obligations ofaccrued employee pension liability and post-retirementbenefits depend on various elements such as marketreturns, actuarial losses and gains and interest rate. As aresult, management cannot accurately determine thetiming and amount of cash needed for them. Futureincome tax liabilities were not included since future pay-ments of income taxes depend on the amount of taxableearnings and on whether there are tax loss carryfor-wards available to reduce income tax liabilities.
As at March 31, 2004, the Company had approxi-mately US$130.7 million of accumulated non-capital taxlosses carried forward that can be used to offset tax
payable on future earnings from US operations. CAEalso had accumulated non-capital tax losses carried for-ward relating to its operations in other countries ofapproximately $57.4 million.
CAPITAL RESOURCESSOURCES OF LIQUIDITYCAE maintains committed bank lines at floating rates,each provided by a syndicate of lenders. These creditfacilities permit the Company and certain designatedsubsidiaries to borrow funds directly for operating andgeneral corporate purposes. The total available amountof committed bank lines at March 31, 2004, was$619.8 million of which 49% ($305.3 million) was uti-lized. At March 31, 2003, the total available amount was$872.8 million, of which 52% ($451.9 million) was uti-lized. The decrease in total availability was due to thefinal repayment of $51.4 million (US$35.0 million) inJune 2003, of a bridge facility of US$135.0 million. Thedecrease in total utilization was mainly due to the repay-ments made possible by the sale and leasebacktransactions of $122.5 million completed in the first halfof the year as well as the equity offering completed inSeptember 2003 for an amount of $175.0 million repre-senting 26.6 million shares.
CAE was in full compliance with all bank covenantsat March 31, 2004. It also had the ability to borrow undernon-committed operating lines in various currencies forup to $28.2 million, of which $6.4 million was drawn asat March 31, 2004. Both the availability and utilizationwere lower than at March 31, 2003, where they stood at$89.0 million and $41.3 million respectively.
As at March 31, 2004, CAE had long-term debt total-ling $636.9 million, compared to long-term debt of$811.4 million at March 31, 2003. At March 31, 2004, theshort-term portion of the long-term debt was $13.5 mil-lion compared to $13.4 million at March 31, 2003.

24 CAE ANNUAL REPORT 2004MANAGEMENT’S DISCUSSION AND ANALYSIS
COMMITMENTSCAE’s commitments for capital expenditures includeinvestments to add new facilities to its training centrenetwork in order to meet customer demand. Researchand development expenditures are incurred to providenew products to the marketplace, as alternative ways oftraining are developed and different types of simulatorsare needed for our clients’ training needs.
OFF-BALANCE SHEET ARRANGEMENTSGUARANTEESIn the normal course of business, CAE issued letters ofcredit and performance guarantees for a total amountof $207.7 million at March 31, 2004, compared to$195.1 million at March 31, 2003. The increase was dueto a large guarantee issued as credit support for the ben-efit of the owner participant in the September 30, 2003sale and leaseback transaction, offset by a reduction inadvance payment and contractual performance guaran-tees in all three divisions.
SALE AND LEASEBACK TRANSACTIONSA key element of CAE’s finance strategy to support theinvestment in its Civil training business is the sale andleaseback of certain of the FFS installed in the Company’sglobal network of training centres. This provides CAEwith a cost-effective long-term source of fixed-cost
financing. A sale and leaseback transaction can only beexecuted after the FFS has achieved certification by reg-ulatory authorities (i.e., the FFS is installed and isavailable to customers for training). Prior to completinga sale and leaseback transaction, CAE records the cost tomanufacture the FFS as a capital expenditure, which isincluded as a fixed asset on the Company’s balancesheet. On the execution of a sale and leaseback transac-tion, CAE records the transaction as a disposal of a fixedasset. The cash proceeds received on the disposalapproximate the fair market value of the FFS. The differ-ence between the proceeds received and CAE’s cost tomanufacture, approximately the margin CAE wouldrecord if it had a competed FFS sale to a third party, isrecorded under long-term liabilities and recognized intoearnings as applicable. This amount, after deducting theguaranteed residual value where appropriate, is thenamortized over the term of the sale and leaseback trans-action as a reduction of rental expense. At the end of theterm of the sale and leaseback transaction, the guaran-teed residual value will be taken into income should noreduction occur in the value of the underlying simulators.
The following is a summary at March 31, 2004, ofthe existing sale and leaseback transactions for simula-tors currently in service in Civil’s training locations,accounted for as operating leases on CAE’s financialstatements:
SALE AND LEASEBACK TRANSACTIONS – CIVIL
(amounts in millions of Canadian dollars)
Number of Lease Initial Term Imputed Unamortized Residual ValueFiscal Year Simulators Obligation (Years) Interest Rate Deferred Gain Guarantee
SimuFlite 2002/03 6 $ 76.5 12 5.6% $ 2.2 –SimuFlite 2004 5 122.1 20 5.5% 5.6 –Toronto Training Centre 2002 2 48.7 21 6.4% 17.3 $ 9.2Air Canada Training Centre 2000 2 38.2 20 7.6% 15.3 8.3Denver/Dallas
Training Centers 2003 5 100.8 20 5.0% 34.5 –Amsterdam Training Centre 2002 3 29.2 8 6.4%/9.8% – –China Southern
Joint Venture1 2003 5 26.5 15 3.0% – –Others – 7 37.3 10 3.2%2/7.3%/10.1% 15.6 15.6
35 $ 479.3 $ 90.5 $ 33.1
Annual lease payments (upcoming 12 months) $ 45.0
1 Joint venture in which CAE has a 49% interest.2 Floating rate basis.
Future minimum lease payments for such arrangements,amounting to approximately $479.3 million as at March31, 2004, are included in note 19 “Operating LeaseCommitments” to the consolidated financial statements.
NON-RECOURSE PROJECT FINANCINGDuring 1997, the Company arranged project financingfor the Medium Support Helicopter (MSH) program itentered into with the UK Ministry of Defence. The con-tract was awarded to a consortium, CAE AircrewTraining Plc (Aircrew). The capital value of the assetssupplied by Aircrew is in excess of $200.0 million. Theentity that owns the assets operated by the training cen-tre is CVS Leasing Ltd. (in which CAE has a 14% interest).
CAE manufactured and sold the simulators to CVSLeasing Ltd., and CVS Leasing Ltd. then leased thisequipment to Aircrew for the full term of the MSH con-tract. As Aircrew is majority-controlled by CAE, itsfinancial statements are consolidated in the Company’sresults. Future minimum lease payments associatedwith the simulators leased to Aircrew amount to approx-imately $230.3 million as at March 31, 2004, and areincluded in the amount disclosed in note 19 “OperatingLease Commitments” to the audited consolidated finan-cial statements as well as in the operating leasespresented as contractual obligations in the liquidity sec-tion herein.

CAE ANNUAL REPORT 2004 MANAGEMENT’S DISCUSSION AND ANALYSIS 25
FOURTH QUARTEREBITConsolidated EBIT for the fourth quarter amounted to$27.1 million, compared to $60.5 million for the sameperiod the previous year. The decline was attributable toa substantially lower contribution from Civil, which sawa quarter-over-quarter drop in its EBIT of $17.5 million to$12.0 million in the fourth quarter. Military realized a26% increase in EBIT this quarter versus the third quar-ter. However, on a year-over-year basis the Military EBITwas down 28% to $15.9 million. The decreases fromCivil and Military were slightly offset by Marine, whichreported a 3% increase in its EBIT over the prior year toreach $9.2 million.
On a consolidated basis EBIT before restructuringcharges of $10.0 million was $37.1 million, down 39%compared to the same period in the previous year.Restructuring charges consist of severance and otherinvoluntary termination costs. The costs relate mainlyto the workforce reduction in the Montreal plant ofapproximately 250 employees, following the Canadiangovernment decision to attribute the CF-18 ADCTS simu-lation equipment contract to a competitor.
REVENUESConsolidated revenue for the fourth quarter decreasedby 4% to $299.3 million compared to the same periodlast year. On a segmented basis Military saw a 6%increase, attributed to higher activity from support ser-vices, certain land-based programs in Germany as wellas the Gesi system program for the Italian Ministry ofDefence. Civil’s segmented revenue for the fourth quar-ter amounted to $128.9 million down from $137.7 millionfor the same period last year. Civil’s decline was attribut-able to the adverse market conditions resulting in muchlower equipment sales offset partially by higher trainingrevenue. Marine’s fourth quarter revenues dropped to$39.2 million from $50.7 million due to the impact of acontribution of $8.0 million on the completion of theFrigate 124 program in Germany last year.
CASH FLOWCash and short-term investments balances at the end ofthe fourth quarter amounted to $61.9 million, a decreaseof $28.5 million compared to the third quarter, while thelong-term debt, including the current portion, decreasedby $49.3 million to $636.9 million resulting in $25.6 mil-lion negative cash flow for the quarter. Free cash flow(net cash provided by continuing operating activitiesless capital expenditures and dividends paid) for thequarter amounted to $54.3 million, up $105.8 millioncompared to the third quarter.
BACKLOGBacklog for comparison purposes has been restated. Fordetailed discussion on the issues regarding the restate-ment see Civil’s section of this MD&A. CAE’sconsolidated backlog as at March 31, 2004, was $2.9 bil-lion, $107.9 million higher than the previous quarter.
CRITICAL ACCOUNTING ESTIMATES
The preparation of financial statements in conformitywith generally accepted accounting principles requiresmanagement to make estimates and assumptions thataffect the reported amounts of assets and liabilities andthe disclosure of the contingent assets and liabilities atthe date of the financial statements and the reportedamounts of revenue and expenses for the periodreported. Estimates are based upon historical experi-ence and various other assumptions that are believed tobe reasonable under the circumstances. These esti-mates are evaluated periodically and form the basis formaking judgments regarding the carrying values ofassets and liabilities and the reported amount of rev-enue and expenses. Actual results may differ from theseestimates under different assumptions.
CAE’s critical accounting policies are those that itbelieves are the most important in determining its finan-cial condition and results, and require significantsubjective judgment by management. The Companyconsiders an accounting estimate to be critical if the esti-mate requires management to make assumptions aboutmatters that were highly uncertain at the time the esti-mate was made, if different estimates could have beenreasonably used or if changes in the estimate that wouldhave a material impact on CAE’s financial condition orresults of operations are likely to occur from period toperiod. A summary of the Company’s significantaccounting policies, including the critical accountingpolicies discussed below, is set out in the notes to theconsolidated financial statements.
REVENUE RECOGNITIONCAE generates a significant portion of its revenue fromlong-term contracts in all of its three business segments.Revenue from long-term contracts is recognized usingthe percentage-of-completion method, where revenue,earnings and unbilled accounts receivable are recordedas related costs are incurred, on the basis of percentagecosts incurred to date on a contract, relative to the antic-ipated total costs of completing the contract. Thelong-term nature of contracts involves considerable useof judgment and estimates in determining total costsand percentage of completion, as there are potentialvariances in scheduling, cost of materials, labour costsand productivity, and the impact of change orders thathave to be considered.
The Company conducts quarterly reviews of itstotal estimated costs on long-term contracts. The effectof any revision is accounted for by way of a cumulativecatch-up in the period in which the revision takes place.Losses on contracts, if any, are recognized fully whenfirst anticipated. Generally, the terms of long-term con-tracts provide for progress billing based on completionof certain phases of work. Warranty provisions arerecorded at the time revenue is recognized, based onpast experience.
With the focus of the Civil business on training, thenumber and amount of long-term contracts is downconsiderably from prior years. The cost of an FFS is verypredictable, particularly for repeat or common simulatortypes such as an A320 or B737. No revenue is recordedfor FFSs built for CAE’s own training centres. This cost isreflected as a capital expenditure. Revenue derived fromtraining is recorded when the training event occurs.

26 CAE ANNUAL REPORT 2004MANAGEMENT’S DISCUSSION AND ANALYSIS
For Military, full flight mission simulators are morecomplex and the time to design and manufacture is atleast two years. There are fewer repeat orders and thelevel of non-recurring cost in each simulator could besignificant, making the predictability of total costs moredifficult when compared to a Civil FFS.
Marine contracts are also longer term in nature,usually multi-year, as the majority of the contracts arefor real-time control systems requiring installation dur-ing the shipbuilding period. Most naval contractsinvolve supply of control systems for multiple ships ofthe same design with non-recurring effort for softwareengineering for first of class ship. The repeat ships arelargely hardware with little software.
VALUATION OF GOODWILL AND INTANGIBLE ASSETSGoodwill is no longer amortized, but is instead subjectto an annual assessment, or more frequently if events orcircumstances indicate, of impairment by applying a fairvalue based test at the reporting unit level, which forCAE are Civil, Military and Marine. An impairment losswould be recognized to the extent that the carryingamount of goodwill for each reporting unit exceeds itsestimated fair market value.
The fair market values of the reporting units arederived from certain valuation models, which may con-sider various factors such as normalized and estimatedfuture earnings, price earnings multiples, terminal val-ues and discount rates. Management uses judgment toestimate the fair market value of the reporting units, andchanges in estimates can affect the value of the reportedgoodwill. The Company performs the annual review ofgoodwill as at December 31 of each year, and based onthe impairment test performed as at December 31, 2003,CAE concluded that no goodwill impairment chargewas required.
CAE accounts for its business combinations underthe purchase method of accounting, which requires thatthe total cost of an acquisition be allocated to the under-lying net assets based on their respective estimated fairvalues. Part of this allocation process requires that theCompany identify and attribute values and estimatedlives to the intangible assets acquired. These determina-tions involve considerable judgment, and often involvethe use of significant estimates and assumptions,including those with respect to future cash flows, dis-count rates and asset lives. These determinationssubsequently affect the amount of amortization expenseto be recognized in future periods, over the intangibleassets’ estimated useful lives.
DEFERRED DEVELOPMENT COSTSWhere CAE intends to produce or market a productunder development that is clearly defined, has identifi-able costs, is technically feasible, and has a clearlydefined market or use, and the Company expects tohave the financial resources to complete the project, thecosts associated with the project are deferred to theextent their recovery through future sales or use of theproduct is reasonably assured. This requires CAE tomake judgments about the likelihood of recovery of thecosts. If the Company determines that recovery of thecosts through future sales or use is no longer likely,deferred costs are charged against earnings in theperiod in which it becomes likely that the costs will not
be recovered. Once the project is complete, CAE amor-tizes the deferred costs by reference to sales or use ofthe product over a period not to exceed five years (referto note 9 of the audited consolidated financial state-ments).
PRE-OPERATING COSTSThe Company defers expenditures incurred during thepre-operating period for all new training centres.Expenditures directly related to placing a new trainingcentre into commercial service are incremental in natureand are considered by management to be recoverablefrom the future operations of the new training centre.Capitalization ceases at the opening of the training cen-tre. Amortization of the deferred costs is taken over fiveyears in respect to Civil training operations and Marineoperations, and over 20 years for the Military MediumSupport Helicopter project, matching the term of thecontract (refer to note 9 of the audited consolidatedfinancial statements).
PENSION PLAN BENEFITSCAE’s obligations and expenses relating to pension ben-efits are determined using actuarial valuations, and aredependent on significant weighted average assump-tions such as the long-term rate of return on plan assets,the discount rate for pension benefits obligations andthe rate of compensation increase, as determined bymanagement. While management believes theseassumptions are reasonable, differences in actual resultsor changes in assumptions could have an impact on theobligations and expenses recorded by the Company. Inaccordance with GAAP, actual results that differ from theassumptions are accumulated and amortized over futureperiods, and generally impact the obligations andexpenses for future periods (refer to note 20 of theaudited consolidated financial statements).
INCOME TAXESCAE recognizes future income tax assets, resultingmainly from losses carryforward and deductible tempo-rary differences. Management assesses the realizationof these future tax assets regularly to determinewhether a valuation allowance is required. Based on evi-dence, both positive and negative, the Companydetermines whether it is more likely than not that all or aportion of the future income tax assets will be realized.The factors considered include estimated future earn-ings based on internal forecasts, cumulative losses inrecent years, history of loss carryforward other taxassets expiring unused, as well as prudent and feasibletax planning strategies.
CHANGES IN ACCOUNTING POLICIES
During the period covered by its financial statements,CAE implemented certain changes to its accounting poli-cies in order to conform to CICA accounting standards.
STOCK-BASED COMPENSATIONEffective April 1, 2003, CAE commenced prospectivelyexpensing its stock-based compensation using the fairvalue method, as prescribed by CICA Handbook Section3870, Stock-based Compensation and Other Stock-based
CAE ANNUAL REPORT 2004 MANAGEMENT’S DISCUSSION AND ANALYSIS 27
Payments. Since that date, the compensation cost forthe Company’s stock options has been recognized in netearnings, with a corresponding credit to contributed sur-plus (refer to note 12 of the audited consolidatedfinancial statements).
DISCLOSURE OF GUARANTEESAs at March 31, 2003, the Company adopted the CICAAccounting Guideline 14, Disclosure of Guarantees,which requires disclosure of information concerningcertain types of guarantees that may require payments,contingent on specified types of future events (refer tonote 13 of the audited consolidated financial statements).
IMPAIRMENT OF LONG-LIVED ASSETSOn April 1, 2003, the Company adopted CICA HandbookSection 3063, Impairment of Long-Lived Assets, whichrequires the recognition of an impairment loss for along-lived asset to be held and used when events orchanges in circumstances cause its carrying value toexceed the total undiscounted cash flows expected fromits use and eventual disposition. An impairment loss, ifany, is determined as the excess of the carrying value ofthe asset over its fair value. It replaces the impairmentprovision in Section 3061, Property, Plant and Equip-ment. The adoption of this standard did not have amaterial effect on consolidated financial statements.
DISPOSAL OF LONG-LIVED ASSETS ANDDISCONTINUED OPERATIONSOn April 1, 2003, the Company adopted CICA HandbookSection 3475, Disposal of Long-Lived Assets and Discontinued Operations, which provides guidance onrecognizing, measuring, presenting and disclosing long-lived assets to be disposed of. It replaces the disposalprovisions in Section 3061, Property, Plant and Equip-ment, and supersedes the former Section 3475,Discontinued Operations. Under this section, an assetclassified as held for sale is measured at lower of its car-rying amount or fair value less disposal costs, and is notdepreciated while classified as held for sale. The adop-tion of this standard did not have any material effect onCAE’s consolidated financial statements.
SEVERANCE, TERMINATION BENEFITS AND COSTSASSOCIATED WITH EXIT AND DISPOSAL ACTIVITIESThe Company prospectively adopted the new CICAEmerging Issues Committee Abstract 134 (EIC-134)Accounting for Severance and Termination Benefits andEIC-135 Accounting for Costs Associated with Exit andDisposal Activities (Including Costs Incurred in aRestructuring) relating to exit or disposal activities afterMarch 31, 2003. These abstracts provide guidance onthe timing of recognition and measurement of liabilitiesas well as disclosures for the various types of severanceand termination benefits related to the termination ofemployees’ services prior to normal retirement andcosts associated with an exit or disposal activity. Underthis new guidance, liabilities for these costs are to berecognized in the period when they are incurred andmeasured at their fair value. CAE applied these guide-lines in EIC-134 for severance and other costs (asdescribed in note 23 of the audited consolidated finan-cial statements).
ACCOUNTING STANDARDS NOT YET IMPLEMENTED
HEDGING RELATIONSHIPSThe CICA amended in November 2002 and June 2003 itsAccounting Guideline (AcG – 13), Hedging Relationships.It provides the views of the Accounting Standards Boardon the identification, designation, documentation andeffectiveness of hedging relationships for the purpose ofapplying hedge accounting, and the discontinuance of hedge accounting. Under this guideline, completedocumentation of the information related to hedgingrelationships is required and the effectiveness of thehedges must be demonstrated and documented.
This new Section is applicable for the Company as at April 1, 2004. CAE’s hedging relationships are documented according to related foreign exchangetransactions, which in turn are continuously monitoredto ensure effectiveness, and as such the adoption of thisnew recommendation is not expected to have a materialimpact on the Company’s financial statements.
REVENUE RECOGNITIONIn December 2003, the Emerging Issues Committeeissued EIC-141, Revenue Recognition, summarizing theprinciples set forth in Staff Accounting Bulletin 101(SAB 101) of the United States Securities and ExchangeCommission and providing general interpretive guid-ance on the application of revenue recognitionaccounting principles. These recommendations areeffective for CAE’s fiscal year beginning April 1, 2004.The Company is not expecting the new recommenda-tions to have a material impact on its consolidatedfinancial statements.
REVENUE ARRANGEMENTS WITH MULTIPLEDELIVERABLESAlso in December 2003, EIC-142, Revenue Arrangementswith Multiple Deliverables, was issued. EIC-142 addressescertain aspects of the accounting by a vendor forarrangements under which multiple revenue-generatingactivities will be performed. These recommendationsare effective for CAE’s fiscal year beginning April 1, 2004.The Company is currently assessing the impact of thenew recommendations on its consolidated financialstatements.
CONSOLIDATION OF VARIABLE INTEREST ENTITIESIn March 2004, the CICA issued a draft guideline of proposed amendments to its Accounting Guideline(AcG – 15) titled Consolidation of Variable InterestEntities. The resulting guideline will be harmonized withthe recently issued US guidance (FIN 46R) (see note 24 ofthe audited consolidated financial statements), and willbe applicable for interim and annual periods beginningon or after November 1, 2004.
This guideline requires that an enterprise holdingother than a voting interest in a Variable Interest Entity(VIE) could, subject to certain conditions, be required toconsolidate the VIE if it is considered its primary benefi-ciary whereby it would absorb the majority of the VIE’sexpected losses and/or receive the majority of itsexpected residual returns. In other words, it establishesthe consolidation criteria for VIEs based on a risks-and-rewards model rather than on a control-based model.

28 CAE ANNUAL REPORT 2004MANAGEMENT’S DISCUSSION AND ANALYSIS
The Company is currently evaluating the impact ofthis new guideline on its financial statements. It is antici-pated that unless certain existing agreements aremodified prior to the application of this standard, CAEmay be required to consolidate certain assets previouslysold to special-purpose entities and the related liabilitiesand non-controlling interests.
F INANCIAL INSTRUMENTSThe CICA issued revisions to Section 3860 of the CICA Handbook, Financial instruments – Disclosure andPresentation. The Section now clarifies how to accountfor certain financial instruments that have liability char-acteristics as well as equity characteristics. It requiresinstruments that meet specific criteria to be classified asliabilities in the balance sheet. Many of these financialinstruments were previously classified as equities. CAEdoes not currently have any instruments with thesecharacteristics. Adopting this Section did not affect theCompany’s future consolidated financial statements.
EMPLOYEE FUTURE BENEFITSIn December 2003, new disclosure requirements forpensions and other employee future benefits wereissued. The new disclosures include a narrative descrip-tion of each type of plan, the measurement date of theplan asset and liability, the effective date of the last actu-arial evaluation, the detail of the plan asset by majorcategory, etc. This requirement will be applicable forCAE in the first quarter of fiscal 2005. However, as part ofits ongoing disclosure, the Company already includesmost of this information in its note disclosure.
GENERALLY ACCEPTED ACCOUNTING PRINCIPLESAND FINANCIAL STATEMENT PRESENTATIONThe CICA issued new Handbook Sections 1100, GenerallyAccepted Accounting Principles, and 1400, GeneralStandards of Financial Statement Presentation. Section1100 describes what constitutes Canadian GAAP and itssources, and provides guidance on sources to consultwhen selecting accounting policies and appropriate dis-closure when a matter is not dealt with explicitly in theprimary sources of GAAP, thereby recodifying theCanadian GAAP hierarchy. Section 1400 clarifies what isfair presentation in accordance with GAAP and providesgeneral guidance on financial presentation.
The Company does not expect any significantimpact on its consolidated financial statements with theadoption on April 1, 2004, of this new Section.
FINANCIAL INSTRUMENTS
The Company enters into forward, swap and option con-tracts to manage its exposure to fluctuations in foreignexchange rates, interest rates, and changes in shareprice. CAE assesses on an ongoing basis whether thederivatives that are used in hedging transactions areeffective in offsetting changes in fair values or cash flowsof hedged items. The Company does not hold or issuederivative financial instruments for speculative tradingpurposes. CAE deals only with sound counterparties inexecuting any of its derivative financial instruments.
CAE employs foreign exchange forward contracts tomanage exposures created when sales are made in for-eign currencies. The amount and timing of the maturity
of these forward contracts varies based on a number ofproject related factors, including milestone billings andthe use of foreign materials and/or subcontractors. As atMarch 31, 2004, CAE had $210.9 million Canadian equiv-alent in forward contracts compared to $102.9 millionCanadian equivalent in forward contracts as at March31, 2003. During the year CAE reviewed its foreign cur-rency risk management policies and procedures whilepreparing for the April 1, 2004 implementation of theCICA Accounting Guideline on Hedging Relationships,and CAE’s hedging strategy evolved from primarilyhedging on a net foreign currency cash flow basis tomore specific contract hedging. The total unrealizedgain as of March 31, 2004 is $1.6 million compared to$2.7 million as of March 31, 2003.
CAE also uses financial instruments to manage itsexposure to changing interest rates and to adjust its mixof fixed and floating interest rate debt at a desirablelevel. The mix of fixed-rate versus floating-rate debt onits long-term debt was 45% – 55% respectively as atMarch 31, 2004. Part of the change in that mix sinceMarch 31, 2003, where it stood at 38% – 62% respec-tively, is due mainly to the reduction in utilization of thecommitted bank facilities where the borrowings are allat floating rates. CAE had interest rate swaps convertingmostly floating-rate long-term debt into fixed-rate termdebt totalling $114.6 million which if marked to marketat that date would result in a loss of $2.6 million com-pared to a loss of $10.3 million as of March 31, 2003.
As well, CAE reduces its exposure to the fluctuationin its share price, which impacts the cost of the DSUprogram. In March 2004, the Company entered into ahedging contract to reduce its cash and earnings expo-sure to the fluctuation in the Company’s share pricerelating to the DSU program. As at March 31, 2004, thehedging contract covered 700,000 shares of theCompany.
DISCLOSURE OF OUTSTANDING SHARE DATA
CAE’s articles of incorporation authorize the issuance ofan unlimited number of common shares, and an unlim-ited number of preferred shares, issuable in series.To date, the Company has not issued any preferredshares. At March 31, 2004, CAE had 246,649,180 com-mon shares issued and outstanding. As at the samedate, the Company had 8,128,370 options outstanding,of which 2,887,000 were exercisable.
SYSTEMS, PROCEDURES AND CONTROLS
CAE management is responsible for establishing appro-priate information systems, procedures and controls toensure that all financial information disclosed exter-nally, including this MD&A, and used internally bymanagement, is complete and reliable. These proce-dures include a review of the financial statements andassociated information, including this MD&A, by theAudit Committee of the Board of Directors. TheCompany’s Chief Executive Officer and Chief FinancialOfficer have a process to evaluate the applicable sys-tems, procedures and controls and are satisfied they areadequate for ensuring that complete and reliable finan-cial information is produced.

CAE ANNUAL REPORT 2004 MANAGEMENT AND AUDITORS’ REPORTS 29
MANAGEMENT’S STATEMENT OF RESPONSIBILITYThe consolidated financial statements contained in this Annual Report are the responsibility of management, and havebeen prepared in accordance with Canadian generally accepted accounting principles and include when necessarysome estimates based on management best judgment. Financial information presented elsewhere in the Annual Reportis under management responsibilities and consistent with that contained in the accompanying financial statements.
CAE’s policy is to maintain internal accounting and administrative systems, combined with disclosure control ofhigh quality consistent with reasonable cost. Such systems are designed to provide reasonable assurance as to thereliability of financial information and the safeguarding of assets.
The Board of Directors is responsible for ensuring that Management fulfils its responsibilities for financial report-ing and is ultimately responsible for reviewing and approving the consolidated financial statements through its AuditCommittee, consisting solely of outside directors, which reviews the consolidated financial statements and reportsthereon to the Board. The Committee meets periodically with the external auditors, internal auditors and managementto review their respective activities and to satisfy itself that each party is properly discharging its responsibilities. Bothexternal auditors and internal auditors have free access to the Committee, with or without management, to discussthe scope of their audits, the adequacy of the system of internal controls and financial reporting.
The financial statements have been reviewed by the Audit Committee and, together with the other required infor-mation in the Annual Report, approved by the Board of Directors. In addition, the consolidated financial statementshave been audited by PricewaterhouseCoopers LLP, whose report is provided below.
D.H. Burney P.G. RenaudPresident and Chief Executive Officer Executive Vice President,
Chief Financial Officer and SecretaryMontreal, CanadaMay 11, 2004
MANAGEMENT AND AUDITORS’ REPORTS
AUDITORS’ REPORT To the Shareholders of CAE Inc.We have audited the Consolidated Balance Sheets of CAE Inc. as at March 31, 2004 and 2003, and the consolidatedstatements of earnings, retained earnings and cash flows for each of the years in the three-year period endedMarch 31, 2004. These financial statements are the responsibility of the Company’s management. Our responsibility isto express an opinion on these financial statements based on our audits.
We conducted our audits in accordance with Canadian generally accepted auditing standards. Those standardsrequire that we plan and perform an audit to obtain reasonable assurance whether the financial statements are free ofmaterial misstatement. An audit includes examining, on a test basis, evidence supporting the amounts and disclo-sures in the financial statements. An audit also includes assessing the accounting principles used and significantestimates made by management, as well as evaluating the overall financial statement presentation.
In our opinion, these consolidated financial statements present fairly, in all material respects, the financial positionof the Company as at March 31, 2004 and 2003, and the results of its operations and cash flows for each of the years inthe three-year period ended March 31, 2004 in accordance with Canadian generally accepted accounting principles.
PricewaterhouseCoopers LLPChartered Accountants Montreal, CanadaMay 11, 2004
Comments by Auditors for US Readers on Canada-US Reporting DifferenceIn the United States, reporting standards for auditors require the addition of an explanatory paragraph (following theopinion paragraph) when there is a change in accounting principles that has a material effect on the comparability ofthe company’s financial statements, such as the changes described in note 1 to the consolidated financial statements.Our report to the shareholders dated May 11, 2004 is expressed in accordance with Canadian reporting standardswhich do not require a reference to such a change in accounting principles in the auditors’ report when the change isproperly accounted for and adequately disclosed in the financial statements.
PricewaterhouseCoopers LLPChartered AccountantsMontreal, CanadaMay 11, 2004
4011 CAE AR E 29-64 v.2+PWC 6/22/04 3:02 PM Page 29

30 CAE ANNUAL REPORT 2004CONSOLIDATED FINANCIAL STATEMENTS
as at March 31 (amounts in millions of Canadian dollars) 2004 2003
Assets Current assets
Cash and cash equivalents $ 61.9 $ 17.1Short-term investments – 2.6 Accounts receivable (note 4) 390.9 373.1Inventories (note 5) 154.8 136.3Prepaid expenses 20.7 14.0Income taxes recoverable 52.0 25.7Future income taxes (note 14) 1.8 3.5
682.1 572.3Restricted cash 7.0 14.4Assets of discontinued operations (note 3) – 50.0 Property, plant and equipment, net (note 6) 843.0 930.4Future income taxes (note 14) 93.8 85.7 Intangible assets (note 7) 155.2 171.7Goodwill (note 8) 343.8 366.8 Other assets (note 9) 168.4 165.2
$ 2,293.3 $ 2,356.5
Liabilities and shareholders’ equityCurrent liabilities
Accounts payable and accrued liabilities $ 350.0 $ 413.3Deposits on contracts 91.1 101.2Long-term debt due within one year (note 10) 13.5 13.4Future income taxes (note 14) 51.1 42.4
505.7 570.3 Liabilities of discontinued operations (note 3) – 17.9Long-term debt (note 10) 623.4 798.0Deferred gains and other long-term liabilities (note 15) 155.6 139.6Future income taxes (note 14) 89.8 80.5
1,374.5 1,606.3
Shareholders’ equity Capital stock (note 11) 367.5 190.5Contributed surplus (note 12) 1.3 –Retained earnings 562.1 531.2Currency translation adjustment (note 21) (12.1) 28.5
918.8 750.2
$ 2,293.3 $ 2,356.5
Commitments and contingencies (notes 17 and 19)
Approved by the Board:
D.H. Burney L.R. WilsonDirector Director
The accompanying notes form an integral part of these consolidated financial statements.
CONSOLIDATED BALANCE SHEETS

CAE ANNUAL REPORT 2004 CONSOLIDATED FINANCIAL STATEMENTS 31
years ended March 31 (amounts in millions of Canadian dollars, except per share amounts) 2004 2003 2002
RevenueCivil Simulation and Training $ 461.8 $ 517.2 $ 545.2Military Simulation and Training 472.8 445.7 461.8Marine Controls 158.6 167.6 119.5
$ 1,093.2 $ 1,130.5 $ 1,126.5
Earnings before interest, income taxes and discontinued operationsCivil Simulation and Training $ 39.4 $ 116.2 $ 158.8Military Simulation and Training 52.6 73.6 65.6Marine Controls 29.6 31.8 23.6Restructuring Costs (note 23) (10.0) – (7.0)
Earnings before interest, income taxes and discontinued operations 111.6 221.6 241.0Interest on debt (note 10 (ix)) 30.0 34.1 26.1Other interest income, net (6.1) (3.7) (3.4)
Earnings before income taxes and discontinued operations 87.7 191.2 218.3Income taxes (note 14) 20.6 60.2 69.9
Earnings from continuing operations $ 67.1 $ 131.0 $ 148.4Results of discontinued operations (note 3) (3.1) (13.8) 1.1
Net earnings $ 64.0 $ 117.2 $ 149.5
Basic and diluted earnings per share from continuing operations $ 0.29 $ 0.60 $ 0.68
Basic and diluted net earnings per share $ 0.27 $ 0.53 $ 0.69
Weighted average number of common shares outstanding 233.2 219.4 217.6
CONSOLIDATED STATEMENTS OF RETAINED EARNINGS
years ended March 31 (amounts in millions of Canadian dollars) 2004 2003 2002
Retained earnings at beginning of year $ 531.2 $ 440.4 $ 315.9Share issue costs (net of taxes of $2.4 million) (5.1) – –Net earnings 64.0 117.2 149.5 Dividends (28.0) (26.4) (25.0)
Retained earnings at end of year $ 562.1 $ 531.2 $ 440.4
The accompanying notes form an integral part of these consolidated financial statements.
CONSOLIDATED STATEMENTS OF EARNINGS

32 CAE ANNUAL REPORT 2004CONSOLIDATED FINANCIAL STATEMENTS
years ended March 31 (amounts in millions of Canadian dollars) 2004 2003 2002
Operating activitiesEarnings from continuing operations $ 67.1 $ 131.0 $ 148.4Adjustments to reconcile earnings to cash flows
from operating activities:Amortization 75.4 70.6 43.1Future income taxes 2.1 18.8 7.1 Investment tax credits (22.8) (18.6) (19.0)Stock-based compensation 1.3 – –Other (6.3) (18.1) 1.1Increase in non-cash working capital (note 16) (107.2) (41.3) (7.6)
Net cash provided by continuing operating activities 9.6 142.4 173.1Net cash (used in) provided by discontinued operating activities (3.9) 12.5 (15.9)
Net cash provided by operating activities 5.7 154.9 157.2
Investing activitiesPurchase of businesses (note 2) – – (757.6)Proceeds from disposal of discontinued operations (note 3) 22.3 25.0 187.1 Short-term investments, net 2.6 18.8 101.5 Capital expenditures (94.5) (238.9) (249.6)Proceeds from sale and leaseback of assets 122.5 127.0 42.6 Deferred development costs (12.7) (13.3) (31.1)Deferred pre-operating costs (10.4) (10.7) (15.1)Other assets (5.3) (27.5) (33.0)
Net cash provided by (used in) continuing investing activities 24.5 (119.6) (755.2)Net cash used in discontinued investing activities – (14.8) (4.7)
Net cash provided by (used in) investing activities 24.5 (134.4) (759.9)
Financing activitiesProceeds from long-term debt 525.3 270.0 755.8Repayments of long-term debt (650.4) (326.3) (195.6)Dividends paid (27.4) (26.2) (24.8)Capital stock issuances (note 11) 176.4 3.5 6.1Share issue costs (7.5) – –Other 1.4 (14.1) (2.3)
Net cash provided by (used in) continuing financing activities 17.8 (93.1) 539.2Net cash used in discontinued financing activities – (1.3) (3.9)
Net cash provided by (used in) financing activities 17.8 (94.4) 535.3
Effect of foreign exchange rate changes on cash and cash equivalents (3.2) 2.2 (0.6)
Net increase (decrease) in cash and cash equivalents 44.8 (71.7) (68.0)Cash and cash equivalents at beginning of year 17.1 88.8 156.8
Cash and cash equivalents at end of year $ 61.9 $ 17.1 $ 88.8
Supplementary cash flow information (note 16)
The accompanying notes form an integral part of these consolidated financial statements.
CONSOLIDATED STATEMENTS OF CASH FLOW
CAE ANNUAL REPORT 2004 NOTES TO CONSOLIDATED FINANCIAL STATEMENTS 33
NOTE 1 – SUMMARY OF SIGNIFICANT ACCOUNTING POLICIES
The accounting policies of CAE Inc. and its subsidiaries (“CAE” or “the Company”) conform with Canadian generallyaccepted accounting principles (Canadian GAAP). These accounting principles are different in some respects fromUnited States generally accepted accounting principles (U.S. GAAP). The significant differences are described innote 24.
NATURE OF OPERATIONS
CAE designs and provides simulation equipment and services and develops integrated training solutions for the mili-tary, commercial airlines, business aircraft operators, aircraft manufacturers and marine vessel operators.
CAE’s flight simulators replicate aircraft performance in normal and abnormal operations and a comprehensiveset of environmental conditions, utilizing visual systems with an extensive database of airports, other landing areasand flying environments and motion and sound cues to create a fully immersive training environment. The Companyoffers a full range of flight training devices based on the same software used in its simulators. CAE operates a globalnetwork of training centres in locations around the world.
The Company also provides simulators and training services for sea- and land-based activities and suppliesmarine automation systems for military and civil applications. CAE’s marine control systems monitor and controlpropulsion, electrical steering, ancillary, auxiliary and damage control systems.
CONSOLIDATION
The consolidated financial statements include the accounts of CAE Inc. and all subsidiaries. All inter-corporateaccounts and transactions have been eliminated. Acquisitions are accounted for using the purchase method and,accordingly, the results of operations of subsidiaries are included from the respective dates of acquisition. Portfolioinvestments are accounted for using the cost method.
REVENUE RECOGNITION
Revenue from long-term contracts for building simulators and controls systems is recognized using the percentage-of-completion method where revenue, earnings and unbilled accounts receivable are recorded as related costs areincurred, on the basis of the percentage of actual costs incurred to date on a contract, relative to the estimated totalcosts to complete that contract. Revisions in cost and earnings estimates during the term of the contract are reflectedin the period in which the need for revision becomes known. Losses, if any, are recognized fully when first anticipated.Generally, the terms of long-term contracts provide for progress billings based on completion of certain phases ofwork. Warranty provisions are recorded at the time revenue is recognized, based on past experience. No right ofreturn or complimentary upgrades are provided to customers. Post-delivery customer support is billed separately andrevenue is recorded ratably over the support period.
Training service revenues are recognized in the period such services are provided. All other revenue is recordedand related costs transferred to cost of sales at the time the product is delivered and the benefits and the risks ofownership associated with the product are transferred to the customer.
CASH AND CASH EQUIVALENTS
Cash consists of cash and cash equivalents, which are short-term, highly liquid investments with original terms tomaturity of 90 days or less.
SHORT-TERM INVESTMENTS
Short-term investments include money market instruments and commercial paper carried at the lower of cost or market value.
INVENTORIES
Raw materials are valued at the lower of cost and replacement cost. Work in process is stated at the lower of averagecost and net realizable value. The cost of work in process includes material, labour and an allocation of manufacturingoverhead.
RESTRICTED CASH
Under the terms of subsidiaries external bank financing and some government-related sales contracts, the Companyis required to hold a defined amount of cash as collateral.
NOTES TO CONSOLIDATED FINANCIAL STATEMENTS
years ended March 31, 2004, 2003 and 2002 (amounts in millions of Canadian dollars)

34 CAE ANNUAL REPORT 2004NOTES TO CONSOLIDATED FINANCIAL STATEMENTS
PROPERTY, PLANT AND EQUIPMENT
Property, plant and equipment are stated at amortized cost. The declining balance and straight-line methods are usedin computing amortization over the estimated useful lives of the assets. Useful lives are estimated as follows:
Building and improvements 20 to 40 yearsMachinery and equipment 3 to 10 yearsSimulators 12 to 25 years
In fiscal year 2003, the Company changed the amortization period for Civil simulation equipment from 20 years to25 years, to reflect the approximated useful life of the simulators. That change reduced the amortization expense by$3.7 million in fiscal 2003 as compared to fiscal 2002.
LEASES
Leases entered into by the Company in which substantially all the benefits and risks of ownership are transferred tothe Company are recorded as capital leases and classified as property, plant and equipment and long-term borrow-ings. All other leases are classified as operating leases under which leasing costs are expensed in the period in whichthey are incurred. Gains on the sale and leaseback of simulators are deferred and the gains in excess of the residualvalue guarantees are amortized over the term of the lease.
The residual value guarantees are to be recognized in the Company’s earnings upon expiry of the related saleand leaseback agreement.
BUSINESS COMBINATIONS, GOODWILL AND INTANGIBLE ASSETS
The Company accounts for its business acquisitions using the purchase method. Goodwill represents the cost ofinvestments in subsidiaries in excess of the fair value of the net identifiable assets acquired. Goodwill acquired in abusiness combination is accounted for under CICA Handbook Section 3062, Goodwill and Other Intangible Assets.This section requires that goodwill not be amortized. The fair value is to be assessed at least annually and, if neces-sary, is written down to such fair value for any impairment.
Intangible assets are recorded at their fair value at the date of acquisition of the related operating companies.Amortization is provided for all intangible assets on a straight-line basis over their estimated useful lives as follows:
WeightedAverage
Amortization AmortizationPeriod Period
Trade names 20 to 25 years 21Backlog and contractual agreements 1 to 20 years 10Customer relationships 10 to 25 years 24Other 12 to 20 years 16
INTEREST CAPITALIZATION
Interest costs relating to the construction of simulators and buildings for training centres are capitalized as part of thecost of property, plant and equipment. Capitalization of interest ceases when the simulator is completed and ready forproductive use.
FOREIGN CURRENCY TRANSLATION
The functional currency of the Company and each of its subsidiaries is the local currency. Monetary assets and liabili-ties denominated in currencies other than the functional currency are translated at exchange rates in effect at thebalance sheet date. Non-monetary assets and liabilities denominated in currencies other than the functional currencyare translated into the functional currency using the exchange rate prevailing at the dates of the respective transac-tions. Revenue and expense items are translated at average rates of exchange for the year. Translation gains or lossesare included in the determination of earnings, except for gains or losses arising on translation of accounts of foreignsubsidiaries considered self-sustaining, exchange gains and losses on inter-company account balances that form partof the net investment in foreign operations and gains or losses arising from the translation of foreign currency debtthat has been designated as a hedge of the net investment in subsidiaries, which are reflected as a separate compo-nent of shareholders’ equity.
Earnings from continuing operations include a net foreign exchange gain of $10.6 million in 2004 or 5 cents pershare (2003 – net foreign exchange gain of $6.1 million or 3 cents per share, 2002 – net foreign exchange loss of$1.2 million or 1 cent per share).
RESEARCH AND DEVELOPMENT COSTS
Research costs are charged to earnings in the periods in which they are incurred. Development costs are also chargedto earnings in the period incurred unless they meet the criteria for deferral. Government assistance arising fromresearch and development costs is deducted from the related costs. Amortization of development costs deferred tofuture periods commences with the commercial production of the product and is charged to earnings based on antic-ipated sales of the product, over a period not exceeding five years.
CAE ANNUAL REPORT 2004 NOTES TO CONSOLIDATED FINANCIAL STATEMENTS 35
PRE-OPERATING COSTS
The Company defers expenditures incurred during the pre-operating period for all new training centres. Expendituresdirectly related to placing a new training centre into commercial service are incremental in nature and are consideredby management to be recoverable from the future operations of the new training centre. Capitalization ceases at theopening of the training centre. Amortization of the deferred costs is taken over five years in respect to civil trainingoperations and marine operations and over 20 years for the Medium Support Helicopter project, matching the term ofthe contract.
DEFERRED FINANCING COSTS
Costs incurred relating to the issuance of long-term debt are deferred and amortized over the term of the related debt.
INCOME TAXES
Future income taxes relate to the expected future tax consequences of differences between the carrying amount ofbalance sheet items and their corresponding tax values. A valuation allowance is recognized to the extent that, in theopinion of management, it is more likely than not that the future income tax assets will not be realized. Future incometax assets and liabilities are adjusted for the effects of subsequent changes in tax laws and rates on the date of enact-ment or substantive enactment.
Investment tax credits arising from research and development activities are deducted from the related costs andare accordingly included in the determination of earnings in the same year as the related costs. Investment tax creditsarising from the acquisition of property, plant and equipment and deferred development costs are deducted from thecost of those assets with amortization calculated on the net amount.
The Company is subject to examination by taxation authorities in various jurisdictions. The determination of taxliabilities involved certain uncertainties in the interpretation of complex tax regulations. Therefore, the Company pro-vides for potential tax liabilities based on management’s best estimates. Differences between the estimates and theultimate amounts of taxes and investment tax credits are recorded in earnings at the time they can be determined.
PENSIONS
The Company accrues its obligations under employee pension plans and the related costs, net of plan assets. The costof pensions is actuarially determined using the projected benefits method calculated based on employee service,salary escalation and retirement age, together with the expected return on plan assets. For the purpose of calculatingthe expected return on plan assets, those assets are valued at fair market value.
The excess of the net actuarial gain (loss) over 10% of the greater of the benefit obligation and the fair value ofplan assets is amortized over the remaining service period of active employees.
STOCK-BASED COMPENSATION PLANS
The Company’s stock-based compensation plans consist of an Employee Stock Option Plan (ESOP), an Employee StockPurchase Plan (ESPP), a Deferred Share Unit (DSU) plan for executives and on April 1, 2003, the Company adopted aLong-Term Incentive Deferred Share Unit Plan (LTI-DSU), both of which (DSU and LTI-DSU) are described in note 12.
In fiscal 2004, the Company adopted on a prospective basis the CICA recommendations issued in June 2003 andexpensed prospectively the cost of stock options granted to employees using the fair value based method. A com-pensation expense is recognized for the Company’s portion of the contributions made under the ESPP and foramounts due under the DSU and LTI-DSU plans. In fiscal 2004, compensation cost for CAE’s stock options was recog-nized in net earnings with a corresponding credit of $1.3 million to contributed surplus using the fair value method ofaccounting for awards that were granted in May 2003.
In fiscal 2003, CAE adopted the initial recommendations of CICA Section 3870, Stock-based Compensation andOther Stock-based Payments. The standard encouraged, but did not require, that the fair value based method forvaluing stock options be used for transactions with employees. Under the fair value method, compensation expenseis measured at the grant date and recognized over the service period. In note 12, pro forma net earnings and proforma basic and diluted net earnings per share figures are presented as if the fair value based method of accountinghad been used to account for stock options granted to employees during fiscal 2003. CAE’s practice is to issue optionsin May of each fiscal year, whereby these options vest equally over four years. Any consideration paid by plan partici-pants on the exercise of share options or the purchase of shares is credited to share capital together with any relatedstock-based compensation expense.
DERIVATIVE FINANCIAL INSTRUMENTS
The Company enters into forward, swap and option contracts to manage its exposure to fluctuations in interest ratesand foreign exchange rates. CAE assesses on an ongoing basis whether the derivatives that are used in hedgingtransactions are effective in offsetting changes in fair values or cash flows of hedged items. The Company does nothold or issue derivative financial instruments for speculative trading purposes.
The foreign currency risk associated with certain purchase and sale commitments denominated in a foreign cur-rency is hedged through a combination of forward contracts and options. The foreign currency realized andunrealized gains or losses associated with derivative instruments, which have been terminated or cease to be effec-tive prior to maturity, are deferred under other current, or non-current, assets or liabilities on the balance sheet andrecognized in income in the period in which the underlying hedged transaction is recognized. In the event a desig-nated hedged item is sold, extinguished or matures prior to the termination of the related derivative instrument, anyrealized or unrealized gain or loss on such derivative instrument is recognized in income.

36 CAE ANNUAL REPORT 2004NOTES TO CONSOLIDATED FINANCIAL STATEMENTS
Interest rate swap contracts are designated as hedges of the interest rate of certain financial instruments. Theinterest payments relating to swap contracts are recorded in net earnings over the life of the underlying transactionon an accrual basis as an adjustment to interest income or interest expense.
EARNINGS PER SHARE
The calculation of basic earnings per share is based on the weighted average number of shares issued and outstand-ing. Diluted earnings per share is calculated by dividing net earnings available to common shareholders by theweighted average number of shares used in the basic earnings per share calculation plus the number of commonshares that would be issued assuming exercise or conversion of all dilutive potential common shares outstandingduring the year using the treasury stock method.
USE OF ESTIMATES
The preparation of financial statements in conformity with GAAP requires management to make estimates andassumptions that affect the reported amounts of assets and liabilities and disclosure of contingent assets and liabili-ties at the date of the financial statements and the reported amounts of revenues and expenses for the periodreported. Actual results could differ from those estimates.
RECENTLY ADOPTED ACCOUNTING STANDARDS
Impairment of long-lived assetsOn April 1, 2003, the Company adopted CICA Handbook Section 3063, Impairment of Long-Lived Assets, whichrequires the recognition of an impairment loss for a long-lived asset to be held and used when events or changes incircumstances cause its carrying value to exceed the total undiscounted cash flows expected from its use and even-tual disposition. An impairment loss, if any, is determined as the excess of the carrying value of the asset over its fairvalue. It replaces the impairment provision in Section 3061, Property, Plant and Equipment.
The adoption of this standard did not have any material effect on consolidated financial statements.
Disposal of long-lived assets and discontinued operationsOn April 1, 2003, the Company adopted CICA Handbook Section 3475, Disposal of Long-Lived Assets and Discon-tinued Operations, which provides guidance on recognizing, measuring, presenting and disclosing long-lived assetsto be disposed of. It supersedes the former Section 3475, Discontinued Operations.
Under this section, an asset classified as held for sale is measured at the lower of its carrying amount or fair valueless disposal costs, and is not depreciated while classified as held for sale. The adoption of this standard did not haveany material effect on CAE’s consolidated financial statements.
Severance, termination benefits and costs associated with exit and disposal activitiesOn April 1, 2003, the Company prospectively adopted the new CICA Emerging Issues Committee Abstract 134 (EIC-134), Accounting for Severance and Termination Benefits, and EIC-135, Accounting for Costs Associated with Exit and Disposal Activities (Including Costs Incurred in a Restructuring), relating to exit or disposal activities afterMarch 31, 2003. These abstracts provide guidance on the timing of recognition and measurement of liabilities as wellas disclosures for the various types of severance and termination benefits related to the termination of employees’services prior to normal retirement and costs associated with an exit or disposal activity. Under this new guidance,liabilities for these costs are to be recognized in the period when they are incurred and measured at their fair value.
CAE applied these guidelines for severance and other costs as described in note 23.
FUTURE CHANGES TO ACCOUNTING STANDARDS
Hedging relationshipsThe CICA amended in November 2002 and June 2003 its Accounting Guideline (AcG – 13), Hedging Relationships.It provides the views of the Accounting Standards Board on the identification, designation, documentation and effec-tiveness of hedging relationships for the purpose of applying hedge accounting, and the discontinuance of hedgeaccounting. Under this guideline, complete documentation of the information related to hedging relationships isrequired and the effectiveness of the hedges must be demonstrated and documented. This new Section is applicablefor the Company on April 1, 2004.
On April 1, 2004, CAE will continue to apply hedge accounting in accordance with the requirements prescribed bythe Guideline.
Consolidation of variable interest entitiesIn March 2004, the CICA issued proposed amendments to its Accounting Guideline (AcG – 15) titled Consolidation ofVariable Interest Entities. The resulting guideline will be harmonized with the recently issued US guidance (FIN 46R)(see note 24), and is expected to be applicable for interim and annual periods beginning on or after November 1, 2004.The guideline requires that an enterprise holding other than a voting interest in a Variable Interest Entity (VIE) could,subject to certain conditions, be required to consolidate the VIE if such enterprise is considered its primary beneficiarywhereby it would absorb the majority of the VIE’s expected losses and/or receive the majority of its expected residualreturns. The Company is currently evaluating the impact of this draft guideline on its financial statements.
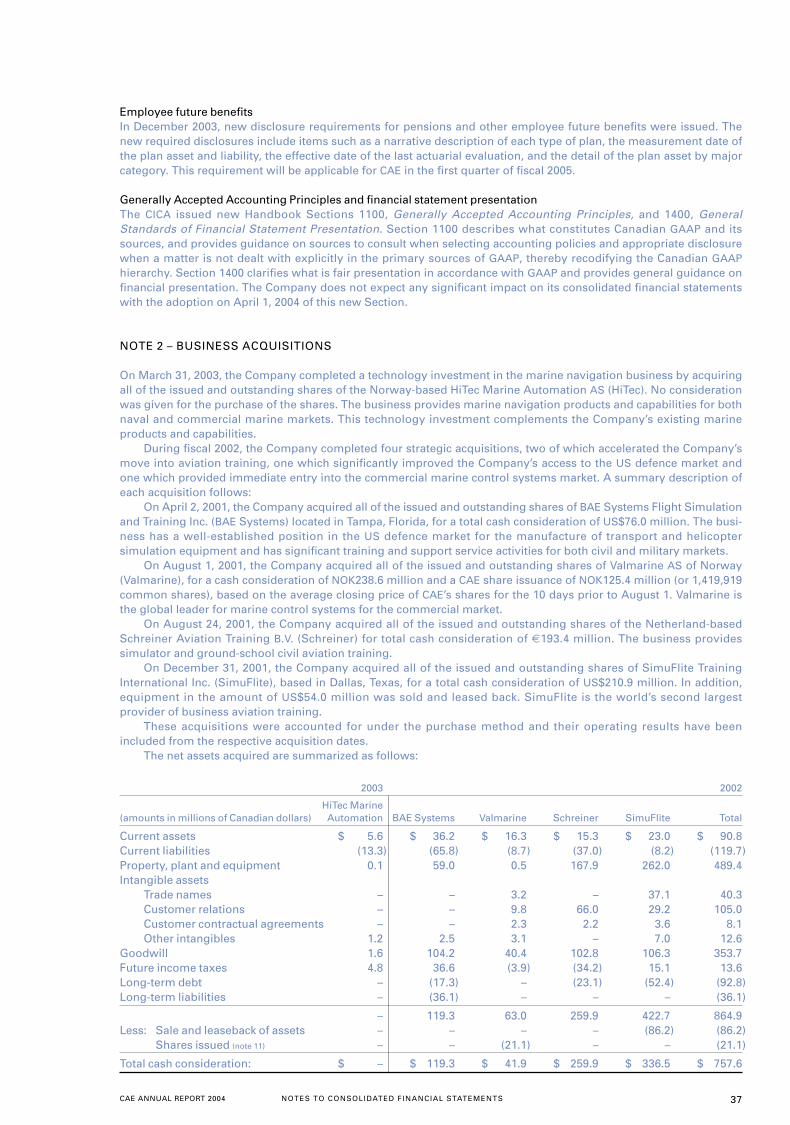
CAE ANNUAL REPORT 2004 NOTES TO CONSOLIDATED FINANCIAL STATEMENTS 37
Employee future benefitsIn December 2003, new disclosure requirements for pensions and other employee future benefits were issued. Thenew required disclosures include items such as a narrative description of each type of plan, the measurement date ofthe plan asset and liability, the effective date of the last actuarial evaluation, and the detail of the plan asset by majorcategory. This requirement will be applicable for CAE in the first quarter of fiscal 2005.
Generally Accepted Accounting Principles and financial statement presentationThe CICA issued new Handbook Sections 1100, Generally Accepted Accounting Principles, and 1400, GeneralStandards of Financial Statement Presentation. Section 1100 describes what constitutes Canadian GAAP and itssources, and provides guidance on sources to consult when selecting accounting policies and appropriate disclosurewhen a matter is not dealt with explicitly in the primary sources of GAAP, thereby recodifying the Canadian GAAPhierarchy. Section 1400 clarifies what is fair presentation in accordance with GAAP and provides general guidance onfinancial presentation. The Company does not expect any significant impact on its consolidated financial statementswith the adoption on April 1, 2004 of this new Section.
NOTE 2 – BUSINESS ACQUISITIONS
On March 31, 2003, the Company completed a technology investment in the marine navigation business by acquiringall of the issued and outstanding shares of the Norway-based HiTec Marine Automation AS (HiTec). No considerationwas given for the purchase of the shares. The business provides marine navigation products and capabilities for bothnaval and commercial marine markets. This technology investment complements the Company’s existing marineproducts and capabilities.
During fiscal 2002, the Company completed four strategic acquisitions, two of which accelerated the Company’smove into aviation training, one which significantly improved the Company’s access to the US defence market andone which provided immediate entry into the commercial marine control systems market. A summary description ofeach acquisition follows:
On April 2, 2001, the Company acquired all of the issued and outstanding shares of BAE Systems Flight Simulationand Training Inc. (BAE Systems) located in Tampa, Florida, for a total cash consideration of US$76.0 million. The busi-ness has a well-established position in the US defence market for the manufacture of transport and helicoptersimulation equipment and has significant training and support service activities for both civil and military markets.
On August 1, 2001, the Company acquired all of the issued and outstanding shares of Valmarine AS of Norway(Valmarine), for a cash consideration of NOK238.6 million and a CAE share issuance of NOK125.4 million (or 1,419,919common shares), based on the average closing price of CAE’s shares for the 10 days prior to August 1. Valmarine isthe global leader for marine control systems for the commercial market.
On August 24, 2001, the Company acquired all of the issued and outstanding shares of the Netherland-basedSchreiner Aviation Training B.V. (Schreiner) for total cash consideration of €193.4 million. The business providessimulator and ground-school civil aviation training.
On December 31, 2001, the Company acquired all of the issued and outstanding shares of SimuFlite TrainingInternational Inc. (SimuFlite), based in Dallas, Texas, for a total cash consideration of US$210.9 million. In addition,equipment in the amount of US$54.0 million was sold and leased back. SimuFlite is the world’s second largestprovider of business aviation training.
These acquisitions were accounted for under the purchase method and their operating results have beenincluded from the respective acquisition dates.
The net assets acquired are summarized as follows:
2003 2002
HiTec Marine (amounts in millions of Canadian dollars) Automation BAE Systems Valmarine Schreiner SimuFlite Total
Current assets $ 5.6 $ 36.2 $ 16.3 $ 15.3 $ 23.0 $ 90.8Current liabilities (13.3) (65.8) (8.7) (37.0) (8.2) (119.7)Property, plant and equipment 0.1 59.0 0.5 167.9 262.0 489.4Intangible assets
Trade names – – 3.2 – 37.1 40.3Customer relations – – 9.8 66.0 29.2 105.0Customer contractual agreements – – 2.3 2.2 3.6 8.1Other intangibles 1.2 2.5 3.1 – 7.0 12.6
Goodwill 1.6 104.2 40.4 102.8 106.3 353.7Future income taxes 4.8 36.6 (3.9) (34.2) 15.1 13.6Long-term debt – (17.3) – (23.1) (52.4) (92.8)Long-term liabilities – (36.1) – – – (36.1)
– 119.3 63.0 259.9 422.7 864.9 Less: Sale and leaseback of assets – – – – (86.2) (86.2)
Shares issued (note 11) – – (21.1) – – (21.1)
Total cash consideration: $ – $ 119.3 $ 41.9 $ 259.9 $ 336.5 $ 757.6

38 CAE ANNUAL REPORT 2004NOTES TO CONSOLIDATED FINANCIAL STATEMENTS
The net assets of Schreiner, SimuFlite and approximately 10% of the net assets of BAE Systems are included inthe Civil Simulation and Training segment. The balance of the net assets of BAE Systems is included in the MilitarySimulation and Training segment. Net assets of Valmarine and HiTec are included in the Marine Controls segment.
The goodwill on the SimuFlite acquisition is the sole deductible goodwill for tax purposes.There were certain adjustments to the assets and liabilities recorded in fiscal 2003 for certain of the businesses
acquired. For Valmarine, the adjustment related to the final evaluation of other intangible assets. For Schreiner, theadjustment pertained to the accounting for simulators that were being built at the time the acquisition was com-pleted. For SimuFlite, the adjustment resulted from a purchase price arbitration settlement. HiTec Marine Automationwas adjusted in fiscal 2004, with the final evaluation of the tax liabilities and integration costs.
The adjustments to the purchase price equation are summarized as follows:
2004 2003
HiTec Marine(amounts in millions of Canadian dollars) Automation Valmarine AS Schreiner SimuFlite Total
Current assets $ – $ (0.1) $ – $ (2.7) $ (2.8)Current liabilities 0.7 – (0.1) (6.0) (6.1)Property, plant and equipment – – – 3.2 3.2Intangible assets – 7.3 – – 7.3Goodwill (0.7) (2.9) (11.6) 1.9 (12.6)Future income taxes – (4.3) (2.2) – (6.5)Long-term debt – – 13.9 (3.3) 10.6
Total cash consideration: $ – $ – $ – $ (6.9) $ (6.9)
NOTE 3 – DISCONTINUED OPERATIONS
CLEANING TECHNOLOGIES
On February 28, 2002, the Company completed the sale of two of CAE’s five Cleaning Technologies operations.The Company sold the shares of CAE Ransohoff Inc., (“Ransohoff”) of Cincinnati, Ohio and CAE Ultrasonics Inc., ofJamestown, New York to the management of these operations. The total consideration was initially US$21.4 million,comprising US$9.2 million cash and a holdback of US$1.6 million payable 120 days from closing with the balancein the form of long-term subordinated notes receivable. In fiscal 2003, the total consideration was reduced byUS$2.2 million based on an audit of the closing statement of financial position.
On June 28, 2002, CAE sold the shares of CAE Cleaning Technologies Plc to the management of Ransohoff for anote receivable of $1.2 million (£0.5 million).
On April 30, 2003, CAE completed the sale of certain assets of its German Cleaning Technologies operations fora cash consideration of €25,000, approximating book value. Subsequent to completing the sale, CAE incurred post-disposition costs with respect to the transfer of employees, resulting in a charge recorded in its results ofDiscontinued Operations of $2.6 million, net of income taxes – $1.7 million.
On July 31, 2003, CAE completed the sale of substantially all the assets of its last remaining Cleaning Technologybusiness, Alpheus Inc. to Cold Jet Inc. of Cincinnati, Ohio. The total consideration, after completion of the closing dateaudit of assets being sold was US$2.1 million. Of this amount, US$1.5 million has been received and the balance,US$0.6 million is due on the first anniversary from closing, July 31, 2004. In addition, the company is entitled to receivefurther consideration of US$1.0 million based on the future performance of the combined businesses over the 53-monthperiod from closing. No value has been ascribed in these financial statements to this additional consideration.
FORESTRY SYSTEMS
On March 28, 2002, CAE completed the sale of its fibre screening business to the Advanced Fiber Income Fund (AFT)for cash proceeds of $162.0 million. Following the closing of this transaction, certain additional costs were incurredover the amounts estimated when the transaction was completed. As a result, CAE recorded in its loss fromDiscontinued Operations in fiscal 2003, an additional after tax cost of $3.2 million (income taxes – $1.1 million) forthese adjustments.
On August 16, 2002, CAE sold substantially all the assets of the sawmill division of its Forestry Systems segmentfor cash consideration of $25.0 million and a further estimated payment at $10.0 million, included in other assets,based on the operating performance of the company in the three-year period following the closing date.
On May 2, 2003, CAE completed the sale of its remaining Forestry Systems business to Carmanah Design andManufacturing Inc. for a total cash consideration of $20.3 million. The Company is entitled to receive further consider-ation based on the performance of the business over the 30-month period following the closing. No value has beenascribed to this additional consideration in these financial statements.
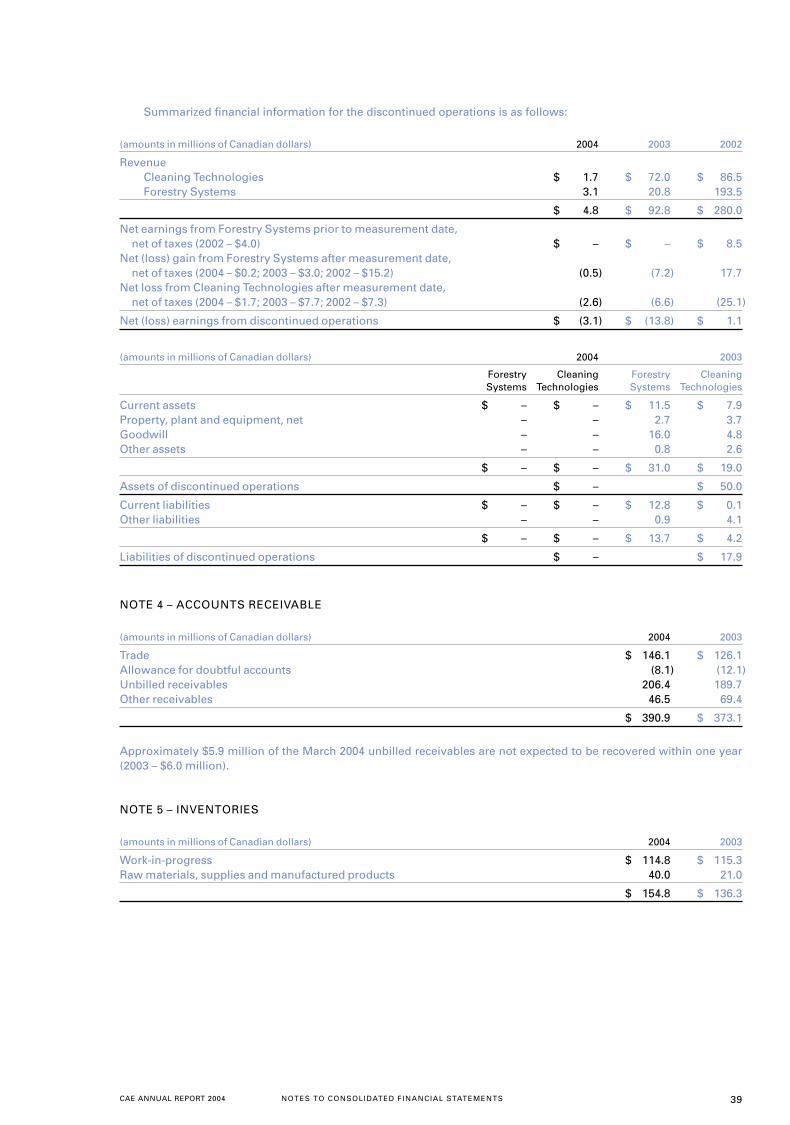
CAE ANNUAL REPORT 2004 NOTES TO CONSOLIDATED FINANCIAL STATEMENTS 39
Summarized financial information for the discontinued operations is as follows:
(amounts in millions of Canadian dollars) 2004 2003 2002
RevenueCleaning Technologies $ 1.7 $ 72.0 $ 86.5Forestry Systems 3.1 20.8 193.5
$ 4.8 $ 92.8 $ 280.0
Net earnings from Forestry Systems prior to measurement date, net of taxes (2002 – $4.0) $ – $ – $ 8.5
Net (loss) gain from Forestry Systems after measurement date, net of taxes (2004 – $0.2; 2003 – $3.0; 2002 – $15.2) (0.5) (7.2) 17.7
Net loss from Cleaning Technologies after measurement date, net of taxes (2004 – $1.7; 2003 – $7.7; 2002 – $7.3) (2.6) (6.6) (25.1)
Net (loss) earnings from discontinued operations $ (3.1) $ (13.8) $ 1.1
(amounts in millions of Canadian dollars) 2004 2003
Forestry Cleaning Forestry CleaningSystems Technologies Systems Technologies
Current assets $ – $ – $ 11.5 $ 7.9Property, plant and equipment, net – – 2.7 3.7Goodwill – – 16.0 4.8Other assets – – 0.8 2.6
$ – $ – $ 31.0 $ 19.0
Assets of discontinued operations $ – $ 50.0
Current liabilities $ – $ – $ 12.8 $ 0.1Other liabilities – – 0.9 4.1
$ – $ – $ 13.7 $ 4.2
Liabilities of discontinued operations $ – $ 17.9
NOTE 4 – ACCOUNTS RECEIVABLE
(amounts in millions of Canadian dollars) 2004 2003
Trade $ 146.1 $ 126.1Allowance for doubtful accounts (8.1) (12.1)Unbilled receivables 206.4 189.7Other receivables 46.5 69.4
$ 390.9 $ 373.1
Approximately $5.9 million of the March 2004 unbilled receivables are not expected to be recovered within one year(2003 – $6.0 million).
NOTE 5 – INVENTORIES
(amounts in millions of Canadian dollars) 2004 2003
Work-in-progress $ 114.8 $ 115.3Raw materials, supplies and manufactured products 40.0 21.0
$ 154.8 $ 136.3

40 CAE ANNUAL REPORT 2004NOTES TO CONSOLIDATED FINANCIAL STATEMENTS
NOTE 6 – PROPERTY, PLANT AND EQUIPMENT
(amounts in millions of Canadian dollars) 2004 2003
Accumulated Net Book Accumulated Net BookCost Amortization Value Cost Amortization Value
Land $ 19.7 $ – $ 19.7 $ 19.2 $ – $ 19.2Buildings and improvements 254.7 60.6 194.1 247.9 50.6 197.3Machinery and equipment 169.0 127.8 41.2 175.4 117.6 57.8Simulators 493.0 39.8 453.2 527.4 37.2 490.2Assets under construction
Buildings 4.6 – 4.6 2.1 – 2.1Equipment 130.2 – 130.2 163.8 – 163.8
$1,071.2 $ 228.2 $ 843.0 $1,135.8 $ 205.4 $ 930.4
Amortization of property, plant and equipment was $53.5 million in 2004 (2003 – $52.1 million, 2002 – $37.0 million).
NOTE 7 – INTANGIBLE ASSETS
(amounts in millions of Canadian dollars) 2004 2003
Accumulated Net Book Accumulated Net BookCost Amortization Value Cost Amortization Value
Trade names $ 34.6 $ 3.6 $ 31.0 $ 38.5 $ 2.3 $ 36.2Customer relations 108.5 11.0 97.5 111.3 6.8 104.5Customer contractual agreements 11.5 2.3 9.2 14.3 1.7 12.6Other intangible assets 21.7 4.2 17.5 20.8 2.4 18.4
$ 176.3 $ 21.1 $ 155.2 $ 184.9 $ 13.2 $ 171.7
The continuity of intangible assets is as follows:
(amounts in millions of Canadian dollars) 2004 2003
Civil Military Civil MilitarySimulation Simulation Marine Simulation Simulation Marine
and Training and Training Controls Total and Training and Training Controls Total
Beginningbalance $ 140.1 $ 2.1 $ 29.5 $ 171.7 $ 141.5 $ 2.5 $ 19.4 $ 163.4
Additions 0.6 – – 0.6 1.8 – 1.2 3.0Purchase
price adjustment(note 2) – – – – – – 7.3 7.3
Amortization (6.8) (0.1) (1.9) (8.8) (7.5) (0.2) (2.0) (9.7)Foreign
exchange (6.6) (0.2) (1.5) (8.3) 4.3 (0.2) 3.6 7.7
Endingbalance $ 127.3 $ 1.8 $ 26.1 $ 155.2 $ 140.1 $ 2.1 $ 29.5 $ 171.7
The yearly amortization expense for the five following years will be approximately $8.8 million.

CAE ANNUAL REPORT 2004 NOTES TO CONSOLIDATED FINANCIAL STATEMENTS 41
NOTE 8 – GOODWILL
The continuity of goodwill by reportable segment is as follows:
(amounts in millions of Canadian dollars) 2004 2003
Civil Military Civil MilitarySimulation Simulation Marine Simulation Simulation Marine
and Training and Training Controls Total and Training and Training Controls Total
Beginningbalance $ 212.9 $ 107.6 $ 46.3 $ 366.8 $ 217.8 $ 114.7 $ 43.0 $ 375.5
Additions – – – – – – 1.6 1.6Purchase
priceadjustment(note 2) – – (0.7) (0.7) (9.7) – (2.9) (12.6)
Foreign exchange (12.5) (7.4) (2.4) (22.3) 4.8 (7.1) 4.6 2.3
Endingbalance $ 200.4 $ 100.2 $ 43.2 $ 343.8 $ 212.9 $ 107.6 $ 46.3 $ 366.8
NOTE 9 – OTHER ASSETS
(amounts in millions of Canadian dollars) 2004 2003
Investment in and advances to CVS Leasing Ltd. (i) $ 49.1 $ 43.7Deferred development costs net of $5.6 million accumulated amortization
(2003 – $0.2 million) (ii) 41.3 37.6Deferred pre-operating costs net of $8.5 million accumulated amortization
(2003 – $4.4 million) 27.7 27.7Long-term receivables (iii) 18.4 15.1Deferred financing costs net of $5.7 million accumulated amortization
(2003 – $2.1 million) 11.7 12.7Other 20.2 28.4
$ 168.4 $ 165.2
(i) The Company led a consortium which was contracted by the UK Ministry of Defence (MoD) to design, construct,manage, finance and operate an integrated simulator-based aircrew training facility for the Medium SupportHelicopter fleet of the Royal Air Force. The contract covers a 40-year period, which can be terminated by the MoDafter 20 years, in 2018.
In connection with the contract, the Company has established a subsidiary, CAE Aircrew Training Plc(Aircrew), of which it owns 78% with the balance held by the other consortium partners. This subsidiary hasleased the land from the MoD, has built the facility and operates the training centre, and has been consolidatedwith the accounts of the Company.
In addition, the Company has a minority shareholding of 14% in, and has advanced funds to, CVS Leasing Ltd.(CVS), a company established to acquire the simulators and other equipment that are leased to Aircrew. CVSobtained project financing, which amounts to £65.0 million at March 31, 2004, and expires in October 2015. Thisfinancing is secured solely by the assets of CVS with no recourse to CAE.
(ii) Research and development expenditures aggregated $93.6 million during the year (2003 – $115.2 million, 2002 –$104.7 million) of which $12.7 million representing qualifying development costs pursuant to CICA requirements(2003 – $13.7 million, 2002 – $30.1 million) was deferred and amortized. The Company has received governmentassistance of $13.9 million related to research and development expenditures during the year (2003 – $32.5 mil-lion, 2002 – $15.8 million), of which $2.3 million (2003 – $2.3 million, 2002 – $9.5 million) was recorded againstdeferred costs incurred to develop new products and $1.8 million (2003 – nil, 2002 – nil) was recorded againstmachinery and equipment with the balance being accounted for as a reduction of research and developmentexpenses.
(iii) The Company has established secured subordinated promissory notes in connection with the sale of its variousCleaning Technologies businesses totalling $13.0 million. The notes bear interest at rates ranging from 3% to 7%.Principal repayments commence in fiscal 2005 and extend to fiscal 2011.

42 CAE ANNUAL REPORT 2004NOTES TO CONSOLIDATED FINANCIAL STATEMENTS
NOTE 10 – DEBT FACILITIES
A. LONG-TERM DEBT
(amounts in millions of Canadian dollars unless otherwise indicated) 2004 2003
(i) Senior notes $ 161.5 $ 178.7Revolving unsecured term credit facilities,(ii) 5 years maturing April 2006, US$350.0 and €100.0
(outstanding March 31, 2004 – $181.4, US$70.0 and €20.0, March 31, 2003 – $114.0 and US$195.0) 305.3 400.5
(iii) 18 months, matured June 2003, US$135.0 (outstanding March 31, 2004 – nil, March 31, 2003 – US$35.0) – 51.4
(iv) Term loan, maturing in April 2009 (outstanding March 31, 2004 – US$28.2, March 31, 2003 – US$32.5) 37.0 47.8
(v) Term loan of £12.7, secured, maturing in October 2015 (outstanding March 31, 2004 – £8.9, March 31, 2003 – £10.1) 21.4 23.5
(vi) Grapevine Industrial Development Corporation bonds, secured (US$27.0) 35.4 39.7(vii) Term loan of £31.8, secured, maturing September 2029
(outstanding March 31, 2004 – £21.8, March 31, 2003 – £17.5) 52.6 40.7(viii)Obligations under capital lease commitments 23.7 29.1
636.9 811.4Less: Long-term debt due within one year 13.5 13.4
$ 623.4 $ 798.0
(i) Pursuant to a private placement, the Company borrowed US$108.0 million and $20.0 million. These unsecuredsenior notes rank equally with term bank financings with fixed repayment amounts of $20.0 million in 2005,US$15.0 million in 2007, US$60.0 million in 2009 and US$33.0 million in 2012. Fixed interest is payable semi-annually in June and December at an average rate of 7.6% on the US amounts and 7.2% on the Canadian amount.The Company has entered into interest rate swap agreements converting the fixed interest rate into the equiva-lent of a three-month LIBOR borrowing plus 3.6% on US$33.0 million of the senior notes.
(ii) These facilities (US$350.0 million and €100.0 million) are unsecured and the interest rate payable is based onLIBOR, BAs or EURIBOR plus 0.6%. As at the end of both fiscal years, an amount of $35.0 million has been fixedthrough a swap agreement until April 2006 at a rate of 5.0%. The facility of €100.0 million was not used as ofMarch 31, 2003. The average interest rate at March 31, 2004 is 3.4% (2003 – 2.4%).
(iii) The revolving credit facility of US$200.0 million which expired in June 2003 was unsecured and the interest ratepayable was based on LIBOR plus 0.50%. This facility was repaid and cancelled in June 2003.
(iv) The Company arranged project financing for its training centre in Sao Paulo, Brazil. This term loan is supportedby a letter of credit for an amount equal to the outstanding obligations and is repayable semi-annually untilApril 30, 2009. This letter of credit replaces a pledge of the training assets (net book value of US$50.0 million) inplace at March 31, 2003. Interest on the loan is charged at a rate of approximately 7.7%.
(v) The Company arranged project financing for one of its subsidiaries to finance the Company’s Medium SupportHelicopter program for the MoD in the United Kingdom. The credit facility includes a term loan that is secured bythe project assets of the subsidiary and a bi-annual repayment is required until 2015. The facility also includes astandby loan of £4.0 million and a working capital loan of £1.0 million, both maturing in October 2015. Interest onthe loans is charged at a rate approximating LIBOR plus 1%. The Company has entered into interest rate swapstotalling $22.0 million (£9.1 million) fixing the interest rate at approximately 6.8%. The value of the assets pledgedas collateral for the credit facility as at March 31, 2004 is $66.3 million (£27.5 million) (2003 – $59.9 million or £25.8 million (note 9 (i)).
(vi) Airport Improvement Revenue Bonds were issued by the Grapevine Industrial Development Corporation,Grapevine, Texas for amounts of US$8.0 million and US$19.0 million and maturing respectively in 2010 and 2013.Real property improvements, fixtures and specified simulation equipment secure the bonds. The rates are setperiodically by the remarketing agent based on market conditions. For the bonds maturing in 2010, the rate is setweekly and yearly. For the bonds maturing in 2013, the rates are subject to a maximum rate of 10% permissibleunder current applicable laws. As at March 31, 2004, the combined rate for both series was approximately 1.15%.The security is limited to an amount not exceeding the outstanding balance of the loans which representsUS$27.0 million as at March 31, 2004. Also, a letter of credit has been issued to support the bonds for the out-standing amount of the loans.
(vii) The Company, in association with two other partners, arranged project financing for the delivery of training ser-vices on the Astute Class Submarine for the MoD in the United Kingdom. The Company’s participation is 50%.The secured loans consist of a loan of £31.8 million split into three sections, a term loan expiring September 2029,an Equity Bridge loan expiring September 2029 and a Ramp Up Facility expiring August 2004. Interest payableamounts are based on LIBOR plus 0.60% for the term loan and the Equity Bridge loan and LIBOR plus 1.75% forthe Ramp Up Facility. The loans are secured by fixed and floating charges over property and assets of the joint venture. The value, at CAE’s participation of 50%, of the assets pledged is $50.2 million (£20.8 million) as atMarch 31, 2004 (2003 – $39.9 million or £17.2 million).

CAE ANNUAL REPORT 2004 NOTES TO CONSOLIDATED FINANCIAL STATEMENTS 43
(viii)These capital leases are related to the leasing of various simulators in CAE’s subsidiaries. The cost associatedwith these simulators is $35.6 million (2003 – $41.1 million) and the accumulated amortization as at March 31,2004 is $23.8 million (2003 – $19.5 million) for a net book value of $11.8 million (2003 – $21.6 million). The effec-tive interest rate on obligations under capital leases which mature from June 2004 to March 2024 wasapproximately 5.0% (2003 – 5.1%).
(ix) Payments required in each of the next five fiscal years to meet the retirement provisions of the long-term debt areas follows:
(amounts in millions of Canadian dollars)
2005 $ 13.52006 31.42007 316.42008 32.02009 10.4Thereafter 233.2
$ 636.9
Details of interest on debt are as follows:
(amounts in millions of Canadian dollars) 2004 2003 2002
Long-term debt interest expense $ 32.8 $ 37.1 $ 30.3Short-term debt interest expense 0.5 0.2 1.9Other financing charges 3.1 3.1 1.4Allocation of interest expense to discontinued operations – (0.1) (3.6)Interest capitalized (6.4) (6.2) (3.9)
Interest on debt $ 30.0 $ 34.1 $ 26.1
Certain of the Company’s debt instruments include customary positive and negative covenants, including interestcoverage, leverage ratios, and restrictions on the sale of assets. At March 31, 2004, the Company is in compliancewith its debt covenants.
B. SHORT-TERM DEBT
The Company has unsecured bank lines of credit available in various currencies totalling $28.2 million, of which$6.4 million was used as at March 31, 2004. The effective rate on the short-term borrowings was 4.0% (2003 – 4.8%,2002 – 5.6%).
NOTE 11 – CAPITAL STOCK
(i) The Company’s articles of incorporation authorize the issuance of an unlimited number of preferred shares,issuable in series, and an unlimited number of common shares. To date, the Company has not issued any pre-ferred shares.
(ii) A reconciliation of the issued and outstanding common shares of the Company is as follows:
2004 2003 2002
Number Stated Number Stated Number Stated of Shares Value of Shares Value of Shares (c) Value
Balance at beginning of year 219,661,178 $ 190.5 218,955,780 $ 186.8 216,399,856 $ 159.4Stock options exercised 282,000 1.4 650,776 3.5 1,118,400 6.1Stock dividends (a) 106,002 0.6 54,622 0.2 17,605 0.2Shares issued (b) 26,600,000 175.0 – – 1,419,919 21.1
Balance at end of year 246,649,180 $ 367.5 219,661,178 $ 190.5 218,955,780 $ 186.8
(a) Until February 29, 2004, the Company’s Dividend Reinvestment Plan (DRIP) provided that eligible shareholders(which covered all shareholders living wherever the shares were distributed) could elect to receive commonstock dividends in lieu of cash dividends. As of March 1, 2004, eligibility has been limited to Canadian residentshareholders.
(b) On September 30, 2003, the Company issued 26,600,000 common shares at a price of $6.58 per share, for cashproceeds of $175.0 million.
(c) On June 20, 2001, the Board of Directors declared a 100% stock dividend in respect of the common shares in thecapital of the Company, effectively achieving a two-for-one split of CAE’s outstanding common shares. The stockdividend was payable to shareholders of record at the close of business on July 9, 2001, on the basis of one

44 CAE ANNUAL REPORT 2004NOTES TO CONSOLIDATED FINANCIAL STATEMENTS
additional share for each common share held as of the Record Date. CAE’s common shares commenced tradingon a split basis on July 5, 2001 on the Toronto Stock Exchange. The Company ascribed no monetary value to thestock dividend. The number of shares and options, the option exercise prices and the basic and diluted net earn-ings per share figures have been restated retroactively to reflect the stock dividend.
(d) The following is a reconciliation of the denominators for the basic and diluted earnings per share computations:
2004 2003 2002
Weighted average number of common shares outstanding – Basic 233,167,858 219,427,513 217,592,039Effect of dilutive stock options 849,912 897,806 2,544,722
Weighted average number of common shares outstanding – Diluted 234,017,770 220,325,319 220,136,761
Options to acquire 4,195,400 common shares (2003 – 3,198,000, 2002 – 1,474,628) have been excluded from the abovecalculation since their inclusion would have an anti-dilutive effect.
NOTE 12 – STOCK-BASED COMPENSATION PLANS
EMPLOYEE STOCK OPTION PLAN
Under the long-term incentive program of the Company, options may be granted to officers and other key employeesof the Company and its subsidiaries to purchase common shares of the Company at a subscription price of 100% ofmarket value. Market value is determined as the closing price of the common shares on the Toronto Stock Exchangeon the last day of trading prior to the effective date of the grant.
At March 31, 2004, a total of 11,530,046 common shares remained authorized for issuance under the Plan. Theoptions are exercisable during a period not to exceed six years and are not exercisable during the first 12 months afterthe date of the grant. The right to exercise all of the options accrues over a period of four years of continuous employ-ment. However, if there is a change of control of the Company, the options become immediately exercisable. Optionsare adjusted proportionately for any stock dividends or stock splits attributed to the common shares of the Company.
A reconciliation of the outstanding options is as follows:
For the years ended March 31 2004 2003 2002
Weighted Weighted WeightedAverage Average Average
Number Exercise Number Exercise Number Exerciseof Options Price of Options Price of Options Price
Options outstanding at beginning of year 5,692,750 $ 9.37 4,999,078 $ 7.70 5,114,350 $ 5.70
Granted 3,536,320 $ 4.14 1,767,000 $ 12.71 1,698,012 $ 12.19Exercised (282,000) $ 4.88 (650,776) $ 5.62 (1,118,400) $ 5.41Forfeited (718,400) $ 6.98 (325,400) $ 9.38 (692,884) $ 7.71Expired (100,300) $ 5.70 (97,152) $ 9.10 (2,000) $ 12.23
Options outstanding at end of year 8,128,370 $ 7.51 5,692,750 $ 9.37 4,999,078 $ 7.70
Options exercisable at end of year 2,887,000 $ 8.07 2,000,975 $ 6.78 1,417,878 $ 5.70
The following table summarizes information about the Company’s Employee Stock Option Plan as at March 31, 2004:
Options Outstanding Options Exercisable
WeightedAverage Weighted Weighted
Remaining Average AverageRange of Number Contractual Exercise Number ExerciseExercise Prices Outstanding Life (years) Price Exercisable Price
$4.08 to $5.07 3,932,970 4.39 $ 4.14 793,250 $ 4.18$6.03 to $9.20 1,379,650 1.79 $ 6.85 1,081,500 $ 6.82 $12.25 to $14.60 2,815,750 3.73 $ 12.53 1,012,250 $ 12.45
Total 8,128,370 3.72 $ 7.51 2,887,000 $ 8.07
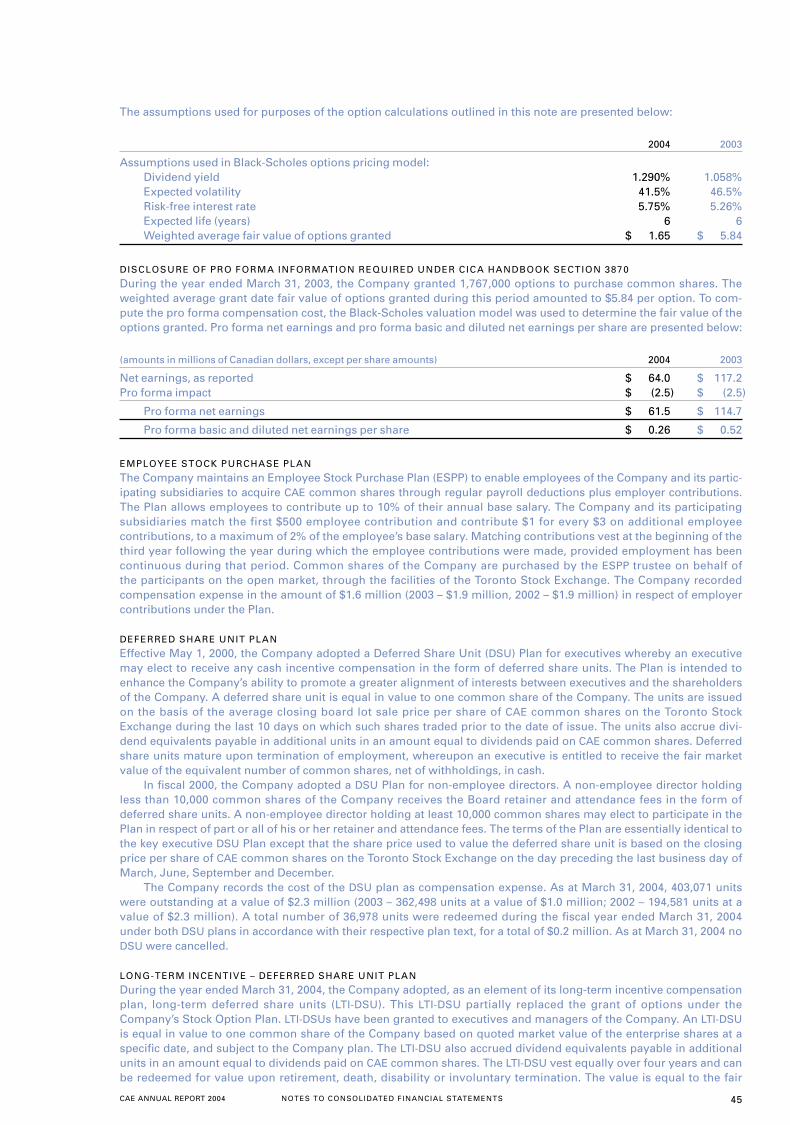
CAE ANNUAL REPORT 2004 NOTES TO CONSOLIDATED FINANCIAL STATEMENTS 45
The assumptions used for purposes of the option calculations outlined in this note are presented below:
2004 2003
Assumptions used in Black-Scholes options pricing model:Dividend yield 1.290% 1.058%Expected volatility 41.5% 46.5%Risk-free interest rate 5.75% 5.26%Expected life (years) 6 6Weighted average fair value of options granted $ 1.65 $ 5.84
DISCLOSURE OF PRO FORMA INFORMATION REQUIRED UNDER CICA HANDBOOK SECTION 3870
During the year ended March 31, 2003, the Company granted 1,767,000 options to purchase common shares. Theweighted average grant date fair value of options granted during this period amounted to $5.84 per option. To com-pute the pro forma compensation cost, the Black-Scholes valuation model was used to determine the fair value of theoptions granted. Pro forma net earnings and pro forma basic and diluted net earnings per share are presented below:
(amounts in millions of Canadian dollars, except per share amounts) 2004 2003
Net earnings, as reported $ 64.0 $ 117.2Pro forma impact $ (2.5) $ (2.5)
Pro forma net earnings $ 61.5 $ 114.7
Pro forma basic and diluted net earnings per share $ 0.26 $ 0.52
EMPLOYEE STOCK PURCHASE PLAN
The Company maintains an Employee Stock Purchase Plan (ESPP) to enable employees of the Company and its partic-ipating subsidiaries to acquire CAE common shares through regular payroll deductions plus employer contributions.The Plan allows employees to contribute up to 10% of their annual base salary. The Company and its participatingsubsidiaries match the first $500 employee contribution and contribute $1 for every $3 on additional employeecontributions, to a maximum of 2% of the employee’s base salary. Matching contributions vest at the beginning of thethird year following the year during which the employee contributions were made, provided employment has beencontinuous during that period. Common shares of the Company are purchased by the ESPP trustee on behalf ofthe participants on the open market, through the facilities of the Toronto Stock Exchange. The Company recordedcompensation expense in the amount of $1.6 million (2003 – $1.9 million, 2002 – $1.9 million) in respect of employercontributions under the Plan.
DEFERRED SHARE UNIT PLAN
Effective May 1, 2000, the Company adopted a Deferred Share Unit (DSU) Plan for executives whereby an executivemay elect to receive any cash incentive compensation in the form of deferred share units. The Plan is intended toenhance the Company’s ability to promote a greater alignment of interests between executives and the shareholdersof the Company. A deferred share unit is equal in value to one common share of the Company. The units are issuedon the basis of the average closing board lot sale price per share of CAE common shares on the Toronto StockExchange during the last 10 days on which such shares traded prior to the date of issue. The units also accrue divi-dend equivalents payable in additional units in an amount equal to dividends paid on CAE common shares. Deferredshare units mature upon termination of employment, whereupon an executive is entitled to receive the fair marketvalue of the equivalent number of common shares, net of withholdings, in cash.
In fiscal 2000, the Company adopted a DSU Plan for non-employee directors. A non-employee director holdingless than 10,000 common shares of the Company receives the Board retainer and attendance fees in the form ofdeferred share units. A non-employee director holding at least 10,000 common shares may elect to participate in thePlan in respect of part or all of his or her retainer and attendance fees. The terms of the Plan are essentially identical tothe key executive DSU Plan except that the share price used to value the deferred share unit is based on the closingprice per share of CAE common shares on the Toronto Stock Exchange on the day preceding the last business day ofMarch, June, September and December.
The Company records the cost of the DSU plan as compensation expense. As at March 31, 2004, 403,071 unitswere outstanding at a value of $2.3 million (2003 – 362,498 units at a value of $1.0 million; 2002 – 194,581 units at avalue of $2.3 million). A total number of 36,978 units were redeemed during the fiscal year ended March 31, 2004under both DSU plans in accordance with their respective plan text, for a total of $0.2 million. As at March 31, 2004 noDSU were cancelled.
LONG-TERM INCENTIVE – DEFERRED SHARE UNIT PLAN
During the year ended March 31, 2004, the Company adopted, as an element of its long-term incentive compensationplan, long-term deferred share units (LTI-DSU). This LTI-DSU partially replaced the grant of options under theCompany’s Stock Option Plan. LTI-DSUs have been granted to executives and managers of the Company. An LTI-DSUis equal in value to one common share of the Company based on quoted market value of the enterprise shares at aspecific date, and subject to the Company plan. The LTI-DSU also accrued dividend equivalents payable in additionalunits in an amount equal to dividends paid on CAE common shares. The LTI-DSU vest equally over four years and canbe redeemed for value upon retirement, death, disability or involuntary termination. The value is equal to the fair
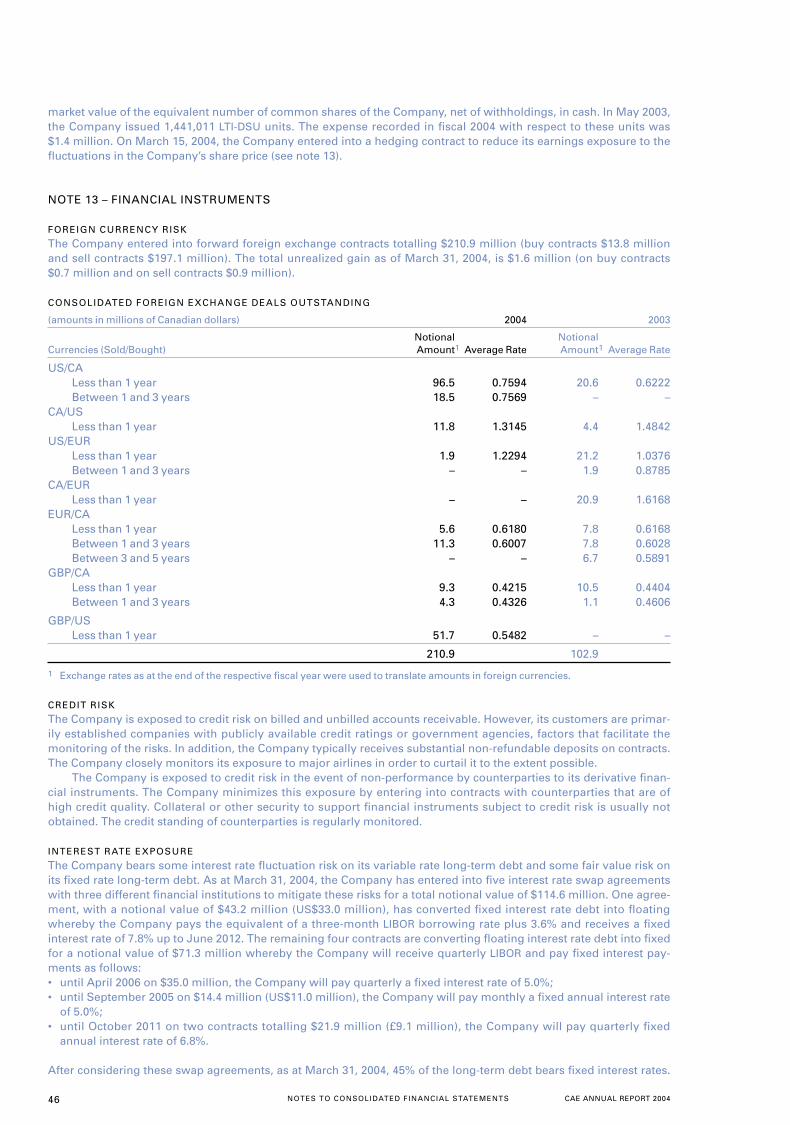
46 CAE ANNUAL REPORT 2004NOTES TO CONSOLIDATED FINANCIAL STATEMENTS
market value of the equivalent number of common shares of the Company, net of withholdings, in cash. In May 2003,the Company issued 1,441,011 LTI-DSU units. The expense recorded in fiscal 2004 with respect to these units was$1.4 million. On March 15, 2004, the Company entered into a hedging contract to reduce its earnings exposure to thefluctuations in the Company’s share price (see note 13).
NOTE 13 – FINANCIAL INSTRUMENTS
FOREIGN CURRENCY RISK
The Company entered into forward foreign exchange contracts totalling $210.9 million (buy contracts $13.8 millionand sell contracts $197.1 million). The total unrealized gain as of March 31, 2004, is $1.6 million (on buy contracts$0.7 million and on sell contracts $0.9 million).
CONSOLIDATED FOREIGN EXCHANGE DEALS OUTSTANDING
(amounts in millions of Canadian dollars) 2004 2003
Notional NotionalCurrencies (Sold/Bought) Amount1 Average Rate Amount1 Average Rate
US/CALess than 1 year 96.5 0.7594 20.6 0.6222Between 1 and 3 years 18.5 0.7569 – –
CA/USLess than 1 year 11.8 1.3145 4.4 1.4842
US/EURLess than 1 year 1.9 1.2294 21.2 1.0376Between 1 and 3 years – – 1.9 0.8785
CA/EURLess than 1 year – – 20.9 1.6168
EUR/CALess than 1 year 5.6 0.6180 7.8 0.6168Between 1 and 3 years 11.3 0.6007 7.8 0.6028Between 3 and 5 years – – 6.7 0.5891
GBP/CALess than 1 year 9.3 0.4215 10.5 0.4404Between 1 and 3 years 4.3 0.4326 1.1 0.4606
GBP/USLess than 1 year 51.7 0.5482 – –
210.9 102.9
1 Exchange rates as at the end of the respective fiscal year were used to translate amounts in foreign currencies.
CREDIT RISK
The Company is exposed to credit risk on billed and unbilled accounts receivable. However, its customers are primar-ily established companies with publicly available credit ratings or government agencies, factors that facilitate themonitoring of the risks. In addition, the Company typically receives substantial non-refundable deposits on contracts.The Company closely monitors its exposure to major airlines in order to curtail it to the extent possible.
The Company is exposed to credit risk in the event of non-performance by counterparties to its derivative finan-cial instruments. The Company minimizes this exposure by entering into contracts with counterparties that are ofhigh credit quality. Collateral or other security to support financial instruments subject to credit risk is usually notobtained. The credit standing of counterparties is regularly monitored.
INTEREST RATE EXPOSURE
The Company bears some interest rate fluctuation risk on its variable rate long-term debt and some fair value risk onits fixed rate long-term debt. As at March 31, 2004, the Company has entered into five interest rate swap agreementswith three different financial institutions to mitigate these risks for a total notional value of $114.6 million. One agree-ment, with a notional value of $43.2 million (US$33.0 million), has converted fixed interest rate debt into floatingwhereby the Company pays the equivalent of a three-month LIBOR borrowing rate plus 3.6% and receives a fixedinterest rate of 7.8% up to June 2012. The remaining four contracts are converting floating interest rate debt into fixedfor a notional value of $71.3 million whereby the Company will receive quarterly LIBOR and pay fixed interest pay-ments as follows:• until April 2006 on $35.0 million, the Company will pay quarterly a fixed interest rate of 5.0%;• until September 2005 on $14.4 million (US$11.0 million), the Company will pay monthly a fixed annual interest rate
of 5.0%;• until October 2011 on two contracts totalling $21.9 million (£9.1 million), the Company will pay quarterly fixed
annual interest rate of 6.8%.
After considering these swap agreements, as at March 31, 2004, 45% of the long-term debt bears fixed interest rates.
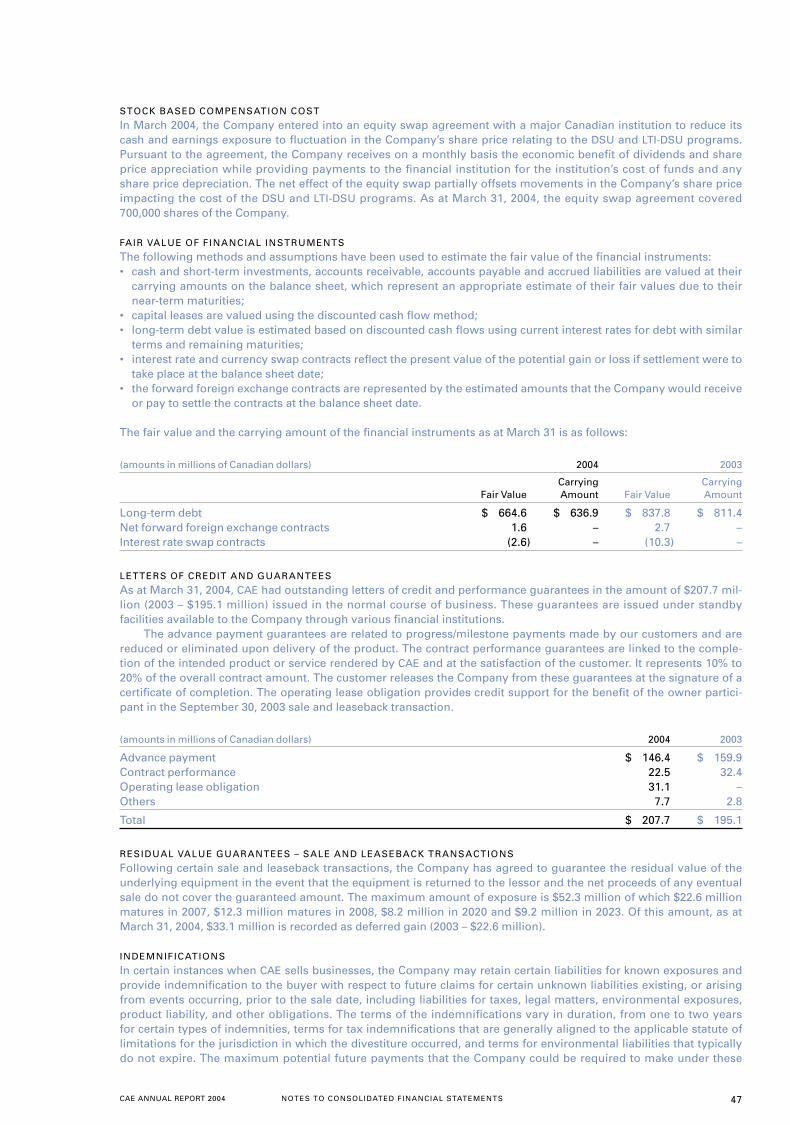
CAE ANNUAL REPORT 2004 NOTES TO CONSOLIDATED FINANCIAL STATEMENTS 47
STOCK BASED COMPENSATION COST
In March 2004, the Company entered into an equity swap agreement with a major Canadian institution to reduce itscash and earnings exposure to fluctuation in the Company’s share price relating to the DSU and LTI-DSU programs.Pursuant to the agreement, the Company receives on a monthly basis the economic benefit of dividends and shareprice appreciation while providing payments to the financial institution for the institution’s cost of funds and anyshare price depreciation. The net effect of the equity swap partially offsets movements in the Company’s share priceimpacting the cost of the DSU and LTI-DSU programs. As at March 31, 2004, the equity swap agreement covered700,000 shares of the Company.
FAIR VALUE OF FINANCIAL INSTRUMENTS
The following methods and assumptions have been used to estimate the fair value of the financial instruments:• cash and short-term investments, accounts receivable, accounts payable and accrued liabilities are valued at their
carrying amounts on the balance sheet, which represent an appropriate estimate of their fair values due to theirnear-term maturities;
• capital leases are valued using the discounted cash flow method;• long-term debt value is estimated based on discounted cash flows using current interest rates for debt with similar
terms and remaining maturities;• interest rate and currency swap contracts reflect the present value of the potential gain or loss if settlement were to
take place at the balance sheet date;• the forward foreign exchange contracts are represented by the estimated amounts that the Company would receive
or pay to settle the contracts at the balance sheet date.
The fair value and the carrying amount of the financial instruments as at March 31 is as follows:
(amounts in millions of Canadian dollars) 2004 2003
Carrying CarryingFair Value Amount Fair Value Amount
Long-term debt $ 664.6 $ 636.9 $ 837.8 $ 811.4Net forward foreign exchange contracts 1.6 – 2.7 –Interest rate swap contracts (2.6) – (10.3) –
LETTERS OF CREDIT AND GUARANTEES
As at March 31, 2004, CAE had outstanding letters of credit and performance guarantees in the amount of $207.7 mil-lion (2003 – $195.1 million) issued in the normal course of business. These guarantees are issued under standbyfacilities available to the Company through various financial institutions.
The advance payment guarantees are related to progress/milestone payments made by our customers and arereduced or eliminated upon delivery of the product. The contract performance guarantees are linked to the comple-tion of the intended product or service rendered by CAE and at the satisfaction of the customer. It represents 10% to20% of the overall contract amount. The customer releases the Company from these guarantees at the signature of acertificate of completion. The operating lease obligation provides credit support for the benefit of the owner partici-pant in the September 30, 2003 sale and leaseback transaction.
(amounts in millions of Canadian dollars) 2004 2003
Advance payment $ 146.4 $ 159.9Contract performance 22.5 32.4Operating lease obligation 31.1 –Others 7.7 2.8
Total $ 207.7 $ 195.1
RESIDUAL VALUE GUARANTEES – SALE AND LEASEBACK TRANSACTIONS
Following certain sale and leaseback transactions, the Company has agreed to guarantee the residual value of theunderlying equipment in the event that the equipment is returned to the lessor and the net proceeds of any eventualsale do not cover the guaranteed amount. The maximum amount of exposure is $52.3 million of which $22.6 millionmatures in 2007, $12.3 million matures in 2008, $8.2 million in 2020 and $9.2 million in 2023. Of this amount, as atMarch 31, 2004, $33.1 million is recorded as deferred gain (2003 – $22.6 million).
INDEMNIFICATIONS
In certain instances when CAE sells businesses, the Company may retain certain liabilities for known exposures andprovide indemnification to the buyer with respect to future claims for certain unknown liabilities existing, or arisingfrom events occurring, prior to the sale date, including liabilities for taxes, legal matters, environmental exposures,product liability, and other obligations. The terms of the indemnifications vary in duration, from one to two yearsfor certain types of indemnities, terms for tax indemnifications that are generally aligned to the applicable statute oflimitations for the jurisdiction in which the divestiture occurred, and terms for environmental liabilities that typicallydo not expire. The maximum potential future payments that the Company could be required to make under these
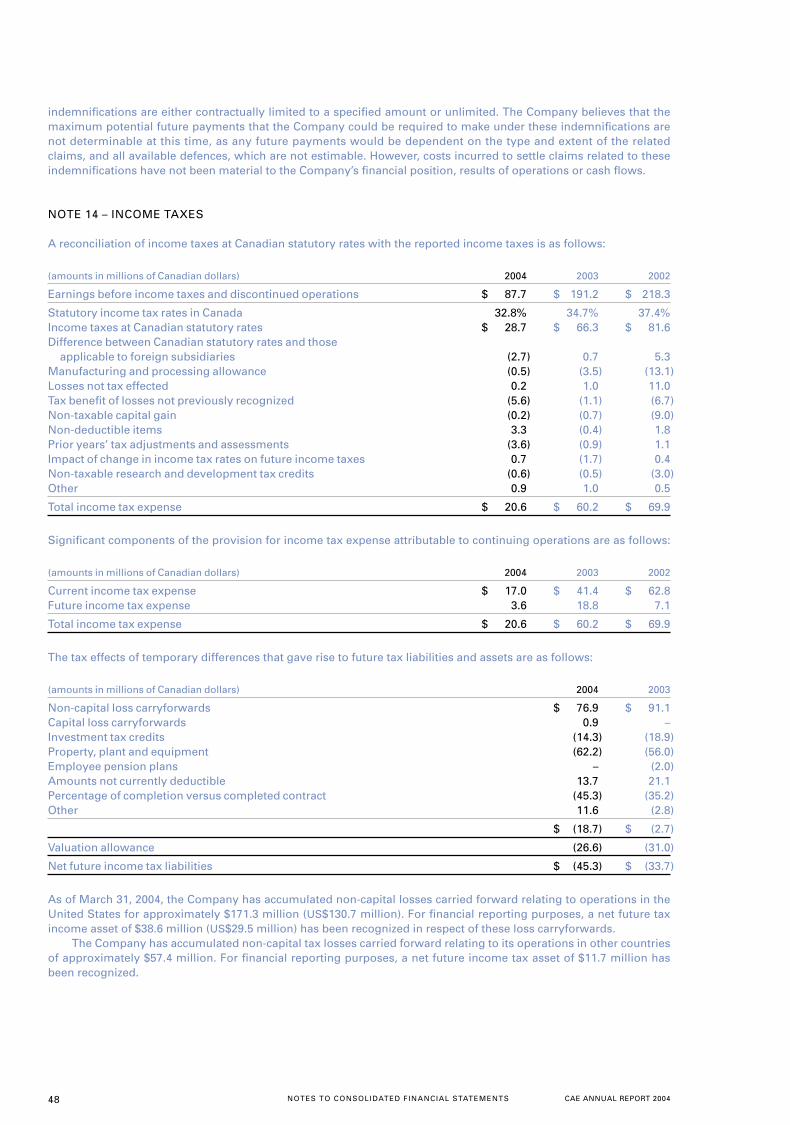
48 CAE ANNUAL REPORT 2004NOTES TO CONSOLIDATED FINANCIAL STATEMENTS
indemnifications are either contractually limited to a specified amount or unlimited. The Company believes that themaximum potential future payments that the Company could be required to make under these indemnifications arenot determinable at this time, as any future payments would be dependent on the type and extent of the relatedclaims, and all available defences, which are not estimable. However, costs incurred to settle claims related to theseindemnifications have not been material to the Company’s financial position, results of operations or cash flows.
NOTE 14 – INCOME TAXES
A reconciliation of income taxes at Canadian statutory rates with the reported income taxes is as follows:
(amounts in millions of Canadian dollars) 2004 2003 2002
Earnings before income taxes and discontinued operations $ 87.7 $ 191.2 $ 218.3
Statutory income tax rates in Canada 32.8% 34.7% 37.4%Income taxes at Canadian statutory rates $ 28.7 $ 66.3 $ 81.6Difference between Canadian statutory rates and those
applicable to foreign subsidiaries (2.7) 0.7 5.3Manufacturing and processing allowance (0.5) (3.5) (13.1)Losses not tax effected 0.2 1.0 11.0Tax benefit of losses not previously recognized (5.6) (1.1) (6.7)Non-taxable capital gain (0.2) (0.7) (9.0)Non-deductible items 3.3 (0.4) 1.8Prior years’ tax adjustments and assessments (3.6) (0.9) 1.1Impact of change in income tax rates on future income taxes 0.7 (1.7) 0.4Non-taxable research and development tax credits (0.6) (0.5) (3.0)Other 0.9 1.0 0.5
Total income tax expense $ 20.6 $ 60.2 $ 69.9
Significant components of the provision for income tax expense attributable to continuing operations are as follows:
(amounts in millions of Canadian dollars) 2004 2003 2002
Current income tax expense $ 17.0 $ 41.4 $ 62.8Future income tax expense 3.6 18.8 7.1
Total income tax expense $ 20.6 $ 60.2 $ 69.9
The tax effects of temporary differences that gave rise to future tax liabilities and assets are as follows:
(amounts in millions of Canadian dollars) 2004 2003
Non-capital loss carryforwards $ 76.9 $ 91.1Capital loss carryforwards 0.9 –Investment tax credits (14.3) (18.9) Property, plant and equipment (62.2) (56.0) Employee pension plans – (2.0) Amounts not currently deductible 13.7 21.1Percentage of completion versus completed contract (45.3) (35.2) Other 11.6 (2.8)
$ (18.7) $ (2.7)
Valuation allowance (26.6) (31.0)
Net future income tax liabilities $ (45.3) $ (33.7)
As of March 31, 2004, the Company has accumulated non-capital losses carried forward relating to operations in theUnited States for approximately $171.3 million (US$130.7 million). For financial reporting purposes, a net future taxincome asset of $38.6 million (US$29.5 million) has been recognized in respect of these loss carryforwards.
The Company has accumulated non-capital tax losses carried forward relating to its operations in other countriesof approximately $57.4 million. For financial reporting purposes, a net future income tax asset of $11.7 million hasbeen recognized.
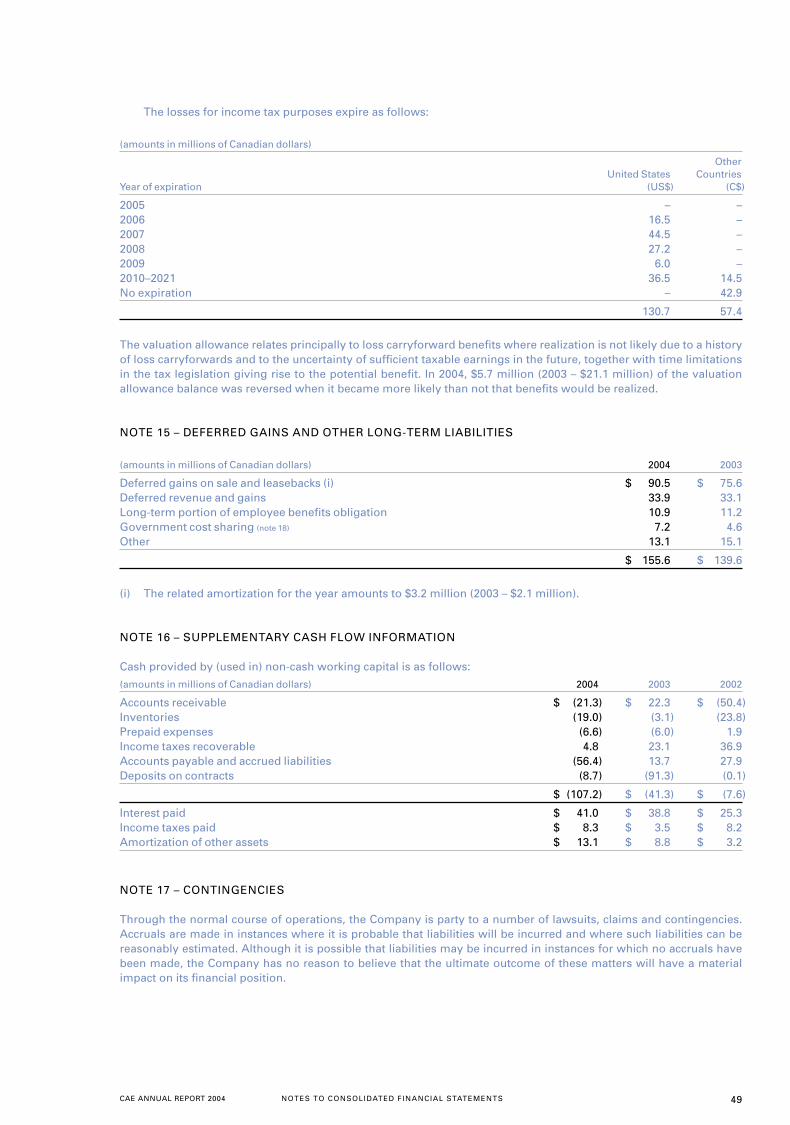
CAE ANNUAL REPORT 2004 NOTES TO CONSOLIDATED FINANCIAL STATEMENTS 49
The losses for income tax purposes expire as follows:
(amounts in millions of Canadian dollars)
Other United States Countries
Year of expiration (US$) (C$)
2005 – –2006 16.5 –2007 44.5 –2008 27.2 –2009 6.0 –2010–2021 36.5 14.5No expiration – 42.9
130.7 57.4
The valuation allowance relates principally to loss carryforward benefits where realization is not likely due to a historyof loss carryforwards and to the uncertainty of sufficient taxable earnings in the future, together with time limitationsin the tax legislation giving rise to the potential benefit. In 2004, $5.7 million (2003 – $21.1 million) of the valuationallowance balance was reversed when it became more likely than not that benefits would be realized.
NOTE 15 – DEFERRED GAINS AND OTHER LONG-TERM LIABILITIES
(amounts in millions of Canadian dollars) 2004 2003
Deferred gains on sale and leasebacks (i) $ 90.5 $ 75.6Deferred revenue and gains 33.9 33.1Long-term portion of employee benefits obligation 10.9 11.2Government cost sharing (note 18) 7.2 4.6Other 13.1 15.1
$ 155.6 $ 139.6
(i) The related amortization for the year amounts to $3.2 million (2003 – $2.1 million).
NOTE 16 – SUPPLEMENTARY CASH FLOW INFORMATION
Cash provided by (used in) non-cash working capital is as follows:
(amounts in millions of Canadian dollars) 2004 2003 2002
Accounts receivable $ (21.3) $ 22.3 $ (50.4)Inventories (19.0) (3.1) (23.8)Prepaid expenses (6.6) (6.0) 1.9Income taxes recoverable 4.8 23.1 36.9Accounts payable and accrued liabilities (56.4) 13.7 27.9Deposits on contracts (8.7) (91.3) (0.1)
$ (107.2) $ (41.3) $ (7.6)
Interest paid $ 41.0 $ 38.8 $ 25.3Income taxes paid $ 8.3 $ 3.5 $ 8.2Amortization of other assets $ 13.1 $ 8.8 $ 3.2
NOTE 17 – CONTINGENCIES
Through the normal course of operations, the Company is party to a number of lawsuits, claims and contingencies.Accruals are made in instances where it is probable that liabilities will be incurred and where such liabilities can bereasonably estimated. Although it is possible that liabilities may be incurred in instances for which no accruals havebeen made, the Company has no reason to believe that the ultimate outcome of these matters will have a materialimpact on its financial position.

50 CAE ANNUAL REPORT 2004NOTES TO CONSOLIDATED FINANCIAL STATEMENTS
NOTE 18 – GOVERNMENT COST SHARING
The Company has signed agreements with the Government of Canada whereby the latter shares in the cost, based onexpenditures incurred by the Company, of certain research and development programs for visual systems andadvanced flight simulation technology for civil applications and networked simulation for military applications.Funding in the amount of $31.2 million related to the visual research and development programs was completed in2001. Royalty payments for this program are estimated at $0.4 million in fiscal 2004 (2003 – $1.6 million). In fiscal 2002,funding of $41.4 million was approved for advanced civil flight simulation. In fiscal 2003, funding of $39.0 million wasalso approved to develop a military network simulation. The Company provided for $10.2 million of future repay-ments on these two programs in fiscal 2004. Funding for these programs is based on expenditures incurred by theCompany. The amount of funding received in fiscal 2004 was $5.4 million (2003 – $20.2 million, 2002 – $15.8 million)and is now complete for the civil program and $8.5 million (2003 – $12.3 million, 2002 – nil) for the military program.
These programs are repayable in the form of royalties to March 2013 based on future sales. The maximumamount of royalties payable under the visual program is $41.4 million. The maximum payment under the civil or mili-tary simulation programs, based on future sales, is $66.0 million and $53.6 million respectively.
NOTE 19 – OPERATING LEASE COMMITMENTS
Future minimum lease payments under operating leases are as follows:
Civil Military Simulation Simulation Marine
(amounts in millions of Canadian dollars) and Training and Training Controls Total
Years ending March 31,2005 $ 53.0 $ 37.8 $ 1.4 $ 92.22006 50.6 32.9 1.1 84.62007 65.2 24.1 0.2 89.52008 52.7 23.6 0.1 76.42009 35.5 22.8 0.1 58.4Thereafter 313.5 100.1 0.1 413.7
$ 570.5 $ 241.3 $ 3.0 $ 814.8
NOTE 20 – PENSIONS
The Company has two registered defined benefit plans in Canada (one for employees and one for designated execu-tives) that provide benefits based on length of service and final average earnings. In addition, the Company maintainsa supplemental arrangement to provide defined benefits for designated executives. This supplemental arrangementis solely the obligation of the Company and there is no requirement to fund it. The Company, however, is obligated topay the benefits when they become due. Once the designated executive retires from the Company, the Company isrequired to secure the obligation for that executive. As at March 31, 2004, the Company has issued letters of credittotalling $11.9 million to secure the obligations under the Supplementary Plan.
Contributions reflect actuarial assumptions concerning future investment returns, salary projections and futureservice benefits. Plan assets are represented primarily by Canadian and foreign equities and government and corpo-rate bonds.
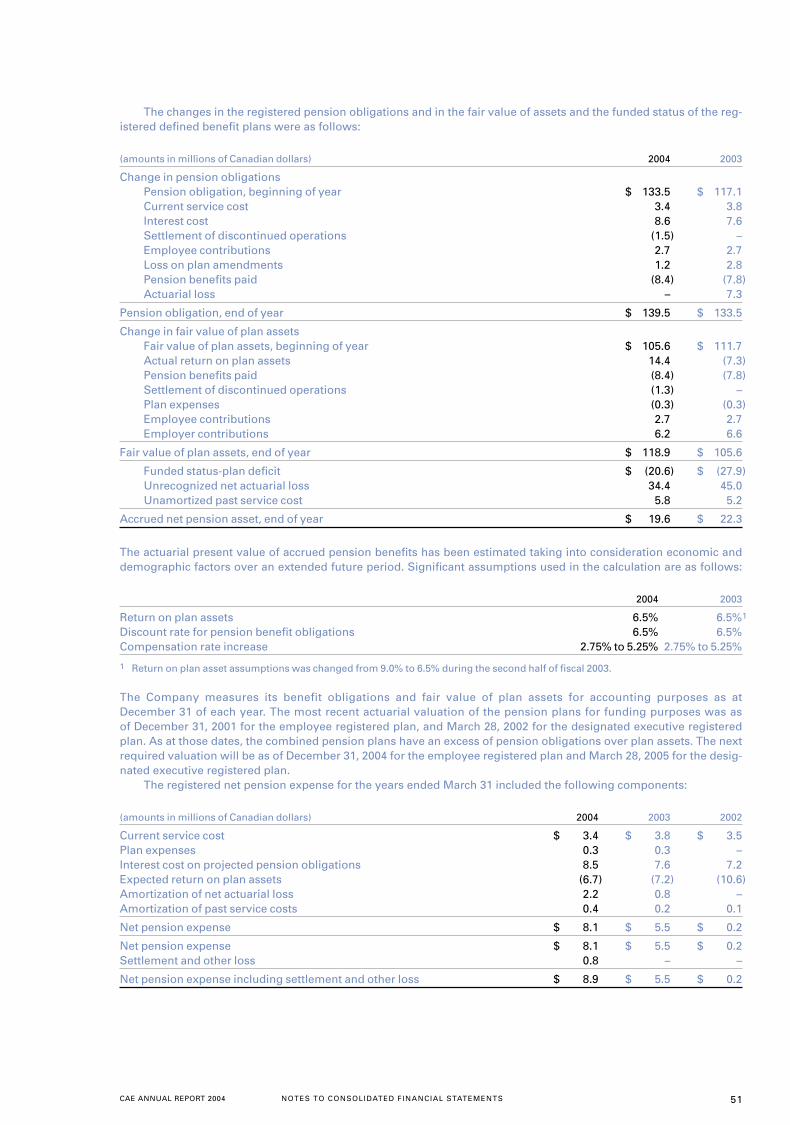
CAE ANNUAL REPORT 2004 NOTES TO CONSOLIDATED FINANCIAL STATEMENTS 51
The changes in the registered pension obligations and in the fair value of assets and the funded status of the reg-istered defined benefit plans were as follows:
(amounts in millions of Canadian dollars) 2004 2003
Change in pension obligationsPension obligation, beginning of year $ 133.5 $ 117.1Current service cost 3.4 3.8Interest cost 8.6 7.6Settlement of discontinued operations (1.5) –Employee contributions 2.7 2.7Loss on plan amendments 1.2 2.8Pension benefits paid (8.4) (7.8)Actuarial loss – 7.3
Pension obligation, end of year $ 139.5 $ 133.5
Change in fair value of plan assetsFair value of plan assets, beginning of year $ 105.6 $ 111.7Actual return on plan assets 14.4 (7.3)Pension benefits paid (8.4) (7.8)Settlement of discontinued operations (1.3) –Plan expenses (0.3) (0.3)Employee contributions 2.7 2.7Employer contributions 6.2 6.6
Fair value of plan assets, end of year $ 118.9 $ 105.6
Funded status-plan deficit $ (20.6) $ (27.9)Unrecognized net actuarial loss 34.4 45.0Unamortized past service cost 5.8 5.2
Accrued net pension asset, end of year $ 19.6 $ 22.3
The actuarial present value of accrued pension benefits has been estimated taking into consideration economic anddemographic factors over an extended future period. Significant assumptions used in the calculation are as follows:
2004 2003
Return on plan assets 6.5% 6.5%1
Discount rate for pension benefit obligations 6.5% 6.5%Compensation rate increase 2.75% to 5.25% 2.75% to 5.25%
1 Return on plan asset assumptions was changed from 9.0% to 6.5% during the second half of fiscal 2003.
The Company measures its benefit obligations and fair value of plan assets for accounting purposes as atDecember 31 of each year. The most recent actuarial valuation of the pension plans for funding purposes was asof December 31, 2001 for the employee registered plan, and March 28, 2002 for the designated executive registeredplan. As at those dates, the combined pension plans have an excess of pension obligations over plan assets. The nextrequired valuation will be as of December 31, 2004 for the employee registered plan and March 28, 2005 for the desig-nated executive registered plan.
The registered net pension expense for the years ended March 31 included the following components:
(amounts in millions of Canadian dollars) 2004 2003 2002
Current service cost $ 3.4 $ 3.8 $ 3.5Plan expenses 0.3 0.3 –Interest cost on projected pension obligations 8.5 7.6 7.2Expected return on plan assets (6.7) (7.2) (10.6)Amortization of net actuarial loss 2.2 0.8 –Amortization of past service costs 0.4 0.2 0.1
Net pension expense $ 8.1 $ 5.5 $ 0.2
Net pension expense $ 8.1 $ 5.5 $ 0.2Settlement and other loss 0.8 – –
Net pension expense including settlement and other loss $ 8.9 $ 5.5 $ 0.2
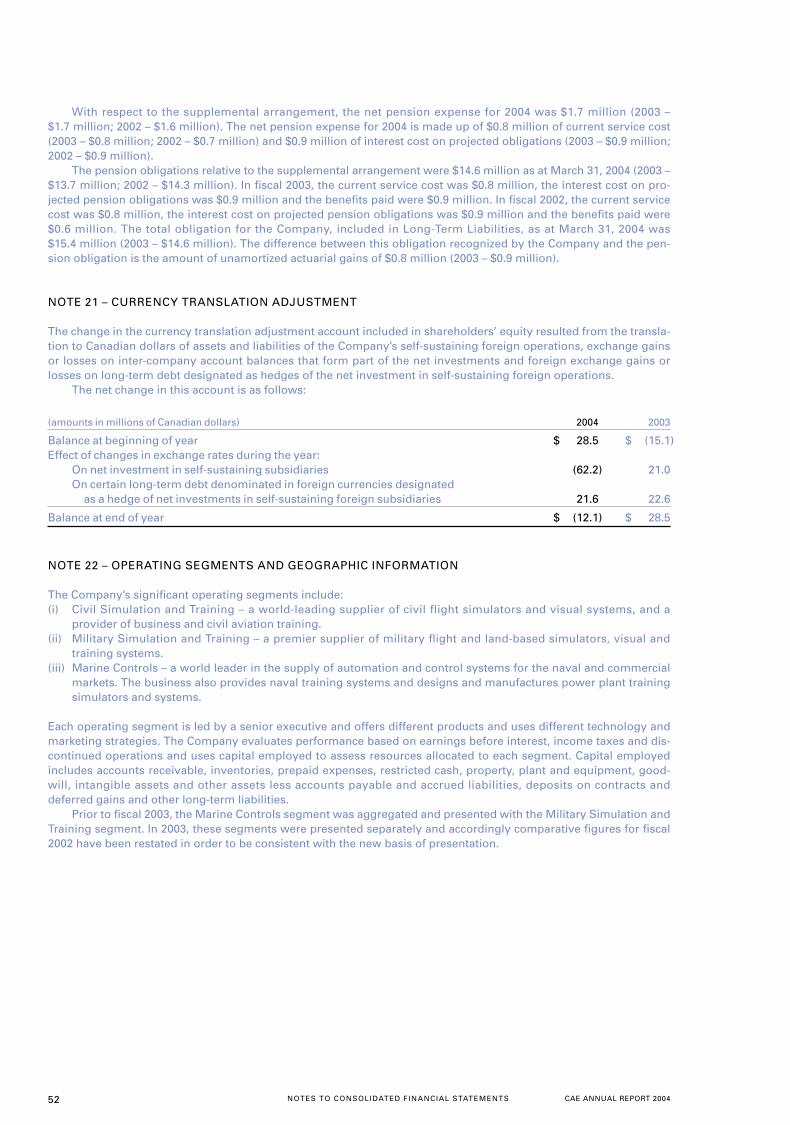
52 CAE ANNUAL REPORT 2004NOTES TO CONSOLIDATED FINANCIAL STATEMENTS
With respect to the supplemental arrangement, the net pension expense for 2004 was $1.7 million (2003 –$1.7 million; 2002 – $1.6 million). The net pension expense for 2004 is made up of $0.8 million of current service cost(2003 – $0.8 million; 2002 – $0.7 million) and $0.9 million of interest cost on projected obligations (2003 – $0.9 million;2002 – $0.9 million).
The pension obligations relative to the supplemental arrangement were $14.6 million as at March 31, 2004 (2003 –$13.7 million; 2002 – $14.3 million). In fiscal 2003, the current service cost was $0.8 million, the interest cost on pro-jected pension obligations was $0.9 million and the benefits paid were $0.9 million. In fiscal 2002, the current servicecost was $0.8 million, the interest cost on projected pension obligations was $0.9 million and the benefits paid were$0.6 million. The total obligation for the Company, included in Long-Term Liabilities, as at March 31, 2004 was$15.4 million (2003 – $14.6 million). The difference between this obligation recognized by the Company and the pen-sion obligation is the amount of unamortized actuarial gains of $0.8 million (2003 – $0.9 million).
NOTE 21 – CURRENCY TRANSLATION ADJUSTMENT
The change in the currency translation adjustment account included in shareholders’ equity resulted from the transla-tion to Canadian dollars of assets and liabilities of the Company’s self-sustaining foreign operations, exchange gainsor losses on inter-company account balances that form part of the net investments and foreign exchange gains orlosses on long-term debt designated as hedges of the net investment in self-sustaining foreign operations.
The net change in this account is as follows:
(amounts in millions of Canadian dollars) 2004 2003
Balance at beginning of year $ 28.5 $ (15.1)Effect of changes in exchange rates during the year:
On net investment in self-sustaining subsidiaries (62.2) 21.0On certain long-term debt denominated in foreign currencies designated
as a hedge of net investments in self-sustaining foreign subsidiaries 21.6 22.6
Balance at end of year $ (12.1) $ 28.5
NOTE 22 – OPERATING SEGMENTS AND GEOGRAPHIC INFORMATION
The Company’s significant operating segments include:(i) Civil Simulation and Training – a world-leading supplier of civil flight simulators and visual systems, and a
provider of business and civil aviation training.(ii) Military Simulation and Training – a premier supplier of military flight and land-based simulators, visual and
training systems.(iii) Marine Controls – a world leader in the supply of automation and control systems for the naval and commercial
markets. The business also provides naval training systems and designs and manufactures power plant trainingsimulators and systems.
Each operating segment is led by a senior executive and offers different products and uses different technology andmarketing strategies. The Company evaluates performance based on earnings before interest, income taxes and dis-continued operations and uses capital employed to assess resources allocated to each segment. Capital employedincludes accounts receivable, inventories, prepaid expenses, restricted cash, property, plant and equipment, good-will, intangible assets and other assets less accounts payable and accrued liabilities, deposits on contracts anddeferred gains and other long-term liabilities.
Prior to fiscal 2003, the Marine Controls segment was aggregated and presented with the Military Simulation andTraining segment. In 2003, these segments were presented separately and accordingly comparative figures for fiscal2002 have been restated in order to be consistent with the new basis of presentation.
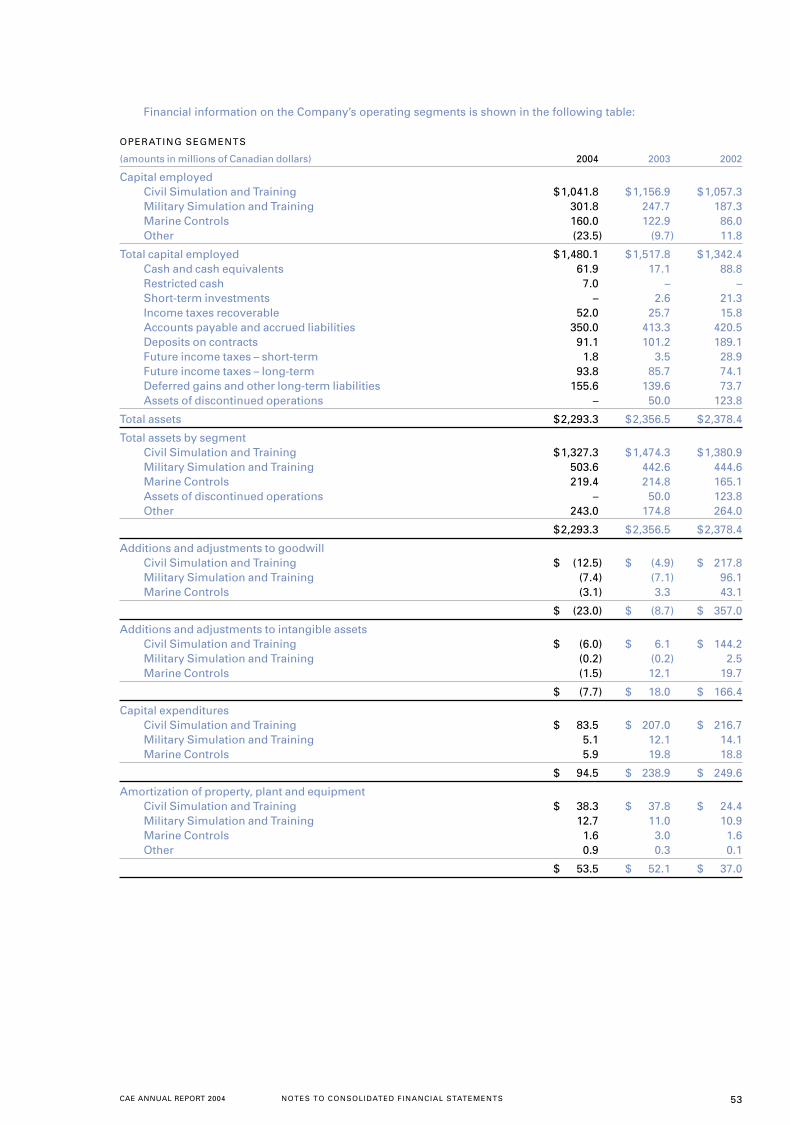
CAE ANNUAL REPORT 2004 NOTES TO CONSOLIDATED FINANCIAL STATEMENTS 53
Financial information on the Company’s operating segments is shown in the following table:
OPERATING SEGMENTS
(amounts in millions of Canadian dollars) 2004 2003 2002
Capital employedCivil Simulation and Training $1,041.8 $1,156.9 $1,057.3Military Simulation and Training 301.8 247.7 187.3Marine Controls 160.0 122.9 86.0Other (23.5) (9.7) 11.8
Total capital employed $1,480.1 $1,517.8 $1,342.4Cash and cash equivalents 61.9 17.1 88.8Restricted cash 7.0 – –Short-term investments – 2.6 21.3Income taxes recoverable 52.0 25.7 15.8Accounts payable and accrued liabilities 350.0 413.3 420.5Deposits on contracts 91.1 101.2 189.1Future income taxes – short-term 1.8 3.5 28.9Future income taxes – long-term 93.8 85.7 74.1Deferred gains and other long-term liabilities 155.6 139.6 73.7Assets of discontinued operations – 50.0 123.8
Total assets $2,293.3 $2,356.5 $2,378.4
Total assets by segmentCivil Simulation and Training $1,327.3 $1,474.3 $1,380.9Military Simulation and Training 503.6 442.6 444.6Marine Controls 219.4 214.8 165.1Assets of discontinued operations – 50.0 123.8Other 243.0 174.8 264.0
$2,293.3 $2,356.5 $2,378.4
Additions and adjustments to goodwillCivil Simulation and Training $ (12.5) $ (4.9) $ 217.8Military Simulation and Training (7.4) (7.1) 96.1Marine Controls (3.1) 3.3 43.1
$ (23.0) $ (8.7) $ 357.0
Additions and adjustments to intangible assetsCivil Simulation and Training $ (6.0) $ 6.1 $ 144.2Military Simulation and Training (0.2) (0.2) 2.5Marine Controls (1.5) 12.1 19.7
$ (7.7) $ 18.0 $ 166.4
Capital expendituresCivil Simulation and Training $ 83.5 $ 207.0 $ 216.7Military Simulation and Training 5.1 12.1 14.1Marine Controls 5.9 19.8 18.8
$ 94.5 $ 238.9 $ 249.6
Amortization of property, plant and equipmentCivil Simulation and Training $ 38.3 $ 37.8 $ 24.4Military Simulation and Training 12.7 11.0 10.9Marine Controls 1.6 3.0 1.6Other 0.9 0.3 0.1
$ 53.5 $ 52.1 $ 37.0

54 CAE ANNUAL REPORT 2004NOTES TO CONSOLIDATED FINANCIAL STATEMENTS
OPERATING SEGMENTS
(amounts in millions of Canadian dollars) 2004 2003 2002
Amortization of intangible assetsCivil Simulation and Training $ 6.8 $ 7.5 $ 2.7Military Simulation and Training 0.1 0.2 –Marine Controls 1.9 2.0 0.3
$ 8.8 $ 9.7 $ 3.0
Amortization of other assetsCivil Simulation and Training $ 10.1 $ 5.3 $ 2.5Military Simulation and Training 1.4 1.6 0.6Other 1.6 1.9 –
$ 13.1 $ 8.8 $ 3.1
GEOGRAPHIC INFORMATION
(amounts in millions of Canadian dollars) 2004 2003 2002
Revenue from external customers based on their locationCanada $ 128.5 $ 89.0 $ 102.7United States 338.2 329.5 347.0United Kingdom 110.6 149.7 127.4Germany 137.5 119.1 91.2Other European countries 177.6 156.2 173.8Other countries 200.8 287.0 284.4
$1,093.2 $1,130.5 $1,126.5
Property, plant and equipment, goodwill and intangible assetsCanada $ 224.8 $ 226.1 $ 126.6United States 443.1 577.6 579.0Europe 619.8 582.0 520.6Other countries 54.3 83.2 151.2
$1,342.0 $1,468.9 $1,377.4
NOTE 23 – RESTRUCTURING COSTS
On April 5, 2004, the Company announced employee layoffs, of which 85% were based in Montreal. A restructuringcharge of $8.2 million, related to these employees, to cover severance and other costs has been recorded in theresults of the fourth quarter of fiscal year 2004, in accordance with the CICA’s EIC-134, Accounting for Severance andTermination Benefits.
The $8.2 million liability is included in the Company’s balance sheet under the accounts payable and accruedliabilities line. This liability is expected to be fully used during the first quarter of fiscal year 2005. Earlier during thefourth quarter of fiscal year 2004, the Company incurred $1.8 million in severance costs for Montreal-based employees.The total restructuring costs incurred during the fourth quarter of fiscal year 2004 amount to $10.0 million.
NOTE 24 – DIFFERENCES BETWEEN CANADIAN AND UNITED STATES GENERALLY ACCEPTEDACCOUNTING PRINCIPLES
The consolidated financial statements have been prepared in accordance with Canadian generally accepted account-ing principles (Canadian GAAP), which differ in certain respects from those principles that the Company would havefollowed had its financial statements been prepared in accordance with accounting principles generally accepted inthe United States (US GAAP).
Additional disclosures required under US GAAP have been provided in the accompanying financial statementsand notes.

CAE ANNUAL REPORT 2004 NOTES TO CONSOLIDATED FINANCIAL STATEMENTS 55
The reconciliation of net earnings in accordance with Canadian GAAP to conform to US GAAP is as follows:
Years ended March 31(amounts in millions of Canadian dollars, except per share amounts) 2004 2003 2002
Earnings from continuing operations for the year in accordance with Canadian GAAP $ 67.1 $ 131.0 $ 148.4
Deferred development costs, net of tax recovery of $1.2 (2003 – $2.7), (2002 – $5.0) (A) (2.5) (5.8) (10.6)
Deferred pre-operating costs, net of tax expense of $0.3(2003 – $0.4), (2002 – $4.1) (B) (0.2) (0.8) (8.8)
Derivative instruments, net of tax recovery of $4.3 (2003 – $7.7) (2002 – $0.2) (D) (9.1) (16.7) (0.5)
Leases net of tax expense of $2.5 (2003 – $0.9), (2002 – tax recovery $0.8) (H) 5.3 2.0 (1.8)Foreign exchange gain on purchase of subsidiary in 2002, net of tax of $3.7 (F) – – 7.9
Earnings from continuing operations before cumulative effect of accounting change – US GAAP 60.6 109.7 134.6
Discontinued operations (3.1) (13.8) 1.1
Net earnings before cumulative effect of accounting change – US GAAP 57.5 95.9 135.7Cumulative effect on prior years of accounting change (D) (E) – – 5.3
Net earnings for the year in accordance with US GAAP $ 57.5 $ 95.9 $ 141.0
Basic and diluted earnings per share from continuing operations in accordance with US GAAP 0.26 0.50 0.62
Basic and diluted results per share from discontinued operations in accordance with US GAAP (0.02) (0.07) 0.01
Basic and diluted net earnings per share before cumulative effect of accounting change in accordance with US GAAP 0.24 0.43 0.63
Basic and diluted net earnings per share in accordance with US GAAP 0.24 0.43 0.65
Dividends per common share 0.12 0.12 0.11
Weighted average number of common shares outstanding 233.2 219.4 217.6
Comprehensive income
(amounts in millions of Canadian dollars) 2004 2003 2002
Net earnings in accordance with US GAAP $ 57.5 $ 95.9 $ 141.0Accumulated minimum pension liability, net of taxes of
$4.2 (2003 – $10.8) 9.1 (23.5) –Foreign currency translation adjustments (40.1) 36.8 (1.5)
Comprehensive income $ 26.5 $ 109.2 $ 139.5
Accumulated Other Comprehensive Loss in accordance with US GAAP
(amounts in millions of Canadian dollars) 2004 2003 20021
Beginning balance $ (1.8) $ (15.1) $ (13.6)Currency translation adjustments (40.1) 36.8 (1.5)Change in minimum pension liability 9.1 (23.5) –
Ending balance $ (32.8) $ (1.8) $ (15.1)
1 The beginning balance of 2002 is composed only of currency translation adjustments.
The cumulative effect of these adjustments on the shareholders’ equity of the Company is as follows:
(amounts in millions of Canadian dollars) 2004 2003
Shareholders’ equity in accordance with Canadian GAAP $ 918.8 $ 750.2Deferred development costs, net of tax of $13.4 (2003 – $12.2), (2002 – $9.5) (A) (27.9) (25.4)Deferred pre-operating costs, net of tax of $8.8 (2003 – $9.1), (2002 – $8.7) (B) (18.9) (18.7)Derivative instruments, net of tax expense of $9.8
(2003 – tax expense $5.5), (2002 – tax recovery $2.2) (D) (21.0) (11.9)Foreign currency translation adjustments (I) (6.6) (6.6)Leases, net of tax recovery of $3.0 (2003 – tax recovery $0.5),
(2002 – tax expense $0.4) (H) 6.0 0.7Foreign exchange gain on purchase of subsidiary, net of tax of $3.7
(2003 – $3.7), (2002 – $3.7) (F) 7.9 7.9Minimum pension liability, net of tax of $6.6 (2003 – $10.8), (2002 – nil) (J) (14.4) (23.5)
Shareholders’ equity in accordance with US GAAP $ 843.9 $ 672.7

56 CAE ANNUAL REPORT 2004NOTES TO CONSOLIDATED FINANCIAL STATEMENTS
The balance sheets in accordance with US GAAP as at March 31, 2004 and March 31, 2003 are as follows:
(amounts in millions of Canadian dollars) Notes March 31, 2004 March 31, 2003
Canadian US Canadian USGAAP GAAP GAAP GAAP
AssetsCash and cash equivalents $ 61.9 $ 61.9 $ 17.1 $ 17.1Short-term investments C – – 2.6 2.6Accounts receivable 390.9 390.9 373.1 373.1Derivative instruments D – 1.6 – 2.7Inventories 154.8 154.8 136.3 136.3Prepaid expenses H 20.7 17.3 14.0 9.6Income taxes recoverable 52.0 52.0 25.7 25.7Future income taxes 1.8 1.8 3.5 3.5
$ 682.1 $ 680.3 $ 572.3 $ 570.6
Restricted cash 7.0 7.0 14.4 14.4Assets of discontinued operations – – 50.0 50.0Property, plant and equipment, net H 843.0 921.9 930.4 1,018.9Future income taxes A,B,D,F,H,J 93.8 125.5 85.7 119.1Intangible assets J 155.2 161.0 171.7 176.9Goodwill F 343.8 355.4 366.8 378.4Other assets A,B 168.4 99.3 165.2 99.9
$2,293.3 $2,350.4 $2,356.5 $2,428.2
Liabilities and shareholders’ equityCurrent liabilitiesAccounts payable and accrued liabilities H $ 350.0 $ 349.2 $ 413.3 $ 411.0Deposits on contracts 91.1 91.1 101.2 101.2Derivative instruments D – 32.7 – 20.4Long-term debt due within one year H 13.5 25.8 13.4 30.0Future income taxes 51.1 51.1 42.4 42.4
$ 505.7 $ 549.9 $ 570.3 $ 605.0
Liabilities of discontinued operations $ – $ – $ 17.9 17.9Long-term debt H 623.4 717.0 798.0 900.6Deferred gains and other long-term liabilities H,J 155.6 149.8 139.6 151.5Future income taxes 89.8 89.8 80.5 80.5
$1,374.5 $1,506.5 $1,606.3 $1,755.5
Shareholders’ equityCapital stock G,K $ 367.5 $ 611.7 $ 190.5 $ 439.8Contributed surplus 1.3 1.3Retained earnings A,B,D,E,F,G,H,K 562.1 263.7 531.2 234.7Currency translation adjustment (12.1) – 28.5 –Accumulated other comprehensive loss C,H,J – (32.8) – (1.8)
$ 918.8 $ 843.9 $ 750.2 $ 672.7
$2,293.3 $2,350.4 $2,356.5 $2,428.2
RECONCILIATION ITEMS
A) Deferred development costsUnder US GAAP, development costs are charged to expense in the period incurred. Under Canadian GAAP, certaindevelopment costs are capitalized and amortized over their estimated useful lives if they meet the criteria fordeferral. The difference between US GAAP and Canadian GAAP represents the gross development costs capital-ized in the respective year, net of the reversal of amortization expense recorded for Canadian GAAP relating toamounts previously capitalized.
B) Deferred pre-operating costsUnder US GAAP, pre-operating costs are charged to expense in the period incurred. Under Canadian GAAP, theamounts are deferred and amortized over five to 20 years based on the expected period and pattern of benefitof the deferred expenditures. The difference between US GAAP and Canadian GAAP represents the gross pre-operating costs capitalized in the respective year, net of the reversal of amortization expense recorded forCanadian GAAP relating to amounts previously capitalized.

CAE ANNUAL REPORT 2004 NOTES TO CONSOLIDATED FINANCIAL STATEMENTS 57
C) Portfolio investmentsUnder Canadian GAAP, portfolio investments (short-term investments) are accounted for at the least of cost andmarket value. Under US GAAP, portfolio investments are classified as held to maturity and thus are recorded atamortized cost. There is no material difference for US GAAP purposes. The investments held at March 31, 2003had maturity dates of within one month of March 31, 2003.
D) Derivative financial instruments Under Canadian GAAP, the nature and fair values of derivative financial instruments, all of which are entered intofor hedging purposes, are disclosed. The Company recognizes the gains and losses on forward contracts inincome concurrently with the recognition of the transactions being hedged. The interest payments relating toswap contracts are recorded in net earnings over the life of the underlying transaction on an accrual basis as anadjustment to interest income or interest expense. Under US GAAP, all derivatives are recorded on the balancesheet at fair value. Realized and unrealized gains and losses resulting from the valuation of derivatives (includingembedded derivatives in purchase and sale contracts) at market value are recognized (against interest expensefor interest rate swap and against revenues or cost of goods sold for the foreign exchange contracts) as the gainsand losses arise and not concurrently with the recognition of the transactions being hedged, as the Companydoes not apply the optional hedge accounting provisions of SFAS 133 and 138.
Upon the initial adoption of SFAS 133 and 138 on April 1, 2001, the cumulative effect of the accountingchange resulted in an increase in net earnings of $5.3 million net of taxes of $2.4 million.
E) Adjustments for changes in accounting policiesUnder US GAAP, the cumulative effect of certain accounting changes must be included in earnings in the year ofthe change. Under Canadian GAAP, the impact is reflected through retained earnings.
F) Foreign exchange gain on purchase of subsidiaryUnder Canadian GAAP, upon the purchase of Schreiner, a foreign exchange gain was recorded in fiscal 2002 asa reduction of goodwill on the forward contract hedge of the foreign currency denominated purchase price.Under US GAAP, this gain was recorded in earnings.
G) Reduction in stated capitalOn July 7, 1994, the Company applied a portion of its deficit as a reduction of its stated capital in the amount of$249.3 million. Under US GAAP, the reduction of stated capital would not be permitted.
H) LeasesUnder Canadian GAAP, certain of the Company’s leases of simulators, with aggregate minimum future lease pay-ments of $133.5 million are accounted for as operating leases.
Under these agreements, the lessors hold the simulators under lease and have arranged financing throughSpecial Purposes Entities (SPEs). Under US GAAP, since the legal stated capital of these (SPEs) represent less than3% of the assets of those (SPEs), the assets, liabilities, results of operations and cash flows of the SPE must beconsolidated into those of the Company. Amortization expense related to these leases amounts to $3.8 million in2004 (2003 – $4.4 million, 2002 – $2.0 million) and interest expense related to the financing arrangement amountsto $7.6 million in 2004 (2003 – $8.3 million, 2002 – $6.0 million). Currency translation adjustments resulting fromthe consolidation of a foreign SPE considered self-sustaining amount to $0.5 million in 2004 (2003 – $6.6 million).
I) Comprehensive income US GAAP requires disclosure of comprehensive income, which comprises income and other components of comprehensive income. Other comprehensive income includes items that cause changes in shareholders’ equitybut are not related to share capital or net earnings which, for the Company, comprises currency translationadjustments and change in minimum pension liability. Under Canadian GAAP, there is no requirement to reportcomprehensive income.
J) Minimum pension liabilityUnder US GAAP, if the accumulated benefit obligation exceeds the market value of plan assets, a minimum pen-sion liability for the excess is recognized to the extent that the liability recorded in the balance sheet is less thanthe minimum liability. Any portion of the additional liability that relates to unrecognized past service costs is recognized as an intangible asset while the remainder is charged to comprehensive income. The concept of addi-tional minimum liability does not exist under Canadian GAAP.
K) Share issue costsUnder Canadian GAAP, costs related to share issuance can be presented in retained earnings, net of taxes. UnderUS GAAP, these costs were recorded as a reduction of capital stock.
CONSOLIDATED STATEMENT OF CASH FLOWS
Under US GAAP reporting, separate subtotals within operating, financing and investment activities would not be presented.
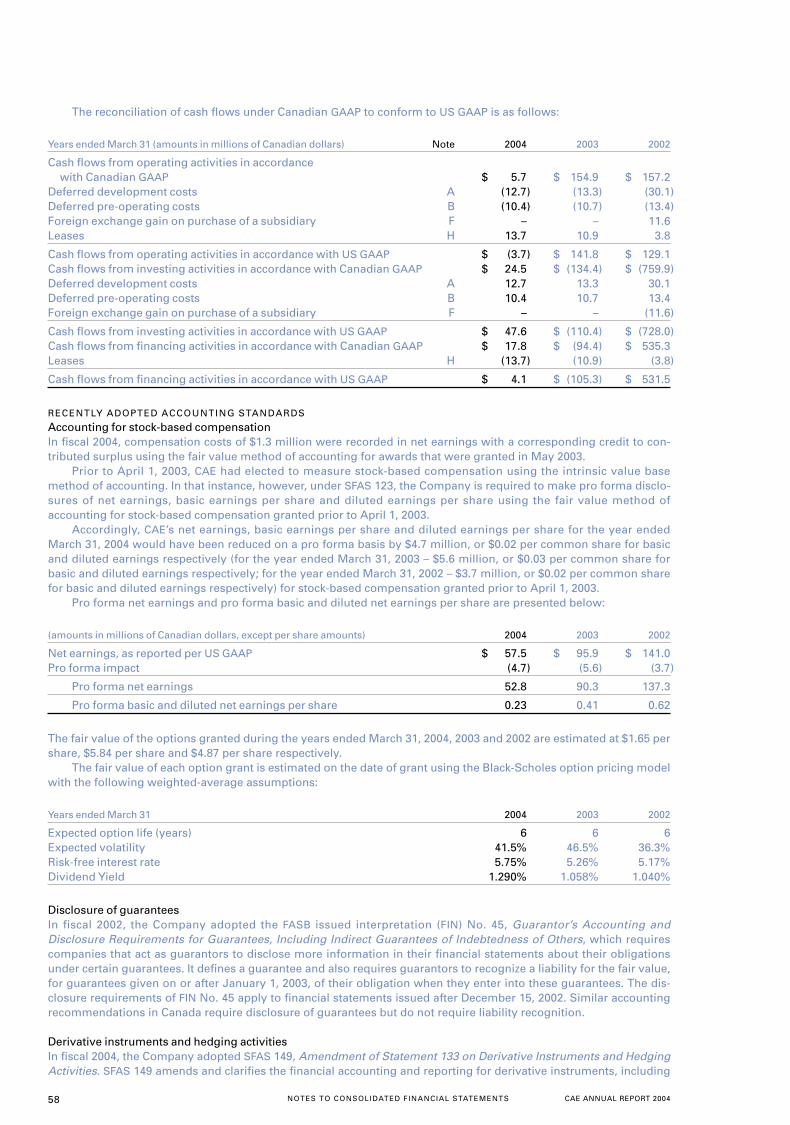
58 CAE ANNUAL REPORT 2004NOTES TO CONSOLIDATED FINANCIAL STATEMENTS
The reconciliation of cash flows under Canadian GAAP to conform to US GAAP is as follows:
Years ended March 31 (amounts in millions of Canadian dollars) Note 2004 2003 2002
Cash flows from operating activities in accordance with Canadian GAAP $ 5.7 $ 154.9 $ 157.2
Deferred development costs A (12.7) (13.3) (30.1)Deferred pre-operating costs B (10.4) (10.7) (13.4)Foreign exchange gain on purchase of a subsidiary F – – 11.6Leases H 13.7 10.9 3.8
Cash flows from operating activities in accordance with US GAAP $ (3.7) $ 141.8 $ 129.1Cash flows from investing activities in accordance with Canadian GAAP $ 24.5 $ (134.4) $ (759.9)Deferred development costs A 12.7 13.3 30.1Deferred pre-operating costs B 10.4 10.7 13.4Foreign exchange gain on purchase of a subsidiary F – – (11.6)
Cash flows from investing activities in accordance with US GAAP $ 47.6 $ (110.4) $ (728.0)Cash flows from financing activities in accordance with Canadian GAAP $ 17.8 $ (94.4) $ 535.3Leases H (13.7) (10.9) (3.8)
Cash flows from financing activities in accordance with US GAAP $ 4.1 $ (105.3) $ 531.5
RECENTLY ADOPTED ACCOUNTING STANDARDS
Accounting for stock-based compensation In fiscal 2004, compensation costs of $1.3 million were recorded in net earnings with a corresponding credit to con-tributed surplus using the fair value method of accounting for awards that were granted in May 2003.
Prior to April 1, 2003, CAE had elected to measure stock-based compensation using the intrinsic value basemethod of accounting. In that instance, however, under SFAS 123, the Company is required to make pro forma disclo-sures of net earnings, basic earnings per share and diluted earnings per share using the fair value method ofaccounting for stock-based compensation granted prior to April 1, 2003.
Accordingly, CAE’s net earnings, basic earnings per share and diluted earnings per share for the year endedMarch 31, 2004 would have been reduced on a pro forma basis by $4.7 million, or $0.02 per common share for basicand diluted earnings respectively (for the year ended March 31, 2003 – $5.6 million, or $0.03 per common share forbasic and diluted earnings respectively; for the year ended March 31, 2002 – $3.7 million, or $0.02 per common sharefor basic and diluted earnings respectively) for stock-based compensation granted prior to April 1, 2003.
Pro forma net earnings and pro forma basic and diluted net earnings per share are presented below:
(amounts in millions of Canadian dollars, except per share amounts) 2004 2003 2002
Net earnings, as reported per US GAAP $ 57.5 $ 95.9 $ 141.0Pro forma impact (4.7) (5.6) (3.7)
Pro forma net earnings 52.8 90.3 137.3
Pro forma basic and diluted net earnings per share 0.23 0.41 0.62
The fair value of the options granted during the years ended March 31, 2004, 2003 and 2002 are estimated at $1.65 pershare, $5.84 per share and $4.87 per share respectively.
The fair value of each option grant is estimated on the date of grant using the Black-Scholes option pricing modelwith the following weighted-average assumptions:
Years ended March 31 2004 2003 2002
Expected option life (years) 6 6 6Expected volatility 41.5% 46.5% 36.3%Risk-free interest rate 5.75% 5.26% 5.17%Dividend Yield 1.290% 1.058% 1.040%
Disclosure of guaranteesIn fiscal 2002, the Company adopted the FASB issued interpretation (FIN) No. 45, Guarantor’s Accounting andDisclosure Requirements for Guarantees, Including Indirect Guarantees of Indebtedness of Others, which requirescompanies that act as guarantors to disclose more information in their financial statements about their obligationsunder certain guarantees. It defines a guarantee and also requires guarantors to recognize a liability for the fair value,for guarantees given on or after January 1, 2003, of their obligation when they enter into these guarantees. The dis-closure requirements of FIN No. 45 apply to financial statements issued after December 15, 2002. Similar accountingrecommendations in Canada require disclosure of guarantees but do not require liability recognition.
Derivative instruments and hedging activitiesIn fiscal 2004, the Company adopted SFAS 149, Amendment of Statement 133 on Derivative Instruments and HedgingActivities. SFAS 149 amends and clarifies the financial accounting and reporting for derivative instruments, including
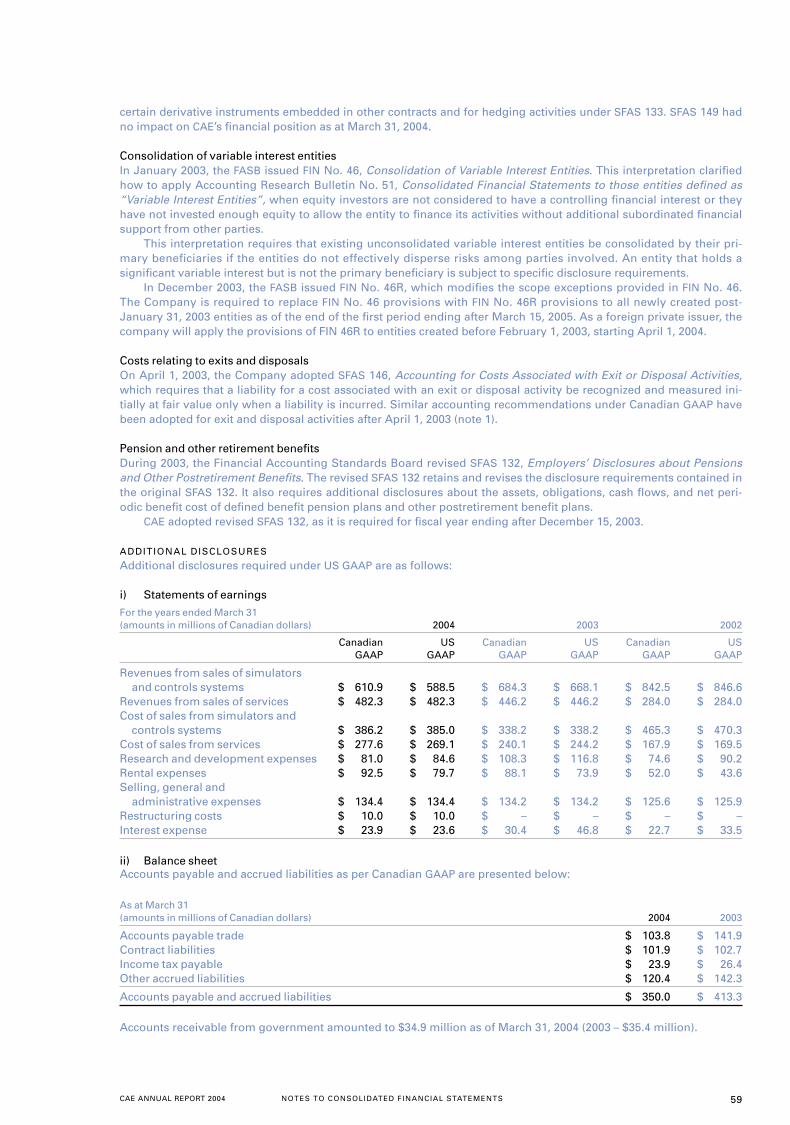
CAE ANNUAL REPORT 2004 NOTES TO CONSOLIDATED FINANCIAL STATEMENTS 59
certain derivative instruments embedded in other contracts and for hedging activities under SFAS 133. SFAS 149 hadno impact on CAE’s financial position as at March 31, 2004.
Consolidation of variable interest entitiesIn January 2003, the FASB issued FIN No. 46, Consolidation of Variable Interest Entities. This interpretation clarifiedhow to apply Accounting Research Bulletin No. 51, Consolidated Financial Statements to those entities defined as“Variable Interest Entities”, when equity investors are not considered to have a controlling financial interest or theyhave not invested enough equity to allow the entity to finance its activities without additional subordinated financialsupport from other parties.
This interpretation requires that existing unconsolidated variable interest entities be consolidated by their pri-mary beneficiaries if the entities do not effectively disperse risks among parties involved. An entity that holds asignificant variable interest but is not the primary beneficiary is subject to specific disclosure requirements.
In December 2003, the FASB issued FIN No. 46R, which modifies the scope exceptions provided in FIN No. 46.The Company is required to replace FIN No. 46 provisions with FIN No. 46R provisions to all newly created post-January 31, 2003 entities as of the end of the first period ending after March 15, 2005. As a foreign private issuer, thecompany will apply the provisions of FIN 46R to entities created before February 1, 2003, starting April 1, 2004.
Costs relating to exits and disposalsOn April 1, 2003, the Company adopted SFAS 146, Accounting for Costs Associated with Exit or Disposal Activities,which requires that a liability for a cost associated with an exit or disposal activity be recognized and measured ini-tially at fair value only when a liability is incurred. Similar accounting recommendations under Canadian GAAP havebeen adopted for exit and disposal activities after April 1, 2003 (note 1).
Pension and other retirement benefits During 2003, the Financial Accounting Standards Board revised SFAS 132, Employers’ Disclosures about Pensionsand Other Postretirement Benefits. The revised SFAS 132 retains and revises the disclosure requirements contained inthe original SFAS 132. It also requires additional disclosures about the assets, obligations, cash flows, and net peri-odic benefit cost of defined benefit pension plans and other postretirement benefit plans.
CAE adopted revised SFAS 132, as it is required for fiscal year ending after December 15, 2003.
ADDITIONAL DISCLOSURES
Additional disclosures required under US GAAP are as follows:
i) Statements of earnings
For the years ended March 31 (amounts in millions of Canadian dollars) 2004 2003 2002
Canadian US Canadian US Canadian USGAAP GAAP GAAP GAAP GAAP GAAP
Revenues from sales of simulators and controls systems $ 610.9 $ 588.5 $ 684.3 $ 668.1 $ 842.5 $ 846.6
Revenues from sales of services $ 482.3 $ 482.3 $ 446.2 $ 446.2 $ 284.0 $ 284.0Cost of sales from simulators and
controls systems $ 386.2 $ 385.0 $ 338.2 $ 338.2 $ 465.3 $ 470.3Cost of sales from services $ 277.6 $ 269.1 $ 240.1 $ 244.2 $ 167.9 $ 169.5Research and development expenses $ 81.0 $ 84.6 $ 108.3 $ 116.8 $ 74.6 $ 90.2Rental expenses $ 92.5 $ 79.7 $ 88.1 $ 73.9 $ 52.0 $ 43.6Selling, general and
administrative expenses $ 134.4 $ 134.4 $ 134.2 $ 134.2 $ 125.6 $ 125.9Restructuring costs $ 10.0 $ 10.0 $ – $ – $ – $ –Interest expense $ 23.9 $ 23.6 $ 30.4 $ 46.8 $ 22.7 $ 33.5
ii) Balance sheetAccounts payable and accrued liabilities as per Canadian GAAP are presented below:
As at March 31 (amounts in millions of Canadian dollars) 2004 2003
Accounts payable trade $ 103.8 $ 141.9Contract liabilities $ 101.9 $ 102.7Income tax payable $ 23.9 $ 26.4Other accrued liabilities $ 120.4 $ 142.3
Accounts payable and accrued liabilities $ 350.0 $ 413.3
Accounts receivable from government amounted to $34.9 million as of March 31, 2004 (2003 – $35.4 million).

60 CAE ANNUAL REPORT 2004NOTES TO CONSOLIDATED FINANCIAL STATEMENTS
iii) Income taxesThe components of earnings from continuing operations and income taxes on a Canadian GAAP basis are as follows:
For the years ended March 31(amounts in millions of Canadian dollars) 2004 2003 2002
Earnings before income taxes and other itemsCanada $ 6.3 $ 114.0 $ 179.0Other countries 81.4 77.2 39.3
$ 87.7 $ 191.2 $ 218.3
Current income taxesCanada $ 4.5 $ 43.0 $ 59.3Other countries 12.6 (1.6) 3.5
$ 17.1 $ 41.4 $ 62.8
Future income taxesCanada $ (3.3) $ (1.1) $ (2.0)Other countries 6.8 19.9 9.1
$ 3.5 $ 18.8 $ 7.1
Income tax provision $ 20.6 $ 60.2 $ 69.9
iv) Business combinationsThe following unaudited pro forma information for the fiscal years ended March 31, 2003 and 2002 presents a sum-mary of the pro forma consolidated statement of earnings for the Company as if business acquisitions performedduring their respective fiscal year referred to in note 2 had occurred on April 1 of the preceding fiscal year. Thispro forma information is based on available information and includes certain assumptions and adjustments, whichthe management of CAE believes to be reasonable. The pro forma information does not give effect to any cost savingsor synergies that CAE may enjoy as a result of these acquisitions. Accordingly, the pro forma information is not nec-essarily indicative of the results that might have been achieved, if the transactions reflected therein had been effectiveas at the beginning of the period presented, or of the results which may be obtained in the future. This pro formafinancial information has been prepared for comparative purposes only and is measured in accordance withCanadian GAAP.
Pro forma
Years ended March 31(amounts in millions of Canadian dollars, except per share amounts) 2003 2002
(Unaudited) (Unaudited)Revenue
Civil Simulation and Training $ 517.2 $ 618.6 Military Simulation and Training 445.7 461.8Marine Controls 175.8 132.0
$1,138.7 $1,212.4
Earnings before interest, income taxes and discontinued operationsCivil Simulation and Training $ 116.2 $ 148.3 Military Simulation and Training 73.6 65.6Marine Controls 31.9 25.4
Earnings before interest, income taxes and discontinued operations 221.7 239.3Interest expense, net 31.4 44.6
Earnings before income taxes and discontinued operations 190.3 194.7Income taxes 60.2 61.0
Earnings from continuing operations $ 130.1 $ 133.7Results of discontinued operations (note 3) (13.8) 1.1
Net earnings $ 116.3 $ 134.8
Earnings and diluted earnings per share from continuing operations $ 0.59 $ 0.61
Net earnings and diluted net earnings per share $ 0.53 $ 0.62
Average number of shares outstanding 219.4 218.2
v) Product warranty costsThe Company has warranty obligations in connection to the sale of its civil and military simulators and marine sys-tems. The original warranty period is usually for a two-year period. The cost incurred to provide for these warrantyobligations are estimated and recorded as an accrued liability at the time revenue is recognized. The Company esti-mates its warranty cost for a given product based on past experience. The changes in the Company’s accruedwarranty liability as at March 31 are as follows:
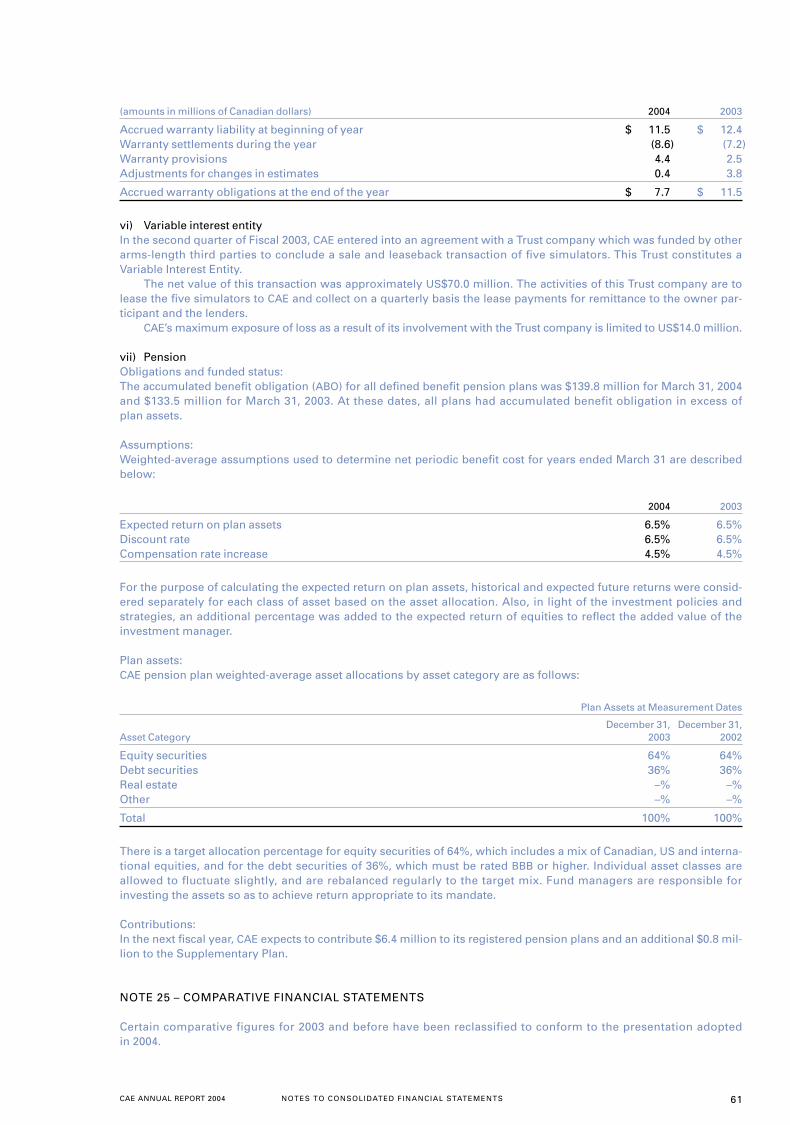
CAE ANNUAL REPORT 2004 NOTES TO CONSOLIDATED FINANCIAL STATEMENTS 61
(amounts in millions of Canadian dollars) 2004 2003
Accrued warranty liability at beginning of year $ 11.5 $ 12.4Warranty settlements during the year (8.6) (7.2)Warranty provisions 4.4 2.5Adjustments for changes in estimates 0.4 3.8
Accrued warranty obligations at the end of the year $ 7.7 $ 11.5
vi) Variable interest entityIn the second quarter of Fiscal 2003, CAE entered into an agreement with a Trust company which was funded by otherarms-length third parties to conclude a sale and leaseback transaction of five simulators. This Trust constitutes aVariable Interest Entity.
The net value of this transaction was approximately US$70.0 million. The activities of this Trust company are tolease the five simulators to CAE and collect on a quarterly basis the lease payments for remittance to the owner par-ticipant and the lenders.
CAE’s maximum exposure of loss as a result of its involvement with the Trust company is limited to US$14.0 million.
vii) PensionObligations and funded status:The accumulated benefit obligation (ABO) for all defined benefit pension plans was $139.8 million for March 31, 2004and $133.5 million for March 31, 2003. At these dates, all plans had accumulated benefit obligation in excess ofplan assets.
Assumptions:Weighted-average assumptions used to determine net periodic benefit cost for years ended March 31 are describedbelow:
2004 2003
Expected return on plan assets 6.5% 6.5%Discount rate 6.5% 6.5%Compensation rate increase 4.5% 4.5%
For the purpose of calculating the expected return on plan assets, historical and expected future returns were consid-ered separately for each class of asset based on the asset allocation. Also, in light of the investment policies andstrategies, an additional percentage was added to the expected return of equities to reflect the added value of theinvestment manager.
Plan assets:CAE pension plan weighted-average asset allocations by asset category are as follows:
Plan Assets at Measurement Dates
December 31, December 31,Asset Category 2003 2002
Equity securities 64% 64%Debt securities 36% 36%Real estate –% –%Other –% –%
Total 100% 100%
There is a target allocation percentage for equity securities of 64%, which includes a mix of Canadian, US and interna-tional equities, and for the debt securities of 36%, which must be rated BBB or higher. Individual asset classes areallowed to fluctuate slightly, and are rebalanced regularly to the target mix. Fund managers are responsible forinvesting the assets so as to achieve return appropriate to its mandate.
Contributions:In the next fiscal year, CAE expects to contribute $6.4 million to its registered pension plans and an additional $0.8 mil-lion to the Supplementary Plan.
NOTE 25 – COMPARATIVE FINANCIAL STATEMENTS
Certain comparative figures for 2003 and before have been reclassified to conform to the presentation adoptedin 2004.

62 CAE ANNUAL REPORT 2004FIVE-YEAR REVIEW AND QUARTERLY FINANCIAL INFORMATION
(unaudited)(amounts in millions of dollars except where indicated by *) 2004 2003 2002 2001 2000
Continuing operationsRevenue $1,093.2 1,130.5 1,126.5 891.4 865.1Amortization $ 75.4 70.6 43.1 19.1 22.3Earnings $ 67.1 131.0 148.4 103.7 63.0Earnings per share* $ 0.29 0.60 0.68 0.48 0.29
Net earnings $ 64.0 117.2 149.5 106.1 99.5Basic and diluted net earnings per share* $ 0.27 0.53 0.69 0.49 0.45Ratio of current assets to current liabilities* 1.3 1.1 1.0 1.3 1.4Number of registered shareholders* 2,297 2,308 2,114 2,130 2,392Cash dividends paid per common share* $ 0.12 0.12 0.11 0.10 0.10
QUARTERLY FINANCIAL INFORMATION
(unaudited) First Second Third Fourth(amounts in millions of dollars except per share amounts) Quarter Quarter Quarter Quarter
2004Continuing operations
Revenue $ 242.9 246.1 304.9 299.3Earnings $ 15.1 15.1 21.4 15.5Earnings per share $ 0.07 0.07 0.09 0.06
Net earnings $ 13.2 15.1 21.4 14.3Basic and diluted net earnings per share $ 0.06 0.07 0.09 0.05Common share trading range:
High $ 5.81 6.79 6.07 6.77Low $ 3.09 5.01 5.05 5.55
(unaudited) First Second Third Fourth(amounts in millions of dollars except per share amounts) Quarter Quarter Quarter Quarter
2003Continuing operations
Revenue $ 275.8 252.3 290.3 312.1Earnings $ 37.4 23.3 31.5 38.8Earnings per share $ 0.17 0.11 0.14 0.18
Net earnings $ 37.4 23.3 31.5 25.0Basic and diluted net earnings per share $ 0.17 0.11 0.14 0.11Common share trading range:
High $ 14.63 12.60 6.05 6.40Low $ 11.28 4.17 3.25 2.76
FIVE-YEAR REVIEW
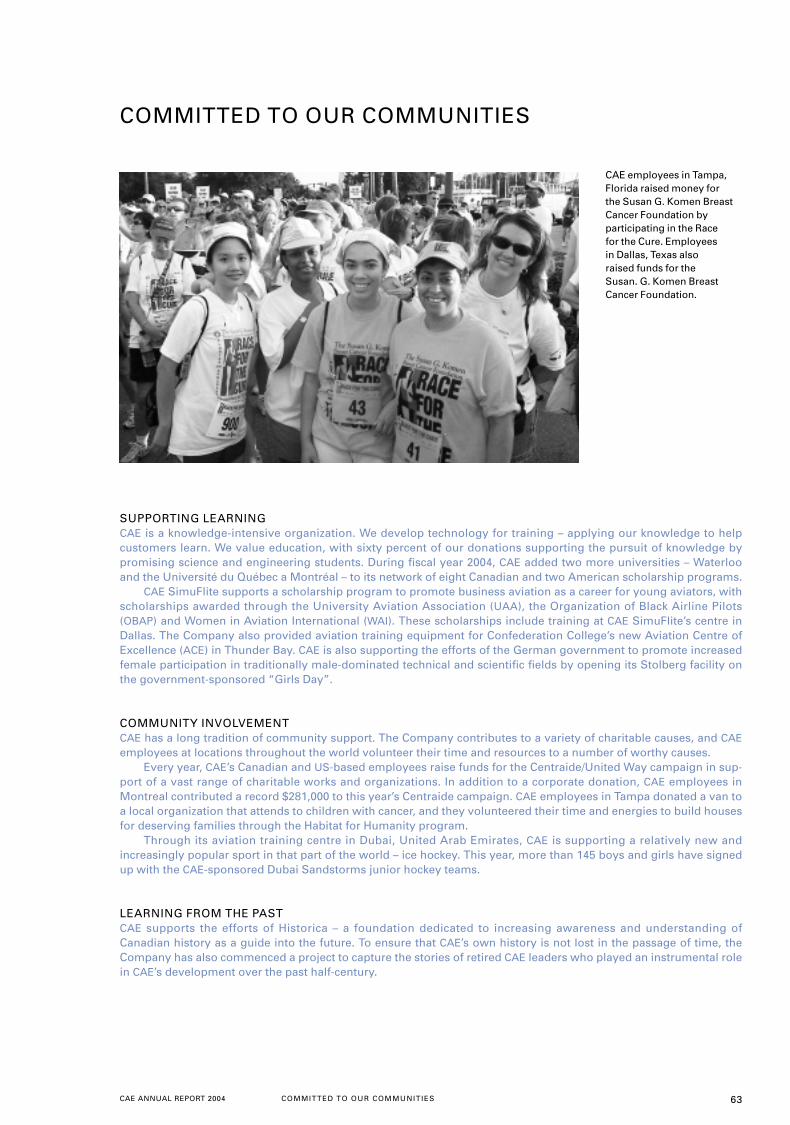
CAE ANNUAL REPORT 2004 COMMITTED TO OUR COMMUNITIES 63
SUPPORTING LEARNING CAE is a knowledge-intensive organization. We develop technology for training – applying our knowledge to help customers learn. We value education, with sixty percent of our donations supporting the pursuit of knowledge bypromising science and engineering students. During fiscal year 2004, CAE added two more universities – Waterlooand the Université du Québec a Montréal – to its network of eight Canadian and two American scholarship programs.
CAE SimuFlite supports a scholarship program to promote business aviation as a career for young aviators, withscholarships awarded through the University Aviation Association (UAA), the Organization of Black Airline Pilots(OBAP) and Women in Aviation International (WAI). These scholarships include training at CAE SimuFlite’s centre inDallas. The Company also provided aviation training equipment for Confederation College’s new Aviation Centre ofExcellence (ACE) in Thunder Bay. CAE is also supporting the efforts of the German government to promote increasedfemale participation in traditionally male-dominated technical and scientific fields by opening its Stolberg facility onthe government-sponsored “Girls Day”.
COMMUNITY INVOLVEMENTCAE has a long tradition of community support. The Company contributes to a variety of charitable causes, and CAEemployees at locations throughout the world volunteer their time and resources to a number of worthy causes.
Every year, CAE’s Canadian and US-based employees raise funds for the Centraide/United Way campaign in sup-port of a vast range of charitable works and organizations. In addition to a corporate donation, CAE employees inMontreal contributed a record $281,000 to this year’s Centraide campaign. CAE employees in Tampa donated a van toa local organization that attends to children with cancer, and they volunteered their time and energies to build housesfor deserving families through the Habitat for Humanity program.
Through its aviation training centre in Dubai, United Arab Emirates, CAE is supporting a relatively new andincreasingly popular sport in that part of the world – ice hockey. This year, more than 145 boys and girls have signedup with the CAE-sponsored Dubai Sandstorms junior hockey teams.
LEARNING FROM THE PASTCAE supports the efforts of Historica – a foundation dedicated to increasing awareness and understanding ofCanadian history as a guide into the future. To ensure that CAE’s own history is not lost in the passage of time, theCompany has also commenced a project to capture the stories of retired CAE leaders who played an instrumental rolein CAE’s development over the past half-century.
COMMITTED TO OUR COMMUNITIES
CAE employees in Tampa,Florida raised money for the Susan G. Komen BreastCancer Foundation byparticipating in the Race for the Cure. Employees in Dallas, Texas also raised funds for the Susan. G. Komen BreastCancer Foundation.
64 CAE ANNUAL REPORT 2004DIRECTORS AND OFFICERS
BOARD OF DIRECTORS
Lynton R. Wilson, O.C.1,2,4
Chairman of the Board CAE Inc.Oakville, Ontario
Derek H. Burney, O.C.1
President and Chief Executive OfficerCAE Inc.Toronto, Ontario
John A. (Ian) Craig3
Business Consultant Ottawa, Ontario
Richard J. Currie, C.M.3
ChairmanBell Canada Enterprises Inc.Toronto, Ontario
R. Fraser Elliott, C.M., Q.C.1
Senior PartnerStikeman ElliottToronto, Ontario
H. Garfield Emerson, Q.C.4
National ChairmanFasken Martineau DuMoulinToronto, Ontario
Anthony S. Fell4
ChairmanRBC Dominion Securities Inc.Toronto, Ontario
The Honourable James A. Grant, P.C., C.M., Q.C.1,2
Partner Stikeman Elliott LLPMontreal, Quebec
James F. Hankinson3,4
Business ConsultantToronto, Ontario
E. Randolph (Randy) Jayne II2
Senior PartnerHeidrick & Struggles International Inc.McLean, Virginia
James W. McCutcheon, Q.C.3
CounselMcCarthy TétraultToronto, Ontario
Lawrence N. Stevenson2
Chief Executive OfficerPep Boys Inc.Philadelphia, Pennsylvania
1 Member of the Executive Committee2 Member of the Compensation
Committee3 Member of the Audit Committee4 Member of the Governance Committee
Lynton R. WilsonChairman of the Board
Derek H. BurneyPresident and Chief Executive Officer
Donald W. CampbellGroup President, Military Simulation and Training
Jeff RobertsGroup President,Civil Simulation and Training
Rashid A. KhanExecutive Vice President, Marine Controls
Hani R. MacramallahExecutive Vice President, Operations
Paul G. RenaudExecutive Vice President, Chief Financial Officer and Secretary
Aline BélangerVice President, Corporate Controllerand Assistant Corporate Secretary
Guy BlanchetteVice President and Treasurer
Hartland J.A. PatersonVice President,Legal and General Counsel
OFFICERS
DIRECTORS AND OFFICERS
CAE ANNUAL REPORT 2004CORPORATE PROFILE
CAE IS A LEADING PROVIDER OF INTEGRATED TRAINING SOLUTIONS AND ADVANCED SIMULATIONAND CONTROLS TECHNOLOGIES TO CIVIL AVIATION, MILITARY AND MARINE CUSTOMERS. THECOMPANY HAS TRAINING FACILITIES AND OPERATIONS IN 19 COUNTRIES ON FIVE CONTINENTS, ANDGENERATES ANNUAL REVENUES IN EXCESS OF C$1 BILLION.
CAE CORPORATE PROFILE
ESSENTIAL TRANSFORMATIONIn the past four years, CAE has undergone a strategic transformation from being primarily an equipmentsupplier serving many industries, to an integrated training solutions provider in three core markets.
Revenue Balance between Equipment and Training
■ Approximate Equipment Revenue ■ Approximate Training Revenue
15%
85%
25%
75%
40%
60%
45%55%
2001 2002 2003 2004
CAE ANNUAL REPORT 2004 SHAREHOLDER AND INVESTOR INFORMATION
SHAREHOLDER AND INVESTOR INFORMATION
CAE SHARES
CAE’s shares are traded on the Toronto Stock Exchange(TSX) under the symbol “CAE” and on the New YorkStock Exchange (NYSE) under the symbol “CGT” (CAE Global Training).
TRANSFER AGENT AND REGISTRAR
Computershare Trust Company of Canada100 University Avenue, 9th FloorToronto, Ontario M5J 2Y1Tel: (514) 982-7555 or 1-800-564-6253 (toll free in
Canada and the US)Fax: (514) 982-7635 or 1-866-249-7775 (toll free in
Canada and the US)E-mail: [email protected]
DIVIDEND REINVESTMENT PLAN
Canadian resident registered shareholders of CAE Inc.who wish to receive dividends in the form of CAE Inc.common shares rather than a cash payment may participate in CAE’s dividend reinvestment plan. In orderto obtain the dividend reinvestment plan form pleasecontact Computershare Trust Company of Canada.
DIRECT DEPOSIT DIVIDEND
Canadian resident registered shareholders of CAE Inc.who receive cash dividends may elect to have the dividend payment deposited directly to their bankaccounts instead of receiving a cheque. In order toobtain the direct deposit dividend form please contactComputershare Trust Company of Canada.
DUPLICATE MAILINGS
To eliminate duplicate mailings by consolidatingaccounts, registered shareholders must contactComputershare Trust Company of Canada; non-registered shareholders must contact their brokers.
FISCAL 2005 TENTATIVE QUARTERLY RESULTS
RELEASE DATES
• August 11, 2004• November 4, 2004• February 3, 2005• May 11, 2005
Quarterly and annual reports as well as other corporatedocuments are available on our website: www.cae.com.These documents can also be obtained from ourInvestor Relations department.
INVESTOR RELATIONS
Andrew C. ArnovitzDirector, Corporate Communications and Investor RelationsCAE Inc.8585 Cote-de-LiesseP.O. Box 1800Saint-Laurent, Quebec H4L 4X4Tel: [email protected]
VERSION FRANÇAISE
Pour obtenir la version française du rapport annuel,s’adresser à [email protected].
2004 ANNUAL MEETING
The Annual Meeting of Shareholders will be held at10:30 a.m. (local time), Wednesday, August 11, 2004, at the International Civil Aviation Organization, 999 University Street, Room 3, Montreal, Quebec. The meeting will also be webcast live on our website at www.cae.com.
AUDITORS
PricewaterhouseCoopers Chartered AccountantsMontreal, Quebec
TRADEMARKS
The CAE logo, and the terms CAE Simfinity, CAE Sim XXI,CAE Tropos and CAE Medallion-S are all trademarks ofCAE or its subsidiaries.
INT
ER
BR
AN
D,
TO
RO
NT
O
P
RIN
TE
D I
N C
AN
AD
A

Annual Report for the year ended March 31, 2004
ESSENTIAL FOCUS
www.cae.com
CA
E A
nn
ual R
epo
rt for th
e year end
ed M
arch 31, 2004