cabot corporation 2016 annual report
TRANSCRIPT

CABOT CORPORATION 2016 ANNUAL REPORT

PERFORMANCETHAT MAKES A DIFFERENCE

PERFORMANCETHAT MAKES A DIFFERENCE

ADVANCING INNOVATION AND CREATING DIFFERENTIATING SOLUTIONS THAT DELIVER BREAKTHROUGH PERFORMANCE.Cabot Corporation is a leading global specialty chemicals and performance materials company headquartered in Boston, Massachusetts, USA.
We build on our market leadership by collaborating with customers across a broad range of industries such as transportation, infrastructure, environment and consumer goods to address important unmet needs in key applications —providing exceptional quality and performance that create value and a competitive advantage.
Our global network consists of 44 manufacturing facilities in 21 countries. All are joined by our commitment and continued dedication to safety, health and environmental leadership and progress.
4 CABOT CORPORATION 2016 ANNUAL REPORT

OUR BUSINESS SEGMENTS
Reinforcement Materials Rubber Blacks; Elastomer Composites Carbon black to reinforce and optimize the performance of rubber products including: tires, hoses, belts, molded goods
Performance ChemicalsSpecialty Carbons and Formulations; Metal OxidesSpecialty additives that enable performance in: plastics, wire and cable, toners, coatings, adhesives and sealants, electronics, batteries, inks, inkjet printing, composites, silicones, building construction materials, industrial insulation
Purification SolutionsActivated CarbonActivated carbon for purification in various applications including: air and water, food and beverages, pharmaceuticals, catalysts
Specialty FluidsCesium Formate Brines; Fine Cesium ChemicalsAdvanced cesium products for use in: oil and gas well drilling and completion fluids, catalysts, titanium dioxide, glass, automotive brazing fluids
CABOT CORPORATION 2016 ANNUAL REPORT 5

Fiscal 2016 was a year of change, transition and growth for Cabot Corporation.
The global markets in which we participate are evolving, driven by macro
trends such as increased mobility, rapid expansion of the middle class in
emerging markets, growth in construction and infrastructure development
and continued focus and attention on improvements in sustainability. All of
these macro trends directly touch the products we offer today and provide
significant opportunities for growth and technology innovation going forward.
A MESSAGE TO OUR SHAREHOLDERS
“Our vision is to be the
most innovative, respected
and responsible leader in
our markets —delivering
performance that makes
a difference.”
6 CABOT CORPORATION 2016 ANNUAL REPORT

These opportunities, combined with Cabot’s deep market experience and organizational capabilities, shaped the development of a new vision and strategy for our company. Accompanying this strategy is a set of financial goals and a capital allocation framework that together supports the changing needs of our customers, the global nature of our business and our inherent ability to adapt and grow.
Four core principles will serve as the foundation of our new strategy.
u Growth is fundamental to the long-term health and success of an enterprise. Achieving growth is more challenging in today’s global economy; however, Cabot’s market leadership and balanced geographic exposure are fundamental to capturing opportunities.
u Materials innovation will continue to drive and enable incredible advancements in our world, but the nature of innovation is changing. Customers care about delivering performance and our ability to innovate based on a deep understanding of the application and the value chain remains a competitive advantage.
u As an asset intensive company, cash flow generation and capital allocation are critical to driving superior returns. We will operate our businesses with these themes at the core and with rigorous discipline around execution.
u Finally, talent matters. Everything we do is built on a culture that realizes the full power of our people. Cabot has built an exceptional global organization—a team of smart, ambitious, entrepreneurial and collaborative people. This is Cabot and our commitment to talent development will form the foundation that drives our performance.
We are confident in our ability to deliver on these core principles given this great company’s legacy of leadership—leadership in our markets, an unparalleled global footprint, technology innovation that has created breakthroughs in a broad range of applications and a pioneering spirit that has put us first on so many occasions.
VISION
STRATEGY VALUES
CABOT CORPORATION 2016 ANNUAL REPORT 7

Our vision is to: “be the most innovative, respected and responsible leader in our markets—delivering performance that makes a difference.”
We recognize that innovation is the key to differentiation and will drive long-term superior returns. As such, we intend to advance our legacy of leadership here. We will continue to build on the trust and respect that we have earned from our customers and partners to create a shared dynamic for growth. In addition, we also see that environmental and sustainability pressures will increasingly intensify globally. As the leader in our markets, we will be responsible in everything we do from product stewardship to safety and environmental performance.
Our new vision defines our aspiration for the company. It also unites us in our goals and provides clear direction so that our employees and external stakeholders understand what we are trying to achieve. We will bring this vision to life by driving our new corporate strategy called “Advancing the Core,” which aims to “extend our leadership in performance materials” by driving three key themes:
1. Invest for growth in our core businesses,
2. Drive application innovation with our customers, and
3. Generate strong cash flows through efficiency and optimization.
Leadership matters and we intend to aggressively pursue opportunities to expand our positions across each of our businesses. The winning customers in each of our markets want to partner with Cabot because they know we are committed to their long-term success and have the capabilities to innovate and serve them globally. Through our new strategy, we will:
u Invest to deepen our position in our core markets and enhance our portfolio with new and differentiated products.
u Pursue bolt-on acquisitions where we have a track record of success and a clear playbook to access synergies.
u Deepen our application understanding and pursue innovative formulation solutions in order to create greater value for our customers.
u Aggressively pursue best-in-class capital efficiency, both in our working and fixed assets, as part of our key managerial objective of cash flow generation.
The objective of our strategy is to deliver sustained and attractive total shareholder return (TSR). Our TSR package is built on top-line growth consistent with our end markets and leveraging that into 7 – 10% adjusted earnings per share (EPS) growth over time. We will invest 50% of our discretionary free cash flow in growth and return 50% to shareholders in the form of dividends and share repurchases. We are confident that this clear, balanced and disciplined approach to capital allocation will result in sustained and attractive returns for our shareholders.
A NEW DIRECTION FOR OUR FUTURE
8 CABOT CORPORATION 2016 ANNUAL REPORT
Generate strong cash flows through efficiency
and optimization
Drive application innovation with
our customers
Invest for growth in our core business

In 2016, we returned to profitability growth and accomplished a number of key strategic initiatives. After a disappointing year in 2015, we demonstrated a significant recovery in financial performance with adjusted EPS growing 16% to $3.14. Coupled with this improvement in earnings was a very strong year in cash flow performance, as we generated discretionary free cash flow of $252 million. This solid cash flow performance enabled us to increase the quarterly dividend in May by 36% to $0.30 as part of our new capital allocation framework.
Our performance improvement was underpinned by several noteworthy achievements. The Performance Chemicals segment continued its impressive performance, generating its third straight year of record earnings. This result reflects the strength of our leading portfolio and our commitment to growth through application innovation with our customers. The Reinforcement Materials segment improved results in each quarter of fiscal year 2016 and is well positioned to continue this trend into 2017. In our Purification Solutions segment, we ended the year with an improving profitability picture and more visibility into the future as mercury removal volumes ramped up. Looking ahead, we have plans in place to drive continued profit growth in this segment. Finally, as a company, we set a cost reduction target of $50 million and exceeded that objective through the hard work of our entire global team.
On the strategic front, we accomplished a number of key milestones that are critical for the delivery of our new strategy. We entered into a joint venture to build a new fumed silica plant in China with Hengyecheng Silicone Co., Ltd. This investment will ensure that we continue to grow our global position in this high value strategic product line.
We also announced an investment to expand capacity in our Specialty Compounds business for conductive and specialty formulations and continued new product adoptions in strategic applications such as energy materials and structural adhesives. Finally, we celebrated the groundbreaking of a new Asia Technology Center which underpins our dedication to application innovation. The new facility is evidence of our commitment to developing deeper application understanding and delivering innovative formulation solutions to our customers. Each of these strategic growth investments is underpinned by our continued commitment to our corporate Commercial Excellence initiative. During the year, we fully implemented a new Customer Relationship Management (CRM) platform, which serves as a foundation for our key account management and strategic marketing efforts.
Overall, I am pleased with the progress we have made this past year. Our disciplined execution led to TSR performance in fiscal 2016 in the top decile of our peer group. Going forward, I have full confidence in our ability to deliver attractive returns based on the continued focus and execution of our new strategy.
PERFORMANCE—A RETURN TO EARNINGS GROWTH IN 2016
CABOT CORPORATION 2016 ANNUAL REPORT 9

10 CABOT CORPORATION 2016 ANNUAL REPORT
In March 2016, I took on the leadership of our remarkable company. I want to thank Patrick Prevost for his eight years of leadership and wish him a healthy and fulfilling
retirement. Due to his foresight and commitment, we have an outstanding foundation to build the next phase of growth for Cabot.
Acting responsibly and being a leader in SH&E remain paramount to who we are as a company and are anchored in our company values. This past year, we continued to perform at world-class levels and maintained our leadership position among our industry peers.
We advanced our safety performance, having improved in every metric over fiscal year 2015 results. We reduced recordable injuries by 20% and our total recordable injury rate by 12%. Specifically, I’m pleased with the continued efforts made by our Purification Solutions team in this area. The segment alone reduced its number of recordable injuries by approximately 65% compared to fiscal year 2015. With numbers like these, Cabot is operating in the top quartile of manufacturing companies based on the general industry average performance.
As a signatory of the United Nations Global Compact (UNGC), we issued our first Communication on Progress in accordance with our commitment to the UNGC. Further
showcasing our commitment to continued progress in the areas of human rights, labor, environment and anti-corruption, we introduced a standalone Human Rights Policy. This policy covers fundamental aspects of human rights consistent with leading global guidelines which helps to ensure that our expectations are clear to employees and suppliers.
I am incredibly proud of our long-term performance in SH&E and I know our discipline in this area supports our operational effectiveness in terms of quality, consistency and supply chain reliability. There will always be more to do to reach our vision of zero incidents, but I believe our efforts to enhance our already world-class performance have made us a stronger and more competitively advantaged company and will continue to do so in the future.
I would also like to recognize and express my deep appreciation to our Board member, Dr. Lydia Thomas, who will retire at our 2017 Annual Meeting after 22 years of service. During her tenure, Lydia has chaired our Safety, Health and Environment Committee and her commitment and high standards have been instrumental in our achievement of our best-in-class SH&E performance.
PERFORMANCE AND GLOBAL LEADERSHIP IN SAFETY, HEALTH AND ENVIRONMENT (SH&E)
LEADERSHIP TRANSITION
20% reduction in recordable injuries

CABOT CORPORATION 2016 ANNUAL REPORT 11
In closing, I want to thank our dedicated team from around the world for their hard work during 2016 and for their support during our leadership transition. We accomplished a great deal in 2016 and we are well positioned to bring to life our vision of “delivering performance that makes a difference.”
We live in an evolving world where our key stakeholders —shareholders, customers, employees, partners and communities—expect even more of us and we will continue to deliver. Our success in 2016 was the result of a clear growth strategy and outstanding execution by our team. We will continue to drive our growth agenda with an aim
2017 PRIORITIES
of delivering attractive returns for our shareholders. This is our goal and the whole company is committed to it. I look forward to reporting on our progress in 2017 as we continue to advance our strategy. Sincerely,
Sean D. KeohanePresident and Chief Executive Officer

(dollars in USD millions, except per share amounts)
Fiscal Year 2014 2015 2016
Operating Results
Operating revenues $3,647 $2,871 $2,411
Net income (loss) attributable to Cabot Corporation* $199 $(334) $149
Per diluted common share* $3.03 $(5.27) $2.36
Adjusted earnings per share** $3.43 $2.71 $3.14
Financial Positions
Total assets $4,084 $3,075 $3,044
Net property, plant and equipment $1,581 $1,383 $1,290
Stockholders’ equity $2,064 $1,338 $1,372
* fiscal 2015 includes the impact of the Purification Solutions’ impairment charges** Non-GAAP financial measure, excludes financial results of divested businesses and certain items
0
50
100
150
200
250
300
350
400
450
201620152014
* Non-GAAP financial measure, excludes financial results of divested businesses and certain items. Refer to Non-GAAP reconciliations on pages 14 & 15 for a reconciliation of these measures to their most directly comparable GAAP financial measures.
Adjusted EBIT ($M)*$M/fiscal year
0
0.5
1
1.5
2
2.5
3
3.5
201620152014
Adjusted Earnings Per Share ($)*$ per share/fiscal year
CABOT CORPORATION FINANCIAL HIGHLIGHTS
12 CABOT CORPORATION 2016 ANNUAL REPORT

CABOT CORPORATION 2016 ANNUAL REPORT 13
PERFORMANCE GRAPH The graph compares the cumulative total shareholder return on Cabot common stock for the five-year period ending September 30, 2016 with the S&P 500 Chemicals Index, the S&P 500 Index and the S&P Midcap 400 Index. The comparisons assume the investment of $100 on October 1, 2011 in Cabot’s common stock and in each of the indices and the reinvestment of all dividends.
0
50
100
150
200
250
201620152014201320122011
Cabot Corportation S&P 500 Chemicals Index S&P 500 Index S&P 500 Midcap 400 IndexCabot Corporation S&P Midcap 400 IndexS&P 500 Chemicals Index S&P 500 Index
Comparison of Five-Year Cumulative Total Shareholder Return
September 30 2011 2012 2013 2014 2015 2016
Cabot Corportation $100 $150.69 $179.65 $216.92 $137.80 $234.05
S&P 500 Chemicals Index $100 $137.16 $172.15 $211.65 $177.37 $212.04
S&P 500 Index $100 $130.20 $155.39 $186.05 $184.91 $213.44
S&P Midcap 400 Index $100 $128.54 $164.12 $183.51 $186.07 $214.59
FINANCIAL PERFORMANCE

14 CABOT CORPORATION 2016 ANNUAL REPORT
NON-GAAP RECONCILIATIONS Adjusted EPS, adjusted EBIT and discretionary free cash flow are not measures of financial performance under U.S. generally accepted accounting principles (GAAP) and should not be considered in isolation from, or as replacements for, earnings per share from continuing operations or income from continuing operations before taxes determined in accordance with GAAP, nor as substitutes for measures of profitability or performance reported in accordance with GAAP. These non-GAAP measures exclude certain items of expense or income that management does not consider representative of our ongoing performance. The following tables reconcile non-GAAP measures used in this report to the closest GAAP measure, or explain our calculations.
Reconciliation of Adjusted Earnings Per Share (EPS)
Per Share / Fiscal Year 2012 2013 2014 2015* 2016
Net income (loss) per share attributable to Cabot Corporation $5.99 $2.36 $3.03 $(5.27) $2.36
Less: Net income (loss) per share from discontinued operations $3.15 $(0.01) $0.02 $0.02 $0.02
Net income (loss) per share from continuing operations $2.84 $2.37 $3.01 $(5.29) $2.34
Less: Certain items per share and dilutive impact of shares $(0.49) $(0.56) $(0.42) $(8.00) $(0.80)
Adjusted earnings per share $3.33 $2.93 $3.43 $2.71 $3.14
* fiscal 2015 earnings includes the impact of the Purification Solutions impairment charge
FINANCIAL PERFORMANCE

Reconciliation of Discretionary Free Cash Flow
Dollars in Millions / Fiscal Year 2012 2013 2014 2015 2016
Cash flow from operating activities (1) $415 $419 $315 $499 $392
Less: Changes in net working capital (2) $76 $80 $(139) $137 $49
Less: Sustaining and compliance capital expenditures $140 $116 $137 $102 $91
Discretionary Free Cash Flow $199 $223 $317 $260 $252
(1) As provided in the Consolidated Statement of Cash Flows for the periods presented.(2) Defined as changes in accounts receivable, inventory and accounts payable and accrued liabilities as presented on the
Consolidated Statement of Cash Flows for the periods presented.
* fiscal 2015 earnings includes the impact of the Purification Solutions impairment charge
Reconciliation of Adjusted EBIT
Dollars in Millions / Fiscal Year 2012 2013 2014 2015* 2016
Income (loss) from continuing operations before income taxes and equity in earnings of affiliated companies
$246 $210 $308 $(377) $194
Interest expense $46 $62 $55 $53 $54
Certain items $51 $54 $28 $617 $81
General unallocated expense — $1 $2 $(11) $(7)
Equity in earnings of affiliated companies $11 $11 — $4 $3
Adjusted EBIT $354 $338 $393 $286 $325
CABOT CORPORATION 2016 ANNUAL REPORT 15

OUR LEADERSHIP
BOARD OF DIRECTORS
John F. O’Brien(Non-Executive Chairman of the Board)retired President and Chief Executive Officer, Allmerica Financial Corporation (holding company for insurance and other financial services)
MANAGEMENT EXECUTIVE COMMITTEE
Sean D. KeohanePresident and Chief Executive Officer, Cabot Corporation
Juan EnriquezChairman and Chief Executive Officer, Biotechonomy Ventures (life sciences research and investment firm)
William C. KirbySpangler Family Professor of Business Administration, Harvard Business School and T.M. Chang Professor of China Studies, Harvard University
Roderick C.G. MacLeod Co-founder and Principal, Waverley Investments Ltd., and St. Martins Finance Ltd. (private equity investment companies)
John K. McGillicuddyretired Audit Partner, KPMG, LLP (global provider of audit, tax and advisory services)
Patrick M. Prevostretired President and Chief Executive Officer, Cabot Corporation
Sue H. Ratajretired Chief Executive, Petrochemicals, BP plc (global energy company)
Lydia W. Thomasretired President and Chief Executive Officer, Noblis, Inc. (nonprofit science, technology and strategy organization)
Matthias L. Wolfgruberretired Chief Executive Officer, Altana AG (specialty chemicals company)
Mark S. WrightonChancellor, Washington University in St. Louis
Sean D. KeohanePresident and Chief Executive Officer
Brian A. BerubeSenior Vice President and General Counsel; Interim Chief Human Resources Officer
Eduardo E. CordeiroExecutive Vice President and Chief Financial Officer; President, Americas Region
Nicholas S. CrossExecutive Vice President and President, Performance Chemicals and Specialty Fluids Segments; President, Europe, Middle East and Africa (EMEA) Region
John R. DoubmanSenior Vice President, Corporate Strategy and Development
Hobart C. KalksteinSenior Vice President and President, Reinforcement Materials Segment
Yakov KutsovskySenior Vice President, Research and Development (R&D), and Chief Technology Officer
Martin J. O’NeillSenior Vice President, Safety, Health and Environment (SH&E)
Friedrich von GottbergSenior Vice President and President, Purification Solutions Segment
Jeff ZhuSenior Vice President and President, Asia Pacific Region
16 CABOT CORPORATION 2016 ANNUAL REPORT

UNITED STATES SECURITIES AND EXCHANGE COMMISSIONWashington, D.C. 20549
Form 10-KANNUAL REPORT PURSUANT TO SECTION 13 OR 15(d) OF THE SECURITIES EXCHANGE ACT OF 1934For the fiscal year ended September 30, 2016
or
TRANSITION REPORT PURSUANT TO SECTION 13 OR 15(d) OF THE SECURITIES EXCHANGE ACT OF1934For the transition period from to
Commission file number 1-5667
Cabot Corporation(Exact name of Registrant as specified in its charter)
Delaware 04-2271897(State or other jurisdiction ofincorporation or organization)
(I.R.S. EmployerIdentification No.)
Two Seaport Lane, Suite 1300Boston, Massachusetts 02210
(Address of Principal Executive Offices) (Zip Code)
(617) 345-0100(Registrant’s telephone number, including area code)
Securities registered pursuant to Section 12(b) of the Act:Title of Each Class Name of Each Exchange on Which Registered
Common stock, $1.00 par value per share New York Stock ExchangeIndicate by check mark if the Registrant is a well-known seasoned issuer, as defined in Rule 405 of the Securities Act. Yes
NoIndicate by check mark if the Registrant is not required to file reports pursuant to Section 13 or Section 15(d) of the
Act. Yes NoIndicate by check mark whether the Registrant (1) has filed all reports required to be filed by Section 13 or 15(d) of the
Securities Exchange Act of 1934 during the preceding 12 months (or for such shorter period that the Registrant was required to filesuch reports), and (2) has been subject to such filing requirements for the past 90 days. Yes No
Indicate by check mark whether the registrant has submitted electronically and posted on its corporate Web site, if any, everyInteractive Data File required to be submitted and posted pursuant to Rule 405 of Regulation S-T (§232.405 of this chapter) during thepreceding 12 months (or for such shorter period that the registrant was required to submit and post such files). Yes No
Indicate by check mark if disclosure of delinquent filers pursuant to Item 405 of Regulation S-K is not contained herein, andwill not be contained, to the best of the Registrant’s knowledge, in definitive proxy or information statements incorporated byreference in Part III of this Form 10-K or any amendment to this Form 10-K.
Indicate by check mark whether the Registrant is a large accelerated filer, an accelerated filer, a non-accelerated filer or asmaller reporting company. See definitions of “large accelerated filer,” “accelerated filer” and “smaller reporting company” inRule 12b-2 of the Exchange Act.Large accelerated filer Accelerated filerNon-accelerated filer (Do not check if a smaller reporting company) Smaller reporting company
Indicate by check mark whether the Registrant is a shell company (as defined in Rule 12b-2 of the ExchangeAct). Yes No
As of the last business day of the Registrant’s most recently completed second fiscal quarter (March 31, 2016), the aggregatemarket value of the Registrant’s common stock held by non-affiliates was $2,989,125,149. As of November 18, 2016, there were62,332,802 shares of the Registrant’s common stock outstanding.
DOCUMENTS INCORPORATED BY REFERENCEPortions of the Registrant’s definitive proxy statement for its 2017 Annual Meeting of Shareholders are incorporated by
reference into Part III of this annual report on Form 10-K.

2
TABLE OF CONTENTS
PART IITEM 1. Business........................................................................................................................................................................... 3
ITEM 1A. Risk Factors ..................................................................................................................................................................... 10
ITEM 1B. Unresolved Staff Comments ........................................................................................................................................... 15
ITEM 2. Properties........................................................................................................................................................................ 15
ITEM 3. Legal Proceedings............................................................................................................................................................ 17
ITEM 4. Mine Safety Disclosures .................................................................................................................................................. 18
PART II
ITEM 5. Market for Registrant’s Common Equity, Related Stockholder Matters and Issuer Purchases of Equity Securities ...... 20
ITEM 6. Selected Financial Data ................................................................................................................................................... 20
ITEM 7. Management’s Discussion and Analysis of Financial Condition and Results of Operations ........................................... 24
ITEM 7A. Quantitative and Qualitative Disclosures About Market Risk......................................................................................... 42
ITEM 8. Financial Statements and Supplementary Data.............................................................................................................. 43
ITEM 9. Changes in and Disagreements with Accountants on Accounting and Financial Disclosure .......................................... 94
ITEM 9A. Controls and Procedures................................................................................................................................................. 94
ITEM 9B. Other Information........................................................................................................................................................... 94
PART III
ITEM 10. Directors, Executive Officers and Corporate Governance ............................................................................................... 95
ITEM 11. Executive Compensation ................................................................................................................................................. 95
ITEM 12. Security Ownership of Certain Beneficial Owners and Management and Related Stockholder Matters ............................ 95
ITEM 13. Certain Relationships and Related Transactions, and Director Independence ............................................................... 95
ITEM 14. Principal Accounting Fees and Services ........................................................................................................................... 95
PART IV
ITEM 15. Exhibits, Financial Statement Schedules.......................................................................................................................... 96
Signatures........................................................................................................................................................................................... 99
Exhibit Index....................................................................................................................................................................................... 100

3
Information Relating to Forward-Looking Statements
This annual report on Form 10-K contains “forward-looking statements” under the Federal securities laws. These forward-looking statements include statements relating to our expectations regarding our future business performance and overallprospects; demand for our products; when we expect construction of the fumed silica plant in Wuhai, China by our new jointventure to be completed and when we expect to open our new Asia Technology Center in Shanghai, China; the sufficiency of ourcash on hand, cash provided from operations and cash available under our credit and commercial paper facilities to fund our cashrequirements; anticipated capital spending, including environmental-related capital expenditures; cash requirements and uses ofavailable cash, including future cash outlays associated with long-term contractual obligations, restructurings, contributions toemployee benefit plans, environmental remediation costs and future respirator liabilities; exposure to interest rate and foreignexchange risk; future benefit plan payments we expect to make; future amortization expenses; our expected tax rate for fiscal 2017;our ability to recover deferred tax assets; and the possible outcome of legal and environmental proceedings. From time to time, wealso provide forward-looking statements in other materials we release to the public and in oral statements made by authorizedofficers.
Forward-looking statements are based on our current expectations, assumptions, estimates and projections about Cabot’sbusinesses and strategies, market trends and conditions, economic conditions and other factors. These statements are notguarantees of future performance and are subject to risks, uncertainties, potentially inaccurate assumptions, and other factors,some of which are beyond our control and difficult to predict. If known or unknown risks materialize, or should underlyingassumptions prove inaccurate, our actual results could differ materially from past results and from those expressed in the forward-looking statements. Important factors that could cause our actual results to differ materially from those expressed in our forward-looking statements are described in Item 1A in this report.
We undertake no obligation to publicly update forward-looking statements, whether as a result of new information, futureevents or otherwise, except as required by law. Investors are advised, however, to consult any further disclosures we make onrelated subjects in our 10-Q and 8-K reports filed with the Securities and Exchange Commission (the “SEC”).
PART I
Item 1. Business
General
Cabot is a global specialty chemicals and performance materials company headquartered in Boston, Massachusetts. Ourprincipal products are rubber and specialty grade carbon blacks, specialty compounds, fumed metal oxides, activated carbons, inkjetcolorants, aerogel, and cesium formate drilling fluids. Cabot and its affiliates have manufacturing facilities and operations in theUnited States and over 20 other countries. Cabot’s business was founded in 1882 and incorporated in the State of Delaware in 1960.The terms “Cabot”, “Company”, “we”, and “our” as used in this report refer to Cabot Corporation and its consolidated subsidiaries.
Our vision is to be the most innovative, respected and responsible leader in our markets – delivering performance that makesa difference. Our strategy is to extend our leadership in performance materials by investing for growth in our core businesses,driving application innovation with our customers, and generating strong cash flows through efficiency and optimization. Ourproducts are generally based on technical expertise and innovation in one or more of our four core competencies: making andhandling very fine particles; modifying the surfaces of very fine particles to alter their functionality; designing particles to impartspecific properties to a formulation; and combining particles with other ingredients to deliver a formulated performanceintermediate or composite. We focus on creating particles with the composition, morphology, and surface functionalities, andcreating formulations of those particles, to deliver the requisite performance to support our customers’ existing and emergingapplications.
Our four business segments are: Reinforcement Materials; Performance Chemicals; Purification Solutions; and Specialty Fluids.The business segments are discussed in more detail later in this section. Financial information about our business segments appearsin Management’s Discussion and Analysis of Financial Condition and Results of Operations in Item 7 below (“MD&A”) and in Note Uof the Notes to our Consolidated Financial Statements in Item 8 below (“Note U”).
Our internet address is www.cabotcorp.com. We make available free of charge on or through our website our annual reportson Form 10-K, quarterly reports on Form 10-Q, current reports on Form 8-K, and amendments to those reports filed or furnishedpursuant to Section 13(a) or 15(d) of the Securities Exchange Act of 1934 as soon as reasonably practicable after electronically filingsuch material with, or furnishing it to, the SEC. Information appearing on our website is not a part of, and is not incorporated in, thisAnnual Report on Form 10-K.

4
Reinforcement Materials
Products
Carbon black is a form of elemental carbon that is manufactured in a highly controlled process to produce particles andaggregates of varied structure and surface chemistry, resulting in many different performance characteristics for a wide variety ofapplications. Rubber grade carbon blacks are used to enhance the physical properties of the systems and applications in which theyare incorporated.
Our rubber blacks products are used in tires and industrial products. Rubber blacks have traditionally been used in the tireindustry as a rubber reinforcing agent to increase tread durability and are also used as a performance additive to reduce rollingresistance and improve traction. In industrial products such as hoses, belts, extruded profiles and molded goods, rubber blacks areused to improve the physical performance of the product, including the product’s physical strength, fluid resistance, conductivityand resistivity.
In addition to our rubber blacks products, we manufacture compounds of carbon black and rubber using our patentedelastomer composites manufacturing process. These compounds improve abrasion/wear resistance, reduce fatigue and reducerolling resistance compared to carbon black/rubber compounds made by conventional dry mix methods.
Sales and Customers
Sales of rubber blacks products are made by Cabot employees and through distributors and sales representatives. Sales tothree major tire customers represent a material portion of Reinforcement Materials’ total net sales and operating revenues. The lossof any of these customers, or a significant reduction in volumes sold to them, could have a material adverse effect on the Segment.
Under appropriate circumstances, we have entered into supply contracts with certain customers, the typical duration of whichis one year. Many of these contracts provide for sales price adjustments to account for changes in relevant feedstock indices and, insome cases, changes in other relevant costs (such as the cost of natural gas). In fiscal 2016, approximately half of our rubber blacksvolume was sold under these supply agreements. The majority of the volumes sold under these agreements are sold to customers inNorth America and Europe.
We have licensed our patented elastomer composites manufacturing process to Manufacture Francaise des PneumatiquesMichelin for their exclusive use in tire applications through fiscal 2017. As consideration, we receive quarterly royalty paymentsextending through calendar year 2022.
Much of the rubber blacks we sell is used in tires and automotive products and, therefore, our financial results may beaffected by the cyclical nature of the automotive industry. However, a large portion of the market for our products is in replacementtires that historically have been less subject to automotive industry cycles.
Competition
We are one of the leading manufacturers of carbon black in the world. We compete in the manufacture of carbon blackprimarily with two companies with a global presence and numerous other companies that operate regionally, some of which exportproduct outside their region. Competition for products within Reinforcement Materials is based on product performance, quality,reliability, price, service, technical innovation, and logistics. We believe our product differentiation, technological leadership, globalmanufacturing presence, operations and logistics excellence and customer service provide us with a competitive advantage.
Raw Materials
The principal raw material used in the manufacture of carbon black is a portion of the residual heavy oils derived frompetroleum refining operations, the distillation of coal tars, and the production of ethylene throughout the world. Natural gas is alsoused in the production of carbon black. Raw materials are, in general, readily available and in adequate supply. Raw material costsgenerally are influenced by the availability of various types of carbon black feedstock and natural gas, supply and demand of suchraw materials, and related transportation costs. Importantly, movements in the market price for crude oil typically affect carbonblack feedstock costs.
Operations
We own, or have a controlling interest in, and operate plants that produce rubber blacks in Argentina, Brazil, Canada, China,Colombia, the Czech Republic, France, Indonesia, Italy, Japan, Mexico, The Netherlands and the United States. Our equity affiliateoperates a carbon black plant in Venezuela.

5
The following table shows our ownership interest as of September 30, 2016 in rubber blacks operations in which we own lessthan 100%:Location Percentage Interest
Shanghai, China 70% (consolidated subsidiary)Tianjin, China 70% (consolidated subsidiary)Xingtai City, China 60% (consolidated subsidiary)Valasske Mezirici (Valmez), Czech Republic 52% (consolidated subsidiary)Cilegon, Indonesia 97% (consolidated subsidiary)Valencia, Venezuela 49% (equity affiliate)
Performance Chemicals
Performance Chemicals is composed of two businesses: (i) our Specialty Carbons and Formulations business, whichmanufactures and sells specialty grades of carbon black, specialty compounds and inkjet colorants, and (ii) our Metal Oxidesbusiness, which manufactures and sells fumed silica, fumed alumina and dispersions thereof and aerogel. In Performance Chemicals,we design, manufacture and sell materials that deliver performance in a broad range of customer applications across theautomotive, construction and infrastructure, energy, inkjet printing, electronics, and consumer products sectors.
Products
Specialty Carbons and Formulations Business
Carbon black is a form of elemental carbon that is manufactured in a highly controlled process to produce particles andaggregates of varied structure and surface chemistry, resulting in many different performance characteristics for a wide variety ofapplications.
Our specialty grades of carbon black are used to impart color, provide rheology control, enhance conductivity and staticcharge control, provide UV protection, enhance mechanical properties, and provide formulation flexibility through surfacetreatment. These specialty carbon products are used in a wide variety of applications, such as inks, coatings, plastics, adhesives,toners, batteries, and displays.
Our masterbatch and conductive compound products, which we refer to as “specialty compounds”, are formulations derivedfrom specialty grades of carbon black mixed with polymers and other additives. These products are generally used by plastic resinproducers and converters in applications for the automotive, industrial, packaging, consumer products, and electronics industries. Asan alternative to directly mixing specialty carbon blacks, these formulations offer greater ease of handling and help customersachieve their desired levels of dispersion and color and manage the addition of small doses of additives. In addition, our electricallyconductive compound products generally are used to reduce risks associated with electrostatic discharge in plastics applications.
Our inkjet colorants are high-quality pigment-based black and color dispersions based on our patented carbon black surfacemodification technology. The dispersions are used in aqueous inkjet inks to impart color, sharp print characteristics and durability,while maintaining high printhead reliability. These products are used in various inkjet printing applications, including commercialprinting, small office/home office and corporate office, and niche applications that require a high level of dispersibility and colloidalstability. Our inkjet inks, which utilize our pigment-based colorant dispersions, are used in the commercial printing segment fordigital print.
Metal Oxides Business
Fumed silica is an ultra-fine, high-purity particle used as a reinforcing, thickening, abrasive, thixotropic, suspending or anti-caking agent in a wide variety of products for the automotive, construction, microelectronics, batteries, and consumer productsindustries. These products include adhesives, sealants, cosmetics, inks, toners, silicone rubber, coatings, polishing slurries andpharmaceuticals. Fumed alumina, also an ultra-fine, high-purity particle, is used as an abrasive, absorbent or barrier agent in avariety of products, such as inkjet media, lighting, coatings, cosmetics and polishing slurries.
Aerogel is a hydrophobic, silica-based particle with a high surface area that is used in a variety of thermal insulation andspecialty chemical applications. In the building and construction industry, the product is used in insulative sprayable plasters andcomposite building products, as well as translucent skylight, window, wall and roof systems for insulating eco-daylightingapplications. In the specialty chemicals industry, the product is used to provide matte finishing, insulating and thickening propertiesfor use in a variety of applications.

6
Sales and Customers
Sales of these products are made by Cabot employees and through distributors and sales representatives. In our SpecialtyCarbons and Formulations business, sales are generally to a broad number of customers. In our Metal Oxides business, sales underlong-term contracts with two customers have accounted for a substantial portion of the revenue.
Competition
We are a leading producer of the products we sell in this segment. We compete in the manufacture of carbon black primarilywith two companies with a global presence and several other companies that have a regional presence, some of which exportproduct outside their region. We compete with several companies that produce specialty compounds, primarily in Europe, theMiddle East and Asia. Our inkjet colorants and inks are designed to replace traditional pigment dispersions and dyes used in inkjetprinting applications. Competitive products for inkjet colorants are organic dyes and other dispersed pigments manufactured andmarketed by large chemical companies and small independent producers. For fumed silica, we compete primarily with twocompanies with a global presence and several other companies which have a regional presence. For aerogel, we compete principallywith one other company that produces aerogel products. We also compete with non-aerogel insulation products manufactured byregional companies throughout the world.
Competition for our products is based on product performance, quality, reliability, service, technical innovation and price. Webelieve our product differentiation, technological leadership, operations excellence and customer service provide us with acompetitive advantage.
Raw Materials
Raw materials for our products are, in general, readily available and in adequate supply. The principal raw material used in themanufacture of carbon black is a portion of the residual heavy oils derived from petroleum refining operations, the distillation ofcoal tars, and the production of ethylene throughout the world. Natural gas is also used in the production of carbon black. These rawmaterial costs generally are influenced by the availability of various types of carbon black feedstock and natural gas, supply anddemand of such raw materials, and related transportation costs. Importantly, movements in the market price for crude oil typicallyaffect carbon black feedstock costs. The primary raw materials used for our specialty compounds include carbon black sourced fromour carbon black plants, thermoplastic resins and mineral fillers from various sources. Raw materials for inkjet colorants includecarbon black sourced from our carbon black plants, organic pigments and other treating agents available from various sources. Rawmaterials for inkjet inks include pigment dispersions, solvents and other additives.
Raw materials for the production of fumed silica are various chlorosilane feedstocks. We purchase feedstocks and for somecustomers convert their feedstock to product on a fee-basis (so called “toll conversion”). We also purchase aluminum chloride asfeedstock for the production of fumed alumina. We have long-term procurement contracts or arrangements in place for thepurchase of fumed silica feedstock, which we believe will enable us to meet our raw material requirements for the foreseeablefuture. In addition, we buy some raw materials in the spot market to help ensure flexibility and minimize costs. The principal rawmaterials for the production of aerogel are silica sol and/or sodium silicate.
Operations
We own, or have a controlling interest in, and operate plants that produce specialty grades of carbon black primarily in China,The Netherlands and the United States. Our specialty compounds are produced in facilities that we own, or have a controllinginterest in, located in Belgium, China and the United Arab Emirates. Our inkjet colorants and inks are manufactured at our facility inHaverhill, Massachusetts. We also own, or have a controlling interest in, manufacturing plants that produce fumed metal oxides inthe United States, China, the United Kingdom, and Germany and a manufacturing plant that produces aerogel in Frankfurt,Germany. An equity affiliate operates a fumed metal oxides plant in Mettur Dam, India.
The following table shows our ownership interest as of September 30, 2016 in these segment operations in which we own lessthan 100%:Location Percentage Interest
Tianjin, China (Specialty Carbons and Formulations business) 90% (consolidated subsidiary)Jiangxi Province, China (Metal Oxides business) 90% (consolidated subsidiary)Mettur Dam, India (Metal Oxides business) 50% (equity affiliate)
During fiscal 2016, we announced our entry into an agreement with Inner Mongolia Hengyecheng Silicone Co., Ltd (“HYC”) tobuild a fumed silica manufacturing facility in Wuhai, China in which we will hold an 80% share and HYC will hold the remaining 20%share. The facility will have an initial annual manufacturing capacity of approximately 8,000 metric tons. We expect construction ofthe plant to begin in early calendar year 2017 and to be completed in calendar year 2019.

7
Purification Solutions
Products
Activated carbon is a porous material consisting mainly of elemental carbon treated with heat, steam and/or chemicals tocreate high internal porosity, resulting in a large internal surface area that resembles a sponge. It is generally produced in two forms,powdered and granular, and is manufactured in different sizes, shapes and levels of purity and using a variety of raw materials for awide variety of applications. Activated carbon is used to remove contaminants from liquids and gases using a process calledadsorption, whereby the interconnected pores of activated carbon trap contaminants.
Our activated carbon products are used for the purification of water, air, food and beverages, pharmaceuticals and otherliquids and gases, as either a colorant or a decolorizing agent in the production of products for food and beverage applications andas a chemical carrier in slow release applications. In gas and air applications, one of the uses of activated carbon is for the removal ofmercury in flue gas streams. In certain applications, used activated carbon can be reactivated for further use by removing thecontaminants from the pores of the activated carbon product. The most common applications for our reactivated carbon are watertreatment and food and beverage purification. In addition to our activated carbon production and reactivation, we also provideactivated carbon solutions through on-site equipment and services, including delivery systems for activated carbon injection in coal-fired utilities, mobile water filter units and carbon reactivation services.
Sales and Customers
Sales of activated carbon are made by Cabot employees and through distributors and sales representatives to a broad range ofcustomers, including coal-fired utilities, food and beverage processors, water treatment plants, pharmaceutical companies andcatalyst producers. Some of our sales of activated carbon are made under annual contracts or longer-term agreements, particularlyin mercury removal applications.
Competition
We are one of the leading manufacturers of activated carbon in the world. We compete in the manufacture of activatedcarbon with a number of companies, some of whom have a global presence and others who have a regional or local presence,although not all of these companies manufacture activated carbon for the range of applications for which we sell our products.
Competition for activated carbon and activated carbon equipment and services is based on quality, price, performance, andsupply-chain stability. We believe our product and application diversity, product differentiation, technological leadership, quality,cost-effective access to raw materials, and scalable manufacturing capabilities provide us with a competitive advantage.
Raw Materials
The principal raw materials we use in the manufacture of activated carbon are various forms of coal, including lignite, woodand other carbonaceous materials, which are, in general, readily available and we believe we have in adequate supply. We also owna lignite mine that is operated by Caddo Creek Resources Company, LLC, a subsidiary of the North American Coal Company, whichsupplies our Marshall, Texas facility.
Operations
We own, or have a controlling interest in, and operate plants that produce activated carbon in the United States, the UnitedKingdom, The Netherlands and Italy. Our affiliates operate activated carbon plants in Canada and Mexico. The following table showsour ownership interest as of September 30, 2016 in activated carbon operations in which we own less than 100%:Location Percentage Interest
Estevan, Saskatchewan, Canada 50% (contractual joint venture)Atitalaquia, Hidalgo, Mexico 49% (equity affiliate)
Specialty Fluids
Products
Our Specialty Fluids segment principally produces and markets cesium formate as a drilling and completion fluid for useprimarily in high pressure and high temperature oil and gas well construction. Cesium formate products are solids-free, high-densityfluids that have a low viscosity, enabling safe and efficient well construction and workover operations. The fluid is resistant to hightemperatures, minimizes damage to producing reservoirs and is readily biodegradable in accordance with the testing guidelines setby the Organization for Economic Cooperation and Development. In a majority of applications, cesium formate is blended with otherformates or products. We also manufacture and sell fine cesium chemicals that are used in a wide range of applications, includingcatalysts and brazing fluxes.

8
Sales, Rental and Customers
Sales of our cesium formate products are made to oil and gas operating companies directly by Cabot employees and salesrepresentatives and indirectly through oil field service companies. We generally rent cesium formate to our customers for use indrilling operations on a short-term basis and on occasion make direct sales of cesium formate outside of the rental process. Aftercompletion of a job under our rental process, the customer returns the remaining fluid to Cabot and it is reprocessed for use insubsequent well operations. Any fluid that is lost during use and not returned to Cabot is paid for by the customer.
A large portion of our fluids has been used for drilling and completion of wells in the North Sea with a limited number ofcustomers, where we have supplied cesium formate-based fluids for both reservoir drilling and completion activities on large gasand condensate field projects in the Norwegian Continental Shelf. We continue to expand the use of our fluids to drilling operationsoutside of the North Sea, particularly in Asia and the Middle East.
Competition
Formate fluids compete mainly with traditional drilling fluid technologies. Competition in the well fluids business is based onproduct performance, quality, reliability, service, technical innovation, price, and proximity of inventory to customers’ drillingoperations. We believe our commercial strengths include our unique product offerings and their performance, and our customerservice.
Raw Materials
The principal raw material used in this business is pollucite (cesium ore), of which we own a substantial portion of the world’sknown reserves. In November 2015, we completed a development project at our mine in Manitoba, Canada. We believe we havesufficient raw material to enable us to continue to supply cesium products for the foreseeable future, based on our anticipatedconsumption. We are not currently mining at the site and will assess options to access additional reserves in the mine, varioustechnologies to augment our cesium supply and alternative sources of ore as demand for our cesium products warrants.
Most jobs for which cesium formate is used require a large volume of the product. Accordingly, the Specialty Fluids businessmaintains a large inventory of fluid.
Operations
Our mine and cesium formate manufacturing facility are located in Manitoba, Canada, and we have fluid blending andreclamation facilities in Aberdeen, Scotland and in Bergen, Norway. In addition, we warehouse fluid at various locations around theworld to support existing and potential operations.
Patents and Trademarks
We own and are a licensee of various patents, which expire at different times, covering many of our products as well asprocesses and product uses. Although the products made and sold under these patents and licenses are important to Cabot, the lossof any particular patent or license would not materially affect our business, taken as a whole. We sell our products under a variety oftrademarks we own and take reasonable measures to protect them. While our trademarks are important to Cabot, the loss of anyone of our trademarks would not materially affect our business, taken as a whole.
Seasonality
Our businesses are generally not seasonal in nature, although we may experience some regional seasonal declines duringholiday periods and some weather-related seasonality in Purification Solutions.
Backlog
We do not consider backlog to be a significant indicator of the level of future sales activity. In general, we do not manufactureour products against a backlog of orders. Production and inventory levels are based on the level of incoming orders as well asprojections of future demand. Therefore, we believe that backlog information is not material to understanding our overall businessand is not a reliable indicator of our ability to achieve any particular level of revenue or financial performance.
Employees
As of September 30, 2016, we had approximately 4,300 employees. Some of our employees in the United States and abroadare covered by collective bargaining or similar agreements. We believe that our relations with our employees are generallysatisfactory.

9
Research and Development
Cabot develops new and improved products and higher efficiency processes through Company-sponsored research andtechnical service activities, including those initiated in response to customer requests. In fiscal 2016, we announced our plan to opena new Asia Technology Center in Shanghai, China to support our applications development and customer collaboration efforts in theregion. We expect to open the facility in late calendar year 2017. Our expenditures for research and technical service activitiesgenerally are spread among our businesses and are shown in the consolidated statements of operations. Further discussion of ourresearch and technical expenses incurred in each of our last three fiscal years appears in MD&A in Item 7 below.
Safety, Health and Environment (“SH&E”)
Cabot has been named as a potentially responsible party under the Comprehensive Environmental Response, Compensation,and Liability Act of 1980 (the “Superfund law”) and comparable state statutes with respect to several sites primarily associated withour divested businesses. (See “Legal Proceedings” below.) During the next several years, as remediation of various environmentalsites is carried out, we expect to spend against our $14 million environmental reserve for costs associated with such remediation.Adjustments are made to the reserve based on our continuing analysis of our share of costs likely to be incurred at each site.Inherent uncertainties exist in these estimates due to unknown conditions at the various sites, changing governmental regulationsand legal standards regarding liability, and changing technologies for handling site investigation and remediation. While the reserverepresents our best estimate of the costs we expect to incur, the actual costs to investigate and remediate these sites may exceedthe amounts accrued in the environmental reserve. While it is always possible that an unusual event may occur with respect to agiven site and have a material adverse effect on our results of operations in a particular period, we do not believe that the costsrelating to these sites, in the aggregate, are likely to have a material adverse effect on our consolidated financial position.Furthermore, it is possible that we may also incur future costs relating to environmental liabilities not currently known to us or as towhich it is currently not possible to make an estimate.
Our ongoing operations are subject to extensive federal, state, local, and foreign laws, regulations, rules, and ordinancesrelating to safety, health, and environmental matters (“SH&E Requirements”). These SH&E Requirements include requirements toobtain and comply with various environmental-related permits for constructing any new facilities and operating all of our existingfacilities and for product registrations. We have expended and will continue to expend considerable sums to construct, maintain,operate, and improve facilities for safety, health and environmental protection and to comply with SH&E Requirements. We spentapproximately $30 million in environmental-related capital expenditures at existing facilities in fiscal 2016. We anticipate spendingapproximately $48 million for such matters in fiscal 2017, a significant portion of which will be for the installation of technologycontrols for sulfur dioxide and nitrogen oxide emissions at certain of our carbon black plants in North America.
In recognition of the importance of compliance with SH&E Requirements to Cabot, our Board of Directors has a Safety, Health,and Environmental Affairs Committee. The Committee, which is comprised of a majority of independent directors, meets four timesa year and provides oversight and guidance to Cabot’s safety, health and environmental management programs. In particular, theCommittee reviews Cabot’s environmental reserve, safety, health and environmental risk assessment and management processes,environmental and safety audit reports, performance metrics, performance as benchmarked against industry peer groups, assessedfines or penalties, site security and safety issues, health and environmental training initiatives, and the SH&E budget. The Committeealso consults with our external and internal advisors regarding management of Cabot’s safety, health and environmental programs.
The International Agency for Research on Cancer (“IARC”) classifies carbon black as a Group 2B substance (known animalcarcinogen, possible human carcinogen). We have communicated IARC’s classification of carbon black to our customers andemployees and have included that information in our safety data sheets and elsewhere, as appropriate. We continue to believe thatthe available evidence, taken as a whole, indicates that carbon black is not carcinogenic to humans, and does not present a healthhazard when handled in accordance with good housekeeping and safe workplace practices as described in our safety data sheets.
REACH (Registration, Evaluation and Authorization of Chemicals), the European Union (“EU”) regulatory framework forchemicals developed by the European Commission (“EC”), applies to all chemical substances produced or imported into the EU inquantities greater than one metric ton a year. Manufacturers or importers of these chemical substances are required to submitspecified health, safety, risk and use information about the substance to the European Chemical Agency. We have completed allrequired registrations under REACH to date and will continue to complete the registrations under REACH for our products inaccordance with future registration deadlines. We will also continue to work with the manufacturers and importers of our rawmaterials, including our feedstocks, to ensure their registration prior to the applicable deadlines. In addition, the EC has adopted aharmonized definition of “nanomaterial” to be used in the EU to identify materials for which special provisions may apply, such asrisk assessment and ingredient labeling. The EC definition is broad and applies to many of our existing products, including carbonblack, fumed silica and fumed alumina. Country-specific product registration and assessment programs have been implemented insome countries and are being developed by others. We will continue to address these requirements.

10
Environmental agencies worldwide are increasingly implementing regulations and other requirements resulting in morerestrictive air emission limits globally, particularly as they relate to nitrogen oxide, sulphur dioxide and particulate matter emissions.In addition, global efforts to reduce greenhouse gas emissions impact the carbon black and activated carbon industries as carbondioxide is emitted from those manufacturing processes. The EU Emission Trading Scheme applies to our carbon black facilities andone activated carbon facility in Europe. In China, two of our carbon black facilities are participating in regional pilot emissions tradingprograms associated with the development of a national trading program, which we anticipate will be more fully defined in fiscal2017. In Canada, our carbon black manufacturing facility will be subject to the greenhouse gas emissions trading program beginningin calendar year 2017. In the U.S., some of our facilities are required to report their greenhouse gas emissions, but are not currentlysubject to programs requiring trading or emission controls. We generally expect to purchase emission credits where necessary torespond to allocation shortfalls. In addition, air emission regulations may be adopted in the future in other regions and countrieswhere we operate, which could have an impact on our operations.
A number of organizations and regulatory agencies have become increasingly focused on the issue of water scarcity and waterquality, particularly in certain geographic regions. We are engaged in various activities to promote water conservation andwastewater recycling. The costs associated with these activities are not expected to have a material adverse effect on ouroperations.
Various U.S. agencies and international bodies have adopted security requirements applicable to certain manufacturing andindustrial facilities and marine port locations. These security-related requirements involve the preparation of security assessmentsand security plans in some cases, and in other cases the registration of certain facilities with specified governmental authorities. Weclosely monitor all security-related regulatory developments and believe we are in compliance with all existing requirements.Compliance with such requirements is not expected to have a material adverse effect on our operations.
Foreign and Domestic Operations and Export Sales
A significant portion of our revenues and operating profits is derived from overseas operations. The profitability of oursegments is affected by fluctuations in the value of the U.S. dollar relative to foreign currencies. (See MD&A and the GeographicInformation portion of Note U for further information relating to sales and long-lived assets by geographic area.) Currencyfluctuations, nationalization and expropriation of assets are risks inherent in international operations. We have taken steps we deemprudent in our international operations to diversify and otherwise to protect against these risks, including the use of foreigncurrency financial instruments to reduce the risk associated with changes in the value of certain foreign currencies compared to theU.S. dollar. (See the risk management discussion contained in “Quantitative and Qualitative Disclosures About Market Risk” inItem 7A below and Note L of the Notes to the Company’s Consolidated Financial Statements).
Item 1A. Risk Factors
In addition to factors described elsewhere in this report, the following are important factors that could adversely affect ourbusiness. The risks described below are not the only risks we face. Additional risks not presently known to us or that we currentlydeem immaterial may also impair our business operations and financial results.
Negative or uncertain worldwide or regional economic conditions may adversely impact our business.
Our operations and performance are affected by worldwide and regional economic conditions. Continued uncertainty or adeterioration in the economic conditions affecting the businesses to which, or geographic areas in which, we sell products couldreduce demand for our products. We may also experience pricing pressure on products and services, which could decrease ourrevenues and have an adverse effect on our financial condition and cash flows. In addition, during periods of economic uncertainty,our customers may temporarily pursue inventory reduction measures that exceed declines in the actual underlying demand. Ourbusinesses are sensitive to industry capacity utilization, particularly Reinforcement Materials and Purification Solutions. As a result,pricing tends to fluctuate when capacity utilization changes occur, which could affect our financial performance.
As a chemical manufacturing company, our operations are subject to operational risks and have the potential to causeenvironmental or other damage as well as personal injury, which could adversely affect our business, results of operations andcash flows.
The operation of a chemical manufacturing business as well as the sale and distribution of chemical products are subject tooperational as well as safety, health and environmental risks. For example, the production and/or processing of carbon black,specialty compounds, fumed metal oxides, aerogel, activated carbon and other chemicals involve the handling, transportation,manufacture or use of certain substances or components that may be considered toxic or hazardous. Our manufacturing processesand the transportation of chemical products are subject to risks inherent in chemical manufacturing, including leaks, fires,explosions, toxic releases, mechanical failures or unscheduled downtime. If operational risks materialize, they could result in injuryor loss of life, damage to the environment, or damage to property. In addition, the occurrence of material operating problems at our

11
facilities or a disruption in our supply chain or distribution operations may result in loss of production, which, in turn, may make itdifficult for us to meet customer needs. Accordingly, these events and their consequences could negatively impact the Company’sresults of operations and cash flows, both during and after the period of operational difficulties, and could harm our reputation.
A significant adverse change in a customer relationship or the failure of a customer to perform its obligations under agreementswith us could harm our business or cash flows.
Our success in strengthening relationships and growing business with our largest customers and retaining their business overextended time periods could affect our future results. We have a group of key customers across our businesses that togetherrepresent a significant portion of our total net sales and operating revenues. The loss of any of our important customers, or asignificant reduction in volumes sold to them, could adversely affect our results of operations until such business is replaced or anytemporary disruption ends. Any deterioration in the financial condition of any of our customers that impairs our customers’ ability tomake payments to us also could increase our uncollectible receivables and could affect our future results and financial condition.
Volatility in the price of energy and raw materials could impact our margins and working capital.
Our manufacturing processes consume significant amounts of energy and raw materials, the costs of which are subject toworldwide supply and demand as well as other factors beyond our control. Dramatic increases in such costs or decreases in theavailability of raw materials at acceptable costs could have an adverse effect on our results of operations. For example, movementsin the market price for crude oil typically affect carbon black feedstock costs. Significant movements in the market price for crude oiltend to create volatility in our carbon black feedstock costs, which can affect our working capital and results of operations. Certainof our carbon black supply contracts contain provisions that adjust prices to account for changes in a relevant feedstock price index.We also attempt to offset the effects of increases in raw material and energy costs through selling price increases in our non-contract sales, productivity improvements and cost reduction efforts. Success in offsetting increased raw material and energy costswith price increases is largely influenced by competitive and economic conditions and could vary significantly depending on thesegment served. Such increases may not be accepted by our customers, may not be sufficient to compensate for increased rawmaterial and energy costs or may decrease demand for our products and our volume of sales. If we are not able to fully offset theeffects of increased raw material or energy costs, it could have a significant impact on our financial results. Rapid declines in energyand raw material costs can also negatively impact our financial results, as such changes can negatively affect the returns we receiveon our energy centers and yield improvement investments, and may negatively impact our contract pricing adjustments. In addition,we use a variety of feedstock indices in our supply contracts to adjust our prices for changes in raw materials costs. Depending onfeedstock markets and our choice of feedstocks, the indices we use in our supply contracts may not precisely track our actual costs.This could result in an incongruity between our contract pricing adjustments and changes in our actual feedstock costs, which canaffect our margins.
We may not be successful achieving our growth expectations from new products, new applications and technologydevelopments, and money we spend on these efforts may not result in a proportional increase in our revenues or profits.
We may not be successful achieving our growth expectations from developing new products or product applications.Moreover, we cannot be certain that the costs we incur investing in new product and technology development will result in aproportional increase in our revenues or profits. In addition, the timely commercialization of products that we are developing maybe disrupted or delayed by manufacturing or other technical difficulties, market acceptance or insufficient market size to support anew product, competitors’ new products, and difficulties in moving from the experimental stage to the production stage. Thesedisruptions or delays could affect our future business results.
We face operational risks inherent in mining operations and our mining operations have the potential to cause safety issues,including those that could result in significant personal injury.
We own two mines, a cesium mine in Manitoba, Canada, a portion of which is located under Bernic Lake, and an above-groundlignite mine, which is located close to our Marshall, Texas facility and operated by a subsidiary of The North American Coal Company.Mining operations by their nature are activities that involve a high level of uncertainty and are often affected by risks and hazardsoutside of our control. At our lignite mine, the risks are primarily operational risks associated with the maintenance and operation ofthe heavy equipment required to dig and haul the lignite, and risks relating to lower than expected lignite quality or recovery rates.Our underground mine in Manitoba is subject to a number of risks, including industrial accidents, unexpected geological conditions,fall of ground accidents or structural collapses, which, in the case of our cesium mine, could lead to flooding, and lower thanexpected ore quality, ore grades or recovery rates. Following a fall of ground incident in 2013, we implemented additional safetymeasures and several types of monitoring devices in the mine that have indicated good structural stability in the mine since thattime. However, the structural stability may change at any time and there is a possibility of deterioration and flooding of this mine.While we have not mined at our mine in Manitoba since we completed a development project at that site in November 2015, wemay resume those mining operations in the future. The failure to adequately manage these risks could result in significant personal

12
injury, loss of life, damage to mineral properties, production facilities or mining equipment, damage to the environment, delays in orreduced production, and potential legal liabilities.
Any failure to realize benefits from acquisitions, alliances or joint ventures could adversely affect future financial results.
In achieving our strategic plan objectives, we may pursue strategic bolt-on acquisitions or joint ventures intended tocomplement or expand our existing businesses globally or add product technology, or both. The success of acquisitions ofbusinesses, new technologies and products, or arrangements with third parties is not always predictable and we may not besuccessful in realizing our objectives as anticipated. We may not be able to integrate any acquired businesses successfully into ourexisting businesses, make such businesses profitable, or realize anticipated cost savings or synergies, if any, from these acquisitions,which could adversely affect our business results.
Plant capacity expansions and site development projects may be delayed and/or not achieve the expected benefits.
Our ability to complete capacity expansions and other site development projects as planned may be delayed or interrupted bythe need to obtain environmental and other regulatory approvals, unexpected cost increases, availability of labor and materials,unforeseen hazards such as weather conditions, and other risks customarily associated with construction projects. Moreover, thecost of these activities could have a negative impact on the financial performance of the relevant business, and in the case ofcapacity expansion projects, until capacity utilization at the particular facility is sufficient to absorb the incremental costs associatedwith the expansion. In addition, our ability to expand capacity in emerging regions depends in part on economic and politicalconditions in these regions and, in some cases, on our ability to establish operations, construct additional manufacturing capacity orform strategic business alliances.
An interruption in our operations as a result of fence-line arrangements could disrupt our manufacturing operations andadversely affect our financial results.
At certain of our facilities we have fence-line arrangements with adjacent third party manufacturing operations (“fence-linepartners”), who provide raw materials for our manufacturing operations and/or take by-products generated from our operations.Accordingly, any unplanned disruptions or curtailments in a fence-line partner’s production facilities that impacts their ability tosupply us with raw materials or to take our manufacturing by-products could disrupt our manufacturing operations or cause us toincur increased operating costs to mitigate such disruption.
If our assumptions about future sales and profitability of the Purification Solutions segment are incorrect and we do not achieveour growth expectations for this business, we may be required to impair certain assets.
We performed our annual goodwill impairment test of Purification Solutions as of May 31, 2016 and determined that the fairvalue of the reporting unit exceeded its carrying amount by 9% at that time. Our strategic plan underlying this analysis relies onfurther growth in the mercury removal related portion of the business, which is largely dependent on the amount of coal-basedpower generation used in the United States and the continued regulation of those utilities under the Mercury and Air ToxicsStandards (“MATS”). The analysis also anticipates growth in demand for our activated carbon products in other applications, whilemaintaining our margin expectations. If competitive forces, unfavorable macroeconomic trends or environmental policy changesrender our assumptions concerning demand growth and margin expectations for the business unreasonable, or we are nototherwise able to successfully execute plans to achieve our growth expectations for this business, there may be an impairment ofcertain assets.
We are exposed to political or country risk inherent in doing business in some countries.
Sales outside of the U.S. constituted a majority of our revenues in fiscal 2016. Although much of our international business iscurrently in regions where the political and economic risk levels and established legal systems are similar to those in the U.S., wealso conduct business in countries that have less stable legal systems and financial markets, and potentially more corrupt businessenvironments than the U.S. Our operations in some countries may be subject to the following risks: changes in the rate of economicgrowth; unsettled political or economic conditions; non-renewal of operating permits or licenses; possible expropriation or othergovernmental actions; corruption by government officials and other third parties; social unrest, war, terrorist activities or otherarmed conflict; confiscatory taxation or other adverse tax policies; deprivation of contract rights; trade regulations affectingproduction, pricing and marketing of products; reduced protection of intellectual property rights; restrictions on the repatriation ofincome or capital; exchange controls; inflation; currency fluctuations and devaluation; the effect of global health, safety andenvironmental matters on economic conditions and market opportunities; and changes in financial policy and availability of credit. Inaddition, there may be costs associated with repatriating income or capital.

13
We face competition from other specialty chemical companies.
We operate in a highly competitive marketplace. Our ability to compete successfully depends in part upon our ability tomaintain a superior technological capability and to continue to identify, develop and commercialize new and innovative, high value-added products for existing and future customers. Increased competition from existing or newly developed products offered by ourcompetitors or companies whose products offer a similar functionality as our products and could be substituted for our products,may negatively affect demand for our products. In addition, actions by our competitors could affect our ability to maintain or raiseprices, successfully enter new markets or maintain or grow our market position.
Litigation or legal proceedings could expose us to significant liabilities and thus negatively affect our financial results.
As more fully described in “Item 3—Legal Proceedings”, we are a party to or the subject of lawsuits, claims, and proceedings,including, but not limited to, those involving environmental, and health and safety matters as well as product liability and personalinjury claims relating to asbestosis, silicosis, and coal worker’s pneumoconiosis. We are also a potentially responsible party in variousenvironmental proceedings and remediation matters wherein substantial amounts are at issue. Adverse rulings, judgments orsettlements in pending or future litigation (including liabilities associated with respirator claims) or in connection withenvironmental remediation activities could adversely affect our financial results or cause our results to differ materially from thoseexpressed or forecasted in any forward-looking statements.
Fluctuations in foreign currency exchange and interest rates could affect our financial results.
We earn revenues, pay expenses, own assets and incur liabilities in countries using currencies other than the U.S. dollar. Infiscal 2016, we derived a majority of our revenues from sales outside the U.S. Because our consolidated financial statements arepresented in U.S. dollars, we must translate revenues, income and expenses, as well as assets and liabilities, into U.S. dollars atexchange rates in effect during or at the end of each reporting period. Therefore, increases or decreases in the value of the U.S.dollar against other currencies in countries where we operate will affect our results of operations and the value of balance sheetitems denominated in foreign currencies. Due to the geographic diversity of our operations, weaknesses in some currencies might beoffset by strengths in others over time. In addition, we are exposed to adverse changes in interest rates. We manage both these risksthrough normal operating and financing activities and, when deemed appropriate, through the use of derivative instruments as wellas foreign currency debt. We cannot be certain, however, that we will be successful in reducing the risks inherent in exposures toforeign currency and interest rate fluctuations.
Further, we have exposure to foreign currency movements because certain foreign currency transactions need to beconverted to a different currency for settlement. These conversions can have a direct impact on our cash flows.
Our tax rate is dependent upon a number of factors, a change in any of which could impact our future tax rates and net income.
Our future tax rates may be adversely affected by a number of factors, including: future changes in the jurisdictions in whichour profits are determined to be earned and taxed; changes in the estimated realization of our net deferred tax assets; therepatriation of non-U.S. earnings for which we have not previously provided for U.S. income and non-U.S. withholding taxes;adjustments to estimated taxes upon finalization of various tax returns; increases in expenses that are not deductible for taxpurposes, including charges from impairment of goodwill in connection with acquisitions; changes in available tax credits; theresolution of issues arising from tax audits with various tax authorities; and changes in tax laws or the interpretation of such taxlaws. Losses for which no tax benefits can be recorded could materially impact our tax rate and its volatility from one quarter toanother.
Information technology systems failures, data security breaches or network disruptions could compromise our information,disrupt our operations and expose us to liability, which may adversely impact our operations.
In the ordinary course of our business, we store sensitive data, including intellectual property, our proprietary businessinformation and certain information of our customers, suppliers, business partners, and employees in our information technologysystems. The secure processing, maintenance and transmission of this data is critical to our operations. Information technologysystems failures, including risks associated with upgrading our systems or in successfully integrating information technology andother systems in connection with the integration of businesses we acquire, network disruptions or unauthorized access could disruptour operations by impeding our processing of transactions and our financial reporting, and our ability to protect our customer orcompany information, which could have a material adverse effect on our business or results of operations. In addition, as with allenterprise information systems, our information technology systems could be penetrated by outside parties intent on extractinginformation, corrupting information, or disrupting business processes. Breaches of our security measures or the accidental loss,inadvertent disclosure, or unapproved dissemination of proprietary information or sensitive or confidential information about theCompany, our employees, our vendors, or our customers, could result in legal claims or proceedings and potential liability for us,damage to our reputation, and could otherwise harm our business and our results of operations.

14
Our operations are subject to extensive safety, health and environmental requirements, which could increase our costs and/orreduce our profit.
Our ongoing operations are subject to extensive federal, state, local and foreign laws, regulations, rules and ordinancesrelating to safety, health and environmental matters, many of which provide for substantial monetary fines and criminal sanctionsfor violations. These include requirements to obtain and comply with various environmental-related permits for constructing anynew facilities and operating all of our existing facilities. In addition, in certain geographic areas, our carbon black and activatedcarbon facilities are subject to greenhouse gas emission trading schemes under which we may be required to purchase emissioncredits if our emission levels exceed our allocations. The enactment of new environmental laws and regulations and/or the moreaggressive interpretation of existing requirements could require us to incur significant costs for compliance or capital improvementsor limit our current or planned operations, any of which could have a material adverse effect on our earnings or cash flow. Weattempt to offset the effects of these compliance costs through price increases, productivity improvements and cost reductionefforts. Success in offsetting any such increased regulatory costs is largely influenced by competitive and economic conditions andcould vary significantly depending on the segment served. Such increases may not be accepted by our customers, may not besufficient to compensate for increased regulatory costs or may decrease demand for our products and our volume of sales. See“Item 3 Legal Proceedings—Environmental Proceedings”.
The elimination of tariffs placed on U.S. imports of Chinese activated carbon, or their failure to adequately address the impact oflow-priced imports from China, could have a material adverse effect on our Purification Solutions segment.
Purification Solutions faces pressure and competition in the U.S. from low-priced imports of activated carbon products. If theamounts of these low-priced imports increase, especially if they are sold at less than fair value, our sales of competing productscould decline, which could have an adverse effect on the earnings of Purification Solutions. In addition, sales of these low-pricedimports may negatively impact our pricing. To limit these activities, regulators in the U.S. have enacted an antidumping duty orderon steam activated carbon products from China. A proceeding that will evaluate whether to extend the order for an additional fiveyears will be initiated in February 2018. The amount of antidumping duties collected on imports of steam activated carbon fromChina is reviewed annually by the U.S. Department of Commerce. To the extent the antidumping margins do not adequately addressthe degree to which imports are unfairly traded, the antidumping order may be less effective in reducing the volume of these low-priced activated carbon imports in the U.S., which could negatively affect demand and/or pricing for our products. In addition, if theantidumping order is not extended beyond its current term, the amount of low-priced imports from China may increase, which couldhave an adverse effect on our Purification Solutions business.
We have entered into a number of derivative contracts with financial counterparties. The effectiveness of these contracts isdependent on the ability of these financial counterparties to perform their obligations and their nonperformance could harm ourfinancial condition.
We have entered into forward foreign currency contracts and cross currency swaps as part of our financial risk managementstrategy. The effectiveness of our risk management program using these instruments is dependent, in part, upon the counterpartiesto these contracts honoring their financial obligations. If any of our counterparties are unable to perform their obligations in thefuture, we could be exposed to increased earnings and cash flow volatility due to an instrument’s failure to hedge or adequatelyaddress a financial risk.
The continued protection of our patents, trade secrets and other proprietary intellectual property rights are important to oursuccess.
Our patents, trade secrets and other intellectual property rights are important to our success and competitive position. Weown various patents and other intellectual property rights in the U.S. and other countries covering many of our products, as well asprocesses and product uses. Where we believe patent protection is not appropriate or obtainable, we rely on trade secret laws andpractices to protect our proprietary technology and processes, such as physical security, limited dissemination and access andconfidentiality agreements with our employees, customers, consultants, business partners, potential licensees and others to protectour trade secrets and other proprietary information. However, trade secrets can be difficult to protect and the protective measureswe have put in place may not prevent disclosure or unauthorized use of our proprietary information or provide an adequate remedyin the event of misappropriation or other violations of our proprietary rights. In addition, we are a licensee of various patents andintellectual property rights belonging to others in the U.S. and other countries. Because the laws and enforcement mechanisms ofsome countries may not allow us to protect our proprietary rights to the same extent as we are able to do in the U.S., the strength ofour intellectual property rights will vary from country to country.
Irrespective of our proprietary intellectual property rights, we may be subject to claims that our products, processes orproduct uses infringe the intellectual property rights of others. These claims, even if they are without merit, could be expensive andtime consuming to defend and if we were to lose such claims, we could be enjoined from selling our products or using our processesand/or be subject to damages, or be required to enter into licensing agreements requiring royalty payments and/or use restrictions.Licensing agreements may not be available to us, or if available, may not be available on acceptable terms.

15
Natural disasters could affect our operations and financial results.
We operate facilities in areas of the world that are exposed to natural hazards, such as floods, windstorms, hurricanes, andearthquakes. Such events could disrupt our supply of raw materials or otherwise affect production, transportation and delivery ofour products or affect demand for our products.
Item 1B. Unresolved Staff Comments
None.
Item 2. Properties
Cabot’s corporate headquarters are in leased office space in Boston, Massachusetts. We also own or lease office,manufacturing, storage, distribution, marketing and research and development facilities in the United States and in foreigncountries. The locations of our principal manufacturing and/or administrative facilities are set forth in the table below. Unlessotherwise indicated, all the properties are owned.
Location by RegionReinforcement
MaterialsPerformance
ChemicalsPurification
Solutions Specialty Fluids
Americas RegionAlpharetta, GA*(1) X X X XTuscola, IL XCanal, LA X XVille Platte, LA XBillerica, MA X X X XHaverhill, MA XMidland, MI XPryor, OK XMarshall, TX XPampa, TX X XCampana, Argentina XMaua, Brazil X XSao Paulo, Brazil*(1) X X X XCartagena, Colombia XLac du Bonnet, Manitoba** XAltamira, Mexico XSarnia, Ontario X X
(1) Business service center* Leased premises** Building(s) owned by Cabot on leased land

16
Location by RegionReinforcement
MaterialsPerformance
ChemicalsPurification
Solutions Specialty Fluids
EMEA RegionLoncin, Belgium XPepinster, Belgium XValasske Mezirici (Valmez), Czech Republic** XPort Jerome, France** XFrankfurt, Germany* XRheinfelden, Germany XRavenna, Italy (2 plants) X XRiga, Latvia*(1) X X X XBergen, Norway* XSchaffhausen, Switzerland* X X X XBotlek, The Netherlands** X XAmersfoort, The Netherlands* XKlazienaveen, The Netherlands XZaandam, The Netherlands XDubai, United Arab Emirates* XPurton, United Kingdom (England) XAberdeen, United Kingdom (Scotland)* XGlasgow, United Kingdom (Scotland) XBarry, United Kingdom (Wales)** X
Asia Pacific RegionJiangxi Province, China** XTianjin, China** X XShanghai, China*(1) X X X XShanghai, China** (plant) XXingtai City, China** XMumbai, India* X X XCilegon, Indonesia** XJakarta, Indonesia*(1) X X X XChiba, Japan XShimonoseki, Japan** XTokyo, Japan*(1) X X X XPort Dickson, Malaysia** X
(1) Business service center* Leased premises** Building(s) owned by Cabot on leased land
We conduct research and development for our various businesses primarily at facilities in Billerica, Massachusetts;Amersfoort, The Netherlands; Pampa, Texas; Pepinster, Belgium; Frankfurt, Germany; and Shanghai, China.
Our existing manufacturing plants generally have sufficient production capacity to meet current requirements and expectednear-term growth. These plants are generally well maintained, in good operating condition and suitable and adequate for theirintended use. Our administrative offices and other facilities are suitable and adequate for their intended purposes.

17
Item 3. Legal Proceedings
Cabot is a party in various lawsuits and environmental proceedings wherein substantial amounts are claimed. The following isa description of the significant proceedings pending on September 30, 2016, unless otherwise specified.
Environmental Proceedings
In November 2013, Cabot entered into a Consent Decree with the United States Environmental Protection Agency (“EPA”) andthe Louisiana Department of Environmental Quality (“LDEQ”) regarding Cabot’s three carbon black manufacturing facilities in theUnited States. This settlement is related to EPA’s national enforcement initiative focused on the U.S. carbon black manufacturingsector alleging non-compliance with certain regulatory and permitting requirements under The Clean Air Act, including the NewSource Review (“NSR”) construction permitting requirements. Pursuant to this settlement, which was approved by the U.S. DistrictCourt for the Western District of Louisiana in March, 2014, Cabot paid a combined $975,000 civil penalty to EPA and LDEQ, agreed tofund environmental mitigation projects in the three communities where the plants are located for a total cost of approximately$450,000, two of which have been completed, and will install technology controls for sulfur dioxide and nitrogen oxide. We expectthat the total capital costs to install these controls will be between $100 million and $150 million and will be incurred throughcalendar year 2020. In addition, Cabot has agreed to certain best management practices (“BMPs”) to control emissions of particulatematter at the three locations. Continental Carbon settled with EPA on similar terms in 2015. It is expected that other carbon blackmanufacturers will also be required to install technology controls and agree to adopt BMPs at their U.S. facilities in connection withthis initiative and are also likely to pay a civil penalty and fund mitigation projects.
We continue to perform certain sampling and remediation activities at a former pine tar manufacturing site in Gainesville,Florida that we sold in the 1960s. Those activities are pursuant to a formal Record of Decision and 1991 Consent Decree with EPA.Cabot installed a groundwater treatment system at the site in the early 1990s, and that system is still in operation. We have alsobeen requested by EPA and other stakeholders to carry out various other additional work at the site, the scope of which has yet tobe fully determined. We continue to work cooperatively with EPA, the Florida Department of Environmental Protection and the localauthorities on this matter.
As of September 30, 2016, we had a $14 million reserve for environmental remediation costs at various sites. The operationand maintenance component of this reserve was $6 million. The $14 million reserve represents our current best estimate of costslikely to be incurred for remediation based on our analysis of the extent of cleanup required, alternative cleanup methods available,the ability of other responsible parties to contribute and our interpretation of laws and regulations applicable to each of our sites.
Other Proceedings
Respirator Liabilities
We have exposure in connection with a safety respiratory products business that a subsidiary acquired from American OpticalCorporation (“AO”) in an April 1990 asset purchase transaction. The subsidiary manufactured respirators under the AO brand anddisposed of that business in July 1995. In connection with its acquisition of the business, the subsidiary agreed, in certaincircumstances, to assume a portion of AO’s liabilities, including costs of legal fees together with amounts paid in settlements andjudgments, allocable to AO respiratory products used prior to the 1990 purchase by the Cabot subsidiary. In exchange for thesubsidiary’s assumption of certain of AO’s respirator liabilities, AO agreed to provide to the subsidiary the benefits of: (i) AO’sinsurance coverage for the period prior to the 1990 acquisition and (ii) a former owner’s indemnity of AO holding it harmless fromany liability allocable to AO respiratory products used prior to May 1982.
Generally, these respirator liabilities involve claims for personal injury, including asbestosis, silicosis and coal worker’spneumoconiosis, allegedly resulting from the use of respirators that are alleged to have been negligently designed and/or labeled.Neither Cabot, nor its past or present subsidiaries, at any time manufactured asbestos or asbestos-containing products. At no timedid this respiratory product line represent a significant portion of the respirator market.
The subsidiary transferred the business to Aearo Corporation (“Aearo”) in July 1995. Cabot agreed to have the subsidiaryretain certain liabilities associated with exposure to asbestos and silica while using respirators prior to the 1995 transaction so longas Aearo paid, and continues to pay, Cabot an annual fee of $400,000. Aearo can discontinue payment of the fee at any time, inwhich case it will assume the responsibility for and indemnify Cabot against those liabilities which Cabot’s subsidiary had agreed toretain. We anticipate that we will continue to receive payment of the $400,000 fee from Aearo and thereby retain these liabilitiesfor the foreseeable future. We have no liability in connection with any products manufactured by Aearo after 1995.
In addition to Cabot’s subsidiary and as described above, other parties are responsible for significant portions of the costs ofrespirator liabilities, leaving Cabot’s subsidiary with a portion of the liability in only some of the pending cases. These parties includeAearo, AO, AO’s insurers, another former owner and its insurers, and a third-party manufacturer of respirators formerly sold underthe AO brand and its insurers (collectively, with Cabot’s subsidiary, the “Payor Group”).

18
As of both September 30, 2016 and 2015, there were approximately 38,000 claimants in pending cases asserting claims againstAO in connection with respiratory products. Cabot has contributed to the Payor Group’s defense and settlement costs with respectto a percentage of pending claims depending on several factors, including the period of alleged product use. In order to quantify ourestimated share of liability for pending and future respirator liability claims, we have engaged, through counsel, the assistance ofHamilton, Rabinovitz & Alschuler, Inc. (“HR&A”), a leading consulting firm in the field of tort liability valuation. The methodologyused by HR&A addresses the complexities surrounding our potential liability by making assumptions about future claimants withrespect to periods of asbestos, silica and coal mine dust exposure and respirator use. Using those and other assumptions, HR&Aestimates the number of future asbestos, silica and coal mine dust claims that will be filed and the related costs that would beincurred in resolving both currently pending and future claims. On this basis, HR&A then estimates the value of the share of theseliabilities that reflect our period of direct manufacture and our contractual obligations. During the three months ended September30, 2016, HR&A updated this estimate. Based on the HR&A estimates, as of September 30, 2016, we increased our reserve for ourestimated share of liability for pending and future respirator claims by $13 million to $21 million. The increase reflects recentincreases in certain defense and indemnity costs. We made payments related to our respirator liability of $3 million in fiscal 2016and $2 million in each of fiscal 2015 and 2014.
Our current estimate of the cost of our share of existing and future respirator liability claims is based on facts andcircumstances existing at this time. Developments that could affect our estimate include, but are not limited to, (i) significantchanges in the number of future claims, (ii) changes in the rate of dismissals without payment of pending claims, (iii) significantchanges in the average cost of resolving claims, (iv) significant changes in the legal costs of defending these claims, (v) changes in thenature of claims received, (vi) changes in the law and procedure applicable to these claims, (vii) the financial viability of members ofthe Payor Group, (viii) a change in the availability of the insurance coverage of the members of the Payor Group or the indemnityprovided by AO’s former owner, (ix) changes in the allocation of costs among the Payor Group, and (x) a determination that theassumptions that were used to estimate our share of liability are no longer reasonable. We cannot determine the impact of thesepotential developments on our current estimate of our share of liability for these existing and future claims. Accordingly, the actualamount of these liabilities for existing and future claims could be different than the reserved amount.
Other Matters
We have various other lawsuits, claims and contingent liabilities. In our opinion, although final disposition of some or all ofthese other suits and claims may impact our financial statements in a particular period, they should not, in the aggregate, have amaterial adverse effect on our consolidated financial statements.
Item 4. Mine Safety Disclosures
Not applicable.
Executive Officers of the Registrant
Set forth below is certain information about Cabot’s executive officers as of November 23, 2016.
Sean D. Keohane, age 49, is President and Chief Executive Officer and a member of Cabot’s Board of Directors, positions he hasheld since March 2016. Mr. Keohane joined Cabot in August 2002 and was named General Manager of Performance Chemicals inMay 2008. From March 2012 until November 2014, he was Senior Vice President and President of Performance Chemicals, and fromNovember 2014 until March 2016 he was Executive Vice President and President of Reinforcement Materials. He was appointed VicePresident in March 2005, Senior Vice President in March 2012 and Executive Vice President in November 2014. He was a member ofthe Interim Office of the Chief Executive Officer (the “CEO Office”), which was in place from December 2015 until March 2016.
Eduardo E. Cordeiro, age 49, is Executive Vice President and Chief Financial Officer and President of the Americas and Europe,Middle East and Africa (“EMEA”) regions. Mr. Cordeiro joined Cabot in 1998 and has served in a variety of leadership positions,including Corporate Controller, General Manager of the Fumed Metal Oxides business and General Manager of the Supermetalsbusiness. He was responsible for Corporate Strategy from May 2008 until February 2009, when he became Cabot’s Chief FinancialOfficer. Mr. Cordeiro was appointed Vice President in March 2003 and Executive Vice President in March 2009. He was a member ofthe CEO Office, which was in place from December 2015 until March 2016.
Nicholas S. Cross, age 55, is Executive Vice President and President of Performance Chemicals and Specialty Fluids. Mr. Crossjoined Cabot in September 2009 as President of the EMEA region and was appointed President of Advanced Technologies in January2013 and President of Performance Chemicals in November 2014. He was appointed Vice President upon joining Cabot in 2009,Senior Vice President in March 2012 and Executive Vice President in November 2014. Prior to joining Cabot, Mr. Cross held a varietyof leadership positions in BP plc’s Chemicals, Oil and Gas businesses, including Director of Chemicals Strategy and Head ofInternational NGLs. He was a member of the CEO Office, which was in place from December 2015 until March 2016.

19
Brian A. Berube, age 54, is Senior Vice President and General Counsel and interim Chief Human Resources Officer. Mr. Berubejoined Cabot in 1994 as an attorney in Cabot’s law department and became Deputy General Counsel in June 2001, business GeneralCounsel in March 2002, and General Counsel in March 2003. He was appointed interim Chief Human Resources Officer in July 2016.Mr. Berube was appointed Vice President in March 2002 and Senior Vice President in March 2012. He was a member of the CEOOffice, which was in place from December 2015 until March 2016.
Hobart C. Kalkstein, age 46, is Senior Vice President and President of Reinforcement Materials. Mr. Kalkstein joined Cabot in2005. Since joining the Company, he has held several key management positions, most recently as Vice President of CorporateStrategy and Development from December 2015 to April 2016. From October 2013 to December 2015, he served as Vice Presidentof Global Business Operations for Purification Solutions and from November 2012 to December 2015 as General Manager of GlobalEmission Control Solutions for Purification Solutions, and from January 2012 to November 2012 he served as Vice President ofBusiness Operations and Executive Director of Marketing and Business Strategy for Performance Chemicals. Prior to that, he servedas General Manager of the Aerogel business from October 2007 to February 2010. He was appointed Senior Vice President in April2016.
Friedrich von Gottberg, age 48, is Senior Vice President and President of Purification Solutions. Mr. von Gottberg joined Cabotin 1997. Since joining the Company he has held a variety of leadership positions in Research and Development and Finance. Prior toassuming his current role in January 2013, he was Vice President of the New Business Group from March 2008 until March 2012, andSenior Vice President and President of Advanced Technologies from March 2012 until January 2013. Mr. von Gottberg wasappointed Vice President in March 2005 and Senior Vice President in March 2012.

20
PART II
Item 5. Market for Registrant’s Common Equity, Related Stockholder Matters and Issuer Purchases of Equity Securities
Cabot’s common stock is listed for trading (symbol CBT) on the New York Stock Exchange. As of November 18, 2016, therewere 735 holders of record of Cabot’s common stock. The tables below show the high and low sales price for Cabot’s common stockfor each of the fiscal quarters ended December 31, March 31, June 30, and September 30 and the quarterly cash dividend paid onCabot’s common stock for the past two fiscal years.
Stock Price and Dividend Data
Quarters EndedDecember 31 March 31 June 30 September 30
Fiscal 2016Cash dividends per share $ 0.22 $ 0.22 $ 0.30 $ 0.30Price range of common stock:
High $ 44.23 $ 49.62 $ 50.68 $ 53.48Low $ 31.03 $ 36.12 $ 42.27 $ 43.95
Fiscal 2015Cash dividends per share $ 0.22 $ 0.22 $ 0.22 $ 0.22Price range of common stock:
High $ 50.86 $ 47.94 $ 47.27 $ 38.59Low $ 39.62 $ 40.33 $ 37.24 $ 31.04
Issuer Purchases of Equity Securities
The table below sets forth information regarding Cabot’s purchases of its equity securities during the quarter endedSeptember 30, 2016:
Period
TotalNumberof Shares
Purchased(1)
AveragePrice Paidper Share
Total Number ofShares Purchasedas Part of PubliclyAnnounced Plans
or Programs(1)
Maximum Number (orApproximate Dollar
Value) of Shares thatMay Yet Be Purchased
Under the Plans orPrograms(1)
July 1, 2016—July 31, 2016 — $ — — 3,124,324August 1, 2016—August 31, 2016 210,000 $ 49.29 210,000 2,914,324September 1, 2016—September 30, 2016 92,000 $ 50.01 92,000 2,822,324
Total 302,000 302,000
(1) On January 13, 2015, Cabot publicly announced that the Board of Directors authorized the Company to repurchase up to fivemillion shares of its common stock on the open market or in privately negotiated transactions. The prior repurchaseauthorization was terminated at that time. The current authorization does not have a set expiration date. In the fourth quarterof 2016, Cabot repurchased 302,000 shares under this authorization.
Item 6. Selected Financial Data
On July 31, 2012, Cabot completed the purchase of Norit N.V. (“Purification Solutions”). The operating results and ratiospresented below for fiscal 2012 include two months of results of Purification Solutions. Beginning September 30, 2012 the balancesheet items presented below include those of Purification Solutions.
On November 18, 2013, Cabot purchased all of its joint venture partner’s common stock in NHUMO, S.A. de C.V. (“NHUMO”),which represented approximately 60% of the outstanding common stock of the joint venture. Prior to this transaction, the Companyowned approximately 40% of the outstanding common stock of NHUMO, and the NHUMO entity was accounted for as an equityaffiliate of the Company. The results of fiscal 2014 in the table below include 11 months of results at 100% consolidation and onemonth of results accounted for under the equity method at 40%. Results for all years prior to fiscal 2014 are reported under theequity method at 40%.

21
The Company completed the sales of its Supermetals business and Security Materials business on January 20, 2012 andJuly 31, 2014, respectively. The results of operations for both businesses for all periods presented are reflected as discontinuedoperations in the Consolidated Statements of Operations.
Years Ended September 302016 2015 2014 2013 2012
(Dollars in millions, except per share amounts and ratios)Consolidated Net Income (Loss)Net sales and other operating revenues $ 2,411 $ 2,871 $ 3,647 $ 3,456 $ 3,291Gross profit 578 585 721 633 644Selling and administrative expenses 275 282 326 297 281Research and technical expenses 53 58 60 68 72Purification Solutions long-lived assets impairment charge — 210 — — —Purification Solutions goodwill impairment charge — 352 — — —
Income (loss) from operations 250 (317) 335 268 291Net interest expense and other charges(1) (56) (60) (27) (58) (45)
Income (loss) from continuing operations (2) 194 (377) 308 210 246(Provision) benefit for income taxes (3) (34) 45 (92) (60) (55)Equity in earnings of affiliated companies 3 4 — 11 11Income (loss) from discontinued operations, net of tax 1 2 2 (1) 204Net income (loss) 164 (326) 218 160 406Net income attributable to noncontrolling interests, net of tax 15 8 19 7 18
Net income (loss) attributable to Cabot Corporation $ 149 $ (334) $ 199 $ 153 $ 388Common Share DataDiluted net income (loss) attributable to CabotCorporation:
Income (loss) from continuing operations $ 2.34 $ (5.29) $ 3.01 $ 2.37 $ 2.84Income (loss) from discontinued operations 0.02 0.02 0.02 (0.01) 3.15
Net income (loss) attributable to Cabot Corporation $ 2.36 $ (5.27) $ 3.03 $ 2.36 $ 5.99Dividends $ 1.04 $ 0.88 $ 0.84 $ 0.80 $ 0.76Closing prices $ 52.41 $ 31.56 $ 50.77 $ 42.71 $ 36.57
Weighted-average diluted shares outstanding— millions 62.9 63.4 65.1 64.5 64.2Shares outstanding at year end—millions 62.2 62.5 64.4 64.0 63.3
Consolidated Financial PositionCurrent assets $ 1,089 $ 1,048 $ 1,364 $ 1,495 $ 1,443Net property, plant, and equipment 1,290 1,383 1,581 1,600 1,547Other assets 665 644 1,139 1,138 1,409
Total assets $ 3,044 $ 3,075 $ 4,084 $ 4,233 $ 4,399Current liabilities $ 398 $ 441 $ 630 $ 844 $ 919Long-term debt 918 970 1,004 1,020 1,172Other long-term liabilities 356 326 386 286 369Cabot Corporation stockholders’ equity 1,274 1,234 1,942 1,951 1,813Noncontrolling interests 98 104 122 132 126
Total liabilities and stockholders’ equity $ 3,044 $ 3,075 $ 4,084 $ 4,233 $ 4,399Selected Financial RatiosNet debt to capitalization ratio(4) 35% 41% 33% 36% 40%Adjusted return on net assets(5) 11% 9% 10% 9% 12%(1) Net interest expense and other charges includes foreign currency activity as follows: a gain of $5 million for fiscal 2016, a loss
of $8 million for fiscal 2015, a loss of $2 million for fiscal 2014, a gain of $2 million for fiscal 2013, and a loss of $2 million forfiscal 2012.
(2) Income (loss) from continuing operations includes certain items as presented in the table below. A discussion of certain itemsis included in Definition of Terms and Non-GAAP Financial Measures in Results of Operations.

22
Years Ended September 302016 2015 2014 2013 2012
(Dollars in millions)Global restructuring activities (Note P) $ (47) $ (21) $ (29) $ (35) $ (17)Legal and environmental matters and reserves (17) — (18) (1) (8)Acquisition and integration-related charges — (5) (7) (21) (26)Employee benefit plan settlement and other charges (Note
N) — (21) — — —Impairment of goodwill and long-lived assets of
Purification Solutions (Note G) — (562) — — —Foreign currency (loss) gain on revaluations (11) (2) (3) 3 —Gain on existing investment in NHUMO — — 29 — —Inventory adjustment (Note E) — (6) — — —Executive transition costs (6) — — — —
Certain items, pre-tax $ (81) $ (617) $ (28) $ (54) $ (51)Tax-related certain itemsTax impact of certain items(a) $ 31 $ 94 $ 17 $ 10 $ 9Tax impact of certain foreign exchange gains (losses) — — — (12) 1Tax impact of non-deductible interest expense — — — — (2)Discrete tax items — 13 (17) 11 11
Total tax-related certain items 31 107 — 9 19Total certain items, net of tax $ (50) $ (510) $ (28) $ (45) $ (32)
(a) The tax impact of certain items is determined by (1) starting with the current and deferred income tax expense orbenefit, included in Net income attributable to Cabot Corporation, and (2) subtracting the tax expense or benefit on“adjusted earnings”. Adjusted earnings is defined as the pre-tax income attributable to Cabot Corporation excludingcertain items. The tax expense or benefit on adjusted earnings is calculated by applying the operating tax rate, asdefined under the section Definition of Terms and Non-GAAP Financial Measures in Results of Operations, to adjustedearnings.
(3) The Company’s effective tax rate for fiscal 2016 was a provision of 18%, which included less than $1 million of discrete taxcharges, composed of charges of $5 million for valuation allowances on beginning of the year tax balances partially offset bybenefits of $3 million for a currency loss and $1 million each for the renewal of the U.S. research and experimentation creditand net tax settlements. The Company’s effective tax rate for fiscal 2015 was a benefit of 12%, which included $13 million ofdiscrete tax benefits composed of $7 million for tax settlements, $4 million for repatriation, and $2 million for the renewal ofthe U.S. research and experimentation credit. The Company’s effective tax rate for fiscal 2014 was a provision of 30% whichincluded net discrete charges of $17 million, composed of a $20 million charge for a valuation allowance, offset by $3 millionof net tax benefit primarily related to tax settlements. The Company’s effective tax rate for fiscal 2013 was a provision of 28%which included net discrete charges of $3 million, composed of a $13 million foreign currency related charge, offset by $10million of net tax benefit related to tax settlements, renewal of the U.S. research and experimentation (“R&E”) credit, andother miscellaneous tax items in the tax provision. The Company’s effective tax rate for fiscal 2012 was a provision of 22%which includes net discrete tax benefits of $8 million from the release of a valuation allowance and $3 million fromsettlements and miscellaneous tax items.
(4) Net debt to capitalization ratio is calculated by dividing total debt (the sum of short-term and long-term debt less cash andcash equivalents) by total capitalization (the sum of Total stockholders’ equity plus total debt).
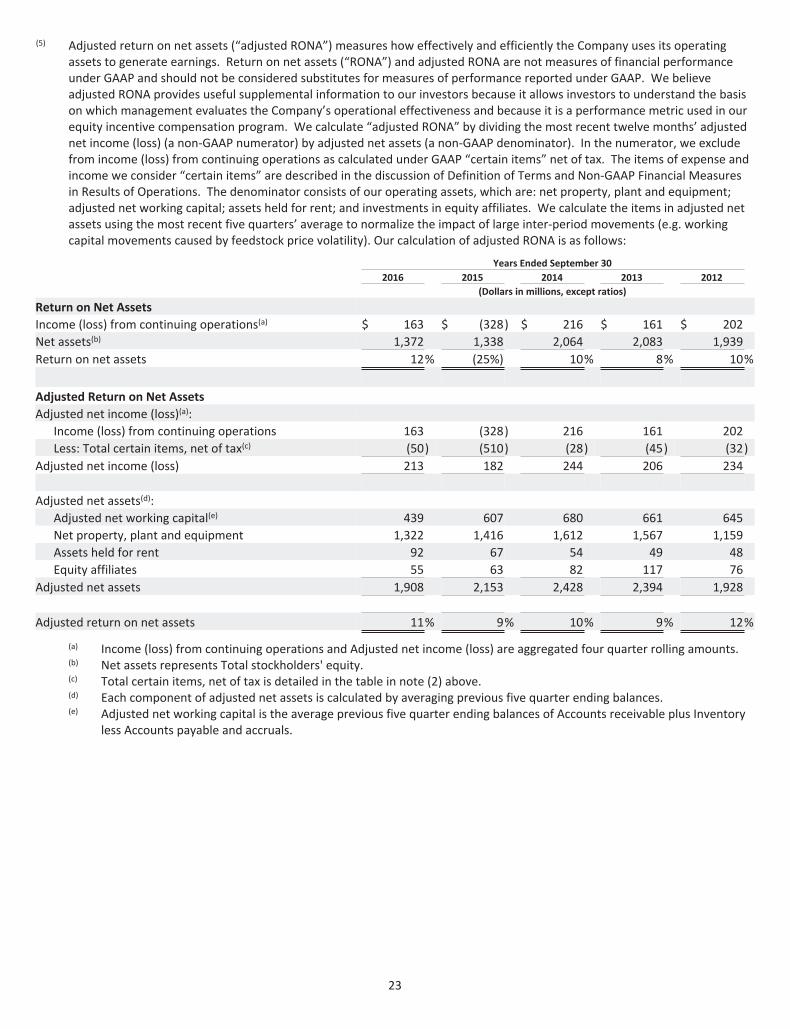
23
(5) Adjusted return on net assets (“adjusted RONA”) measures how effectively and efficiently the Company uses its operatingassets to generate earnings. Return on net assets (“RONA”) and adjusted RONA are not measures of financial performanceunder GAAP and should not be considered substitutes for measures of performance reported under GAAP. We believeadjusted RONA provides useful supplemental information to our investors because it allows investors to understand the basison which management evaluates the Company’s operational effectiveness and because it is a performance metric used in ourequity incentive compensation program. We calculate “adjusted RONA” by dividing the most recent twelve months’ adjustednet income (loss) (a non-GAAP numerator) by adjusted net assets (a non-GAAP denominator). In the numerator, we excludefrom income (loss) from continuing operations as calculated under GAAP “certain items” net of tax. The items of expense andincome we consider “certain items” are described in the discussion of Definition of Terms and Non-GAAP Financial Measuresin Results of Operations. The denominator consists of our operating assets, which are: net property, plant and equipment;adjusted net working capital; assets held for rent; and investments in equity affiliates. We calculate the items in adjusted netassets using the most recent five quarters’ average to normalize the impact of large inter-period movements (e.g. workingcapital movements caused by feedstock price volatility). Our calculation of adjusted RONA is as follows:
Years Ended September 302016 2015 2014 2013 2012
(Dollars in millions, except ratios)Return on Net AssetsIncome (loss) from continuing operations(a) $ 163 $ (328) $ 216 $ 161 $ 202Net assets(b) 1,372 1,338 2,064 2,083 1,939Return on net assets 12% (25%) 10% 8% 10%
Adjusted Return on Net AssetsAdjusted net income (loss)(a):
Income (loss) from continuing operations 163 (328) 216 161 202Less: Total certain items, net of tax(c) (50) (510) (28) (45) (32)
Adjusted net income (loss) 213 182 244 206 234
Adjusted net assets(d):Adjusted net working capital(e) 439 607 680 661 645Net property, plant and equipment 1,322 1,416 1,612 1,567 1,159Assets held for rent 92 67 54 49 48Equity affiliates 55 63 82 117 76
Adjusted net assets 1,908 2,153 2,428 2,394 1,928
Adjusted return on net assets 11% 9% 10% 9% 12%
(a) Income (loss) from continuing operations and Adjusted net income (loss) are aggregated four quarter rolling amounts.(b) Net assets represents Total stockholders' equity.(c) Total certain items, net of tax is detailed in the table in note (2) above.(d) Each component of adjusted net assets is calculated by averaging previous five quarter ending balances.(e) Adjusted net working capital is the average previous five quarter ending balances of Accounts receivable plus Inventory
less Accounts payable and accruals.

24
Item 7. Management’s Discussion and Analysis of Financial Condition and Results of Operations
Critical Accounting Policies
The preparation of our financial statements is in accordance with accounting principles generally accepted in the United States(“GAAP”). This preparation of our financial statements requires management to make estimates and judgments that affect thereported amounts of assets, liabilities, revenues, and expenses and related disclosure of contingent assets and liabilities. Weconsider an accounting estimate to be critical to the financial statements if (i) the estimate is complex in nature or requires a highdegree of judgment and (ii) different estimates and assumptions were used, the results could have a material impact on theconsolidated financial statements. On an ongoing basis, we evaluate our estimates and the application of our policies. We base ourestimates on historical experience, current conditions and on various other assumptions that we believe are reasonable under thecircumstances, the results of which form the basis for making judgments about the carrying values of assets and liabilities that arenot readily apparent from other sources. Actual results may differ from these estimates under different assumptions or conditions.The policies that we believe are critical to the preparation of the Consolidated Financial Statements are presented below.
Revenue Recognition and Accounts and Notes Receivable
We recognize revenue when persuasive evidence of an arrangement exists, delivery has occurred or services have beenrendered, the price is fixed or determinable and collectability is reasonably assured. We generally are able to ensure that productsmeet customer specifications prior to shipment. If we are unable to determine that the product has met the specified objectivecriteria prior to shipment or if title has not transferred because of sales terms, the revenue is considered “unearned” and is deferreduntil the revenue recognition criteria are met.
Shipping and handling charges related to sales transactions are recorded as sales revenue when billed to customers orincluded in the sales price. Taxes collected on sales to customers are excluded from revenues.
The following table shows the relative size of the revenue recognized in each of the Company’s reportable segments:
Years ended September 302016 2015 2014
Reinforcement Materials 48% 54% 59%Performance Chemicals 37% 33% 29%Purification Solutions 13% 11% 9%Specialty Fluids 2% 2% 3%
We derive the substantial majority of revenues from the sale of products in Reinforcement Materials and PerformanceChemicals. Revenue from these products is typically recognized when the product is shipped and title and risk of loss have passed tothe customer. We offer certain customers cash discounts and volume rebates as sales incentives. The discounts and volume rebatesare recorded as a reduction in sales at the time revenue is recognized and are estimated based on historical experience andcontractual obligations. We periodically review the assumptions underlying estimates of discounts and volume rebates and adjustrevenues accordingly.
Revenue in Purification Solutions is typically recognized when the product is shipped and title and risk of loss have passed tothe customer. For major activated carbon injection systems projects, revenue is recognized using the percentage-of-completionmethod.
Revenue in Specialty Fluids arises primarily from the rental of cesium formate. This revenue is recognized throughout therental period based on the contracted rental terms. Customers are also billed and revenue is recognized, typically at the end of thejob, for cesium formate product that is not returned. We also generate revenues from cesium formate sold outside of a rentalprocess and revenue is recognized upon delivery of the fluid.
We maintain allowances for doubtful accounts based on an assessment of the collectability of specific customer accounts, theaging of accounts receivable and other economic information on both a historical and prospective basis. Customer account balancesare charged against the allowance when it is probable the receivable will not be recovered. There are no material changes in theallowance for any of the years presented. There is no material off-balance sheet credit exposure related to customer receivablebalances.

25
Inventory Valuation
The cost of all carbon black inventories in the U.S. is determined using the last-in, first-out (“LIFO”) method. Total U.S.inventories utilizing this cost flow assumption were $28 million and $24 million at September 30, 2016 and 2015, respectively. Theseinventories represent 8% and 6% of total worldwide inventories at September 30, 2016 and 2015, respectively. Had we used thefirst-in, first-out (“FIFO”) method instead of the LIFO method for such inventories, the value of those inventories would have been$27 million and $30 million higher as of September 30, 2016 and 2015, respectively. The cost of Specialty Fluids inventories, whichare classified as assets held for rent, is determined using the average cost method. The cost of other U.S. and all non-U.S. inventoriesis determined using the FIFO method. In periods of rapidly rising or declining raw material costs, the inventory method we employcan have a significant impact on our profitability. Under our current LIFO method, when raw material costs are rising, our mostrecent higher priced purchases are the first to be charged to Cost of sales. If, however, we were using a FIFO method, our purchasesfrom earlier periods, which were at lower prices, would instead be the first charged to Cost of sales. The opposite result could occurduring a period of rapid decline in raw material costs.
At certain times, we may decrease inventory levels to the point where layers of inventory recorded under the LIFO methodthat were purchased in preceding years are liquidated. The inventory in these layers may be valued at an amount that is differentthan our current costs. If there is a liquidation of an inventory layer, there may be an impact to our Cost of sales and Net income forthat period. If the liquidated inventory is at a cost lower than our current cost, there would be a reduction in our Cost of sales and anincrease to our Net income during the period. Conversely, if the liquidated inventory is at a cost higher than our current cost, therewill be an increase in our Cost of sales and a reduction to our net income during the period.
We review inventory for both potential obsolescence and potential declines in anticipated selling prices periodically. In thisreview, we make assumptions about the future demand for and market value of the inventory and based on these assumptionsestimate the amount of any obsolete, unmarketable, slow moving or overvalued inventory. We write down the value of ourinventories by an amount equal to the difference between the cost of inventory and the estimated market value. Historically, suchwrite-downs have not been material. If actual market conditions are less favorable than those projected by management at the timeof the assessment, however, additional inventory write-downs may be required, which could reduce our gross profit and ourearnings.
Intangible Assets and Goodwill Impairment
We record tangible and intangible assets acquired and liabilities assumed in business combinations under the acquisitionmethod of accounting. Amounts paid for an acquisition are allocated to the assets acquired and liabilities assumed based on theirfair values at the date of acquisition. Goodwill is comprised of the purchase price of business acquisitions in excess of the fair valueassigned to the net tangible and identifiable intangible assets acquired. Goodwill is not amortized, but is reviewed for impairmentannually as of May 31, or when events or changes in the business environment indicate that the carrying value of the reporting unitmay exceed its fair value. A reporting unit, for the purpose of the impairment test, is at or below the operating segment level, andconstitutes a business for which discrete financial information is available and regularly reviewed by segment management. Theseparate businesses included within Performance Chemicals are considered separate reporting units. The goodwill balance relativeto this segment is recorded in the Metal Oxides reporting unit.
For the purpose of the goodwill impairment test, we first assess qualitative factors to determine whether it is more likely thannot that the fair value of a reporting unit is less than its carrying amount. If an initial qualitative assessment identifies that it is morelikely than not that the carrying value of a reporting unit exceeds its estimated fair value, an additional quantitative evaluation isperformed under the two-step impairment test. Alternatively, we may elect to proceed directly to the quantitative goodwillimpairment test. If based on the quantitative evaluation the fair value of the reporting unit is less than its carrying amount, weperform an analysis of the fair value of all assets and liabilities of the reporting unit. If the implied fair value of the reporting unit’sgoodwill is determined to be less than its carrying amount, an impairment is recognized for the difference. The fair value of areporting unit is based on discounted estimated future cash flows. The fair value is also benchmarked against a market approachusing the guideline public companies method. The assumptions used to estimate fair value include management’s best estimates offuture growth rates, operating cash flows, capital expenditures and discount rates over an estimate of the remaining operatingperiod at the reporting unit level. Should the fair value of any of our reporting units decline below its carrying amount because ofreduced operating performance, market declines, changes in the discount rate, or other conditions, charges for impairment may benecessary.
When we performed our annual goodwill impairment test in the third quarter of fiscal 2015, the fair value of the PurificationSolutions reporting unit was less than its carrying amount and we recorded impairment charges as a result. A discussion of thisassessment and the charges recorded is included under “Purification Solutions Goodwill and Long-Lived Assets Impairment Charges”.

26
Based on our most recent annual goodwill impairment test performed as of May 31, 2016, the fair values of theReinforcement Materials and Fumed Metal Oxides reporting units were substantially in excess of their carrying values. The fair valueof the Purification Solutions reporting unit exceeded its carrying amount by 9% at that time. The fair value of the PurificationSolutions reporting unit includes certain growth assumptions that are primarily dependent on: (1) further growth in the mercuryremoval related portion of the business, which is largely dependent on the amount of coal-based power generation used in theUnited States and the continued regulation of those utilities under MATS and (2) growth in demand for our activated carbonproducts in other applications, while meeting our margin expectations. Realizing these assumptions is generally driven by themacroeconomic environment, environmental regulations, and global and regional competition.
We use assumptions and estimates in determining the fair value of assets acquired and liabilities assumed in a businesscombination. The determination of the fair value of intangible assets requires the use of significant judgment with regard toassumptions used in the valuation model. We estimate the fair value of identifiable acquisition-related intangible assets principallybased on projections of cash flows that will arise from these assets. The projected cash flows are discounted to determine the fairvalue of the assets at the dates of acquisition.
Definite-lived intangible assets, which are comprised of trademarks, customer relationships and developed technologies, areamortized over their estimated useful lives and are reviewed for impairment when indication of potential impairment exists, such asa significant reduction in cash flows associated with the assets. We recognized an impairment on intangible assets associated withthe Purification Solutions business in the third fiscal quarter of 2015 and no events have been subsequently identified that wouldrequire an additional impairment evaluation.
Long-lived Assets Impairment
Our long-lived assets primarily include property, plant and equipment, intangible assets, long-term investments and assetsheld for rent. The carrying values of long-lived assets are reviewed for impairment whenever events or changes in businesscircumstances indicate that the carrying amount of an asset may not be recoverable.
To test for impairment of assets we generally use a probability-weighted estimate of the future undiscounted net cash flows ofthe assets over their remaining lives to determine if the value of the asset is recoverable. Long-lived assets are grouped with otherassets and liabilities at the lowest level for which independent identifiable cash flows are determinable.
An asset impairment is recognized when the carrying value of the asset is not recoverable based on the analysis describedabove, in which case the asset is written down to its fair value. If the asset does not have a readily determinable market value, adiscounted cash flow model may be used to determine the fair value of the asset. In circumstances when an asset does not haveseparate identifiable cash flows, an impairment charge is recorded when we no longer intend to use the asset.
Purification Solutions Goodwill and Long-Lived Assets Impairment Charges
During fiscal 2015 and as a result of the impairment tests performed on goodwill and long-lived assets of the PurificationSolutions reporting unit, we recorded impairment charges and an associated tax benefit in the Consolidated Statements ofOperations as follows:
September 30, 2015(Dollars in millions)
Goodwill impairment charge $ 352Long-lived assets impairment charge 210Benefit for income taxes (80)Impairment charges, net of tax $ 482
In determining the fair value of the Purification Solutions reporting unit, we used an income approach (a discounted cash flowanalysis) which incorporated significant estimates and assumptions related to future periods, including the timing of the MATSimplementation, the anticipated size of the mercury removal industry, and growth rates and pricing assumptions of activatedcarbon, among others. In addition, an estimate of the reporting unit’s weighted average cost of capital (“WACC”) was used todiscount future estimated cash flows to their present value. The WACC was based upon externally available data considering marketparticipants’ cost of equity and debt, optimal capital structure and risk factors specific to the Purification Solutions reporting unit.Based on these estimates and as part of step one of the annual impairment test, we determined that the estimated fair value of thePurification Solutions reporting unit was lower than the reporting unit's carrying value. As such, the reporting unit failed step one ofthe goodwill impairment test. We then proceeded to step two.

27
Step two of the goodwill impairment test requires us to perform a theoretical purchase price allocation for the reporting unitto determine the implied fair value of goodwill and to compare the implied fair value of goodwill to the recorded amount ofgoodwill. The estimate of fair value is complex and requires significant judgment. Accounting guidance provides that we shouldrecognize an estimated impairment charge to the extent that it determines that it is probable that an impairment loss has occurredand such impairment can be reasonably estimated. Based on our best estimate as of June 30, 2015, we recorded a pre-tax goodwillimpairment charge of $353 million. We completed the step two analysis in the fourth quarter of fiscal 2015, which resulted inrecording a credit of $1 million to the pre-tax goodwill impairment charge.
Based on the same factors leading to the goodwill impairment, we also considered whether the reporting unit's carryingvalues of definite-lived intangible assets and property, plant and equipment may not be recoverable or whether the carrying value ofcertain indefinite-lived intangible assets were impaired. We used the income approach to determine the fair value of the indefinite-lived intangible assets, which are the trademarks of Purification Solutions, and determined that the fair value of these intangibleassets was lower than their carrying value. As such, an impairment loss was recorded in the amount of $39 million. Subsequent tothis impairment analysis, we concluded that such assets no longer had an indefinite life and began amortizing these assets over theirestimated useful life. We also performed an impairment analysis to assess if definite-lived intangible assets and property, plant andequipment were recoverable based on the estimated undiscounted cash flows of the reporting unit, and determined that these cashflows were not sufficient to recover the carrying value of the long-lived assets over their remaining useful lives. Accordingly, animpairment charge was recorded based on the lower of the carrying amount or fair value of the long-lived assets. We used theincome approach to determine the fair value of the definite-lived intangible assets and a combination of the cost and marketapproaches to fair value our property, plant and equipment. We recorded impairment charges of $119 million and $51 million, toour definite-lived intangible assets and property, plant and equipment, respectively, in the quarter ended June 30, 2015. Wecompleted the impairment analysis in the fourth quarter of fiscal 2015 which resulted in increasing the property, plant andequipment impairment charge by $1 million to $52 million. Therefore, for the year ended September 30, 2015, the long-lived assetsimpairment charge was $210 million. In connection with the long-lived assets impairment charges, we recorded a deferred taxbenefit of $80 million to our income tax provision.
Pensions and Other Postretirement Benefits
We maintain both defined benefit and defined contribution plans for our employees. In addition, we provide certainpostretirement health care and life insurance benefits for our retired employees. Plan obligations and annual expense calculationsare based on a number of key assumptions. The assumptions, which are specific for each of our U.S. and foreign plans, are related toboth the assets we hold to fund our plans (where applicable) and the characteristics of the benefits that will ultimately be providedto our employees. The most significant assumptions relative to our plan assets include the anticipated rates of return on theseassets. Assumptions relative to our pension obligations are more varied; they include estimated discount rates, rates ofcompensation increases for employees, and mortality, employee turnover and other related demographic data. Projected healthcare and life insurance obligations also rely on the above mentioned demographic assumptions and assumptions surrounding healthcare cost trends. Actual results that differ from the assumptions are generally accumulated and amortized over future periods andcould therefore affect the recognized expense and recorded obligation in such future periods. However, cash flow requirements maybe different from the amounts of expense that are recorded in the consolidated financial statements.
Litigation and Contingencies
We are involved in litigation in the ordinary course of business, including personal injury and environmental litigation. Afterconsultation with counsel, as appropriate, we accrue a liability for litigation when it is probable that a liability has been incurred andthe amount can be reasonably estimated. The estimated reserves are recorded based on our best estimate of the liability associatedwith such matters or the low end of the estimated range of liability if we are unable to identify a better estimate within that range.Our best estimate is determined through the evaluation of various information, including claims, settlement offers, demands bygovernment agencies, estimates performed by independent third parties, identification of other responsible parties and anassessment of their ability to contribute, and our prior experience. Litigation is highly uncertain and there is always the possibility ofan unusual result in any particular case that may reduce our earnings and cash flows.
The most significant reserves that we have established are for environmental remediation and respirator litigation claims. Theamount accrued for environmental matters reflects our assumptions about remediation requirements at the contaminated sites, thenature of the remedies, the outcome of discussions with regulatory agencies and other potentially responsible parties at multi-partysites, and the number and financial viability of other potentially responsible parties. These liabilities can be affected by theavailability of new information, changes in the assumptions on which the accruals are based, unanticipated governmentenforcement action or changes in applicable government laws and regulations, which could result in higher or lower costs.

28
Our current estimate of the cost of our share of existing and future respirator liability claims is based on facts andcircumstances existing at this time. Developments that could affect our estimate include, but are not limited to, (i) significantchanges in the number of future claims, (ii) changes in the rate of dismissals without payment of pending claims, (iii) significantchanges in the average cost of resolving claims, (iv) significant changes in the legal costs of defending these claims, (v) changes in thenature of claims received, (vi) changes in the law and procedure applicable to these claims, (vii) the financial viability of other partieswhich contribute to the settlement of respirator claims, (viii) a change in the availability of insurance coverage maintained by certainof the other parties which contribute to the settlement of respirator claims, or the indemnity provided by a former owner of thebusiness, (ix) changes in the allocation of costs among the various parties paying legal and settlement costs and (x) a determinationthat the assumptions that were used to estimate our share of liability are no longer reasonable. We cannot determine the impact ofthese potential developments on our current estimate of our share of liability for these existing and future claims. Accordingly, theactual amount of these liabilities for existing and future claims could be different than the reserved amount.
Property, Plant and Equipment
Property, plant and equipment are recorded at cost. Depreciation of property, plant and equipment is calculated using thestraight-line method over the estimated useful lives. The depreciable lives for buildings, machinery and equipment, and other fixedassets are twenty to twenty-five years, ten to twenty-five years, and three to twenty-five years, respectively. The cost andaccumulated depreciation for property, plant and equipment sold, retired, or otherwise disposed of are removed from theConsolidated Balance Sheets and resulting gains or losses are included in earnings in the Consolidated Statements of Operations.Expenditures for repairs and maintenance are charged to expenses as incurred. Expenditures for major renewals and betterments,which significantly extend the useful lives of existing plant and equipment, are capitalized and depreciated.
Income Taxes
Our business operations are global in nature, and we are subject to taxes in numerous jurisdictions. Tax laws and tax rates varysubstantially in these jurisdictions and are subject to change based on the political and economic climate in those countries. We fileour tax returns in accordance with our interpretations of each jurisdiction’s tax laws.
Significant judgment is required in determining our worldwide provision for income taxes and recording the related tax assetsand liabilities. In the ordinary course of our business, there are operational decisions, transactions, facts and circumstances, andcalculations which make the ultimate tax determination uncertain. Furthermore, our tax positions are periodically subject tochallenge by taxing authorities throughout the world. We have recorded reserves for taxes and associated interest and penaltiesthat may become payable in future years as a result of audits by tax authorities. Any significant impact as a result of changes inunderlying facts, law, tax rates, tax audit, or review could lead to adjustments to our income tax expense, our effective tax rate,and/or our cash flow.
We record benefits for uncertain tax positions based on an assessment of whether the position is more likely than not to besustained by the taxing authorities. If this threshold is not met, no tax benefit of the uncertain tax position is recognized. If thethreshold is met, the tax benefit that is recognized is the largest amount that is greater than 50% likely of being realized uponultimate settlement. This analysis presumes the taxing authorities’ full knowledge of the positions taken and all relevant facts, butdoes not consider the time value of money. We also accrue for interest and penalties on these uncertain tax positions and includesuch charges in the income tax provision in the Consolidated Statements of Operations.
Additionally, we have established valuation allowances against a variety of deferred tax assets, including net operating losscarry-forwards, foreign tax credits, and other income tax credits. Valuation allowances take into consideration our ability to usethese deferred tax assets and reduce the value of such items to the amount that is deemed more likely than not to be recoverable.Our ability to utilize these deferred tax assets is dependent on achieving our forecast of future taxable operating income over anextended period of time. We review our forecast in relation to actual results and expected trends on a quarterly basis. Failure toachieve our operating income targets may change our assessment regarding the recoverability of our net deferred tax assets andsuch change could result in a valuation allowance being recorded against some or all of our net deferred tax assets. An increase in avaluation allowance would result in additional income tax expense, while a release of valuation allowances in periods when thesetax attributes become realizable would reduce our income tax expense.
Significant Accounting Policies
We have other significant accounting policies that are discussed in Note A of the Notes to our Consolidated FinancialStatements in Item 8 below. Certain of these policies include the use of estimates, but do not meet the definition of critical becausethey generally do not require estimates or judgments that are as difficult or subjective to measure. However, these policies areimportant to an understanding of the Consolidated Financial Statements.

29
Results of Operations
Cabot is organized into four reportable business segments: Reinforcement Materials, Performance Chemicals, PurificationSolutions, and Specialty Fluids. Cabot is also organized for operational purposes into three geographic regions: the Americas; Europe,Middle East and Africa; and Asia Pacific. The discussions of our results of operations for the periods presented reflect thesestructures.
Our analysis of financial condition and operating results should be read with our consolidated financial statements andaccompanying notes. Unless a calendar year is specified, all references to years in this discussion are to our fiscal years endedSeptember 30.
Definition of Terms and Non-GAAP Financial Measures
When discussing our results of operations, we use several terms as described below.
The term “product mix” refers to the mix of types and grades of products sold or the mix of geographic regions whereproducts are sold, and the positive or negative impact this has on the revenue or profitability of the business and/or segment.
The term “LIFO” includes two factors: (i) the impact of current inventory costs being recognized immediately in Cost of salesunder a last-in first-out method, compared to the older costs that would have been included in Cost of sales under a first-in first-outmethod (“Cost of sales impact”); and (ii) the impact of reductions in inventory quantities, causing historical inventory costs to flowthrough Cost of sales (“liquidation impact”).
Our discussion under the heading “Provision (Benefit) for Income Taxes and Reconciliation of Effective Tax Rate to OperatingTax Rate” includes a discussion of our “effective tax rate” and our “operating tax rate” and includes a reconciliation of the two rates.Our operating tax rate is a non-GAAP financial measure and should not be considered as an alternative to our effective tax rate, themost comparable GAAP financial measure. In calculating our operating tax rate, we exclude discrete tax items, which include: i)unusual or infrequent items such as a significant release or establishment of a valuation allowance, ii) items related to uncertain taxpositions such as the tax impact of audit settlements, interest on tax reserves, and the release of tax reserves from the expiration ofstatutes of limitations, and iii) other discrete tax items, such as the tax impact of legislative changes and, on a quarterly basis, thetiming of losses in certain jurisdictions and the cumulative rate adjustment, if applicable. We also exclude the tax impact of certainitems, as defined below in the discussion of Total segment EBIT, on both operating income and the tax provision. Our definition ofthe operating tax rate may not be comparable to the definition used by other companies. Management believes that the non-GAAPfinancial measure is useful supplemental information because it helps our investors compare our tax rate year to year on aconsistent basis and understand what our tax rate on current operations would be without the impact of these items.
Our discussion under the heading “Fiscal 2016 compared to Fiscal 2015 and Fiscal 2015 compared to Fiscal 2014—By BusinessSegment” includes a discussion of Total segment EBIT, which is a non-GAAP financial measure. Our Chief Operating Decision Maker,who is our President and Chief Executive Officer, uses segment EBIT to evaluate the operating results of each segment and toallocate resources to the segments. We believe Total segment EBIT, which reflects the sum of EBIT from our four reportablesegments, provides useful supplemental information for our investors as it is an important indicator of the Company’s operationalstrength and performance, allows investors to see our results through the eyes of management, and provides context for ourdiscussion of individual business segment performance. Total segment EBIT should not be considered an alternative for Income(loss) from continuing operations before income taxes and equity in earnings of affiliated companies, which is the most directlycomparable GAAP financial measure. A reconciliation of Total segment EBIT to Income (loss) from continuing operations beforeincome taxes and equity in earnings of affiliated companies is provided in Note U of our Consolidated Financial Statements.Investors should consider the limitations associated with this non-GAAP measure, including the potential lack of comparability ofthis measure from one company to another.

30
In calculating Total segment EBIT, we exclude from our Income (loss) from continuing operations before income taxes andequity in earnings of affiliated companies (i) items of expense and income that management does not consider representative of ourfundamental on-going segment results, which we refer to as “certain items”, and (ii) items that, because they are not controlled bythe business segments and primarily benefit corporate objectives, are not allocated to our business segments, such as interestexpense and other corporate costs, which include unallocated corporate overhead expenses such as certain corporate salaries andheadquarter expenses, plus costs related to special projects and initiatives, which we refer to as “other unallocated items”.Management believes excluding the items identified as certain items facilitates operating performance comparisons from period toperiod by eliminating differences caused by the existence and timing of certain expense and income items that would not otherwisebe apparent on a GAAP basis and also facilitates an evaluation of the Company’s operating performance without the impact of thesecosts or benefits. The calculations of Total segment EBIT for the periods presented exclude the impact of the following items that areincluded in our GAAP Income (loss) from continuing operations before income taxes and equity in earnings of affiliated companies:
Global restructuring activities include costs or benefits associated with cost reduction initiatives or plant closures andare primarily related to (i) employee termination costs, (ii) asset impairment charges associated with restructuringactions, (iii) costs to close facilities, including environmental costs and contract termination penalties and (iv) gainsrealized on the sale of land or equipment associated with restructured plants or locations.
Foreign currency loss on devaluation represents the impact of government controlled currency devaluations on theCompany’s net monetary assets denominated in that currency. Most recently this has applied to currency exchange ratechanges in Argentina and Venezuela.
Legal and environmental matters and reserves consist of costs or benefits for matters typically related to formerbusinesses or that are otherwise incurred outside of the ordinary course of business.
Executive transition costs include incremental charges, including stock compensation charges, associated with theretirement or termination of employment of senior executives of the Company.
Asset impairment charges primarily include charges associated with an impairment of goodwill or other long-livedassets.
Acquisition and integration-related charges include transaction costs, redundant costs incurred during the period ofintegration, and costs associated with transitioning certain management and business processes to Cabot’s processes.
Employee benefit plan settlement charges consist of the costs associated with transferring the obligations and assetsheld by one of the Company’s defined benefit plans to a multi-employer plan.
Drivers of Demand and Key Factors Affecting Profitability
Drivers of demand and key factors affecting our profitability differ by segment. In Reinforcement Materials, longer termdemand is driven primarily by: i) the number of vehicle miles driven globally; ii) the number of original equipment and replacementtires produced; and iii) the number of automotive builds. Over the past several years, operating results have been driven by anumber of factors, including: i) increases or decreases in our sales volumes driven by changes in production levels for tires orindustrial rubber products and the level at which we service that demand; ii) changes in raw material costs and our ability to adjustthe sales price for our products commensurate with changes in raw material costs; iii) changes in pricing and product mix dependenton the level of price increases or decreases to customers as well as the mix of products sold or the region in which they are sold; iv)global and regional capacity utilization for carbon black; v) fixed cost savings achieved through restructuring and other cost savingactivities; vi) the growth of our volumes and market position in emerging economies; vii) capacity management and technologyinvestments, including the impact of energy utilization and yield improvement technologies at our manufacturing facilities; and viii)royalties and technology payments related to our patented elastomer composites technology that is used in tire applications.
In Performance Chemicals, longer term demand is driven primarily by the construction and infrastructure, automotive,electronics and consumer products industries. In recent years, operating results in Performance Chemicals have been driven by: i)increases or decreases in sales volumes to the industries previously noted; ii) our ability to deliver differentiated products that driveenhanced performance in customers’ applications; iii) our ability to obtain value pricing for this differentiation; iv) the cost of newcapacity; and v) the adoption of new products for use in our customers’ applications.
In Purification Solutions, longer term demand is driven primarily by the demand for activated carbon based solutions forwater, gas and air, pharmaceuticals, food and beverages, catalysts and other chemical applications. Operating results in PurificationSolutions have been influenced by: i) changes in our sales volumes in the various applications previously noted; ii) the amount ofcoal-based power generation utilized in the U.S. and the regulation of those utilities; iii) management of our operations, includinginventory levels, and the commensurate costs; iv) changes in price and product mix; and v) industry capacity utilization.

31
In Specialty Fluids, demand for cesium formate is primarily driven by the level of drilling activity for high pressure oil and gaswells and by the petroleum industry’s acceptance of our product as a drilling and completion fluid for this application. Operatingresults in Specialty Fluids are influenced by the number of drilling projects as well as the size, type and duration of the drilling jobswithin the business.
Overview of Results for Fiscal 2016
During fiscal 2016, Income (loss) from continuing operations before income taxes and equity in earnings of affiliatedcompanies increased compared to fiscal 2015 largely due to the goodwill and long-lived asset impairment charges related to thePurification Solutions segment that we recorded in the third quarter of fiscal 2015. In addition, our results for fiscal 2016 ascompared with results for fiscal 2015 reflect strong EBIT in the Performance Chemicals segment and the benefit from restructuringactions taken to reduce fixed costs across the Company.
Fiscal 2016 compared to Fiscal 2015 and Fiscal 2015 compared to Fiscal 2014—Consolidated
Net Sales and other operating revenue and Gross Profit
Years ended September 302016 2015 2014
(Dollars in millions)Net sales and other operating revenues $ 2,411 $ 2,871 $ 3,647Gross profit $ 578 $ 585 $ 721
The $460 million decrease in net sales from fiscal 2015 to fiscal 2016 was due primarily to a less favorable price and productmix (combined $398 million) and an unfavorable impact from foreign currency translation ($63 million). The less favorable price andproduct mix impact was primarily due to lower selling prices during the year from price adjustments to customers for decreases inraw materials costs. The $776 million decrease in net sales from fiscal 2014 to fiscal 2015 was due primarily to a less favorable priceand product mix (combined $433 million), an unfavorable impact from foreign currency translation ($203 million), a decrease involumes ($116 million), lower elastomer composites royalties and technology payments ($10 million), and lower royalties inPurification Solutions ($3 million). The less favorable price and product mix impact was primarily due to lower selling prices duringthe year from price adjustments to customers for decreases in raw materials costs.
Gross profit decreased by $7 million in fiscal 2016 when compared to fiscal 2015 driven by lower unit margins inReinforcement Materials and Purification Solutions partially offset by fixed cost savings. Gross profit decreased by $136 million infiscal 2015 when compared to fiscal 2014 driven by lower margins in Reinforcement Materials and lower volumes in Specialty Fluids.
Selling and Administrative Expenses
Years Ended September 302016 2015 2014
(Dollars in millions)Selling and administrative expenses $ 275 $ 282 $ 326
Selling and administrative expenses decreased by $7 million in fiscal 2016 when compared to fiscal 2015.The decrease wasprincipally driven by restructuring actions taken to reduce fixed costs across the Company partially offset by an increase in thereserve for respirator liability matters and higher incentive compensation expense. Selling and administrative expenses decreased by$44 million in fiscal 2015 when compared to fiscal 2014. The decrease was principally driven by reduced spending on travel andcorporate projects, lower incentive compensation expense, and lower expenses related to a 2014 restructuring in our Europe,Middle East and Africa (“EMEA”) business service center.
Research and Technical Expenses
Years Ended September 302016 2015 2014
(Dollars in millions)Research and technical expenses $ 53 $ 58 $ 60
Research and technical expenses decreased by $5 million in fiscal 2016 when compared to fiscal 2015 primarily due torestructuring actions taken to reduce fixed costs across the Company partially offset by $5 million of costs associated with theseactions. Research and technical expenses decreased by $2 million in fiscal 2015 when compared to fiscal 2014 due to lower spendingon projects across the segments.

32
Purification Solutions Long-Lived Assets and Goodwill Impairment Charges
Years ended September 302016 2015 2014
(Dollars in millions)Purification Solutions long-lived assets impairment charge $ — $ 210 $ —Purification Solutions goodwill impairment charge $ — $ 352 $ —
The Purification Solutions long-lived assets and goodwill impairment charges recorded during fiscal 2015 are described in NoteG of our Consolidated Financial Statements.
Interest and Dividend Income
Years Ended September 302016 2015 2014
(Dollars in millions)Interest and dividend income $ 5 $ 4 $ 3
Interest and dividend income increased by $1 million in fiscal 2016 when compared to fiscal 2015 and in fiscal 2015 whencompared to fiscal 2014 due primarily to interest earned on higher cash balances.
Interest Expense
Years Ended September 302016 2015 2014
(Dollars in millions)Interest expense $ 54 $ 53 $ 55
Interest expense increased by $1 million in fiscal 2016 as compared to fiscal 2015. The increase was primarily due to higherinterest rates on commercial paper borrowings. Interest expense decreased by $2 million in fiscal 2015 as compared to fiscal 2014.The decrease was primarily due to the repayment of certain long-term debt.
Other Income (Expense)
Years Ended September 302016 2015 2014
(Dollars in millions)Other income (expense) $ (7) $ (11) $ 25
Other income (expense) changed during fiscal 2016 by $4 million as compared to fiscal 2015 due to a variety of items, none ofwhich were individually material. Other income (expense) changed by $36 million during fiscal 2015 as compared to fiscal 2014 dueprimarily to a gain recognized on our existing equity investment in NHUMO ($29 million) in fiscal 2014 as a result of the NHUMOtransaction and the unfavorable comparison of foreign currency movements ($6 million).
Provision (Benefit) for Income Taxes and Reconciliation of Effective Tax Rate to Operating Tax Rate
Years Ended September 302016 2015 2014
(Dollars in millions)Provision (benefit) for income taxes $ 34 $ (45) $ 92Effective tax rate 18% 12% 30%Impact of discrete tax items:
Unusual or infrequent items 2% (2)% (7%)Items related to uncertain tax positions 1% (2)% 3%Other discrete tax items (2%) 1% (2%)
Impact of certain items 5% 17% 3%Operating tax rate 24% 26% 27%
The provision for income taxes was $34 million for fiscal 2016, resulting in an effective tax rate of 18% (refer to the effectivetax rate reconciliation in Note S of our Consolidated Financial Statements). This amount included net tax benefits of $31 million,principally comprised of $31 million of tax benefits from certain items partially offset by a net charge of less than $1 million fordiscrete tax items. The operating tax rate for fiscal 2016 was 24%. The decrease in the operating tax rate from fiscal 2015 was largelydriven by a change in the geographic mix of earnings.

33
The benefit for income taxes was $45 million for fiscal 2015, resulting in an effective tax rate of 12% (refer to the effective taxrate reconciliation in Note S of our Consolidated Financial Statements). This amount included net tax benefits of $107 million,principally comprised of an $80 million benefit from the impairment of the Purification Solutions segment, $14 million of benefitsfrom other certain items and $13 million of benefits from discrete tax items. Refer to Note G of our Consolidated FinancialStatements for details of the impairment. The operating tax rate for fiscal 2015 was 26%.
The provision for income taxes was $92 million for fiscal 2014, resulting in an effective tax rate of 30% (refer to the effectivetax rate reconciliation in Note S of our Consolidated Financial Statements). This amount included net discrete charges of $17 million,principally comprised of a $20 million valuation allowance, partially offset by a non-taxable gain of $29 million recognized on theCompany’s pre-existing investment in NHUMO as a result of the NHUMO transaction. This gain is reported as a certain item. Refer toNote C of our Consolidated Financial Statements for details of the transaction. The operating tax rate for fiscal 2014 was 27%.
The nature of the discrete tax items for the periods ended September 30, 2016, 2015, and 2014 were as follows:
(i) Unusual or infrequent items included tax benefits during fiscal 2016 and 2015 from the renewal of the U.S. Research andExperimentation credit, extraordinary dividends from subsidiaries (fiscal 2016 only), a claim for U.S. tax benefit (fiscal2016 only), certain dividends from high-tax jurisdictions (fiscal 2015 only), and other non-routine items, and a tax chargeduring fiscal 2014 for a change in valuation allowance on beginning of year tax balance;
(ii) Items related to uncertain tax positions included tax benefits during fiscal 2016, 2015 and 2014 from uncertain taxpositions accrual reversals due to the expiration of statutes of limitations and settlement of tax audits, partially offset bya charge for the accrual of interest on uncertain tax positions, and;
(iii) Other discrete tax items included tax charges during fiscal 2016, 2015 and 2014 for a change in valuation allowance onbeginning of year tax balance (fiscal 2016 only), various return to provision true-ups related to tax return filings andchanges in tax laws.
Our anticipated effective and operating tax rates for fiscal 2017 are 24%.
Cabot files U.S. federal and state and non-U.S. income tax returns in jurisdictions with varying statutes of limitations. Cabotand certain subsidiaries are under audit in a number of jurisdictions. It is possible that some of these audits will be resolved in fiscal2017 and could impact our anticipated effective tax rate. We have filed our tax returns in accordance with the tax laws in eachjurisdiction and maintain tax reserves for uncertain tax positions.
Equity in Earnings of Affiliated Companies and Net Income Attributable to Noncontrolling Interest, net of tax
Years Ended September 302016 2015 2014
(Dollars in millions)Equity in earnings of affiliated companies, net of tax $ 3 $ 4 $ —Net income attributable to noncontrolling interests, net of tax $ 15 $ 8 $ 19
Equity in earnings of affiliated companies, net of tax, decreased by $1 million in fiscal 2016 compared to fiscal 2015 andincreased by $4 million in fiscal 2015 compared to fiscal 2014. The changes in both periods were primarily due to changes in earningsfrom our Venezuelan equity affiliate.
Net income attributable to noncontrolling interests, net of tax, increased by $7 million in fiscal 2016 compared to fiscal 2015and decreased by $11 million in fiscal 2015 compared to fiscal 2014 due to changes in the profitability of our joint ventures.
Net Income (Loss) Attributable to Cabot Corporation
In fiscal 2016, we reported net income of $149 million ($2.36 per diluted common share). In fiscal 2015, we reported a net lossof $334 million ($5.27 per diluted common share). The loss was driven by the Purification Solutions long-lived asset and goodwillimpairment charges more fully discussed in Note G of our Consolidated Financial Statements. This is compared to net income of$199 million ($3.03 per diluted common share) in fiscal 2014.

34
Fiscal 2016 compared to Fiscal 2015 and Fiscal 2015 compared to Fiscal 2014—By Business Segment
Total segment EBIT, certain items, other unallocated items and Income (loss) from continuing operations before income taxesand equity in earnings of affiliated companies for fiscal 2016, 2015 and 2014 are set forth in the table below. The details of certainitems and other unallocated items are shown below and in Note U of our Consolidated Financial Statements.
Years Ended September 302016 2015 2014
(Dollars in millions)Total segment EBIT $ 370 $ 332 $ 447Certain items (81) (617) (28)Other unallocated items (95) (92) (111)
Income (loss) from continuing operations before incometaxes and equity in earnings of affiliated companies $ 194 $ (377) $ 308
In fiscal 2016, total segment EBIT increased by $38 million when compared to fiscal 2015. The increase was driven by lowerfixed costs ($64 million) and the favorable impact of foreign currency translation ($10 million), partially offset by the unfavorableimpact from reducing inventory levels ($36 million).
In fiscal 2015, total segment EBIT decreased by $115 million when compared to fiscal 2014. The decrease was driven by lowervolumes ($69 million), lower unit margins ($44 million), an unfavorable comparison of foreign currency movements ($20 million),lower elastomer composites royalties and technology payments ($10 million), lower Purification Solutions royalties ($3 million) andthe absence of a one-time insurance recovery in fiscal 2014 that did not repeat in fiscal 2015 in Purification Solutions ($9 million).These impacts were partially offset by lower fixed costs ($46 million).
Certain Items:
Details of the certain items for fiscal 2016, 2015, and 2014 are as follows:
Years Ended September 302016 2015 2014
(Dollars in millions)Impairment of goodwill and long-lived assets of Purification
Solutions $ — $ (562) $ —Global restructuring activities (47) (21) (29)Acquisition and integration-related charges — (5) (7)Employee benefit plan settlement and other charges — (21) —Foreign currency gain (loss) on revaluations (11) (2) (3)Gain on existing investment in NHUMO — — 29Legal and environmental matters and reserves (17) — (18)Inventory reserve adjustment — (6) —Executive transition costs (6) — —
Total certain items, pre-tax $ (81) $ (617) $ (28)Tax-related certain itemsTax impact of certain items $ 31 $ 94 $ 17Discrete tax items — 13 (17)
Total tax-related certain items 31 107 —Total certain items, net of tax $ (50) $ (510) $ (28)
An explanation of these items of expense and income is included in our discussion under the heading “Definition of Terms andNon-GAAP Financial Measures”. Additional information concerning several of these items is included in the Notes to ourConsolidated Financial Statements as follows: Impairment of goodwill and long-lived assets (Note G); Global restructuring activities(Note P); Employee benefit plan settlements (Note N); and Inventory reserve adjustment (Note E). Acquisition and integration-related charges include legal and professional fees, the incremental value of inventory as a result of purchase accountingadjustments and other expenses related to the completion of the acquisitions and the integrations of Purification Solutions andNHUMO. Tax-related certain items include discrete tax items, the nature of which are discussed under the heading “Provision(Benefit) for Income Taxes and Reconciliation of Effective Tax Rate to Operating Tax Rate”, and the tax impact of certain foreignexchange losses.
The tax impact of certain items is determined by (1) starting with the current and deferred income tax expense or benefit,included in Net income attributable to Cabot Corporation, and (2) subtracting the tax expense or benefit on “adjusted earnings”.

35
Adjusted earnings is defined as the pre-tax income attributable to Cabot Corporation excluding certain items. The tax expense orbenefit on adjusted earnings is calculated by applying the operating tax rate, as defined under the section Definition of Terms andNon-GAAP Financial Measures, to adjusted earnings.
Other Unallocated Items:
Years Ended September 302016 2015 2014
(Dollars in millions)Interest expense $ (54) $ (53) $ (55)Equity in earnings of affiliated companies, net of tax (3) (4) —Unallocated corporate costs (45) (46) (54)General unallocated income (expense) 7 11 (2)
Total other unallocated items $ (95) $ (92) $ (111)
A discussion of items that we refer to as “other unallocated items” can be found under the heading “Definition of Terms andNon-GAAP Financial Measures”. The balances of unallocated corporate costs are primarily comprised of expenditures related tomanaging a public company that are not allocated to the segments and corporate business development costs related to newtechnology efforts. The balances of General unallocated income (expense) consists of gains (losses) arising from foreign currencytransactions, net of other foreign currency risk management activities, the impact of accounting for certain inventory on a LIFObasis, the profit or loss related to the corporate adjustment for unearned revenue, and the impact of including the full operatingresults of an equity affiliate in Purification Solutions Segment EBIT.
In fiscal 2016, costs from Total other unallocated items increased by $3 million when compared to fiscal 2015. The increasewas primarily driven by a change of $4 million in General unallocated income (expense) due to the cost of sales impact of LIFOaccounting from changes in carbon black raw material costs that resulted in an unfavorable comparison ($19 million), partially offsetby the favorable impact of changes in foreign currency movements ($13 million).
In fiscal 2015, costs from Total other unallocated items decreased by $19 million when compared to fiscal 2014. The decreasewas driven by a change of $13 million of General unallocated income (expense) due to the cost of sales impact of LIFO accountingfrom changes in carbon black raw material costs that resulted in a favorable comparison ($19 million) partially offset by theunfavorable impact of changes in foreign currency movements ($6 million). In addition, Unallocated corporate costs decreased by $8million primarily associated with lower spending for corporate projects and lower expenses related to incentive compensation.
Reinforcement Materials
Sales and EBIT for Reinforcement Materials for fiscal 2016, 2015 and 2014 are as follows:
Years Ended September 302016 2015 2014
(Dollars in millions)Reinforcement Materials Sales $ 1,108 $ 1,507 $ 2,108Reinforcement Materials EBIT $ 137 $ 143 $ 259
In fiscal 2016, sales in Reinforcement Materials decreased by $399 million when compared to fiscal 2015. The decrease wasprincipally driven by less favorable price and product mix (combined $335 million), 2% lower volumes ($27 million), and anunfavorable comparison from foreign currency translation ($37 million). The less favorable price and product mix was primarily dueto lower selling prices from price adjustments to customers for decreases in raw material costs. Lower volumes were driven by lowerdemand in South America and Asia due to a challenging macro-economic environment and the closure of our Merak, Indonesiamanufacturing plant.
In fiscal 2015, sales in Reinforcement Materials decreased by $601 million when compared to fiscal 2014. The decrease wasprincipally driven by a less favorable price and product mix (combined $418 million), an unfavorable comparison of foreign currencytranslation ($116 million), 2% lower volumes ($55 million), and lower elastomer composites royalties and technology payments ($10million). The less favorable price and product mix was primarily due to price adjustments to customers for decreases in raw materialcosts, lower pricing, and a shift in regional mix from North America to Asia. Lower volumes were driven by a reduction in rubberblacks volumes from lower contractual volumes in North America and weaker demand in China and South America. The lowerelastomer composites royalties and technology payments were due to the transition from a fixed to a variable royalty arrangementand lower technology milestone payments.
In fiscal 2016, Reinforcement Materials EBIT decreased by $6 million when compared to fiscal 2015 driven principally by lowerunit margins ($23 million) and lower volumes ($10 million). The decrease was partially offset by lower fixed costs ($19 million) and a

36
favorable comparison from foreign currency translation ($9 million). Lower unit margins were driven primarily by lower year overyear contract pricing in the first quarter of fiscal 2016, increased competition in Asia, unfavorable feedstock-related effects, andlower benefits generated from our energy efficiency investments as a result of lower energy prices. The favorable foreign currencyimpact was mainly due to the translation of our local currency fixed costs in South America to U.S. dollars. Lower fixed costs weredue to cost reductions as a result of restructuring actions and reduced maintenance costs.
In fiscal 2015, Reinforcement Materials EBIT decreased by $116 million when compared to fiscal 2014 driven principally bylower rubber blacks unit margins ($91 million), lower rubber blacks volumes ($14 million), lower elastomer composites royalties andtechnology payments ($10 million), and an unfavorable comparison of foreign currency translation ($7 million). The decreases werepartially offset by lower rubber blacks fixed costs ($9 million). The less favorable rubber blacks unit margins were due to lowercontract pricing and increased competition in Asia, negative feedstock effects from lower raw materials purchasing savings, lowerbenefits from our energy efficiency investments, and the impact of high cost inventory that moved through our supply chain duringthe first half of the year. We also experienced a less favorable sales mix, with lower sales in North America and higher sales in Asia.Lower rubber blacks fixed costs were primarily associated with cost management efforts and lower discretionary spending.
Performance Chemicals
Sales and EBIT for Performance Chemicals for fiscal 2016, 2015 and 2014 are as follows:
Years Ended September 302016 2015 2014
(Dollars in millions)Specialty Carbons and Formulations Sales $ 578 $ 630 $ 709Metal Oxides Sales 287 297 313
Performance Chemicals Sales $ 865 $ 927 $ 1,022Performance Chemicals EBIT $ 225 $ 178 $ 168
In fiscal 2016, sales in Performance Chemicals decreased by $62 million when compared to fiscal 2015 due to a less favorableprice and product mix (combined $51 million) and the unfavorable comparison from foreign currency translation ($21 million)partially offset by higher volumes ($10 million). The change in price and product mix was mainly driven by price adjustments tocustomers for decreases in raw material costs.
In fiscal 2015, sales in Performance Chemicals decreased by $95 million when compared to fiscal 2014 due to an unfavorablecomparison of foreign currency translation ($64 million), and a less favorable price and product mix (combined $32 million). Thechange in price and product mix was mainly driven by price adjustments to customers for decreases in raw material costs.
In fiscal 2016, EBIT in Performance Chemicals was $47 million higher when compared to fiscal 2015 primarily due to higherunit margins ($34 million) and lower fixed costs ($22 million), partially offset by the unfavorable impact of reducing inventory levels($6 million) and the unfavorable impact of foreign currency translation ($2 million). Unit margins improved primarily due to lowerraw material costs. Lower fixed costs were primarily due to cost reductions as a result of restructuring actions taken earlier in thefiscal year.
In fiscal 2015, EBIT in Performance Chemicals was $10 million higher when compared to fiscal 2014 due to higher unit margins($20 million) and lower fixed costs ($8 million). The improvement in unit margins was driven by lower raw material costs. Lowerfixed costs were a result of cost management efforts across the segment. These benefits were partially offset by unfavorable foreigncurrency translation ($16 million) and slightly lower volumes ($2 million). Volumes were relatively flat across the segment duringfiscal 2015.
Purification Solutions
Sales and EBIT for Purification Solutions for fiscal 2016, 2015 and 2014 are as follows:
Years Ended September 302016 2015 2014
(Dollars in millions)Purification Solutions Sales $ 290 $ 296 $ 315Purification Solutions EBIT $ (5) $ 5 $ (19)

37
Sales in Purification Solutions decreased by $6 million in fiscal 2016 when compared to fiscal 2015 primarily due to a lessfavorable price and product mix (combined $10 million) and the unfavorable impact of foreign currency translation ($6 million),partially offset by an increase in volumes ($10 million). The less favorable price and product mix was due to competitive factors incertain gas and air and water applications as well as increased demand for lower priced products. Higher volumes were driven byhigher demand for activated carbon in gas and air applications as the MATS regulation took full effect in April 2016.
Sales in Purification Solutions decreased by $19 million in fiscal 2015 when compared to fiscal 2014 due to an unfavorablecomparison of foreign currency translation ($23 million), lower royalties ($3 million) and lower volumes ($3 million), partially offsetby a more favorable price and product mix (combined $10 million). The more favorable price and product mix was primarily due tothe implementation of price increases and an improved product mix. These price increases contributed to a decline in overall salesvolumes; however, volumes sold to mercury removal customers increased due to the first wave of customers complying with theMATS regulation in April 2015.
EBIT in Purification Solutions decreased by $10 million in fiscal 2016 when compared to fiscal 2015 driven by the unfavorableimpact from reducing inventory levels ($29 million) and lower unit margins ($12 million) due to a less favorable price and productmix and higher raw material costs, partially offset by lower fixed costs due to cost reduction efforts ($19 million), higher volumes ($9million), and the favorable impact of foreign currency exchange ($3 million).
EBIT in Purification Solutions increased by $24 million in fiscal 2015 when compared to fiscal 2014 driven by improved unitmargins ($21 million), lower fixed costs ($14 million), and the favorable comparison of foreign currency translation ($2 million).These improvements were partially offset by lower royalties ($3 million) and the absence of a one-time insurance recovery in fiscal2014 that did not repeat in fiscal 2015 ($9 million), and lower volumes ($2 million). Higher unit margins were due to theimplementation of price increases, improvement in the product mix and lower variable costs. Lower fixed costs were a result ofimproved operational performance, cost management efforts and $5 million of lower depreciation and amortization.
Specialty Fluids
Sales and EBIT for Specialty Fluids for fiscal 2016, 2015 and 2014 are as follows:
Years Ended September 302016 2015 2014
(Dollars in millions)Specialty Fluids Sales $ 47 $ 42 $ 98Specialty Fluids EBIT $ 13 $ 6 $ 39
Sales in Specialty Fluids increased by $5 million in fiscal 2016 when compared to fiscal 2015. The increase was primarily due tohigher volumes ($5 million). The increase in volumes was driven by a higher level of project activity that resulted in higher rental andsales volumes for our drilling fluids in both the North Sea and Asia.
Sales in Specialty Fluids decreased by $56 million in fiscal 2015 when compared to fiscal 2014. The decrease was primarily dueto lower volumes ($62 million) from lower project activity levels that resulted in lower rental and sales volumes for our drilling fluids.The lower level of project activity was caused by the downturn in the oil and gas industry, which resulted in fewer investments,project delays, and stringent cost management by our customers. The decrease in volumes was partially offset by a more favorableprice and product mix (combined $6 million).
EBIT in Specialty Fluids increased by $7 million in fiscal 2016 when compared to fiscal 2015. The increase is primarily due tohigher volumes ($4 million) and lower fixed costs ($4 million) partially offset by a less favorable price and product mix ($1 million).
EBIT in Specialty Fluids decreased by $33 million in fiscal 2015 when compared to fiscal 2014. The decrease was primarily dueto lower volumes ($46 million). In response, we improved our price and product mix ($5 million) and reduced fixed costs ($8 million)to help partially offset the lower volumes.

38
Outlook
Looking ahead to fiscal 2017, we remain focused on driving our advancing the core strategy across all of our segments. Theoutlook for Reinforcement Materials is mixed. We are experiencing continued strong demand in Europe and a strengtheningenvironment in China. In North America, the long-term fundamentals for tire growth remain solid, however, the near term market issoft due to high levels of truck tire inventories in the supply chain. The South American market remains weak; however, we arebeginning to see some signs of recovery in calendar year 2017. After a third record year of EBIT in the Performance Chemicalssegment, we expect earnings growth in 2017 to moderate. Although volumes in fumed silica are expected to moderate, the longterm fundamentals of the segment remain solid as we continue to invest for future growth. In the Purification Solutions segment, weanticipate solid performance based on the continued strong growth in the MATS related business combined with the elimination ofthe negative impact associated with decreased inventory levels. For the Specialty Fluids segment, we continue to pursueopportunities outside of the North Sea with a number of projects in the pipeline that support our outlook of continued solidperformance in 2017. Overall, we remain confident that our strategy will deliver top-line growth consistent with our end-marketparticipation. In addition, we will continue to invest in new product and process technology, seek to capture the operating leveragefrom improving plant utilizations, and pursue growth investments, including bolt-on acquisition opportunities in our existingbusinesses.
Cash Flows and Liquidity
Overview
Our liquidity position, as measured by cash and cash equivalents plus borrowing availability, increased by $384 million duringfiscal 2016. The increase was largely attributable to an increase in borrowing capacity under our revolving credit facility, an increasein our cash balances and a reduction in outstanding commercial paper. As of September 30, 2016, we had cash and cash equivalentsof $200 million and borrowing availability under our revolving credit agreement of $1 billion. Borrowings under our revolving creditagreement, which was amended in October 2015 to increase the borrowing limit from $750 million to $1 billion, may be used forworking capital, letters of credit and other general corporate purposes. There was no outstanding balance of commercial paper as ofSeptember 30, 2016. At September 30, 2016, we were in compliance with all applicable covenants under our revolving credit facilityincluding the total consolidated debt to consolidated EBITDA (earnings before interest, taxes, depreciation and amortization)covenant.
We generally manage our cash and debt on a global basis to provide for working capital requirements as needed by region orsite. Cash and debt are generally denominated in the local currency of the subsidiary holding the assets or liabilities, except wherethere are operational cash flow reasons to hold non-functional currency or debt. The vast majority of our cash and cash equivalentholdings tend to be held outside the U.S., as excess cash balances in the U.S. are generally used to repay commercial paper.
We anticipate sufficient liquidity from (i) cash on hand; (ii) cash flows from operating activities; and (iii) cash available from ourrevolving credit agreement and our commercial paper program to meet our operational and capital investment needs and financialobligations for the foreseeable future. Our liquidity derived from cash flows from operations is, to a large degree, predicated on ourability to collect our receivables in a timely manner, the cost of our raw materials, and our ability to manage inventory levels.
On September 27, 2016, we redeemed $300 million of 5% fixed rate debt that was issued in fiscal 2009 and had a maturitydate of October 1, 2016. In September 2016, Cabot issued $250 million in registered notes with a coupon of 3.4% that mature onSeptember 15, 2026. The net proceeds of this offering were $248 million after deducting discounts and issuance costs.
Our Consolidated Statements of Cash Flows have been presented to include discontinued operations with continuingoperations. Therefore, unless noted otherwise, the following discussion of our cash flows and liquidity position include bothcontinuing and discontinued operations.
The following discussion of the changes in our cash balance refers to the various sections of our Consolidated Statements ofCash Flows.
Cash Flows from Operating Activities
Cash provided by operating activities, which consists of net income adjusted for the various non-cash items included inincome, changes in working capital and changes in certain other balance sheet accounts, totaled $392 million in fiscal 2016.Operating activities provided $499 million and $315 million in fiscal 2015 and 2014, respectively.
Cash provided by operating activities in fiscal 2016 was driven primarily by net income of $164 million plus $161 million ofnon-cash depreciation and amortization. In addition, there was a net decrease in accounts receivable and inventories largely drivenby lower raw material costs and associated price reductions. These sources of cash were partially offset by a decrease in accountspayable.

39
Cash provided by operating activities in fiscal 2015 was driven primarily by our non-cash charges for depreciation andamortization and asset impairments, which more than offset our net loss for the period. In addition, there was a net decrease inaccounts receivable and inventories largely driven by lower raw material costs and associated price reductions.
Cash provided by operating activities in fiscal 2014 was driven primarily by net income of $218 million plus $201 million ofdepreciation and amortization and $25 million of dividends from equity affiliates, $14 million of which was received from NHUMOprior to our purchase of the remaining outstanding common stock of the joint venture. These sources of cash were partially offset byan increase in accounts receivable and inventories due to higher sales and the inclusion of NHUMO balances.
In addition to the factors noted above, the following other elements of operations have a bearing on operating cash flows:
Restructurings — As of September 30, 2016, we had $5 million of total restructuring costs in accrued expenses in theconsolidated balance sheet related to our global restructuring activities. We made cash payments of $37 million during fiscal 2016and received $16 million in cash payments in connection with the sale of land and land rights. In fiscal 2017 and thereafter, weexpect to make cash payments totaling approximately $8 million related to these restructuring plans.
During fiscal 2016, we restructured our operations in certain locations, including the closure of our carbon blackmanufacturing facility in Merak, Indonesia. These actions resulted in net cash outlays of approximately $29 million in fiscal 2016.
We may receive cash in the future from the sale of certain assets and land relating to restructured sites, which is not includedin these amounts.
Environmental Reserves and Litigation Matters—As of September 30, 2016, we have a $14 million reserve for environmentalremediation costs at various sites. These sites are primarily associated with businesses divested in prior years. We anticipate that theexpenditures at these sites will be made over a number of years, and will not be concentrated in any one year. Additionally, as ofSeptember 30, 2016 we have a $21 million reserve for respirator claims. These expenditures will be incurred over many years. Wealso have other litigation costs arising in the ordinary course of business.
The following table represents the estimated future payments related to our environmental reserve.
Future Payments by Fiscal Year2017 2018 2019 2020 2021 Thereafter Total
(Dollars in millions)Environmental $ 2 $ 3 $ 3 $ 1 $ 1 $ 4 $ 14
Cash Flows from Investing Activities
In fiscal 2016, capital expenditures were $112 million. Major capital project expenditures were related to sustaining andcompliance activities. In fiscal 2015, capital expenditures were $141 million. Major capital project expenditures were related to thecompletion of our lignite mine development project in the Purification Solutions segment, mine development activities for ourSpecialty Fluids segment, and sustaining and compliance capital projects at our operating facilities. In fiscal 2014, capitalexpenditures of $171 million and cash paid for NHUMO of $73 million (net of cash acquired of $7 million) were partially offset by thereceipt of the final cash payment on the notes issued as part of the sale of our Supermetals business of $215 million and cashproceeds of $20 million received for the sale of our Security Materials business, which were classified as discontinued operations.Capital expenditures were primarily related to our lignite mine development project in the Purification Solutions segment, sustainingand compliance capital projects at our operating facilities, and mine development activities for the Specialty Fluids segment.
Capital expenditures for fiscal 2017 are expected to be between $150 million and $175 million. Our planned capital spendingprogram for fiscal 2017 is primarily for sustaining and compliance capital projects at our operating facilities.
Cash Flows from Financing Activities
Financing activities consumed $184 million of cash in fiscal 2016 compared to $256 million of cash in fiscal 2015 and $302million in fiscal 2014. During fiscal 2016, our overall debt balance decreased by $68 million. The decrease was driven primarily by ourredemption of our $300 million 5% fixed rate debt and a reduction in our outstanding commercial paper, partially offset by theissuance of $250 million in registered notes with a coupon of 3.4% that mature on September 15, 2026. As of September 30, 2016,we had no outstanding notes under our commercial paper program. During fiscal 2015, our overall debt balance decreased by $78million. The decrease was driven primarily by our repayment of certain long-term debt and commercial paper. As of September 30,2015, we had outstanding notes under our commercial paper program in an aggregate amount of $12 million, with a weightedaverage interest rate of 0.36%.
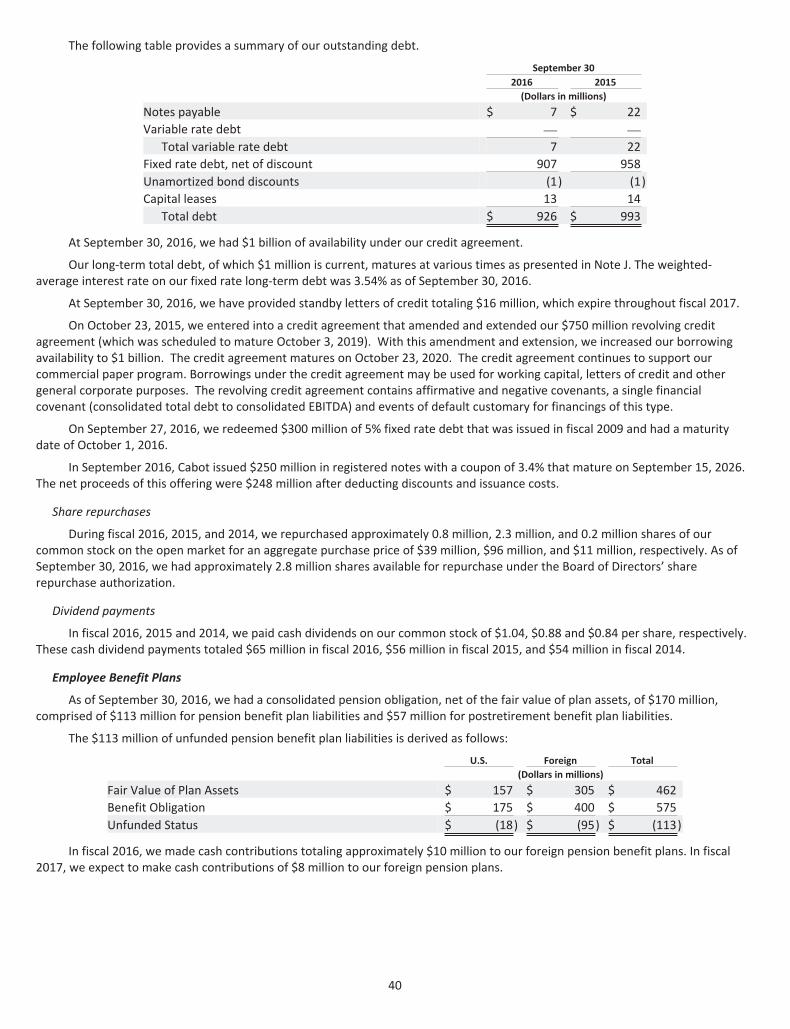
40
The following table provides a summary of our outstanding debt.
September 302016 2015
(Dollars in millions)Notes payable $ 7 $ 22Variable rate debt — —
Total variable rate debt 7 22Fixed rate debt, net of discount 907 958Unamortized bond discounts (1) (1)Capital leases 13 14
Total debt $ 926 $ 993
At September 30, 2016, we had $1 billion of availability under our credit agreement.
Our long-term total debt, of which $1 million is current, matures at various times as presented in Note J. The weighted-average interest rate on our fixed rate long-term debt was 3.54% as of September 30, 2016.
At September 30, 2016, we have provided standby letters of credit totaling $16 million, which expire throughout fiscal 2017.
On October 23, 2015, we entered into a credit agreement that amended and extended our $750 million revolving creditagreement (which was scheduled to mature October 3, 2019). With this amendment and extension, we increased our borrowingavailability to $1 billion. The credit agreement matures on October 23, 2020. The credit agreement continues to support ourcommercial paper program. Borrowings under the credit agreement may be used for working capital, letters of credit and othergeneral corporate purposes. The revolving credit agreement contains affirmative and negative covenants, a single financialcovenant (consolidated total debt to consolidated EBITDA) and events of default customary for financings of this type.
On September 27, 2016, we redeemed $300 million of 5% fixed rate debt that was issued in fiscal 2009 and had a maturitydate of October 1, 2016.
In September 2016, Cabot issued $250 million in registered notes with a coupon of 3.4% that mature on September 15, 2026.The net proceeds of this offering were $248 million after deducting discounts and issuance costs.
Share repurchases
During fiscal 2016, 2015, and 2014, we repurchased approximately 0.8 million, 2.3 million, and 0.2 million shares of ourcommon stock on the open market for an aggregate purchase price of $39 million, $96 million, and $11 million, respectively. As ofSeptember 30, 2016, we had approximately 2.8 million shares available for repurchase under the Board of Directors’ sharerepurchase authorization.
Dividend payments
In fiscal 2016, 2015 and 2014, we paid cash dividends on our common stock of $1.04, $0.88 and $0.84 per share, respectively.These cash dividend payments totaled $65 million in fiscal 2016, $56 million in fiscal 2015, and $54 million in fiscal 2014.
Employee Benefit Plans
As of September 30, 2016, we had a consolidated pension obligation, net of the fair value of plan assets, of $170 million,comprised of $113 million for pension benefit plan liabilities and $57 million for postretirement benefit plan liabilities.
The $113 million of unfunded pension benefit plan liabilities is derived as follows:
U.S. Foreign Total(Dollars in millions)
Fair Value of Plan Assets $ 157 $ 305 $ 462Benefit Obligation $ 175 $ 400 $ 575Unfunded Status $ (18) $ (95) $ (113)
In fiscal 2016, we made cash contributions totaling approximately $10 million to our foreign pension benefit plans. In fiscal2017, we expect to make cash contributions of $8 million to our foreign pension plans.

41
The $57 million of unfunded postretirement benefit plan liabilities is comprised of $37 million for our U.S. and $20 million forour foreign postretirement benefit plans. These postretirement benefit plans provide certain health care and life insurance benefitsfor retired employees. Typical of such plans, our postretirement plans are unfunded and, therefore, have no plan assets. We fundthese plans as claims or insurance premiums come due. In fiscal 2016, we paid postretirement benefits of $3 million under our U.S.postretirement plans and $1 million under our foreign postretirement plans. For fiscal 2017, our benefit payments for ourpostretirement plans are expected to be immaterial.
Off-balance sheet arrangements
We had no material transactions that meet the definition of an off-balance sheet arrangement.
Contractual Obligations
The following table sets forth our long-term contractual obligations.
Payments Due by Fiscal Year2017 2018 2019 2020 2021 Thereafter Total
(Dollars in millions)Contractual Obligations(1)
Purchase Commitments $ 217 $ 182 $ 172 $ 136 $ 107 $ 1,275 $ 2,089Long-term debt — 250 30 — — 627 907Capital lease obligations(2) 2 3 2 2 2 9 20Fixed interest on long-term debt 32 27 24 23 23 57 186Operating leases 21 17 13 8 7 56 122
Total $ 272 $ 479 $ 241 $ 169 $ 139 $ 2,024 $ 3,324
(1) We are unable to estimate the timing of potential future payments related to our accrual for uncertain tax positions in theamount of $18 million at September 30, 2016.
(2) Capital lease obligations include interest.
Purchase commitments
We have entered into long-term, volume-based purchase agreements primarily for the purchase of raw materials and naturalgas with various key suppliers in Reinforcement Materials, Performance Chemicals, and Purification Solutions. Under certain of theseagreements the quantity of material being purchased is fixed, but the price we pay changes as market prices change. For purposes ofthe table above, current purchase prices have been used to quantify total commitments.
Capital Leases
We have capital lease obligations primarily for certain equipment and buildings. These obligations are payable over the next15 years.
Operating Leases
We have operating leases primarily comprised of leases for transportation vehicles, warehouse facilities, office space, andmachinery and equipment.

42
Item 7A. Quantitative and Qualitative Disclosures About Market Risk
We are exposed to changes in interest rates and foreign currency exchange rates because we finance certain operationsthrough long- and short-term borrowings and denominate our transactions in a variety of foreign currencies. Changes in these ratesmay have an impact on future cash flows and earnings. We manage these risks through normal operating and financing activitiesand, when deemed appropriate, through the use of derivative financial instruments.
We have policies governing our use of derivative instruments, and we do not enter into financial instruments for trading orspeculative purposes.
By using derivative instruments, we are subject to credit and market risk. The derivative instruments are booked in ourbalance sheet at fair value and reflect the asset or (liability) position as of September 30, 2016. If a counterparty fails to fulfill itsperformance obligations under a derivative contract, our exposure will equal the fair value of the derivative. Generally, when the fairvalue of a derivative contract is positive, the counterparty owes Cabot, thus creating a payment risk for Cabot. We minimizecounterparty credit (or repayment) risk by entering into these transactions with major financial institutions of investment gradecredit rating. Our exposure to market risk is not hedged in a manner that completely eliminates the effects of changing marketconditions on earnings or cash flow.
Foreign Currency Risk
Our international operations are subject to certain risks, including currency exchange rate fluctuations and governmentactions. In the fourth quarter of fiscal 2016, we entered into cross currency swaps designated as hedges of our net investments incertain Euro denominated subsidiaries. The following table summarizes the principal terms of our cross currency swaps, includingthe aggregate notional amount of the swaps, the interest rate payment we receive from and pay to our swap counterparties, theterm and fair value at September 30, 2016.
DescriptionNotionalAmount
Interest RateReceived
Interest RatePaid
Fiscal YearEntered Into
MaturityYear
Fair Valueat
September30, 2016
Cross Currency Swaps
USD 250million
swapped toEUR 223million
3.40% 1.94% 2016 2026 $1 million
In addition, foreign currency exposures also relate to assets and liabilities denominated in foreign currencies other than thefunctional currency of a given subsidiary as well as the risk that currency fluctuations could affect the dollar value of future cashflows generated in foreign currencies. Accordingly, we use short-term forward contracts to reduce the exposure to foreign currencyrisk. At September 30, 2016, we had $4 million in net notional foreign currency contracts, which were denominated in Indonesianrupiah and Czech koruna. These forwards had a fair value of less than $1 million as of September 30, 2016.
In certain situations where we have a long-term commitment denominated in a foreign currency we may enter intoappropriate financial instruments in accordance with our risk management policy to hedge future cash flow exposures.
The primary currencies for which we have exchange rate exposure are the Euro, Japanese Yen, Brazilian Real, and ArgentinePeso. In fiscal year 2016, foreign currency translations in the aggregate increased our business segment EBIT by $10 million, themajority of which affected the results of the Reinforcement Materials segment. The favorable impact was largely from thetranslation of local currency denominated operating costs to U.S. dollars in Argentina and Brazil, where the average exchange ratesdevalued versus the U.S. dollar during fiscal 2016. In addition, we recognized a $7 million expense in Other income (expense) in fiscal2016 from the revaluation of monetary assets and liabilities from transactional currencies to functional currency, largely attributableto changes in the value of the Argentine Peso and the Brazilian Real during the year.

43
Item 8. Financial Statements and Supplementary Data
INDEX TO FINANCIAL STATEMENTSDescription Page(1) Consolidated Statements of Operations............................................................................................................................. 44(2) Consolidated Statements of Comprehensive Income......................................................................................................... 45(3) Consolidated Balance Sheets .............................................................................................................................................. 46(4) Consolidated Statements of Cash Flows............................................................................................................................. 48(5) Consolidated Statements of Changes in Stockholders’ Equity ........................................................................................... 49(6) Notes to the Consolidated Financial Statements................................................................................................................ 52(7) Report of Independent Registered Public Accounting Firm................................................................................................ 92

44
CABOT CORPORATIONCONSOLIDATED STATEMENTS OF OPERATIONS
Years Ended September 302016 2015 2014
(In millions, except per share amounts)Net sales and other operating revenues $ 2,411 $ 2,871 $ 3,647Cost of sales 1,833 2,286 2,926
Gross profit 578 585 721Selling and administrative expenses 275 282 326Research and technical expenses 53 58 60Purification Solutions long-lived assets impairment charge (Note G) — 210 —Purification Solutions goodwill impairment charge (Note G) — 352 —
Income (loss) from operations 250 (317) 335Interest and dividend income 5 4 3Interest expense (54) (53) (55)Other income (expense) (7) (11) 25
Income (loss) from continuing operations before income taxes and equity in earnings of affiliated companies 194 (377) 308
(Provision) benefit for income taxes (34) 45 (92)Equity in earnings of affiliated companies, net of tax 3 4 —
Income (loss) from continuing operations 163 (328) 216Income (loss) from discontinued operations, net of tax of $1, $— and $2 1 2 2
Net income (loss) 164 (326) 218Net income attributable to noncontrolling interests, net of tax of $4, $5 and $5 15 8 19Net income (loss) attributable to Cabot Corporation $ 149 $ (334) $ 199
Weighted-average common shares outstanding, in millions:Basic 62.4 63.4 64.4Diluted 62.9 63.4 65.1
Income (loss) per common share:Basic:
Income (loss) from continuing operations attributable to Cabot Corporation $ 2.36 $ (5.29) $ 3.04Income (loss) from discontinued operations $ 0.02 $ 0.02 $ 0.02Net income (loss) attributable to Cabot Corporation $ 2.38 $ (5.27) $ 3.06
Diluted:Income (loss) from continuing operations attributable to Cabot Corporation $ 2.34 $ (5.29) $ 3.01Income (loss) from discontinued operations $ 0.02 $ 0.02 $ 0.02Net income (loss) attributable to Cabot Corporation $ 2.36 $ (5.27) $ 3.03
Dividends per common share $ 1.04 $ 0.88 $ 0.84
The accompanying notes are an integral part of these consolidated financial statements.

45
CABOT CORPORATIONCONSOLIDATED STATEMENTS OF COMPREHENSIVE INCOME
Years Ended September 302016 2015 2014
(In millions)Net income (loss) $ 164 $ (326) $ 218Other comprehensive income (loss), net of tax
Foreign currency translation adjustment, net of tax benefit of $—, $(3), ($10) 7 (270) (131)
Pension and other postretirement benefit liability adjustmentsPension and other postretirement benefit liability adjustments arising during the period, net of tax (38) 28 (40)Amortization of net loss and prior service credit included in net periodic pension cost, net of tax — 3 —Other comprehensive loss (31) (239) (171)
Comprehensive income (loss) 133 (565) 47Net income attributable to noncontrolling interests, net of tax 15 8 19Noncontrolling interests foreign currency translation adjustment (5) (4) (4)
Comprehensive income attributable to noncontrolling interests 10 4 15Comprehensive income (loss) attributable to Cabot Corporation $ 123 $ (569) $ 32
The accompanying notes are an integral part of these consolidated financial statements.

46
CABOT CORPORATIONCONSOLIDATED BALANCE SHEETS
ASSETS
September 302016 2015
(In millions, exceptshare and per share amounts)
Current assets:Cash and cash equivalents $ 200 $ 77Accounts and notes receivable, net of reserve for doubtful accounts of $8 and $7 456 477Inventories 342 397Prepaid expenses and other current assets 50 54Deferred income taxes 41 43
Total current assets 1,089 1,048Property, plant and equipment 3,433 3,385Accumulated depreciation (2,143) (2,002)
Net property, plant and equipment 1,290 1,383Goodwill 152 154Equity affiliates 53 57Intangible assets, net 140 153Assets held for rent 97 86Deferred income taxes 180 152Other assets 43 42
Total assets $ 3,044 $ 3,075
The accompanying notes are an integral part of these consolidated financial statements.

47
CABOT CORPORATIONCONSOLIDATED BALANCE SHEETS
LIABILITIES AND STOCKHOLDERS’ EQUITY
September 302016 2015
(In millions, exceptshare and per share amounts)
Current liabilities:Notes payable $ 7 $ 22Accounts payable and accrued liabilities 364 389Income taxes payable 25 28Deferred income taxes 1 1Current portion of long-term debt 1 1
Total current liabilities 398 441Long-term debt 918 970Deferred income taxes 45 59Other liabilities 285 240Redeemable Preferred Stock 26 27Commitments and contingencies (Note T)Stockholders’ equity:
Preferred stock:Authorized: 2,000,000 shares of $1 par valueIssued and Outstanding: None and none — —
Common stock:Authorized: 200,000,000 shares of $1 par valueIssued: 62,449,425 and 62,704,966 sharesOutstanding 62,210,711 and 62,458,396 shares 62 63Less cost of 238,714 and 246,570 shares of common treasury stock (7) (8)
Additional paid-in capital — —Retained earnings 1,544 1,478Accumulated other comprehensive income (loss) (325) (299)
Total Cabot Corporation stockholders’ equity 1,274 1,234Noncontrolling interests 98 104
Total stockholders’ equity 1,372 1,338Total liabilities and stockholders’ equity $ 3,044 $ 3,075
The accompanying notes are an integral part of these consolidated financial statements.
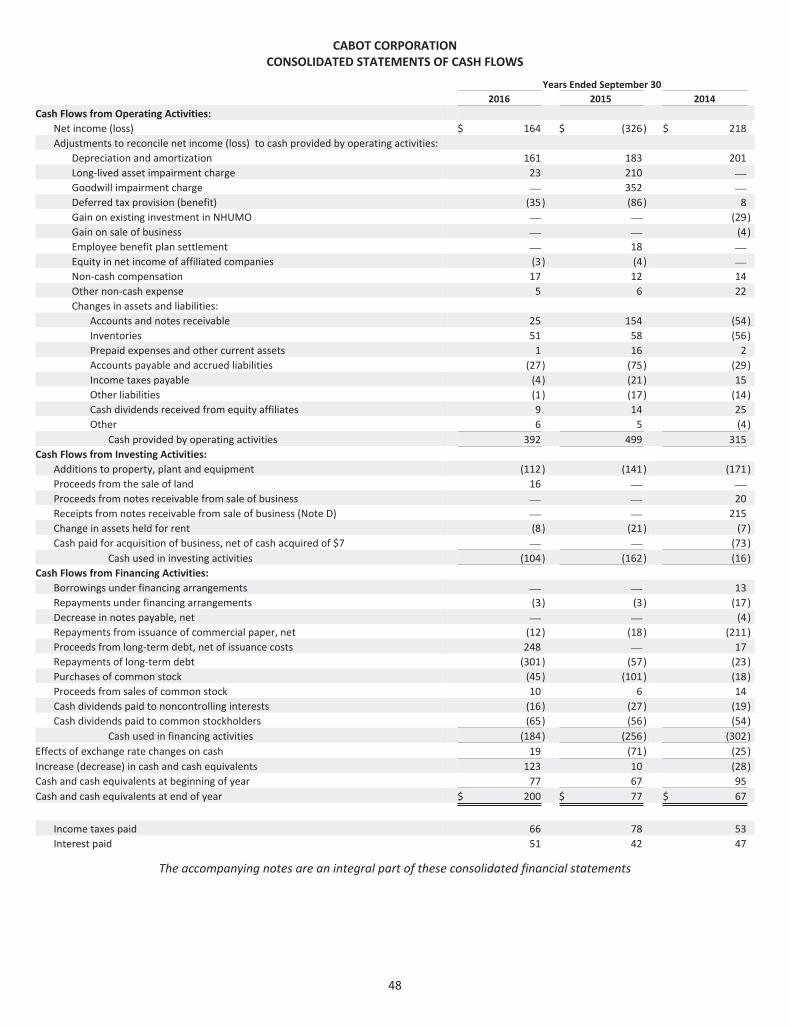
48
CABOT CORPORATIONCONSOLIDATED STATEMENTS OF CASH FLOWS
Years Ended September 302016 2015 2014
Cash Flows from Operating Activities:Net income (loss) $ 164 $ (326) $ 218Adjustments to reconcile net income (loss) to cash provided by operating activities:
Depreciation and amortization 161 183 201Long-lived asset impairment charge 23 210 —Goodwill impairment charge — 352 —Deferred tax provision (benefit) (35) (86) 8Gain on existing investment in NHUMO — — (29)Gain on sale of business — — (4)Employee benefit plan settlement — 18 —Equity in net income of affiliated companies (3) (4) —Non-cash compensation 17 12 14Other non-cash expense 5 6 22Changes in assets and liabilities:
Accounts and notes receivable 25 154 (54)Inventories 51 58 (56)Prepaid expenses and other current assets 1 16 2Accounts payable and accrued liabilities (27) (75) (29)Income taxes payable (4) (21) 15Other liabilities (1) (17) (14)Cash dividends received from equity affiliates 9 14 25Other 6 5 (4)
Cash provided by operating activities 392 499 315Cash Flows from Investing Activities:
Additions to property, plant and equipment (112) (141) (171)Proceeds from the sale of land 16 — —Proceeds from notes receivable from sale of business — — 20Receipts from notes receivable from sale of business (Note D) — — 215Change in assets held for rent (8) (21) (7)Cash paid for acquisition of business, net of cash acquired of $7 — — (73)
Cash used in investing activities (104) (162) (16)Cash Flows from Financing Activities:
Borrowings under financing arrangements — — 13Repayments under financing arrangements (3) (3) (17)Decrease in notes payable, net — — (4)Repayments from issuance of commercial paper, net (12) (18) (211)Proceeds from long-term debt, net of issuance costs 248 — 17Repayments of long-term debt (301) (57) (23)Purchases of common stock (45) (101) (18)Proceeds from sales of common stock 10 6 14Cash dividends paid to noncontrolling interests (16) (27) (19)Cash dividends paid to common stockholders (65) (56) (54)
Cash used in financing activities (184) (256) (302)Effects of exchange rate changes on cash 19 (71) (25)Increase (decrease) in cash and cash equivalents 123 10 (28)Cash and cash equivalents at beginning of year 77 67 95Cash and cash equivalents at end of year $ 200 $ 77 $ 67
Income taxes paid 66 78 53Interest paid 51 42 47
The accompanying notes are an integral part of these consolidated financial statements

49
CABO
TCO
RPO
RATI
ON
CON
SOLI
DAT
EDST
ATEM
ENT
OF
CHAN
GES
INST
OCK
HO
LDER
S’EQ
UIT
Y(In
mill
ions
,exc
epts
hare
sin
thou
sand
s)
Com
mon
Stoc
k,N
etof
Trea
sury
Stoc
kAd
ditio
nal
Paid
-inRe
tain
edD
efer
red
Empl
oyee
Accu
mul
ated
Oth
erCo
mpr
ehen
sive
Tota
lCab
otCo
rpor
atio
nSt
ockh
olde
rs’
Non
-co
ntro
lling
Tota
lSt
ockh
olde
rs’
2014
Shar
esCo
stCa
pita
lEa
rnin
gsBe
nefit
sIn
com
e(L
oss)
Equi
tyIn
tere
sts
Equi
ty
Bala
nce
atSe
ptem
ber3
0,20
1363
,971
$56
$39
$1,
755
$(2
)$
103
$1,
951
$13
2$
2,08
3N
etin
com
eat
trib
utab
leto
Cabo
tCor
pora
tion
199
199
199
Net
inco
me
attr
ibut
able
to n
on-c
ontr
ollin
g in
tere
sts
1919
Tota
loth
erco
mpr
ehen
sive
loss
(167
)(1
67)
(4)
(171
)N
onco
ntro
lling
inte
rest
—ot
her
(1)
(1)
Non
cont
rolli
ngin
tere
st—
divi
dend
s(2
4)(2
4)Ca
shdi
vide
ndsp
aid
toco
mm
onst
ockh
olde
rs(5
4)(5
4)(5
4)Is
suan
ceof
stoc
kun
dere
mpl
oyee
com
pens
atio
npl
ans
758
113
1414
Amor
tizat
ion
ofsh
are-
base
dco
mpe
nsat
ion
1414
14Pu
rcha
sean
dre
tirem
ento
fcom
mon
stoc
k(3
46)
(17)
(17)
(17)
Prin
cipa
lpay
men
tby
Empl
oyee
Stoc
kO
wne
rshi
pPl
anun
derg
uara
ntee
d lo
an2
22
Bala
nce
atSe
ptem
ber3
0,20
1464
,383
$57
$49
$1,
900
$—
$(6
4)$
1,94
2$
122
$2,
064
Theaccompa
nyingno
tesa
rean
integralpa
rtof
theseconsolidated
finan
cialstatem
ents.

50
CABO
TCO
RPO
RATI
ON
CON
SOLI
DAT
EDST
ATEM
ENT
OF
CHAN
GES
INST
OCK
HO
LDER
S’EQ
UIT
Y(In
mill
ions
,exc
epts
hare
sin
thou
sand
s)
Com
mon
Stoc
k,N
etof
Trea
sury
Stoc
kAd
ditio
nal
Paid
-inRe
tain
ed
Accu
mul
ated
Oth
erCo
mpr
ehen
sive
Tota
lCab
otCo
rpor
atio
nSt
ockh
olde
rs’
Non
-co
ntro
lling
Tota
lSt
ockh
olde
rs’
2015
Shar
esCo
stCa
pita
lEa
rnin
gsIn
com
e(L
oss)
Equi
tyIn
tere
sts
Equi
ty
Bala
nce
atSe
ptem
ber3
0,20
1464
,383
$57
$49
$1,
900
$(6
4)$
1,94
2$
122
$2,
064
Net
loss
attr
ibut
able
toCa
botC
orpo
ratio
n(3
34)
(334
)(3
34)
Net
inco
me
attr
ibut
able
tono
n-co
ntro
lling
inte
rest
s8
8To
talo
ther
com
preh
ensiv
elo
ss(2
35)
(235
)(4
)(2
39)
Non
cont
rolli
ngin
tere
st—
divi
dend
s(2
2)(2
2)Ca
shdi
vide
ndsp
aid
toco
mm
onst
ockh
olde
rs(5
6)(5
6)(5
6)Is
suan
ceof
stoc
kun
dere
mpl
oyee
com
pens
atio
npl
ans
450
—6
66
Amor
tizat
ion
ofsh
are-
base
dco
mpe
nsat
ion
1212
12Pu
rcha
sean
dre
tirem
ento
fcom
mon
stoc
k(2
,375
)(2
)(6
7)(3
2)(1
01)
(101
)Ba
lanc
eat
Sept
embe
r30,
2015
62,4
58$
55$
—$
1,47
8$
(299
)$
1,23
4$
104
$1,
338
Theaccompa
nyingno
tesa
rean
integralpa
rtof
theseconsolidated
finan
cialstatem
ents.

51
CABO
TCO
RPO
RATI
ON
CON
SOLI
DAT
EDST
ATEM
ENT
OF
CHAN
GES
INST
OCK
HO
LDER
S’EQ
UIT
Y(In
mill
ions
,exc
epts
hare
sin
thou
sand
s)
Com
mon
Stoc
k,N
etof
Trea
sury
Stoc
kAd
ditio
nal
Paid
-inRe
tain
ed
Accu
mul
ated
Oth
erCo
mpr
ehen
sive
Tota
lCab
otCo
rpor
atio
nSt
ockh
olde
rs’
Non
-co
ntro
lling
Tota
lSt
ockh
olde
rs’
2016
Shar
esCo
stCa
pita
lEa
rnin
gsIn
com
e(L
oss)
Equi
tyIn
tere
sts
Equi
ty
Bala
nce
atSe
ptem
ber3
0,20
1562
,458
$55
$—
$1,
478
$(2
99)
$1,
234
$10
4$
1,33
8N
etin
com
eat
trib
utab
leto
Cabo
tCor
pora
tion
149
149
149
Net
inco
me
attr
ibut
able
tono
n-co
ntro
lling
inte
rest
s15
15To
talo
ther
com
preh
ensiv
elo
ss(2
6)(2
6)(5
)(3
1)N
onco
ntro
lling
inte
rest
—di
vide
nds
(16)
(16)
Cash
divi
dend
spai
dto
com
mon
stoc
khol
ders
(65)
(65)
(65)
Issu
ance
ofst
ock
unde
rem
ploy
eeco
mpe
nsat
ion
plan
s73
71
910
10Am
ortiz
atio
nof
shar
e-ba
sed
com
pens
atio
n17
1717
Purc
hase
and
retir
emen
tofc
omm
onst
ock
(984
)(1
)(2
6)(1
8)(4
5)(4
5)Ba
lanc
eat
Sept
embe
r30,
2016
62,2
11$
55$
—$
1,54
4$
(325
)$
1,27
4$
98$
1,37
2
Theaccompa
nyingno
tesa
rean
integralpa
rtof
theseconsolidated
finan
cialstatem
ents.

52
Notes to Consolidated Financial Statements
Note A. Significant Accounting Policies
The consolidated financial statements have been prepared in accordance with accounting principles generally accepted in theUnited States. The significant accounting policies of Cabot Corporation (“Cabot” or “the Company”) are described below.
Unless otherwise indicated, all disclosures and amounts in the Notes to Consolidated Financial Statements relate to theCompany’s continuing operations.
Principles of Consolidation
The consolidated financial statements include the accounts of Cabot and its wholly-owned subsidiaries and majority-ownedand controlled U.S. and non-U.S. subsidiaries. Additionally, Cabot considers consolidation of entities over which control is achievedthrough means other than voting rights, of which there were none in the periods presented. Intercompany transactions have beeneliminated in consolidation.
Cash and Cash Equivalents
Cash equivalents include all highly liquid investments with a maturity of three months or less at date of acquisition. Cabotcontinually assesses the liquidity of cash equivalents and, as of September 30, 2016, has determined that they are readilyconvertible to cash.
Inventories
Inventories are stated at the lower of cost or market. The cost of all carbon black inventories in the U.S. is determined usingthe last-in, first-out (“LIFO”) method. The cost of Specialty Fluids inventories, which are classified as assets held for rent, isdetermined using the average cost method. The cost of other U.S. and non-U.S. inventories is determined using the first-in, first-out(“FIFO”) method.
Cabot reviews inventory for both potential obsolescence and potential declines in anticipated selling prices. In this review, theCompany makes assumptions about the future demand for and market value of the inventory, and based on these assumptionsestimates the amount of any obsolete, unmarketable, slow moving, or overvalued inventory. Cabot writes down the value of theseinventories by an amount equal to the difference between the cost of the inventory and its estimated net realizable value.
Investments
The Company has investments in equity affiliates and marketable securities. As circumstances warrant, all investments aresubject to periodic impairment reviews. Unless consolidation is required, investments in equity affiliates, where Cabot generallyowns between 20% and 50% of the affiliate, are accounted for using the equity method. Cabot records its share of the equityaffiliate’s results of operations based on its percentage of ownership of the affiliate. Dividends declared from equity affiliates are areturn on investment and are recorded as a reduction to the equity investment value. At September 30, 2016 and 2015, Cabot hadequity affiliate investments of $53 million and $57 million, respectively. Dividends declared and received from these investmentswere $9 million, $14 million and $25 million in fiscal 2016, 2015 and 2014, respectively.
All investments in marketable securities are classified as available-for-sale and are recorded at fair value with thecorresponding unrealized holding gains or losses, net of taxes, recorded as a separate component of Other comprehensive incomewithin stockholders’ equity. Unrealized losses that are determined to be other-than-temporary, based on current and expectedmarket conditions, are recognized in earnings. The fair value of marketable securities is determined based on quoted market pricesat the balance sheet dates. The cost of marketable securities sold is determined by the specific identification method. TheCompany’s investment in marketable securities was immaterial as of both September 30, 2016 and 2015.
Intangible Assets and Goodwill Impairment
The Company records tangible and intangible assets acquired and liabilities assumed in business combinations under theacquisition method of accounting. Amounts paid for an acquisition are allocated to the assets acquired and liabilities assumed basedon their fair values at the date of acquisition. Goodwill is comprised of the purchase price of business acquisitions in excess of thefair value assigned to the net tangible and identifiable intangible assets acquired. Goodwill is not amortized, but is reviewed forimpairment annually as of May 31, or when events or changes in the business environment indicate that the carrying value of thereporting unit may exceed its fair value. A reporting unit, for the purpose of the impairment test, is at or below the operatingsegment level, and constitutes a business for which discrete financial information is available and regularly reviewed by segmentmanagement. The reporting units with goodwill balances are Reinforcement Materials, Purification Solutions, and Fumed MetalOxides. The separate businesses included within Performance Chemicals are considered separate reporting units. As such, thegoodwill balance relative to Performance Chemicals is recorded in the Fumed Metal Oxides reporting unit.

53
For the purpose of the goodwill impairment test, the Company first assesses qualitative factors to determine whether it ismore likely than not that the fair value of a reporting unit is less than its carrying amount. If an initial qualitative assessmentidentifies that it is more likely than not that the carrying value of a reporting unit exceeds its estimated fair value, an additionalquantitative evaluation is performed under the two-step impairment test. Alternatively, the Company may elect to proceed directlyto the quantitative goodwill impairment test. If based on the quantitative evaluation the fair value of the reporting unit is less thanits carrying amount, the Company performs an analysis of the fair value of all assets and liabilities of the reporting unit. If the impliedfair value of the reporting unit’s goodwill is determined to be less than its carrying amount, an impairment is recognized for thedifference. The fair value of a reporting unit is based on discounted estimated future cash flows. The fair value is also benchmarkedagainst a market approach using the guideline public companies method. The assumptions used to estimate fair value includemanagement’s best estimates of future growth rates, operating cash flows, capital expenditures and discount rates over an estimateof the remaining operating period at the reporting unit level. Should the fair value of any of the Company’s reporting units declinebelow its carrying amount because of reduced operating performance, market declines, changes in the discount rate, or otherconditions, charges for impairment may be necessary.
When the Company performed its annual goodwill impairment test in the third quarter of fiscal 2015, the fair value of thePurification Solutions reporting unit was less than its carrying amount and the Company recorded impairment charges as a result. Adiscussion of this assessment and the charges recorded is included under Note G.
Based on the Company’s most recent annual goodwill impairment test performed as of May 31, 2016, the fair values of theReinforcement Materials and Fumed Metal Oxides reporting units were substantially in excess of their carrying values. The fair valueof the Purification Solutions reporting unit exceeded its carrying amount by 9% at that time. The fair value of the PurificationSolutions reporting unit includes certain growth assumptions that are primarily dependent on: (1) further growth in the mercuryremoval related portion of the business, which is largely dependent on the amount of coal-based power generation used in theUnited States and the continued regulation of those utilities under the Mercury and Air Toxics Standards (“MATS”) and (2) growth indemand for activated carbon products in other applications, while meeting the Company’s margin expectations. Realizing theseassumptions is generally driven by the macroeconomic environment, environmental regulations, and global and regionalcompetition.
The Company uses assumptions and estimates in determining the fair value of assets acquired and liabilities assumed in abusiness combination. The determination of the fair value of intangible assets requires the use of significant judgment with regard toassumptions used in the valuation model. The Company estimates the fair value of identifiable acquisition-related intangible assetsprincipally based on projections of cash flows that will arise from these assets. The projected cash flows are discounted to determinethe fair value of the assets at the dates of acquisition.
Definite-lived intangible assets, which are comprised of trademarks, customer relationships and developed technologies, areamortized over their estimated useful lives and are reviewed for impairment when indication of potential impairment exists, such asa significant reduction in cash flows associated with the assets. The Company recognized an impairment on intangible assetsassociated with the Purification Solutions business in the third fiscal quarter of 2015 and no events have been subsequentlyidentified that would require an additional impairment evaluation.
Long-lived Assets Impairment
The Company’s long-lived assets primarily include property, plant and equipment, intangible assets, long-term investmentsand assets held for rent. The carrying values of long-lived assets are reviewed for impairment whenever events or changes inbusiness circumstances indicate that the carrying amount of an asset may not be recoverable.
To test for impairment of assets, the Company generally uses a probability-weighted estimate of the future undiscounted netcash flows of the assets over their remaining lives to determine if the value of the asset is recoverable. Long-lived assets are groupedwith other assets and liabilities at the lowest level for which independent identifiable cash flows are determinable.
An asset impairment is recognized when the carrying value of the asset is not recoverable based on the analysis describedabove, in which case the asset is written down to its fair value. If the asset does not have a readily determinable market value, adiscounted cash flow model may be used to determine the fair value of the asset. In circumstances when an asset does not haveseparate identifiable cash flows, an impairment charge is recorded when the Company no longer intends to use the asset. Refer toNote G regarding the results of the impairment test performed in 2015 on the long-lived assets of the Purification Solutionssegment.

54
Property, Plant and Equipment
Property, plant and equipment are recorded at cost. Depreciation of property, plant and equipment is calculated using thestraight-line method over the estimated useful lives. The depreciable lives for buildings, machinery and equipment, and other fixedassets are between twenty and twenty-five years, ten and twenty-five years, and three and twenty-five years, respectively. The costand accumulated depreciation for property, plant and equipment sold, retired, or otherwise disposed of are removed from theConsolidated Balance Sheets and resulting gains or losses are included in earnings in the Consolidated Statements of Operations.Expenditures for repairs and maintenance are charged to expenses as incurred. Expenditures for major renewals and betterments,which significantly extend the useful lives of existing plant and equipment, are capitalized and depreciated.
Cabot capitalizes interest costs when they are part of the historical cost of acquiring and constructing certain assets thatrequire a period of time to prepare for their intended use. During fiscal 2016, 2015 and 2014, Cabot capitalized $1 million, less than$1 million and $3 million of interest costs, respectively. These amounts are amortized over the lives of the related assets when theyare placed in service.
Assets Held for Rent
Assets held for rent represent Specialty Fluids cesium formate product that is available to customers in the normal course ofbusiness and at September 30, 2016 and 2015 also include $10 million and $11 million, respectively, of ore that has been mined andwill be converted into cesium formate. Assets held for rent are stated at average cost.
Asset Retirement Obligations
Cabot estimates incremental costs for special handling, removal and disposal of materials that may or will give rise toconditional asset retirement obligations (“ARO”) and then discounts the expected costs back to the current year using a creditadjusted risk free rate. Cabot recognizes ARO liabilities and costs when the timing and/or settlement can be reasonably estimated.The ARO reserves were $22 million and $20 million at September 30, 2016 and 2015, respectively, and are included in Accountspayable and accrued liabilities and Other liabilities on the Consolidated Balance Sheets.
Foreign Currency Translation
The functional currency of the majority of Cabot’s foreign subsidiaries is the local currency in which the subsidiary operates.Assets and liabilities of foreign subsidiaries are translated into U.S. dollars at exchange rates in effect at the balance sheet dates.Income and expense items are translated at average monthly exchange rates during the year. Unrealized currency translationadjustments are included as a separate component of Accumulated other comprehensive income (loss) within stockholders’ equity.
Realized and unrealized foreign currency gains and losses arising from transactions denominated in currencies other than thesubsidiary’s functional currency are reflected in earnings with the exception of (i) intercompany transactions considered to be of along-term investment nature; and (ii) foreign currency borrowings designated as net investment hedges. Gains or losses arising fromthese transactions are included as a component of other comprehensive income (loss). In fiscal 2016, 2015 and 2014, net foreigncurrency transaction losses of $7 million, $8 million, and $2 million, respectively, are included in Other income (expense) in theConsolidated Statements of Operations.
Financial Instruments
Cabot’s financial instruments consist primarily of cash and cash equivalents, accounts and notes receivable, investments,accounts payable and accrued liabilities, short-term and long-term debt, and derivative instruments. The carrying values of Cabot’sfinancial instruments approximate fair value with the exception of fixed rate long-term debt, which is recorded at amortized cost.The fair values of the Company’s financial instruments are based on quoted market prices, if such prices are available. In situationswhere quoted market prices are not available, the Company relies on valuation models to derive fair value. Such valuation takes intoaccount the ability of the financial counterparty to perform and the Company’s own credit risk.
Cabot uses derivative financial instruments primarily for purposes of hedging the exposures to fluctuations in foreign currencyexchange rates, which exist as part of its on-going business operations. Cabot does not enter into derivative contracts for speculativepurposes, nor does it hold or issue any derivative contracts for trading purposes. All derivatives are recognized on the ConsolidatedBalance Sheets at fair value. Where Cabot has a legal right to offset derivative settlements under a master netting agreement with acounterparty, derivatives with that counterparty are presented on a net basis. The changes in the fair value of derivatives arerecorded in either earnings or Accumulated other comprehensive income (loss), depending on whether or not the instrument isdesignated as part of a hedge transaction and, if designated as part of a hedge transaction, the type of hedge transaction. The gainsor losses on derivative instruments reported in Accumulated other comprehensive income (loss) are reclassified to earnings in theperiod in which earnings are affected by the underlying hedged item. The ineffective portion of all hedges is recognized in earningsduring the period in which the ineffectiveness occurs.

55
In accordance with Cabot’s risk management strategy, the Company may enter into certain derivative instruments that maynot be designated as hedges for hedge accounting purposes. Although these derivatives are not designated as hedges, the Companybelieves that such instruments are closely correlated with the underlying exposure, thus managing the associated risk. The Companyrecords in earnings the gains or losses from changes in the fair value of derivative instruments that are not designated as hedges.Cash movements associated with these instruments are presented in the Consolidated Statement of Cash Flows as Cash Flows fromOperating Activities because the derivatives are designed to mitigate risk to the Company’s cash flow from operations. The cashflows related to the principal amount of outstanding debt instruments are presented in the Cash Flows from Financing Activitiessection of the Consolidated Statement of Cash Flows.
Revenue Recognition
Cabot recognizes revenue when persuasive evidence of an arrangement exists, delivery has occurred or services have beenrendered, the price is fixed or determinable and collectability is reasonably assured. Cabot generally is able to ensure that productsmeet customer specifications prior to shipment. If the Company is unable to determine that the product has met the specifiedobjective criteria prior to shipment or if title has not transferred because of sales terms, the revenue is considered “unearned” and isdeferred until the revenue recognition criteria are met.
Shipping and handling charges related to sales transactions are recorded as sales revenue when billed to customers orincluded in the sales price. Taxes collected on sales to customers are excluded from revenues.
The following table shows the relative size of the revenue recognized in each of the Company’s reportable segments
Years ended September 302016 2015 2014
Reinforcement Materials 48% 54% 59%Performance Chemicals 37% 33% 29%Purification Solutions 13% 11% 9%Specialty Fluids 2% 2% 3%
Cabot derives the substantial majority of its revenues from the sale of products in Reinforcement Materials and PerformanceChemicals. Revenue from these products is typically recognized when the product is shipped and title and risk of loss have passed tothe customer. The Company offers certain of its customers cash discounts and volume rebates as sales incentives. The discounts andvolume rebates are recorded as a reduction in sales at the time revenue is recognized and are estimated based on historicalexperience and contractual obligations. Cabot periodically reviews the assumptions underlying its estimates of discounts and volumerebates and adjusts its revenues accordingly.
Revenue in Purification Solutions is typically recognized when the product is shipped and title and risk of loss have passed tothe customer. For major activated carbon injection systems projects, revenue is recognized using the percentage-of-completionmethod.
Revenue in Specialty Fluids arises primarily from the rental of cesium formate. This revenue is recognized throughout therental period based on the contracted rental terms. Customers are also billed and revenue is recognized, typically at the end of thejob, for cesium formate product that is not returned. The Company also generates revenues from cesium formate sold outside of arental process and revenue is recognized upon delivery of the fluid.
Cost of Sales
Cost of sales consists of the cost of raw and packaging materials, direct manufacturing costs, depreciation, internal transfercosts, inspection costs, inbound and outbound freight and shipping and handling costs, plant purchasing and receiving costs andother overhead expenses necessary to manufacture the products.
Accounts and Notes Receivable
Trade receivables are recorded at the invoiced amount and generally do not bear interest. Trade receivables in China may atcertain times be settled with the receipt of bank issued non-interest bearing notes. These notes totaled 102 million ChineseRenminbi (“RMB”) ($15 million) and 95 million RMB ($15 million) as of September 30, 2016 and 2015, respectively, and are includedin Accounts and notes receivable on the Company’s Consolidated Balance Sheets. Cabot periodically sells a portion of these banknotes and other customer receivables at a discount and such sales are accounted for as asset sales. The Company does not have anycontinuing involvement with these notes or other customer receivables after the sale. The difference between the proceeds fromthe sale and the carrying value of these assets is recognized as a loss on the sale of receivables and is included in Other income(expense) in the accompanying Consolidated Statements of Operations. During fiscal 2016, 2015 and 2014, the Company recordedcharges of $1 million, $3 million, and $3 million, respectively, for the sale of these assets.

56
Cabot maintains allowances for doubtful accounts based on an assessment of the collectability of specific customer accounts,the aging of accounts receivable and other economic information on both a historical and prospective basis. Customer accountbalances are charged against the allowance when it is probable the receivable will not be recovered. There were no materialchanges in the allowance for any of the years presented. There is no material off-balance sheet credit exposure related to customerreceivable balances.
Stock-based Compensation
Cabot recognizes compensation expense for stock-based awards granted to employees using the fair value method. Under thefair value recognition provisions, stock-based compensation cost is measured at the grant date based on the fair value of the award,and is recognized as expense over the service period, which generally represents the vesting period, and includes an estimate of theawards that will be forfeited, and an estimate of what level of performance the Company will achieve for Cabot’s performance-based stock awards. Cabot calculates the fair value of its stock options using the Black-Scholes option pricing model. The fair value ofrestricted stock units is determined using the closing price of Cabot stock on the day of the grant.
Selling and Administrative Expenses
Selling and administrative expenses consist of salaries and fringe benefits of sales and office personnel, general officeexpenses and other expenses not directly related to manufacturing operations.
Research and Technical Expenses
Research and technical expenses include salaries, equipment and material expenditures, and contractor fees and are expensedas incurred.
Income Taxes
Deferred income taxes are determined based on the estimated future tax effects of differences between financial statementcarrying amounts and the tax bases of existing assets and liabilities. Deferred tax assets are recognized to the extent that realizationof those assets is considered to be more likely than not.
A valuation allowance is established for deferred taxes when it is more likely than not that all or a portion of the deferred taxassets will not be realized. Provisions are made for the U.S. income tax liability and additional non-U.S. taxes on the undistributedearnings of non-U.S. subsidiaries, except for amounts Cabot has designated to be indefinitely reinvested.
Cabot records benefits for uncertain tax positions based on an assessment of whether the position is more likely than not tobe sustained by the taxing authorities. If this threshold is not met, no tax benefit of the uncertain tax position is recognized. If thethreshold is met, the tax benefit that is recognized is the largest amount that is greater than 50% likely of being realized uponultimate settlement. This analysis presumes the taxing authorities’ full knowledge of the positions taken and all relevant facts, butdoes not consider the time value of money. The Company also accrues for interest and penalties on its uncertain tax positions andincludes such charges in its income tax provision in the Consolidated Statements of Operations.
Accumulated Other Comprehensive Income
Accumulated other comprehensive income, which is included as a component of stockholders’ equity, includes unrealizedgains or losses on available-for-sale marketable securities and derivative instruments, currency translation adjustments in foreignsubsidiaries, translation adjustments on foreign equity securities and minimum pension liability adjustments.
Environmental Costs
Cabot accrues environmental costs when it is probable that a liability has been incurred and the amount can be reasonablyestimated. When a single liability amount cannot be reasonably estimated, but a range can be reasonably estimated, Cabot accruesthe amount that reflects the best estimate within that range or the low end of the range if no estimate within the range is better.The amount accrued reflects Cabot’s assumptions about remediation requirements at the contaminated site, the nature of theremedy, the outcome of discussions with regulatory agencies and other potentially responsible parties at multi-party sites, and thenumber and financial viability of other potentially responsible parties. Cabot does not reduce its estimated liability for possiblerecoveries from insurance carriers. Proceeds from insurance carriers are recorded when realized by either the receipt of cash or acontractual agreement.

57
Use of Estimates
The preparation of consolidated financial statements in conformity with generally accepted accounting principles in the UnitedStates requires management to make certain estimates and assumptions that affect the reported amount of assets and liabilitiesand the disclosure of contingent assets and liabilities at the date of the consolidated financial statements and the reported amountsof revenues and expenses during the reported period. Actual results could differ from those estimates.
Note B. Recent Accounting Pronouncements
In May 2014, the FASB issued a new standard, “Revenue from Contracts with Customers”, which amends the existingaccounting standards for revenue recognition. The standard requires entities to recognize revenue when they transfer promisedgoods or services to customers in an amount that reflects the consideration the entity expects to be entitled to in exchange forthose goods or services. This standard is applicable for fiscal years beginning after December 15, 2017 and for interim periods withinthose years and early adoption is permitted for the fiscal years beginning after December 15, 2016. The Company expects to adoptthis standard on October 1, 2018. The Company is currently evaluating the impact the adoption of this standard may have on itsconsolidated financial statements.
In April 2015, the FASB issued a new standard simplifying the presentation of debt issuance costs by requiring debt issuancecosts to be presented as a reduction of the corresponding debt liability. This will make the presentation of debt issuance costsconsistent with the presentation of debt discounts or premiums. This standard is applicable for fiscal years beginning afterDecember 15, 2015 and for interim periods within those years and early adoption is permitted. The Company adopted this standardon October 1, 2016. The adoption of this standard did not have a material impact on the Company’s consolidated financialstatements.
In November 2015, the FASB issued a new standard that amends the existing accounting standard for income taxes andsimplifies the presentation of deferred income taxes. This will require that deferred income tax assets and liabilities be classified asnoncurrent on the balance sheet. This standard is applicable for fiscal years beginning after December 15, 2016 and for interimperiods within those years and early adoption is permitted. The Company is evaluating this standard and the timing of its adoption.The adoption of this standard is not expected to materially impact the Company’s consolidated financial statements.
In February 2016, the FASB issued a new standard for the accounting for leases. This new standard requires lessees torecognize assets and liabilities for most leases, but recognize expenses on their income statements in a manner that is similar to thecurrent accounting treatment for leases. The standard is applicable for fiscal years beginning after December 15, 2018 and forinterim periods within those years and early adoption is permitted. The Company expects to adopt the standard on October 1,2019. The Company is currently evaluating the impact of the adoption of this standard on its consolidated financial statements.
In March 2016, the FASB issued a new standard that amends the accounting standard for stock compensation by simplifyingseveral aspects of the accounting for employee share-based payment transactions, including the related accounting for incometaxes, forfeitures, and the withholding of shares to satisfy the employer’s tax withholding requirements, as well as classification inthe statements of cash flows. The new standard is effective for fiscal years beginning after December 15, 2016, including interimperiods within those years and early adoption is permitted. The Company is evaluating this standard and the timing of its adoption.The adoption of this standard is not expected to materially impact the Company’s consolidated financial statements.
In August 2016, the FASB issued final amendments to clarify how entities should classify certain cash receipts and cashpayments on the statement of cash flows such as distributions received from equity method investees, proceeds from settlement ofinsurance claims, and proceeds from the settlement of corporate-owned life insurance. The new standard is effective for fiscal yearsbeginning after December 15, 2017, including interim periods within those years and early adoption is permitted. The Company isevaluating this standard and the timing of its adoption. The adoption of this standard is not expected to materially impact theCompany’s consolidated financial statements.

58
Note C. Acquisition of NHUMO
In November 2013, the Company purchased all of Grupo KUO S.A.B. de C.V.’s (KUO) common stock in the former NHUMO jointventure, which represented approximately 60% of the outstanding common stock of the joint venture. Prior to this transaction, theCompany owned approximately 40% of the outstanding common stock of NHUMO, and the NHUMO entity was accounted for as anequity affiliate of the Company. Upon acquisition, the Company began consolidating NHUMO into its consolidated financialstatements.
At the close of the transaction, the Company paid KUO $80 million in cash and NHUMO issued redeemable preferred stock toKUO with a redemption value of $25 million. The preferred stock accumulates dividends at a fixed rate of 6% annually and isredeemable at the option of KUO or the Company for $25 million starting in November 2018 or upon the occurrence of certain otherconditions. Annual payment by NHUMO of the dividends is contingent on NHUMO achieving a minimum EBITDA (earnings beforeinterest, taxes, depreciation and amortization) level and if such minimum EBITDA is not achieved in any year, the dividend will beaccumulated and paid at the time the preferred shares are redeemed. The minimum EBITDA was achieved in 2014, 2015 and 2016.A dividend payment of $1.5 million was made in both December 2015 and 2014. A dividend payment of $1.5 million is due inDecember 2016. The preferred stock issued in connection with the transaction is not mandatorily redeemable and has embeddedput and call rights at the fixed redemption price. Accordingly, the instrument is accounted for as a financing obligation and has beenseparately presented in the Consolidated Balance Sheets as a long-term liability. Prior to closing, the Company received a $14 milliondividend from NHUMO.
As of September 2014, the Company completed the valuation of its assets acquired and liabilities assumed. The allocation ofthe purchase price is based on the fair value of assets acquired and liabilities assumed, and Cabot’s previously held equity interest inNHUMO as of the acquisition date. The following table presents the components and allocation of the purchase price:
(Dollars in millions)AssetsCurrent assets $ 54Property, plant and equipment 48Other non-current assets 1Intangible assets 63Goodwill 45
Total assets acquired 211LiabilitiesAccounts payable, accruals and other liabilities (20)Deferred tax liabilities - long-term (29)
Total liabilities assumed (49)Net assets acquired $ 162Cash consideration paid 80Fair value of redeemable preferred stock 28Previously held equity interest in NHUMO 54Total $ 162
As a result of the acquisition, the Company recorded a gain of $29 million for the difference between the carrying value andthe fair value of the previously held equity interest in NHUMO, which was included in Other income (expense) in the first quarter offiscal 2014. The fair value of $54 million for the previously held equity interest was determined based on the fair value of Cabot’spre-existing interest in NHUMO as adjusted for a control premium derived from synergies gained as a result of the Companyobtaining control of NHUMO.
As part of the purchase price allocation, the Company determined that a separately identifiable intangible asset was customerrelationships in the amount of $63 million, which is being amortized over a period of 20 years. The Company estimated the fair valueof the identifiable acquisition-related intangible asset based on projections of cash flows that will arise from the asset. The projectedcash flows were discounted to determine the fair value of the asset at the date of acquisition. The determination of the fair value ofthe intangible asset acquired required the use of significant judgment with regard to assumptions in the discounted cash flow modelused.
The fair value of the redeemable preferred stock was determined based on a discounted cash flow model, using the expectedtiming of the cash flows and an appropriate discount rate.

59
The excess of the purchase price, which includes the cash consideration paid and the fair values of redeemable preferred stockand the previously held equity interest in NHUMO, over the fair value of the tangible net assets and intangible asset acquired, wasrecorded as goodwill. The goodwill recognized was attributable to the expected growth and operating synergies that the Companyexpects to realize from this acquisition. Goodwill generated from the acquisition was not deductible for tax purposes.
Note D. Discontinued Operations
In January 2012, the Company sold its Supermetals business to Global Advanced Metals Pty Ltd., an Australian company, andin July 2014, the Company sold its Security Materials business to SICPA SA. The Consolidated Statements of Operations for allperiods presented have been recast to reflect the Security Materials business in discontinued operations. Both businesses arereflected in discontinued operations in the Consolidated Statements of Operations for all periods presented. In fiscal 2014, Cabotreceived the final payment related to the sale of the Supermetals business in the amount of $215 million.
During fiscal years 2016, 2015, and 2014, Cabot recorded $1 million, $2 million, and $2 million, respectively, of income fromdiscontinued operations related to sales of businesses that occurred in prior years.
Note E. Inventories
Inventories, net of LIFO, obsolete, unmarketable and slow moving reserves, are as follows:
September 302016 2015
(Dollars in millions)Raw materials $ 66 $ 69Work in process 1 1Finished goods 237 287Other 38 40
Total $ 342 $ 397
Inventories valued under the LIFO method comprised approximately 8% and 6% of total inventories at September 30, 2016and 2015, respectively. At September 30, 2016 and 2015, the LIFO reserve was $27 million and $30 million, respectively. Otherinventory is comprised of certain spare parts and supplies.
During fiscal 2015, inventory quantities carried on a LIFO basis were decreased at the Company’s U.S. carbon black sites. Thesereductions led to liquidations of LIFO inventory quantities and resulted in an increase of Cost of sales of $1 million and a decrease inconsolidated Net income of $1 million ($0.01 per diluted common share). No such reductions occurred in fiscal 2016 or 2014.
Cabot reviews inventory for both obsolescence and loss of value periodically. In this review, Cabot makes assumptions aboutthe future demand for and market value of the inventory and, based on these assumptions, estimates the amount of obsolete,unmarketable or slow moving inventory. Total inventory reserves were $20 million as of both September 30, 2016 and 2015. During fiscal year 2015, the Company recorded a lower of cost or market reserve in the amount of $6 million related to its PurificationSolutions inventory held in Marshall, Texas. As of September 30, 2016, the remaining balance of this reserve is $5 million.
Note F. Property, Plant and Equipment
Property, plant and equipment consists of the following:
September 302016 2015
(Dollars in millions)Land and land improvements $ 150 $ 154Buildings 512 509Machinery and equipment 2,446 2,391Other 237 225Construction in progress 88 106
Total property, plant and equipment 3,433 3,385Less: accumulated depreciation (2,143) (2,002)
Net property, plant and equipment $ 1,290 $ 1,383
Depreciation expense was $154 million, $169 million and $184 million for fiscal 2016, 2015 and 2014, respectively.

60
Note G. Purification Solutions Goodwill and Long-Lived Assets Impairment Charges
During the third quarter of fiscal 2015 and as a result of the impairment tests performed on goodwill and long-lived assets ofthe Purification Solutions reporting unit, the Company recorded impairment charges and an associated tax benefit in theConsolidated Statements of Operations as follows:
Year EndedSeptember 30, 2015(Dollars in millions)
Purification Solutions goodwill impairment charge $ 352Purification Solutions long-lived assets impairment charge 210Benefit for income taxes (80)Impairment charges, after tax $ 482
In determining the fair value of the Purification Solutions reporting unit, the Company used an income approach (a discountedcash flow analysis) which incorporated significant estimates and assumptions related to future periods, including the timing of theMATS implementation, the anticipated size of the mercury removal industry, and growth rates and pricing assumptions of activatedcarbon, among others. In addition, an estimate of the reporting unit’s weighted average cost of capital (“WACC”) was used todiscount future estimated cash flows to their present value. The WACC was based upon externally available data considering marketparticipants’ cost of equity and debt, optimal capital structure and risk factors specific to the Purification Solutions reporting unit.Based on these estimates and as part of step one of the annual impairment test, the Company determined that the estimated fairvalue of the Purification Solutions reporting unit was lower than the reporting unit's carrying value. As such, the reporting unit failedstep one of the goodwill impairment test. The Company then proceeded to step two.
Step two of the goodwill impairment test requires the Company to perform a theoretical purchase price allocation for thereporting unit to determine the implied fair value of goodwill and to compare the implied fair value of goodwill to the recordedamount of goodwill. The estimate of fair value is complex and requires significant judgment. Accounting guidance provides that acompany should recognize an estimated impairment charge to the extent that it determines that it is probable that an impairmentloss has occurred and such impairment can be reasonably estimated. Based on the best estimate as of June 30, 2015, the Companyrecorded a pre-tax goodwill impairment charge of $353 million. The Company completed the step two analysis in the fourth quarterof fiscal 2015, which resulted in recording a credit of $1 million to the pre-tax goodwill impairment charge.
Based on the same factors leading to the goodwill impairment, the Company also considered whether the reporting unit'scarrying values of definite-lived intangible assets and property, plant and equipment may not be recoverable or whether thecarrying value of certain indefinite-lived intangible assets were impaired. The Company used the income approach to determine thefair value of the indefinite-lived intangible assets, which are the trademarks of Purification Solutions, and determined that the fairvalue of these intangible assets was lower than their carrying value. As such, an impairment loss was recorded in the amount of $39million. Subsequent to this impairment analysis, the Company concluded that such assets no longer had an indefinite life and beganamortizing these assets over their estimated useful life. The Company also performed an impairment analysis to assess if definite-lived intangible assets and property, plant and equipment were recoverable based on the estimated undiscounted cash flows of thereporting unit, and determined that these cash flows were not sufficient to recover the carrying value of the long-lived assets overtheir remaining useful lives. Accordingly, an impairment charge was recorded based on the lower of the carrying amount or fairvalue of the long-lived assets. The Company used the income approach to determine the fair value of the definite-lived intangibleassets and a combination of the cost and market approaches to fair value its property, plant and equipment. The Company recordedimpairment charges of $119 million and $51 million, to its definite-lived intangible assets and property, plant and equipment,respectively, in the quarter ended June 30, 2015. The Company completed the impairment analysis in the fourth quarter of fiscal2015 which resulted in increasing the property, plant and equipment impairment charge by $1 million to $52 million. Therefore, forthe year ended September 30, 2015, the long-lived assets impairment charge was $210 million.
In connection with the long-lived assets impairment charges, the Company recorded a deferred tax benefit of $80 million to itsincome tax provision in fiscal 2015.

61
Note H. Goodwill and Intangible Assets
Cabot had goodwill balances of $152 million and $154 million at September 30, 2016 and September 30, 2015, respectively.The carrying amount of goodwill attributable to each reportable segment with goodwill balances and the changes in those balancesduring the period ended September 30, 2016 are as follows:
ReinforcementMaterials
PerformanceChemicals
PurificationSolutions Total
(Dollars in millions)Balance at September 30, 2015 $ 55 $ 9 $ 90 $ 154Foreign currency impact (3) — 1 (2)Balance at September 30, 2016 $ 52 $ 9 $ 91 $ 152
ReinforcementMaterials
PerformanceChemicals
PurificationSolutions Total
(Dollars in millions)Accumulated impairment losses at September 30, 2015 $ — $ — $ (352) $ (352)Accumulated impairment losses at September 30, 2016 $ — $ — $ (352) $ (352)
The following table provides information regarding the Company’s intangible assets:
September 30, 2016 September 30, 2015Gross
CarryingValue
AccumulatedAmortization
NetIntangible
Assets
GrossCarrying
ValueAccumulatedAmortization
NetIntangible
Assets(Dollars in millions)
Intangible assets with finite livesDeveloped technologies $ 48 $ (4) $ 44 $ 48 $ (1) $ 47Trademarks 16 (1) 15 16 — 16Customer relationships 90 (9) 81 96 (6) 90
Total intangible assets $ 154 $ (14) $ 140 $ 160 $ (7) $ 153
Intangible assets are amortized over their estimated useful lives, which range from fourteen to twenty-five years, with aweighted average amortization period of approximately nineteen years. Amortization expense for the years ended September 30,2016, 2015 and 2014 was $7 million, $14 million and $17 million, respectively, and is included in Cost of sales and Selling andadministrative expenses in the Consolidated Statements of Operations. Total amortization expense is estimated to be approximately$7 million each year for the next five fiscal years.
Note I. Accounts Payable, Accrued Liabilities and Other Liabilities
Accounts payable and accrued liabilities included in current liabilities consist of the following:
September 302016 2015
(Dollars in millions)Accounts payable $ 259 $ 274Accrued employee compensation 42 34Other accrued liabilities 63 81
Total $ 364 $ 389
Other long-term liabilities consist of the following:
September 302016 2015
(Dollars in millions)Employee benefit plan liabilities $ 173 $ 138Non-current tax liabilities 19 17Other accrued liabilities 93 85
Total $ 285 $ 240

62
Note J. Debt and Other Obligations
Long-term Obligations
The Company’s long-term obligations, the fiscal year in which they mature and their respective interest rates are summarizedbelow:
September 302016 2015
(Dollars in millions)Variable Rate Debt:
Revolving Credit Facility, expires 2021 $ — $ —Total variable rate debt — —
Fixed Rate Debt:5% Notes $ — $ 3002.55% Notes due 2018 250 2503.7% Notes due 2022 350 3503.4% Notes due 2026 250 —Medium Term Notes:
Notes due 2019, 7.42% 30 30Notes due 2022, 8.35%—8.47% 15 15Notes due 2028, 6.57%—7.28% 8 8
Total Medium Term Notes $ 53 $ 53Chinese Renminbi Debt, due 2017, 6.15% 4 5
Total fixed rate debt 907 958Capital lease obligations, due through 2031 13 14Unamortized debt discount (1) (1)
Total debt 919 971Less current portion of long-term debt (1) (1)
Total long-term debt $ 918 $ 970
Revolving Credit Facility—The amount available for borrowing under the revolving credit agreement, after consideration ofletters of credit and commercial paper outstanding, was $1 billion as of September 30, 2016. The revolving credit agreement, whichmatures on October 23, 2020, subject to two one-year options to extend on the first and second anniversaries of the effective date,supports the Company’s commercial paper program. Borrowings may be used for working capital, letters of credit and other generalcorporate purposes. The revolving credit agreement contains affirmative and negative covenants, a single financial covenant(consolidated total debt to consolidated EBITDA, as defined in the credit agreement) and events of default customary for financingsof this type.
Chinese Renminbi Debt—The Company’s consolidated Chinese subsidiaries had $4 million and $5 million of unsecured long-term debt outstanding with a noncontrolling shareholder of a consolidated subsidiary as of September 30, 2016 and September 30,2015, respectively. The Company has the ability and intent to renew the Chinese Renminbi Debt to extend the maturity date beyond2017 and therefore continues to classify the debt as long-term.
5% Notes—In fiscal 2009, Cabot issued $300 million in registered notes with a coupon of 5% and a maturity date of October 1,2016. Cabot redeemed these notes effective September 27, 2016. These notes were unsecured and paid interest on April 1 andOctober 1. The net proceeds of this offering were $296 million after deducting discounts and issuance costs. The discount ofapproximately $2 million was recorded at issuance and was amortized over the life of the notes.
2.55% Notes due fiscal 2018—In July 2012, Cabot issued $250 million in registered notes with a coupon of 2.55% that matureon January 15, 2018. These notes are unsecured and pay interest on January 15 and July 15. The net proceeds of this offering were$248 million after deducting discounts and issuance costs. The discount of less than $1 million was recorded at issuance and is beingamortized over the life of the notes.
3.7% Notes due fiscal 2022—In July 2012, Cabot issued $350 million in registered notes with a coupon of 3.7% that mature onJuly 15, 2022. These notes are unsecured and pay interest on January 15 and July 15. The net proceeds of this offering were $347million after deducting discounts and issuance costs. The discount of less than $1 million was recorded at issuance and is beingamortized over the life of the notes.

63
3.4% Notes due fiscal 2026—In September 2016, Cabot issued $250 million in registered notes with a coupon of 3.4% thatmature on September 15, 2026. These notes are unsecured and pay interest on March 15 and September 15. The net proceeds ofthis offering were $248 million after deducting discounts and issuance costs. The discount of less than $1 million was recorded atissuance and is being amortized over the life of the notes.
Medium Term Notes—At both September 30, 2016 and 2015, there were $53 million of unsecured medium term notesoutstanding issued to numerous lenders with various fixed interest rates and maturity dates. The weighted average maturity of thetotal outstanding medium term notes is 5 years with a weighted average interest rate of 7.65%.
Capital Lease Obligations—Cabot had capital lease obligations for certain equipment and buildings with a recorded value of$13 million and $14 million at September 30, 2016 and 2015, respectively. Cabot will make payments totaling $20 million over thenext 15 years, including $7 million of imputed interest. At September 30, 2016 and 2015, the original cost of capital lease assets was$18 million and $20 million, respectively, and the associated accumulated depreciation of assets under capital leases was $10 millionand $9 million at September 30, 2016 and 2015, respectively. The amortization related to those assets under capital lease is includedin depreciation expense.
Future Years Payment Schedule
The aggregate principal amounts of long-term debt and capital lease obligations due in each of the five years from fiscal 2017through 2021 and thereafter are as follows:
Fiscal Years Ending September 30,
Principal Paymentson Long-Term
Debt
Payments onCapital LeaseObligations Total
(Dollars in millions)2017 $ — $ 2 $ 22018 250 3 2532019 30 2 322020 — 2 22021 — 2 2Thereafter 627 9 636Less: Interest — (7) (7)
Total $ 907 $ 13 $ 920
Standby letters of credit—At September 30, 2016, the Company had provided standby letters of credit that were outstandingand not drawn totaling $16 million, which expire through fiscal 2017.
Short-term Obligations
Short-term Notes Payable—The Company had unsecured notes with maturities of less than one year of $7 million and $22million as of September 30, 2016 and 2015, respectively. The weighted-average interest rate on short-term notes payable, includingcommercial paper, was 9.5% and 4.6% as of September 30, 2016 and 2015, respectively.
The Company has a commercial paper program and the maximum aggregate balance of commercial paper notes outstandingand the amounts borrowed under the revolving credit facility may not exceed the borrowing capacity of $1 billion under therevolving credit facility. The proceeds from the issuance of the commercial paper have been used for general corporate purposes,which may include working capital, refinancing existing indebtedness, capital expenditures, share repurchases, and acquisitions. Therevolving credit facility is available to repay the outstanding commercial paper, if necessary.The outstanding balance of commercial paper, included within the Notes payable caption on the Consolidated Balance Sheets, was$12 million as of September 30, 2015 bearing a weighted-average interest rate of 0.36% with a weighted-average maturity of 1 day.There was no outstanding balance of commercial paper as of September 30, 2016

64
Note K. Financial Instruments and Fair Value Measurements
The FASB authoritative guidance on fair value measurements defines fair value, provides a framework, for measuring fair valuein generally accepted accounting principles, and requires certain disclosures about fair value measurements. The disclosures focuson the inputs used to measure fair value. The guidance establishes the following hierarchy for categorizing these inputs:
Level 1 — Quoted market prices in active markets for identical assets or liabilities
Level 2 — Significant other observable inputs (e.g., quoted prices for similar items in active markets, quoted prices for identicalor similar items in markets that are not active, inputs other than quoted prices that are observable such as interestrate and yield curves, and market-corroborated inputs)
Level 3 — Significant unobservable inputs
There were no transfers of financial assets or liabilities measured at fair value between Level 1 and Level 2, or transfers into orout of Level 3, during fiscal 2016 or 2015.
At September 30, 2016 Cabot has derivatives relating to foreign currency risks carried at fair value and included in Prepaidexpenses and other current assets and Other assets of $1 million. At September 30, 2015 derivatives relating to foreign currencyrisks carried at fair value were immaterial and were presented in Prepaid expenses and other current assets. These derivatives areclassified as Level 2 instruments within the fair value hierarchy as the fair value determination was based on observable inputs.
At September 30, 2016 and 2015, the fair value of Guaranteed investment contracts, included in Other assets on theConsolidated Balance Sheets, was $12 million for each period. Guaranteed investment contracts were classified as Level 2instruments within the fair value hierarchy as the fair value determination was based on other observable inputs.
At September 30, 2016 and 2015, the fair values of cash and cash equivalents, accounts and notes receivable, accountspayable and accrued liabilities, and notes payable and variable rate debt approximated their carrying values due to the short-termnature of these instruments. The carrying value and fair value of the long-term fixed rate debt were $0.91 billion and $0.98 billion,respectively, as of September 30, 2016. The carrying value and fair value of the long-term fixed rate debt were $0.96 billion and$1.02 billion, respectively, as of September 30, 2015. The fair values of Cabot’s fixed rate long-term debt are estimated based oncomparable quoted market prices at the respective period ends. The carrying amounts of Cabot’s floating rate long-term debt andcapital lease obligations approximate their fair values. All such measurements are based on observable inputs and are classified asLevel 2 within the fair value hierarchy. The valuation technique used is the discounted cash flow model.
Note L. Derivatives
Risk Management
Cabot’s business operations are exposed to changes in interest rates, foreign currency exchange rates and commodity pricesbecause Cabot finances certain operations through long and short-term borrowings, denominates transactions in a variety of foreigncurrencies and purchases certain commoditized raw materials. Changes in these rates and prices may have an impact on future cashflows and earnings. The Company manages these risks through normal operating and financing activities and, when deemedappropriate, through the use of derivative financial instruments.
The Company has policies governing the use of derivative instruments and does not enter into financial instruments fortrading or speculative purposes.
By using derivative instruments, Cabot is subject to credit and market risk. If a counterparty fails to fulfill its performanceobligations under a derivative contract, Cabot’s credit risk will equal the fair value of the derivative. Generally, when the fair value ofa derivative contract is positive, the counterparty owes Cabot, thus creating a payment risk for Cabot. The Company minimizescounterparty credit (or repayment) risk by entering into transactions with major financial institutions of investment grade creditrating. Cabot’s exposure to market risk is not hedged in a manner that completely eliminates the effects of changing marketconditions on earnings or cash flow. No significant concentration of credit risk existed at September 30, 2016.
Interest Rate Risk Management
Cabot’s objective is to maintain a certain fixed-to-variable interest rate mix on the Company’s debt obligations. Cabot mayenter into interest rate swaps as a hedge of the underlying debt instruments to effectively change the characteristics of the interestrate without changing the debt instrument. As of both September 30, 2016 and 2015, there were no derivatives held to manageinterest rate risk.

65
Foreign Currency Risk Management
Cabot’s international operations are subject to certain risks, including currency exchange rate fluctuations and governmentactions. Cabot endeavors to match the currency in which debt is issued to the currency of the Company’s major, stable cash receipts.In some situations Cabot has issued debt denominated in U.S. dollars and then entered into cross currency swaps that exchange thedollar principal and interest payments into Euro denominated principal and interest payments.
Additionally, the Company has foreign currency exposure arising from its net investments in foreign operations. Cabot mayenter into cross currency swaps to mitigate the impact of currency rate changes on the Company’s net investments.
The Company also has foreign currency exposure arising from the denomination of monetary assets and liabilities in foreigncurrencies other than the functional currency of a given subsidiary as well as the risk that currency fluctuations could affect thedollar value of future cash flows generated in foreign currencies. Accordingly, Cabot uses short-term forward contracts to minimizethe exposure to foreign currency risk. In certain situations where the Company has forecasted purchases under a long-termcommitment or forecasted sales denominated in a foreign currency, Cabot may enter into appropriate financial instruments inaccordance with the Company’s risk management policy to hedge future cash flow exposures.
The following table provides details of the derivatives held as of September 30, 2016 and 2015 to manage foreign currencyrisk.
Notional Amount
Description Borrowing September 30, 2016 September 30, 2015Hedge
Designation
Cross Currency Swaps 3.4% NotesUSD 250 millionswapped to EUR
223 million— Net
investment
Forward Foreign Currency Contracts (1) N/A USD 4 million USD 2 million No designation
(1) Cabot’s forward foreign exchange contracts are denominated primarily in the Indonesian rupiah, Czech koruna, and Britishpound sterling.
Accounting for Derivative Instruments and Hedging Activities
The Company determines the fair value of financial instruments using quoted market prices whenever available. When quotedmarket prices are not available for various types of financial instruments (such as forwards, options and swaps), the Company usesstandard models with market-based inputs, which take into account the present value of estimated future cash flows and the abilityof Cabot or the financial counterparty to perform. For interest rate and cross currency swaps, the significant inputs to these modelsare interest rate curves for discounting future cash flows and are adjusted for credit risk. For forward foreign currency contracts, thesignificant inputs are interest rate curves for discounting future cash flows, and exchange rate curves of the foreign currency fortranslating future cash flows.
Fair Value Hedge
For derivative instruments that are designated and qualify as fair value hedges, the gain or loss on the derivative as well as theoffsetting gain or loss on the hedged item attributable to the hedged risk are recognized in current period earnings.
Cash Flow Hedge
For derivative instruments that are designated and qualify as cash flow hedges, the effective portion of the gain or loss on thederivative is recorded in Accumulated other comprehensive income (loss) and reclassified to earnings in the same period or periodsduring which the hedged transaction affects earnings. Gains and losses on the derivative representing either hedge ineffectivenessor hedge components excluded from the assessment of effectiveness are recognized in current period earnings.
Net Investment Hedge
For net investment hedges, changes in the fair value of the effective portion of the derivatives’ gains or losses are reported asforeign currency translation gains or losses in Accumulated other comprehensive income (loss) while changes in the ineffectiveportion are reported in earnings. Effectiveness is assessed based on the hypothetical derivative method. There was noineffectiveness for the year ended September 30, 2016. The gains or losses on derivative instruments reported in Accumulatedother comprehensive income are reclassified to earnings in the period in which earnings are affected by the underlying item, such asa disposal or substantial liquidations of the entities being hedged.

66
During the fourth quarter of fiscal 2016, the Company entered into cross currency swaps with a notional amount of $250million, which are designated as hedges of its net investments in certain Euro denominated subsidiaries. Cash settlementsperiodically occur for fixed rate interest payments and a cash exchange of the notional currency amount will occur at the end of theterm in 2026 under these cross currency swaps. As of September 30, 2016, the fair value of and cumulative gain related to theseswaps was $1 million and was included in Other assets and Accumulated other comprehensive income (loss), respectively, on theConsolidated Balance Sheet. There were no gains or losses reclassified from Accumulated other comprehensive income (loss) intoearnings during fiscal 2016.
Other Derivative Instruments
From time to time, the Company may enter into certain derivative instruments that may not be designated as hedges foraccounting purposes, which may include cross currency swaps, foreign currency forward contracts and commodity derivatives. Forcross currency swaps and foreign currency forward contracts not designated as hedges, the Company uses standard models withmarket-based inputs. The significant inputs to these models are interest rate curves for discounting future cash flows, and exchangerate curves of the foreign currency for translating future cash flows. In determining the fair value of the commodity derivatives, thesignificant inputs to valuation models are quoted market prices of similar instruments in active markets. Although these derivativesdo not qualify for hedge accounting, Cabot believes that such instruments are closely correlated with the underlying exposure, thusmanaging the associated risk. The gains or losses from changes in the fair value of derivative instruments that are not accounted foras hedges are recognized in current period earnings.
During fiscal 2015 and 2014, there were no derivatives designated as hedges.
At both September 30, 2016 and 2015, the fair value of derivative instruments not designated as hedges were immaterial andwere presented in Prepaid expenses and other current assets on the Consolidated Balance Sheets.
Note M. Venezuela
Cabot owns 49% of an operating carbon black affiliate in Venezuela, which is accounted for as an equity affiliate, throughwholly-owned subsidiaries that carry the investment and receive its dividends. As of September 30, 2016, these subsidiaries carriedthe operating affiliate investment of $14 million.
During fiscal 2016, 2015 and 2014, the Company received dividends in the amounts of $2 million, $6 million and $5 million,respectively, which were paid in U.S. dollars.
A significant portion of the Company’s operating affiliate’s sales are exports denominated in U.S. dollars. The Venezuelangovernment mandates that a certain percentage of the dollars collected from these sales be converted into bolivars. The exchangerate made available to us as of September 30, 2016 was 656 bolivars to the U.S. dollar. The operating affiliate and the Company’swholly-owned subsidiaries remeasured their bolivar denominated monetary accounts to reflect the current rate. During fiscal 2016,the exchange rate devalued from 52 bolivars to the U.S. dollar to 656 bolivars to the U.S. dollar. The impact of the exchange ratedevaluations on the operating affiliate and the Company’s wholly-owned subsidiaries’ results was a net gain of less than $1 millionduring 2016.
The operating entity has generally been profitable. The Company continues to closely monitor developments in Venezuela andtheir potential impact on the recoverability of its equity affiliate investment. Any future change in the exchange rate made availableto the Company could cause the Company to change the exchange rate it uses and result in gains or losses on the bolivardenominated assets held by its operating affiliate and wholly-owned subsidiaries.
Note N. Employee Benefit Plans
The information below provides detail concerning the Company’s benefit obligations under the defined benefit andpostretirement benefit plans it sponsors.
Defined benefit plans provide pre-determined benefits to employees that are distributed upon retirement. Cabot is making allsponsor required contributions to these plans. The accumulated benefit obligation was $175 million for the U.S. defined benefitplans and $373 million for the foreign plans as of September 30, 2016 and $170 million for the U.S. defined benefit plans and $326million for the foreign plans as of September 30, 2015.
In addition to benefits provided under the defined benefit and postretirement benefit plans, the Company provides benefitsunder defined contribution plans. Prior to January 2014, one of these plans included an Employee Stock Ownership Plan (“ESOP”)component, which is described below. Cabot recognized expenses related to these plans, not including the expenses related to theESOP, of $17 million in fiscal 2016, $20 million in fiscal 2015 and $14 million in fiscal 2014.

67
Employee Stock Ownership Plan
In the first quarter of fiscal 2014, all shares that remained available for distribution under the ESOP were allocated toparticipant accounts and no further contributions under the plan have been or will be made. Compensation expense related to theESOP, which is based on the fair value of the shares on the date of allocation, was $1 million in fiscal 2014.
The following provides information about benefit obligations, plan assets, the funded status and weighted-averageassumptions of the defined benefit pension and postretirement benefit plans:
Years Ended September 302016 2015 2016 2015
Pension Benefits Postretirement BenefitsU.S. Foreign U.S. Foreign U.S. Foreign U.S. Foreign
(Dollars in millions)Change in Benefit Obligations:Benefit obligation at beginning of year $ 170 $ 348 $ 173 $ 491 $ 38 $ 15 $ 50 $ 17Service cost 1 8 1 9 — — — —Interest cost 4 8 7 11 1 1 2 1Plan participants’ contribution — 2 — 2 — — — —Foreign currency exchange rate changes — (9) — (45) — (1) — (2)(Gain) Loss from changes in actuarialassumptions and plan experience 14 62 3 (23) 1 5 1 (1)Benefits paid(1) (7) (14) (13) (13) (3) — (4) —Settlements or curtailments(2) (6) (4) — (85) — — — —Plan amendments — — — — — — (11) —Other (1) (1) (1) 1 — — — —Benefit obligation at end of year $ 175 $ 400 $ 170 $ 348 $ 37 $ 20 $ 38 $ 15
Years Ended September 302016 2015 2016 2015
Pension Benefits Postretirement BenefitsU.S. Foreign U.S. Foreign U.S. Foreign U.S. Foreign
(Dollars in millions)Change in Plan Assets:Fair value of plan assets at beginning of year $ 153 $ 279 $ 167 $ 388 $ — $ — $ — $ —Actual return on plan assets 18 43 (1) 11 — — — —Employer contribution — 10 1 10 3 1 4 —Plan participants’ contribution — 2 — 2 — — — —Foreign currency exchange rate changes — (11) — (34) — — — —Benefits paid(1) (7) (14) (13) (13) (3) (1) (4) —Settlements (6) (3) — (85) — — — —Expenses paid from assets (1) (1) (1) — — — — —Fair value of plan assets at end of year $ 157 $ 305 $ 153 $ 279 $ — $ — $ — $ —Funded status $ (18) $ (95) $ (17) $ (69) $ (37) $ (20) $ (38) $ (15)Recognized liability $ (18) $ (95) $ (17) $ (69) $ (37) $ (20) $ (38) $ (15)
(1) Included in this amount are $5 million and $6 million that the Company paid directly to the participants in its defined benefitplans in fiscal 2016 and 2015, respectively.
(2) The $10 million settlements and curtailments amount in 2016 was a result of global restructuring activities. The $85 millionsettlements amount in 2015 primarily reflects the transfer of certain plan assets and obligations to a third party, as discussedunder Curtailments and Settlements of Employee Benefit Plans.

68
Pension Assumptions and Strategy
The following assumptions were used to determine the pension benefit obligations and periodic benefit costs as of and for theyears ended September 30:
Assumptions as of September 302016 2015 2014
Pension BenefitsU.S. Foreign U.S. Foreign U.S. Foreign
Actuarial assumptions as of the year-end measurement date:
Discount rate 3.4% 1.8% 4.2% 2.9% 4.0% 3.0%Rate of increase in compensation N/A 2.8% N/A 2.8% N/A 2.8%
Actuarial assumptions used to determine net periodic benefit cost during the year:
Discount rate - benefit obligation 4.2% 2.9% 4.0% 3.0% 4.5% 3.8%Discount rate - service cost N/A 2.8% N/A 3.0% N/A 3.8%Discount rate - interest cost 3.3% 2.4% 4.0% 3.0% 4.5% 3.8%Expected long-term rate of return on plan assets 7.5% 5.1% 7.5% 5.4% 7.8% 5.3%Rate of increase in compensation N/A 2.8% N/A 2.8% 3.0% 3.1%
Postretirement Assumptions and Strategy
The following assumptions were used to determine the postretirement benefit obligations and net costs as of and for theyears ended September 30:
Assumptions as of September 302016 2015 2014
Postretirement BenefitsU.S. Foreign U.S. Foreign U.S. Foreign
Actuarial assumptions as of the year-end measurement date:
Discount rate 3.0% 2.8% 3.7% 3.9% 3.8% 3.9%Initial health care cost trend rate 7.0% 6.1% 6.5% 6.8% 7.0% 7.1%
Actuarial assumptions used to determine net cost during the year:
Discount rate - benefit obligation 3.7% 3.9% 3.8% 3.9% 4.0% 4.4%Discount rate - service cost 3.4% 4.1% 3.8% 3.9% 4.0% 4.4%Discount rate - interest cost 2.8% 3.7% 3.8% 3.9% 4.0% 4.4%Initial health care cost trend rate 6.5% 6.8% 7.0% 7.1% 7.5% 7.5%
Cabot uses discount rates as of September 30, the plans’ measurement date, to determine future benefit obligations under itsU.S. and foreign defined benefit plans. The discount rates for the defined benefit plans in the U.S., Canada, Mexico, UAE, Euro-zone,Japan, Switzerland and the U.K. are derived from yield curves that reflect high quality corporate bond yield or swap rate informationin each region and reflect the characteristics of Cabot’s employee benefit plans. The discount rates for the defined benefit plans inthe Czech Republic and Indonesia are based on government bond indices that best reflect the durations of the plans, adjusted forcredit spreads presented in selected AA corporate bond indices. The rates utilized are selected because they represent long-term,high quality, fixed income benchmarks that approximate the long-term nature of Cabot’s pension obligations and related payouts.
Years Ended September 302016 2015 2016 2015
Pension Benefits Postretirement BenefitsU.S. Foreign U.S. Foreign U.S. Foreign U.S. Foreign
(Dollars in millions)Net Amounts Recognized in the Consolidated Balance Sheets:Noncurrent assets $ — $ 8 $ — $ 5 $ — $ — $ — $ —Current liabilities — (1) (1) (1) (3) (1) (4) —Noncurrent liabilities (18) (102) (16) (73) (34) (19) (34) (15)

69
Amounts recognized in Accumulated other comprehensive income (loss) at September 30, 2016 and 2015 were as follows:
Years Ended September 302016 2015 2016 2015
Pension Benefits Postretirement BenefitsU.S. Foreign U.S. Foreign U.S. Foreign U.S. Foreign
(Dollars in millions)Net actuarial (gain) loss $ 12 $ 92 $ 5 $ 65 $ (4) $ 6 $ (6) $ 1Net prior service credit — (1) — (1) (7) — (11) —Balance in accumulated other comprehensive income (loss), pretax $ 12 $ 91 $ 5 $ 64 $ (11) $ 6 $ (17) $ 1
In fiscal 2017, the Company expects an estimated net loss of $5 million will be amortized from Accumulated othercomprehensive income (loss) to net periodic benefit cost. In addition, the Company expects prior service credits of $3 million forother postretirement benefits will be amortized from Accumulated other comprehensive income (loss) to net periodic benefit costsin fiscal 2017.
Estimated Future Benefit Payments
The Company expects that the following benefit payments will be made to plan participants in the years from 2017 to 2026:
Pension Benefits Postretirement BenefitsU.S. Foreign U.S. Foreign
(Dollars in millions)Years Ended:
2017 13 12 4 —2018 11 13 3 12019 11 12 3 12020 11 12 3 12021 11 14 3 12022-2026 52 80 13 4
Postretirement medical benefits are unfunded and impact Cabot’s cash flows as benefits become due, which is expected to beinsignificant in fiscal 2017. The Company expects to contribute $8 million to its foreign pension plans in fiscal 2017.
Net periodic defined benefit pension and other postretirement benefit costs include the following components:
Years Ended September 302016 2015 2014 2016 2015 2014
Pension Benefits Postretirement BenefitsU.S. Foreign U.S. Foreign U.S. Foreign U.S. Foreign U.S. Foreign U.S. Foreign
(Dollars in millions)Service cost $ 1 $ 8 $ 1 $ 9 $ 2 $ 9 $ — $ — $ — $ — $ — $ —Interest cost 4 8 7 11 7 16 1 1 2 1 2 1Expected return on plan assets (10) (14) (11) (14) (10) (19) — — — — — —Amortization of prior service cost — — — 3 — — (3) — (4) — (3) —Net losses — 3 — 4 — 3 — — — — — —Settlements or Curtailments cost — 1 — 18 — — (1) — — — — —Net periodic (benefit) cost $ (5) $ 6 $ (3) $ 31 $ (1) $ 9 $ (3) $ 1 $ (2) $ 1 $ (1) $ 1

70
Other changes in plan assets and benefit obligations recognized in other comprehensive income are as follows:
Years Ended September 302016 2015 2014 2016 2015 2014
Pension Benefits Postretirement BenefitsU.S. Foreign U.S. Foreign U.S. Foreign U.S. Foreign U.S. Foreign U.S. Foreign
(Dollars in millions)Net (gains) losses $ 7 $ 31 $ 14 $ (8) $ (4) $ 50 $ 2 $ 5 $ 1 $ — $ (4) $ —Prior service (credit) cost — — — (2) — — — — (11) — 3 —Amortization of prior service credit — — — — — — 3 — — — — —Amortization of prior unrecognized loss — (3) — (4) — (3) — — 4 — — —Other — (1) — (27) — (1) 1 — — — — —Total other comprehensive (income) loss (1) $ 7 $ 27 $ 14 $ (41) $ (4) $ 46 $ 6 $ 5 $ (6) $ — $ (1) $ —
(1) The tax impact on pension and other postretirement benefit liability adjustments arising during the period was a tax benefitof $7 million, tax provision of $5 million, and tax benefit of $1 million for fiscal years 2016, 2015, and 2014, respectively.
Curtailments and Settlements of Employee Benefit Plans
In recent years, the Company incurred curtailments and settlements of certain of its employee benefit plans. Associated withthese curtailments and settlements, the Company recognized net losses of less than $1 million, $17 million, and less than $1 millionin fiscal 2016, 2015 and 2014, respectively.
Effective October 1, 2014, the Company transferred the defined benefit obligations and pension plan assets in one of itsforeign defined benefit plans to a multi-employer plan. This action effectively moves the administrative, asset custodial, assetinvestment, actuarial, communication and benefit payment obligations to the multi-employer fund administrator. Cabot is requiredto make contributions to the multi-employer plan which is over 80% funded. Contributed assets by one participating employer maybe used to provide benefits to employees of other participating employers since assets contributed by an employer are notsegregated in a separate account or restricted to provide benefits only to employees of that employer. As a result of the transfer apre-tax charge of $18 million was recorded in the first quarter of fiscal 2015. In addition, there was an approximately $85 millionreduction in plan assets and plan obligations as a result of the transfer of assets and obligations of this foreign plan.
Sensitivity Analysis
Measurement of postretirement benefit expense is based on actuarial assumptions used to value the postretirement benefitliability at the beginning of the year. Assumed health care cost trend rates have an effect on the amounts reported for the healthcare plans. The fiscal 2016 weighted-average assumed health care cost trend rate is 6.5% for U.S. plans and 6.8% for foreign plans. Aone percentage point change in the 2016 assumed health care cost trend rate would have an immaterial impact to the aggregate ofthe service and interest cost components of the net periodic postretirement benefit and would have the following effect on thepostretirement benefit obligation:
1-Percentage-PointIncrease Decrease
U.S. Foreign U.S. Foreign(Dollars in millions)
Effect on postretirement benefit obligation $ — $ 4 $ — $ (3)
Plan Assets
The Company’s defined benefit pension plans weighted-average asset allocations at September 30, 2016 and 2015, by assetcategory, are as follows:
Pension AssetsSeptember 30
2016 2015U.S. Foreign U.S. Foreign
Asset Category:Equity securities 50% 39% 55% 39%Debt securities 50% 53% 45% 54%Cash and other securities — 8% — 7%
Total 100% 100% 100% 100%

71
To develop the expected long-term rate of return on plan assets assumption, the Company used a capital asset pricing model.The model considers the current level of expected returns on risk-free investments comprised of government bonds, the historicallevel of the risk premium associated with the other asset classes in which the portfolio is invested, and the expectations for futurereturns for each asset class. The expected return for each asset class was then weighted based on the target asset allocation todevelop the expected long-term rate of return for each plan.
Cabot’s investment strategy for each of its defined benefit plans in the U.S. and abroad is generally based on a set ofinvestment objectives and policies that cover time horizons and risk tolerance levels consistent with plan liabilities. Periodic studiesare performed to determine the asset mix that will meet pension obligations at a reasonable cost to the Company. The assets of thedefined benefit plans are comprised principally of investments in equity and high quality fixed income securities, which are broadlydiversified across the capitalization and style spectrum and are managed using both active and passive strategies. The weightedaverage target asset allocation for the U.S. plans is 50% in equity and 50% in fixed income and for the foreign plans is 38% in equity,54% in fixed income, 3% in real estate and 5% in cash and other securities.
For pension plan assets classified as Level 1 measurements (measured using quoted prices in active markets), total fair value iseither the price of the most recent trade at the time of the market close or the official close price, as defined by the exchange onwhich the asset is most actively traded on the last trading day of the period, multiplied by the number of units held withoutconsideration of transaction costs.
For pension plan assets classified as Level 2 measurements, where the security is frequently traded in less active markets, fairvalue is based on the closing price at the end of the period; where the security is less frequently traded, fair value is based on theprice a dealer would pay for the security or similar securities, adjusted for any terms specific to that asset or liability. Market inputsare obtained from well-established and recognized vendors of market data and subjected to tolerance/quality checks.
The fair value of the Company’s pension plan assets at September 30, 2016 and 2015 by asset category is as follows:
Quoted Prices inActive Markets
for IdenticalAssets
(Level 1)
SignificantObservable
Inputs(Level 2)
Quoted Prices inActive Markets
for IdenticalAssets
(Level 1)
SignificantObservable
Inputs(Level 2)
2016 Total 2015 Total
Asset Category:Cash $ 1 $ — $ 1 $ 1 $ — $ 1Direct investments:
U.S. equity securities 18 — 18 22 — 22Total direct investments 18 — 18 22 — 22
Investment funds:Equity funds(1) 59 119 178 60 108 168Fixed income funds(2) 79 162 241 70 150 220Real estate funds(3) 1 8 9 — 9 9Cash equivalent funds — 1 1 — 1 1
Total investment funds 139 290 429 130 268 398Alternative investments:
Insurance contracts(4) — 14 14 — 11 11Total alternative investments — — — — 11 11
Total pension plan assets $ 158 $ 304 $ 462 $ 153 $ 279 $ 432
(1) The equity funds asset class includes funds that invest in U.S. equities as well as equity securities issued by companiesincorporated, listed or domiciled in countries in developed and/or emerging markets. These companies may be in the small-,mid- or large-cap categories.
(2) The fixed income funds asset class includes investments in high quality funds. High quality fixed income funds primarily investin low risk U.S. and non-U.S. government securities, investment-grade corporate bonds, mortgages and asset-backedsecurities. A significant portion of the fixed income funds include investment in long-term bond funds.
(3) The real estate funds asset class includes funds that primarily invest in entities which are principally engaged in the ownership,acquisition, development, financing, sale and/or management of income-producing real estate properties, both commercialand residential. These funds typically seek long-term growth of capital and current income that is above average relative topublic equity funds.
(4) Insurance contracts held by the Company’s non-U.S. plans are issued by well-known, highly rated insurance companies.

72
Note O. Stock-Based Compensation
The Company has established equity compensation plans that provide stock-based compensation to eligible employees. The2009 Long-Term Incentive Plan (the “2009 Plan”), which was approved by Cabot’s stockholders on March 12, 2009 and amended onMarch 8, 2012, authorized the issuance of approximately 8.9 million shares of common stock. This is the Company’s only equityincentive plan under which awards may currently be made to employees.
The terms of awards made under Cabot’s equity compensation plans are generally determined by the CompensationCommittee of Cabot’s Board of Directors. The 2009 Plan allows for grants of stock options, restricted stock, restricted stock units andother stock-based awards to employees. The awards made in fiscal 2016, 2015 and 2014 under the 2009 Plan consist of grants ofstock options, time-based restricted stock units, performance-based restricted stock units, and restricted stock units that will besettled in cash. The options were issued with an exercise price equal to 100% of the market price of Cabot’s common stock on thedate of grant, generally vest over a three year period (30% on each of the first and second anniversaries of the date of grant and 40%on the third anniversary of the date of grant) and have a ten-year term. The restricted stock units generally vest three years from thedate of the grant. The number of shares issuable, if any, when a performance-based restricted stock unit award vests will depend onthe degree of achievement (threshold, target or maximum performance) of the corporate performance metrics for each year withinthe three-year performance period of the award. Accordingly, future compensation costs associated with outstanding awards ofperformance-based restricted stock units may increase or decrease based on the probability of the Company achieving theperformance metrics.
As of September 30, 2016, there were 22,305 outstanding time-based and performance-based restricted stock units which willbe settled by the payment of cash, assuming unbanked awards will be settled at target performance. Compensation expense relatedto these awards is remeasured throughout the vesting period and until ultimate settlement of the award. Cumulative compensationexpense and the associated liability is recorded equal to the fair value of Cabot common stock multiplied by the applicable vestingpercentage. The Company recorded liabilities associated with these cash settled awards of less than $1 million and $1 million atSeptember 30, 2016 and 2015, respectively.
Stock-based employee compensation expense was $10 million, $8 million and $9 million, after tax, for fiscal 2016, 2015 and2014, respectively. The expense recognized in fiscal 2016 includes a $5 million charge recorded in connection with the modificationof the outstanding equity awards held by the Company’s prior CEO under the terms of his transition and separation agreement withthe Company.
The Company recognized the full impact of its stock-based employee compensation expense in the Consolidated Statementsof Operations for fiscal 2016, 2015 and 2014 and did not capitalize any such costs on the Consolidated Balance Sheets because thosethat qualified for capitalization were not material. The following table presents stock-based compensation expenses included in theCompany’s Consolidated Statements of Operations:
2016 2015 2014(Dollars in millions)
Cost of sales $ 1 $ 4 $ 5Selling and administrative expenses 15 7 8Research and technical expenses 1 1 1Stock-based compensation expense 17 12 14Income tax benefit (7) (4) (5)
Net stock-based compensation expense $ 10 $ 8 $ 9
As of September 30, 2016, Cabot has $14 million and $2 million of total unrecognized compensation cost related to restrictedstock units and options, respectively, granted under the Company’s equity incentive plans. These costs are expected to berecognized over a weighted-average period of 1.4 years and 1.0 year for restricted stock units and options, respectively.

73
Equity Incentive Plan Activity
The following table summarizes the total stock option and restricted stock unit activity in the equity incentive plans for fiscal2016:
Stock Options Restricted Stock Units
TotalOptions
WeightedAverageExercise
Price
WeightedAverage
Grant DateFair Value
RestrictedStock
Units(1)
WeightedAverage
Grant DateFair Value
(Shares in thousands)Outstanding at September 30, 2015 1,510 $ 33.91 $ 11.65 735 $ 43.84Granted 385 40.35 11.12 442 40.51Performance-based adjustment(2) — — — (27) 45.44Exercised / Vested (339) 23.03 6.80 (335) 39.28Cancelled / Forfeited (34) 42.33 13.49 (83) 45.10Outstanding at September 30, 2016 1,522 37.72 12.53 732 43.54Exercisable at September 30, 2016 1,134 35.93Vested and expected to vest(3) 1,515 37.69
(1) The number granted represents the number of shares issuable upon vesting of time-based restricted stock units andperformance-based restricted stock units, assuming the Company performs at the target performance level in each year of thethree-year performance period.
(2) Represents the net number of performance based restricted stock units cancelled based on the Company’s actualperformance against performance targets applicable to outstanding restricted stock units.
(3) Stock options vested and expected to vest in the future, net of estimated forfeitures, have a weighted average remainingcontractual life of 5.18 years.
Stock Options
The following table summarizes information related to the outstanding and vested options on September 30, 2016:
TotalOptions
OutstandingExercisable
Options
Vested andExpectedto Vest
Aggregate Intrinsic Value (in millions of dollars) $ 22 $ 19 $ 22Weighted Average Remaining Contractual Term (in years) 6.60 4.01 5.18
The aggregate intrinsic value in the table above represents the total pre-tax intrinsic value, based on the Company’s closingcommon stock price of $52.41 on September 30, 2016, which would have been received by the option holders had all option holdersexercised their options and immediately sold their shares on that date.
The intrinsic value of options exercised during fiscal 2016, 2015 and 2014 was $8 million, $2 million and $12 million,respectively, and the Company received cash of $8 million, $4 million and $9 million, respectively, from these exercises.
The Company uses the Black-Scholes option-pricing model to estimate the fair value of the options at the grant date. Theweighted average grant date fair values of options granted during fiscal 2016, 2015 and 2014 was $11.12, $15.68, and $18.36 peroption, respectively. The fair values on the grant date were calculated using the following weighted-average assumptions:
Years Ended September 302016 2015 2014
Expected stock price volatility 33% 41% 45%Risk free interest rate 2.0% 2.0% 1.9%Expected life of options (years) 6 6 6Expected annual dividends per year $ 1.20 $ 0.88 $ 0.80
The expected stock price volatility assumption was determined using the historical volatility of the Company’s common stockover the expected life of the option. The expected term reflects the anticipated time period between the measurement date and theexercise date or post-vesting cancellation date.

74
Restricted Stock Units
The value of restricted stock unit awards is the closing stock price at the date of the grant. The weighted average grant datefair values of restricted stock unit awards granted during fiscal 2016, 2015 and 2014 was $40.51, $45.85, and $47.63, respectively.The intrinsic value of restricted stock units (meaning the fair value of the units on the date of vest) that vested during fiscal 2016,2015 and 2014 were $15 million, $14 million and $17 million, respectively.
Supplemental 401(k) Plan
Cabot’s Deferred Compensation and Supplemental Retirement Plan (“SERP 401(k)”) provides benefits to highly compensatedemployees in circumstances in which the maximum limits established under ERISA and the Internal Revenue Code prevent themfrom receiving all of the Company matching and retirement contributions that would otherwise be provided under the qualified401(k) plan. The SERP 401(k) is non-qualified and unfunded. Contributions under the SERP 401(k) are treated as if invested in Cabotcommon stock. The majority of the distributions made under the SERP 401(k) are required to be paid with shares of Cabot commonstock. The remaining distributions, which relate to certain grandfathered accounts, will be paid in cash based on the market price ofCabot common stock at the time of distribution. The aggregate value of the accounts that will be paid out in stock, which isequivalent to approximately 143,000 and 150,000 shares of Cabot common stock as of September 30, 2016 and 2015, respectively,is reflected at historic cost in stockholders’ equity, and the aggregate value of the accounts that will be paid in cash, which is $1million as of both September 30, 2016 and 2015, is reflected in other long-term liabilities and marked-to-market quarterly.
Note P. Restructuring
Cabot’s restructuring activities were recorded in the Consolidated Statements of Operations as follows:
Years Ended September 302016 2015 2014
(Dollars in millions)Cost of sales $ 33 $ 10 $ 12Selling and administrative expenses 9 11 17Research and development expenses 5 — —
Total $ 47 $ 21 $ 29
Details of these restructuring activities and the related reserves for fiscal 2016, 2015, and 2014 were as follows:
Severanceand
EmployeeBenefits
EnvironmentalRemediation
Non-CashAsset
Impairmentand
AcceleratedDepreciation
AssetSales Other Total
(Dollars in millions)Reserve at September 30, 2013 $ 7 $ 2 $ — $ — $ 1 $ 10
Charges 18 1 4 1 5 29Costs charged against liabilities (assets) — — (4) — — (4)Cash paid (8) (1) — (1) (5) (15)Foreign currency translation adjustment (1) — — — — (1)
Reserve at September 30, 2014 $ 16 $ 2 $ — $ — $ 1 $ 19Charges 9 — 5 — 7 21Costs charged against liabilities (assets) — — (5) — — (5)Cash paid (18) — — — (6) (24)Foreign currency translation adjustment (2) — — — — (2)
Reserve at September 30, 2015 $ 5 $ 2 $ — $ — $ 2 $ 9Charges 28 — 23 (9) 5 47Costs charged against liabilities (assets) — — (23) (7) — (30)Cash (paid) received (30) — — 16 (7) (21)Foreign currency translation adjustment — — — — — —
Reserve at September 30, 2016 $ 3 $ 2 $ — $ — $ — $ 5

75
Cabot’s severance and employee benefit reserves and other closure related reserves are reflected in Accounts payable andaccrued liabilities on the Company’s Consolidated Balance Sheets. Cabot’s environmental remediation reserves related torestructuring activities are reflected in Other liabilities on the Company’s Consolidated Balance Sheets.
2016 Plan
On October 20, 2015, in response to challenging macroeconomic conditions, the Company announced its intention torestructure its operations subject to local consultation requirements and processes in certain locations. Cabot’s plan has resulted ina reduction of approximately 300 positions across the Company’s global locations. These actions are intended to result in a morecompetitive cost structure.
The Company has recorded pre-tax cash charges of approximately $29 million for the year ended September 30, 2016 relatedto this plan. The Company expects to record additional pre-tax cash charges of approximately $1 million related to these actions.The charges recorded and anticipated are comprised of severance, employee benefits and other transition costs.
Cumulative net cash outlays related to these actions are expected to be approximately $30 million, comprised of severance,employee benefits and other transition costs. Through September 30, 2016, the Company has made $27 million in cash paymentsrelated to this plan comprised of severance payments of $23 million and $4 million for other transition costs and expects to makeadditional cash payments of $3 million comprised mainly of severance and other transition costs.
The actions related to this plan are expected to be substantially complete by the end of fiscal 2017.
As of September 30, 2016, Cabot has $2 million of accrued restructuring costs in the Consolidated Balance Sheet related tothese actions, which is mainly comprised of accrued severance charges.
Additionally, on November 11, 2015, the Company announced that it had committed to a plan to close its carbon blackmanufacturing facility in Merak, Indonesia. The decision to close this plant and to consolidate production in Asia using theCompany’s Cilegon, Indonesia and other Asian and global carbon black production sites to meet regional demand was driven by thefinancial performance at the Merak facility in the past several years. Manufacturing operations ceased at the end of January 2016and approximately 50 employees were affected.
The Company has recorded pre-tax charges of $25 million in the year ended September 30, 2016, comprised of $22 million ofnon-cash asset impairments and accelerated depreciation and $3 million of cash costs for severance and other transition relatedcosts.
Future anticipated cash site closure costs for the Merak facility, comprised mainly of site demolition, clearing andenvironmental remediation charges, and other miscellaneous costs, are expected to total approximately $3 million in fiscal 2017when these activities are expected to be substantially complete.
Net cash outlays related to this closure are expected to be approximately $5 million, comprised of $3 million of sitedemolition, clearing and environmental remediation costs, $2 million of severance payments, and less than $1 million for othercharges. Through September 30, 2016, the Company has made $2 million in cash payments related to this plan, mainly forseverance and other miscellaneous charges and expects to pay an additional $3 million in fiscal 2017 mainly for site demolition,clearing and environmental remediation costs.
As of September 30, 2016, Cabot has approximately $1 million of accrued severance costs in the Consolidated Balance Sheetrelated to the Merak facility closure.
Details of the 2016 restructuring activities, including the Merak facility closure, for the year-end September 30, 2016 areshown below:
Severanceand Employee
Benefits
Non-CashAsset
Impairmentand
AcceleratedDepreciation Other Total
(Dollars inmillions)
Reserve at September 30, 2015 $ — $ — $ — $ —Charges 28 22 4 54Costs charged against liabilities (assets) — (22) — (22)Cash paid (25) — (4) (29)
Reserve at September 30, 2016 $ 3 $ — $ — $ 3

76
Business Service Center Transition
In January 2014, the Company announced its intention to open a new Europe, Middle East and Africa (“EMEA”) businessservice center in Riga, Latvia, and to close its Leuven, Belgium site, subject to the Belgian information and consultation process,which was successfully completed in June 2014. These actions were developed following an extensive evaluation of the Company’sbusiness service capabilities in the EMEA region and a determination that the future EMEA business service center will enable theCompany to provide the highest quality of service at the most competitive cost.
The actions related to the transition of the business service center have been completed and have resulted in total cashcharges of approximately $24 million, comprised of $16 million of severance charges and $8 million of other transition costsincluding training costs and redundant salaries. $6 million of these charges were recorded in fiscal 2015, whereas $18 million wererecorded in fiscal 2014.
In fiscal 2016, the Company has made approximately $1 million in cash payments related to this plan, comprised mainly ofseverance payments. Through September 30, 2016, the Company has made $21 million in cash payments related to this plan,comprised of $14 million of severance payments and $7 million of other transition related costs. The difference between the initialaccrual and subsequent cash payments is due to changes in foreign exchange rates.
There is no remaining restructuring reserve related to this transition as of September 30, 2016. As of September 30, 2015,Cabot had $2 million of accrued restructuring costs in its Consolidated Balance Sheet related to this closure, which was mainlycomprised of accrued severance charges.
Closure of Port Dickson, Malaysia Manufacturing Facility
On April 26, 2013, the Company announced that the Board of its carbon black joint venture, Cabot Malaysia Sdn. Bhd.(“CMSB”), decided to cease production at its Port Dickson, Malaysia facility. The facility ceased production in June 2013. TheCompany holds a 50.1 percent equity share in CMSB. The decision, which affected approximately 90 carbon black employees, wasdriven by the facility’s manufacturing inefficiencies and raw materials costs.
During fiscal 2016, the Company recorded a net pre-tax restructuring benefit of $1 million and pre-tax charges of less than $1million and $2 million in 2015 and 2014, respectively.
Through September 30, 2016 the Company recorded pre-tax restructuring charges related to this plan of $19 million. These pre-tax restructuring costs were comprised mainly of non-cash accelerated depreciation and asset write-offs of $16 million,severance charges of $2 million, site demolition, clearing and environmental remediation charges of $2 million, and other closurerelated charges of $1 million, partially offset by the gain from the sale of land of $2 million in the first quarter of fiscal 2016. CMSB’snet income or loss is attributable to Cabot Corporation and to the noncontrolling interest in the joint venture. The portion of thecharges that are allocable to the noncontrolling interest in CMSB (49.9%) are recorded within Net income (loss) attributable tononcontrolling interests, net of tax, in the Consolidated Statements of Operations. The majority of actions related to closure of theplant were completed in fiscal 2014.
Cumulative net cash received related to this plan is $3 million comprised of $7 million received from the sale of land, partiallyoffset by approximately $2 million paid for severance, $1 million paid for site demolition, clearing and environmental remediation,and $1 million for other closure related charges.
As of September 30, 2016 and September 30, 2015, Cabot has less than $1 million of accrued restructuring costs in theConsolidated Balance Sheet related to this closure which is mainly comprised of accrued environmental and other charges.
Other Activities
The Company has recorded other pre-tax restructuring charges of approximately $1 million, $13 million and $8 million duringfiscal 2016, 2015 and 2014, respectively, related to restructuring activities at several other locations. Fiscal 2016 activity is comprisedmainly of non-cash accelerated depreciation and severance adjustments incurred primarily at the Company’s Specialty Fluids facilityin Canada and corporate headquarters in Boston, Massachusetts. Fiscal 2015 charges are comprised of $7 million of cash severancecharges, $4 million of non-cash asset write-offs and accelerated depreciation, and $2 million of other cash costs. Fiscal 2015 costswere incurred at the Company’s corporate headquarters in Boston, Massachusetts and Specialty Fluids facility in Bergen, Norway, aswell as other locations. Fiscal 2014 charges are comprised of non-cash accelerated depreciation and asset write-offs of $5 millionand severance charges of $3 million and were comprised of charges at the Company’s carbon black facilities in Port Dickson,Malaysia and Maua, Brazil, as well as other locations. No future charges related to these actions are expected.
As of September 30, 2016, Cabot has less than $1 million of accrued severance and other closure related costs in theConsolidated Balance Sheet related to these activities which are expected to be paid through early fiscal 2017. As of September 30,2015, Cabot had $5 million of accrued severance and other closure related costs in its Consolidated Balance Sheet related to theseactivities.

77
Previous Actions and Sites Pending Sale
Beginning in fiscal 2009, the Company entered into several different restructuring plans which have been substantiallycompleted, pending the sale of a former manufacturing site in Thane, India. The Company has incurred total cumulative pre-taxcharges of approximately $158 million related to these plans through September 30, 2016, comprised of $67 million for severancecharges, $66 million for non-cash accelerated depreciation and asset impairments, $10 million for environmental, demolition andsite clearing costs, and $23 million of other closure related charges partially offset by gains on asset sales of $8 million.
The net pre-tax restructuring gain related to these plans was $7 million for fiscal 2016 driven by the sale of land, whereascharges of $2 million and $1 million were recorded during fiscal 2015 and 2014, respectively. Fiscal 2015 charges are comprisedmainly of severance, accelerated depreciation and other expenses. Fiscal 2014 charges are comprised mainly of environmentalcharges and other post closure costs.
Since fiscal 2009, Cabot has made net cash payments of $79 million related to these plans comprised of $63 million forseverance payments, $10 million for environmental, demolition and site clearing cots, and $25 million for other closure relatedcharges, partially offset by cash proceeds from asset sales of $19 million. The Company expects to pay approximately $2 million forenvironmental, severance, and other closure related costs in fiscal 2017 and thereafter.
As of both September 30, 2016 and September 30, 2015, Cabot has approximately $2 million of accrued environmental,severance and other closure related costs in the Consolidated Balance Sheets related to these activities.
Note Q. Accumulated Other Comprehensive Income (Loss)
Changes in each component of Accumulated other comprehensive income (loss), net of tax, are as follows for fiscal 2015 and2016:
CurrencyTranslationAdjustment
UnrealizedGains on
Investment
Pension and OtherPostretirementBenefit Liability
Adjustment Total(Dollars in millions)
Balance at September 30, 2014 attributable to Cabot Corporation $ 27 $ 2 $ (93) $ (64)Other comprehensive income (loss) before reclassifications (270) — 7 (263)Amounts reclassified from accumulated other comprehensive income — — 24 24Net other comprehensive items (243) 2 (62) (303)Less: Noncontrolling interest (4) — — (4)Balance at September 30, 2015 attributable to Cabot Corporation (239) 2 (62) (299)Other comprehensive income (loss) before reclassifications 7 — (38) (31)Amounts reclassified from accumulated other comprehensive income — — — —Net other comprehensive items (232) 2 (100) (330)Less: Noncontrolling interest (5) — — (5)Balance at September 30, 2016 attributable to Cabot Corporation $ (227) $ 2 $ (100) $ (325)

78
The amounts reclassified out of Accumulated other comprehensive income (loss) and into the Statements of Operations forthe fiscal year ended September 30, 2016, 2015 and 2014 are as follows:
Affected Line Item in the Consolidated September 30Statements of Operations 2016 2015 2014
(Dollars in Millions)Pension and other postretirement benefit liability adjustmentAmortization of actuarial losses (gains) Net Periodic Benefit Cost - see
Note N for details $ 3 $ (1) $ 3Amortization of prior service (credit) cost Net Periodic Benefit Cost - see
Note N for details (3) 4 (3)Settlement costs Net Periodic Benefit Cost - see
Note N for details — 27 —Total before tax — 30 —Tax impact Provision for income taxes — (6) —Total after tax $ — $ 24 $ —

79
Note R. Earnings Per Share
The following tables summarize the components of the basic and diluted earnings per common share computations:
Years Ended September 302016 2015 2014
(In millions, except per share amounts)Basic EPS:
Net income (loss) attributable to Cabot Corporation $ 149 $ (334) $ 199Less: Dividends and dividend equivalents to participating securities — — 1Less: Undistributed earnings allocated to participating securities(1) 1 — 1Earnings (loss) allocated to common shareholders(numerator) $ 148 $ (334) $ 197Weighted average common shares and participating securities outstanding 62.9 63.9 65.0Less: Participating securities(1) 0.5 0.5 0.6Adjusted weighted average common shares (denominator) 62.4 63.4 64.4Per share amounts—basic:Income (loss) from continuing operations attributable to Cabot Corporation $ 2.36 $ (5.29) $ 3.04Income (loss) from discontinued operations 0.02 0.02 0.02Net income (loss) attributable to Cabot Corporation $ 2.38 $ (5.27) $ 3.06
Diluted EPS:Earnings (loss) allocated to common shareholders $ 148 $ (334) $ 197Plus: Earnings (loss) allocated to participating securities 1 — 1Less: Adjusted earnings allocated to participating securities(2) 1 — 1Earnings (loss) available to common shares (numerator) $ 148 $ (334) $ 197Adjusted weighted average common shares outstanding 62.4 63.4 64.4Effect of dilutive securities:Common shares issuable(3) 0.5 — 0.7Adjusted weighted average common shares (denominator) 62.9 63.4 65.1Per share amounts—diluted:Income (loss) from continuing operations attributable to Cabot Corporation $ 2.34 $ (5.29) $ 3.01Income (loss) from discontinued operations 0.02 0.02 0.02Net income (loss) attributable to Cabot Corporation $ 2.36 $ (5.27) $ 3.03
(1) Participating securities consist of unvested time-based restricted stock units.(2) Undistributed earnings (loss) are adjusted for the assumed distribution of dividends to the dilutive securities, which are
described in (3) below, and then reallocated to participating securities.(3) Represents incremental shares of common stock from the (i) assumed exercise of stock options issued under Cabot’s equity
incentive plans; (ii) assumed issuance of shares to employees pursuant to the Company’s Supplemental 401(k) Plan; and(iii) assumed issuance of shares for outstanding and achieved performance-based stock unit awards issued under Cabot’sequity incentive plans using the treasury stock method. For fiscal 2016, 2015 and 2014, respectively, 634,168, 897,056 and197,072 incremental shares of common stock were not included in the calculation of diluted earnings per share because theinclusion of these shares would have been antidilutive.

80
Undistributed earnings are the earnings which remain after dividends declared during the period are assumed to bedistributed to the common and participating shareholders. Undistributed earnings are allocated to common and participatingshareholders on the same basis as dividend distributions. The calculation of undistributed earnings is as follows:
Years Ended September 302016 2015 2014
(Dollars in millions)Calculation of undistributed earnings:
Net income (loss) attributable to Cabot Corporation $ 149 $ (334) $ 199Less: Dividends declared on common stock 65 56 54Less: Dividends and dividend equivalents to participating securities — — 1Undistributed earnings (loss) $ 84 $ (390) $ 144
Allocation of undistributed earnings:Undistributed earnings (loss) allocated to common shareholders $ 83 $ (390) $ 143Undistributed earnings allocated to participating securities 1 — 1Undistributed earnings (loss) $ 84 $ (390) $ 144
Note S. Income Taxes
Income from continuing operations before income taxes and equity in net earnings of affiliated companies was as follows:
Years ended September 302016 2015 2014
(Dollars in millions)Income from continuing operations:
Domestic $ (26) $ (439) $ 50Foreign 220 62 258
Total $ 194 $ (377) $ 308
Tax provision (benefit) for income taxes consisted of the following:
Years ended September 302016 2015 2014
(Dollars in millions)U.S. federal and state:
Current $ 7 $ (7) $ (4)Deferred (33) (74) (4)
Total (26) (81) (8)Foreign:
Current 62 48 86Deferred (2) (12) 14
Total 60 36 100Total U.S. and foreign $ 34 $ (45) $ 92

81
The provision (benefit) for income taxes differed from the provision for income taxes as calculated using the U.S. statutoryrate as follows:
Years ended September 302016 2015 2014
(Dollars in millions)Computed tax expense at the federal statutory rate $ 68 $ (132) $ 108Foreign income:
Impact of taxation at different rates, repatriation and other (37) (24) (29)Impact of increase (decrease) in valuation allowance ondeferred taxes 7 (7) 20Impact of foreign losses for which a current tax benefit is not available — 9 7Impact of non-deductible net currency losses 2 (1) —
U.S. and state benefits from research and experimentation activities (2) (2) —Tax settlements 1 (7) (7)Benefit from prior currency loss (3) — —Impact of goodwill impairment charge — 123 —Nontaxable gain on existing equity investment — — (10)Permanent differences, net — — 3State taxes, net of federal effect (2) (4) —
Total $ 34 $ (45) $ 92
Significant components of deferred income taxes were as follows:
September 302016 2015
(Dollars in millions)Deferred tax assets:
Deferred expenses $ 25 $ 38Intangible assets 45 32Inventory 13 9Other 4 3Pension and other benefits 83 72Net operating loss carry-forwards 144 145Foreign tax credit carry-forwards 63 42R&D credit carry-forwards 35 31Other business credit carry-forwards 41 40
Subtotal 453 412Valuation allowance (177) (161)
Total deferred tax assets $ 276 $ 251
September 302016 2015
(Dollars in millions)Deferred tax liabilities:
Property, plant and equipment $ (101) $ (116)Total deferred tax liabilities $ (101) $ (116)
In the fiscal 2016 tax provision, Cabot recorded less than $1 million of discrete tax charges composed of charges of $5 millionfor valuation allowances on beginning of the year tax balances partially offset by benefits of $3 million for a currency loss and $1million each for the renewal of the U.S. research and experimentation credit and net tax settlements.
In the fiscal 2015 tax benefit, Cabot recorded $13 million of discrete tax benefits including benefits of $7 million for taxsettlements, $4 million for repatriation, and $2 million for the renewal of the U.S. research and experimentation credit.

82
In the fiscal 2014 tax provision, Cabot recorded $17 million of net discrete tax charges including a $20 million charge for avaluation allowance on deferred tax assets in a foreign jurisdiction, a $2 million charge for return to provision adjustments, a $2million charge for interest on uncertain tax positions and a $4 million charge for miscellaneous tax items, offset by an $11 million nettax benefit for tax audit settlements.
Approximately $760 million of net operating loss carryforwards (“NOLs”) and $144 million of other tax credit carryforwardsremain at September 30, 2016. The benefits of these carryforwards are dependent upon taxable income during the carryforwardperiod in the jurisdictions in which they arose. Accordingly, a valuation allowance has been provided where management hasdetermined that it is more likely than not that the carryforwards will not be utilized. The following table provides detail surroundingthe expiration dates of these carryforwards:
NOLs Credits(Dollars in millions)
Expiration periods2017 to 2023 $ 350 $ 782024 and thereafter 134 45Indefinite carry-forwards 276 21
Total $ 760 $ 144
As of September 30, 2016, provisions have not been made for U.S. income taxes or non-U.S. withholding taxes onapproximately $1.6 billion of undistributed earnings of non-U.S. subsidiaries, as these earnings are considered indefinitelyreinvested. Cabot continually reviews the financial position and forecasted cash flows of its U.S. consolidated group and foreignsubsidiaries in order to reaffirm the Company’s intent and ability to continue to indefinitely reinvest earnings of its foreignsubsidiaries or whether such earnings will need to be repatriated in the foreseeable future. Such review encompasses operationalneeds and future capital investments. From time to time, however, the Company’s intentions relative to specific indefinitelyreinvested amounts change because of certain unique circumstances. These earnings could become subject to U.S. income taxes andnon-U.S. withholding taxes if they were remitted as dividends, were loaned to Cabot Corporation or a U.S. subsidiary, or if Cabotshould sell its stock in the subsidiaries with the reinvested earnings.
As of September 30, 2016, net deferred tax assets of $188 million are in the U.S. Management believes that the Company’shistory of generating domestic profits provides adequate evidence that it is more likely than not that all of the U.S. net deferred taxassets will be realized in the normal course of business. U.S. income from continuing operations adjusted for U.S. permanentdifferences and excluding the impairment of long-lived assets within the U.S. (see Note G) was a loss of $19 million for the yearended September 30, 2016 and was a cumulative profit of $120 million for the three years ended September 30, 2016 includingdividends from non-U.S. subsidiaries. Realization of deferred tax assets is dependent upon future taxable income generated over anextended period of time.
As of September 30, 2016, the Company needs to generate approximately $536 million in cumulative future U.S. taxableincome at various times over approximately 20 years to realize all of its net U.S. deferred tax assets. The Company reviews itsforecast in relation to actual results and expected trends on a quarterly basis. Failure to achieve operating income targets maychange the Company’s assessment regarding the realization of Cabot’s deferred tax assets and such change could result in avaluation allowance being recorded against some or all of the Company’s deferred tax assets. Any increase in a valuation allowancewould result in additional income tax expense, lower stockholders’ equity and could have a significant impact on Cabot’s earnings infuture periods.
The valuation allowances at September 30, 2016 and 2015 represent management’s best estimate of the non-realizableportion of the deferred tax assets. The valuation allowance increased by $16 million in 2016 related to certain future tax benefitsand net operating losses generated that are included in deferred tax assets. The valuation allowance decreased by $25 million in2015 primarily due to reductions in value of certain future tax benefits and net operating losses generated that are included indeferred tax assets.

83
Cabot has filed its tax returns in accordance with the tax laws in each jurisdiction and recognizes tax benefits for uncertain taxpositions when the position would more likely than not be sustained based on its technical merits and recognizes measurementadjustments when needed. As of September 30, 2016, the total amount of unrecognized tax benefits was $30 million, of which $18million was recorded in the Company’s Consolidated Balance Sheet and $12 million of deferred tax assets, principally related to statenet operating loss carry-forwards, have not been recorded. In addition, accruals of $1 million and $8 million have been recorded forpenalties and interest, respectively, as of September 30, 2016 and $1 million and $8 million, respectively, as of September 30, 2015.Total penalties and interest recorded in the tax provision in the Consolidated Statement of Operations was $2 million in fiscal 2016,$2 million in fiscal 2015, and $3 million in fiscal 2014. If the unrecognized tax benefits were recognized at a given point in time, therewould be approximately $26 million favorable impact on the Company’s tax provision before consideration of the impact of thepotential need for valuation allowances.
A reconciliation of the beginning and ending amount of unrecognized tax benefits for fiscal years 2016, 2015 and 2014 is asfollows:
Years ended September 302016 2015 2014
(Dollars in millions)Balance at beginning of the year $ 30 $ 41 $ 50
Additions based on tax provisions related to the current year 2 1 1Additions for tax positions of prior years 5 — —Reductions of tax provisions of prior years (3) (1) (1)Reductions related to settlements — (9) (5)Reductions from lapse of statute of limitations (4) (2) (4)
Balance at end of the year $ 30 $ 30 $ 41
Cabot and certain subsidiaries are under audit in a number of jurisdictions. In addition, certain statutes of limitations arescheduled to expire in the near future. It is reasonably possible that a further change in the unrecognized tax benefits may occurwithin the next twelve months related to the settlement of one or more of these audits or the lapse of applicable statutes oflimitations; however, an estimated range of the impact on the unrecognized tax benefits cannot be quantified at this time.
Cabot files U.S. federal and state and non-U.S. income tax returns in jurisdictions with varying statutes of limitations. The 2012through 2014 tax years generally remain subject to examination by the IRS and various tax years from 2005 through 2014 remainsubject to examination by the respective state tax authorities. In significant non-U.S. jurisdictions, various tax years from 2002through 2014 remain subject to examination by their respective tax authorities. As of September 30, 2016, Cabot’s significant non-U.S. jurisdictions include Canada, China, France, Germany, Italy, Japan, and the Netherlands.
Note T. Commitments and Contingencies
Operating Lease Commitments
Cabot leases certain transportation vehicles, warehouse facilities, office space, machinery and equipment under cancelableand non-cancelable operating leases, most of which expire within ten years and may be renewed by Cabot. Escalation clauses, leasepayments dependent on existing rates/indexes and other lease incentives are included in the minimum lease payments and suchlease payments are recognized on a straight-line basis over the minimum lease term. Rent expense under such arrangements forfiscal 2016, 2015 and 2014 totaled $31 million, $29 million and $26 million, respectively. Future minimum rental commitmentsunder non-cancelable leases are as follows:
(Dollars in millions)
2017 $ 212018 172019 132020 82021 72022 and thereafter 56
Total future minimum rental commitments $ 122

84
Other Long-Term Commitments
Cabot has entered into long-term purchase agreements primarily for the purchase of raw materials. Under certain of theseagreements, the quantity of material being purchased is fixed, but the price paid changes as market prices change. Raw materialspurchased under these agreements by segment for fiscal 2016, 2015 and 2014 are as follows:
Years Ended September 302016 2015 2014
(Dollars in millions)Reinforcement Materials $ 193 $ 276 $ 354Performance Chemicals 68 62 43Purification Solutions 7 14 32Other — — 3
Total $ 268 $ 352 $ 432
Included in the table above are raw materials purchases from noncontrolling shareholders of consolidated subsidiaries. Thesepurchases were $92 million, $169 million and $241 million during fiscal 2016, 2015 and 2014, respectively, and accounts payable andaccrued liabilities owed to noncontrolling shareholders as of September 30, 2016 and 2015, were $9 million and $8 million,respectively.
The purchase commitments for Reinforcement Materials, Performance Chemicals, and Purification Solutions covered by theseagreements are with various suppliers and purchases are expected to take place as follows:
Payments Due by Fiscal Year2017 2018 2019 2020 2021 Thereafter Total
(Dollars in millions)Reinforcement Materials $ 153 $ 137 $ 134 $ 101 $ 78 $ 1,151 $ 1,754Performance Chemicals 54 39 34 31 29 124 311Purification Solutions 10 6 4 4 — — 24Total $ 217 $ 182 $ 172 $ 136 $ 107 $ 1,275 $ 2,089
These commitments have been estimated using current market prices which may differ from the actual market prices at thetime of purchase.
Guarantee Agreements
Cabot has provided certain indemnities pursuant to which it may be required to make payments to an indemnified party inconnection with certain transactions and agreements. In connection with certain acquisitions and divestitures, Cabot has providedroutine indemnities with respect to such matters as environmental, tax, insurance, product and employee liabilities. In connectionwith various other agreements, including service and supply agreements with customers, Cabot has provided indemnities for certaincontingencies and routine warranties. Cabot is unable to estimate the maximum potential liability for these types of indemnities as amaximum obligation is not explicitly stated in most cases and the amounts, if any, are dependent upon the outcome of futurecontingent events, the nature and likelihood of which cannot be reasonably estimated. The duration of the indemnities vary, and inmany cases are indefinite. Cabot has not recorded any liability for these indemnities in the consolidated financial statements, exceptas otherwise disclosed.
Self-Insurance and Retention for Certain Contingencies
The Company is partially self-insured for certain third-party liabilities globally, as well as workers’ compensation and employeemedical benefits in the United States. The third-party and workers’ compensation liabilities are managed through a wholly-ownedinsurance captive and the related liabilities are included in the consolidated financial statements. The employee medical obligationsare managed by a third-party provider and the related liabilities are included in the consolidated financial statements. To limitCabot’s potential liabilities for these risks, however, the Company purchases insurance from third-parties that provides individualand aggregate stop-loss protection. The aggregate self-insured liability in fiscal 2016 for combined U.S. third-party liabilities and U.S.workers’ compensation was $6.9 million, and the retention for medical costs in the United States was a maximum of $225,000 perperson per annum. There was no aggregate self-insurance limitation outside of the U.S. for third party liabilities.

85
Contingencies
Cabot is a defendant, or potentially responsible party, in various lawsuits and environmental proceedings wherein substantialamounts are claimed or at issue.
Environmental Matters
As of September 30, 2016 and September 30, 2015, Cabot had $14 million and $16 million, respectively, reserved forenvironmental matters. These environmental matters mainly relate to closed sites. These reserves represent Cabot’s best estimatesof the probable costs to be incurred at those sites where costs are reasonably estimable based on the Company’s analysis of theextent of clean up required, alternative clean-up methods available, abilities of other responsible parties to contribute and itsinterpretation of laws and regulations applicable to each site. In fiscal 2016 and 2015, there was $2 million and $4 million inAccounts payable and accrued liabilities, respectively, in the Consolidated Balance Sheets for environmental matters. In both fiscal2016 and 2015, there was $12 million in Other liabilities in the Consolidated Balance Sheets for environmental matters. Cabotreviews the adequacy of the reserves as circumstances change at individual sites and adjusts the reserves as appropriate. Almost allof Cabot’s environmental issues relate to sites that are mature and have been investigated and studied and, in many cases, aresubject to agreed upon remediation plans. However, depending on the results of future testing, changes in risk assessmentpractices, remediation techniques and regulatory requirements, newly discovered conditions, and other factors, it is reasonablypossible that the Company could incur additional costs in excess of environmental reserves currently recorded. Managementestimates, based on the latest available information, that any such future environmental remediation costs that are reasonablypossible to be in excess of amounts already recorded would be immaterial to the Company’s consolidated financial statements.
Charges for environmental expense were less than $1 million, $1 million, and $15 million in fiscal 2016, 2015 and 2014,respectively, which are included in Cost of sales in the Consolidated Statements of Operations. Cash payments related to theseenvironmental matters were $2 million in fiscal 2016 and 2015, and $3 million in fiscal 2014.
The operation and maintenance component of the $14 million reserve for environmental matters was $6 million atSeptember 30, 2016. Cabot expects to make payments of $2 million in fiscal 2017, $3 million in each of fiscal 2018 and 2019, lessthan $1 million in fiscal 2020 and 2021, and a total of $4 million thereafter.
In November 2013, Cabot entered into a Consent Decree with the United States Environmental Protection Agency (“EPA”) andthe Louisiana Department of Environmental Quality (“LDEQ”) regarding Cabot’s three carbon black manufacturing facilities in theUnited States. This settlement is related to EPA’s national enforcement initiative focused on the U.S. carbon black manufacturingsector alleging non-compliance with certain regulatory and permitting requirements under The Clean Air Act, including the NewSource Review (“NSR”) construction permitting requirements. Pursuant to this settlement, Cabot paid a combined $975,000 civilpenalty to EPA and LDEQ, agreed to fund environmental mitigation projects in the three communities where the plants are locatedfor a total cost of approximately $450,000, two of which have been completed, and will install technology controls for reduction ofsulfur dioxide and nitrogen oxide emissions at certain of our carbon black plants in North America.
Other Matters
Respirator Liabilities
Cabot has exposure in connection with a safety respiratory products business that a subsidiary acquired from American OpticalCorporation (“AO”) in an April 1990 asset purchase transaction. The subsidiary manufactured respirators under the AO brand anddisposed of that business in July 1995. In connection with its acquisition of the business, the subsidiary agreed, in certaincircumstances, to assume a portion of AO’s liabilities, including costs of legal fees together with amounts paid in settlements andjudgments, allocable to AO respiratory products used prior to the 1990 purchase by the Cabot subsidiary. In exchange for thesubsidiary’s assumption of certain of AO’s respirator liabilities, AO agreed to provide to the subsidiary the benefits of: (i) AO’sinsurance coverage for the period prior to the 1990 acquisition and (ii) a former owner’s indemnity of AO holding it harmless fromany liability allocable to AO respiratory products used prior to May 1982.
Generally, these respirator liabilities involve claims for personal injury, including asbestosis, silicosis and coal worker’spneumoconiosis, allegedly resulting from the use of respirators that are alleged to have been negligently designed and/or labeled.Neither Cabot, nor its past or present subsidiaries, at any time manufactured asbestos or asbestos-containing products. At no timedid this respiratory product line represent a significant portion of the respirator market.
The subsidiary transferred the business to Aearo Corporation (“Aearo”) in July 1995. Cabot agreed to have the subsidiaryretain certain liabilities associated with exposure to asbestos and silica while using respirators prior to the 1995 transaction so longas Aearo paid, and continues to pay, Cabot an annual fee of $400,000. Aearo can discontinue payment of the fee at any time, inwhich case it will assume the responsibility for and indemnify Cabot against those liabilities which Cabot’s subsidiary had agreed toretain. The Company anticipates that it will continue to receive payment of the $400,000 fee from Aearo and thereby retain theseliabilities for the foreseeable future. Cabot has no liability in connection with any products manufactured by Aearo after 1995.

86
In addition to Cabot’s subsidiary and as described above, other parties are responsible for significant portions of the costs ofrespirator liabilities, leaving Cabot’s subsidiary with a portion of the liability in only some of the pending cases. These parties includeAearo, AO, AO’s insurers, another former owner and its insurers and a third-party manufacturer of respirators formerly sold underthe AO brand and its insurers (collectively, with the Company’s subsidiary, the “Payor Group”).
As of both September 30, 2016 and 2015, there were approximately 38,000 claimants in pending cases asserting claims againstAO in connection with respiratory products. Cabot has contributed to the Payor Group’s defense and settlement costs with respectto a percentage of pending claims depending on several factors, including the period of alleged product use. In order to quantifyCabot’s estimated share of liability for pending and future respirator liability claims, Cabot has engaged, through counsel, theassistance of Hamilton, Rabinovitz & Alschuler, Inc. (“HR&A”), a leading consulting firm in the field of tort liability valuation. Themethodology used by HR&A addresses the complexities surrounding Cabot’s potential liability by making assumptions about futureclaimants with respect to periods of asbestos, silica and coal mine dust exposure and respirator use. Using those and otherassumptions, HR&A estimates the number of future asbestos, silica and coal mine dust claims that will be filed and the related coststhat would be incurred in resolving both currently pending and future claims. On this basis, HR&A then estimates the value of theshare of these liabilities that reflect Cabot’s period of direct manufacture and Cabot’s contractual obligations. During the threemonths ended September 30, 2016, HR&A updated this estimate to reflect recent increases in certain defense and indemnity costs.Based on the HR&A estimates, as of September 30, 2016 and 2015, the Company had $21 million and $11 million, respectively,reserved for its estimated share of liability for pending and future respirator claims. The Company made payments related to itsrespirator liability of $3 million in fiscal 2016 and $2 million in each of fiscal 2015 and 2014.
The Company’s current estimate of the cost of its share of existing and future respirator liability claims is based on facts andcircumstances existing at this time. Developments that could affect the Company’s estimate include, but are not limited to,(i) significant changes in the number of future claims, (ii) changes in the rate of dismissals without payment of pending claims,(iii) significant changes in the average cost of resolving claims, (iv) significant changes in the legal costs of defending these claims,(v) changes in the nature of claims received, (vi) changes in the law and procedure applicable to these claims, (vii) the financialviability of members of the Payor Group, (viii) a change in the availability of the insurance coverage of the members of the PayorGroup or the indemnity provided by AO’s former owner, (ix) changes in the allocation of costs among the Payor Group and(x) a determination that the assumptions that were used to estimate the Company’s share of liability are no longer reasonable. TheCompany cannot determine the impact of these potential developments on its current estimate of its share of liability for existingand future claims. Accordingly, the actual amount of these liabilities for existing and future claims could be different than thereserved amount.
Other
The Company has various other lawsuits, claims and contingent liabilities arising in the ordinary course of its business and withrespect to the Company’s divested businesses. In the opinion of the Company, although final disposition of some or all of theseother suits and claims may impact the Company’s consolidated financial statements in a particular period, they are not expected, inthe aggregate, to have a material adverse effect on the Company’s consolidated financial statements.
Note U. Financial Information by Segment & Geographic Area
Segment Information
The Company identifies a business as an operating segment if: i) it engages in business activities from which it may earnrevenues and incur expenses; ii) its operating results are regularly reviewed by the Chief Operating Decision Maker (“CODM”), whois Cabot’s President and Chief Executive Officer, to make decisions about resources to be allocated to the segment and assess itsperformance; and iii) it has available discrete financial information. The Company has determined that all of its businesses areoperating segments. The CODM reviews financial information at the operating segment level to allocate resources and to assess theoperating results and financial performance for each operating segment. Operating segments are aggregated into a reportablesegment if the operating segments are determined to have similar economic characteristics and if the operating segments aresimilar in the following areas: i) nature of products and services; ii) nature of production processes; iii) type or class of customer fortheir products and services; iv) methods used to distribute the products or provide services; and v) if applicable, the nature of theregulatory environment.
The Reinforcement Materials segment combines the rubber blacks and elastomer composites product lines.
The Performance Chemicals segment combines the specialty carbons and compounds and inkjet colorants product lines intothe Specialty Carbons and Formulations business, and combines the fumed metal oxides and aerogel product lines into the MetalOxides business. These businesses are similar in terms of economic characteristics, nature of products, processes, customer classand product distribution methods, and therefore have been aggregated into one reportable segment.

87
The Purification Solutions segment represents the Company’s activated carbon business and the Specialty Fluids segmentconsists of the Company’s cesium formate oil and gas drilling fluids and high-purity fine cesium chemicals product lines.
Reportable segment operating profit (loss) before interest and taxes (“Segment EBIT”) is presented for each reportablesegment in the financial information by the reportable segment table below on the line entitled Income (loss) from continuingoperations before taxes. Segment EBIT excludes certain items, meaning items management does not consider representative ofsegment results. In addition, Segment EBIT includes Equity in earnings of affiliated companies, net of tax, the full operating results ofa contractual joint venture in Purification Solutions, royalties, Net income attributable to noncontrolling interests, net of tax, anddiscounting charges for certain Notes receivable, but excludes Interest expense, foreign currency transaction gains and losses,interest income, dividend income, unearned revenue, the effects of LIFO accounting for inventory, general unallocated expense andunallocated corporate costs. Segment assets exclude cash, short-term investments, cost investments, income taxes receivable,deferred taxes and headquarters’ assets, which are included in unallocated and other. Expenditures for additions to long-lived assetsinclude total equity and other investments (including available-for-sale securities) and property, plant and equipment.
Reinforcement Materials
Carbon black is a form of elemental carbon that is manufactured in a highly controlled process to produce particles andaggregates of varied structure and surface chemistry, resulting in many different performance characteristics for a wide variety ofapplications. Rubber grade carbon blacks are used to enhance the physical properties of the systems and applications in which theyare incorporated.
The Company’s rubber blacks products are used in tires and industrial products. Rubber blacks have traditionally been used inthe tire industry as a rubber reinforcing agent to increase tread durability and are also used as a performance additive to reducerolling resistance and improve traction. In industrial products such as hoses, belts, extruded profiles and molded goods, rubberblacks are used to improve the physical performance of the product, including the product’s physical strength, fluid resistance,conductivity and resistivity.
In addition to its rubber blacks products, the Company manufactures compounds of carbon black and rubber using itspatented elastomer composites manufacturing process. These compounds improve abrasion/wear resistance, reduce fatigue andreduce rolling resistance compared to carbon black/rubber compounds made by conventional dry mix methods.
Performance Chemicals
Performance Chemicals is composed of two businesses: (i) the Company’s Specialty Carbons and Formulations business, whichmanufactures and sells specialty grades of carbon black, specialty compounds and inkjet colorants, and (ii) its Metal Oxides business,which manufactures and sells fumed silica, fumed alumina and dispersions thereof and aerogel. In Performance Chemicals, theCompany designs, manufactures and sells materials that deliver performance in a broad range of customer applications across theautomotive, construction and infrastructure, energy, inkjet printing, electronics, and consumer products sectors. The net sales fromeach of these businesses for fiscal 2016, 2015 and 2014 are as follows:
Years Ended September 302016 2015 2014
(Dollars in millions)Specialty Carbons and Formulations $ 578 $ 630 $ 709Metal Oxides 287 297 313
Total Performance Chemicals $ 865 $ 927 $ 1,022
Specialty Carbons and Formulations Business
Carbon black is a form of elemental carbon that is manufactured in a highly controlled process to produce particles andaggregates of varied structure and surface chemistry, resulting in many different performance characteristics for a wide variety ofapplications.
The Company’s specialty grades of carbon black are used to impart color, provide rheology control, enhance conductivity andstatic charge control, provide UV protection, enhance mechanical properties, and provide formulation flexibility through surfacetreatment. These specialty carbon products are used in a wide variety of applications, such as inks, coatings, cables, plastics,adhesives, toners, batteries and displays.

88
Cabot’s masterbatch and conductive compound products, which Cabot refers to as “specialty compounds”, are formulationsderived from specialty grades of carbon black mixed with polymers and other additives. These products are generally used by plasticresin producers and converters in applications for the automotive, industrial, packaging, consumer products, and electronicsindustries. As an alternative to directly mixing specialty carbon blacks, these formulations offer greater ease of handling and helpcustomers achieve their desired levels of dispersion and color and manage the addition of small doses of additives. In addition,Cabot’s electrically conductive compound products generally are used to reduce risks associated with electrostatic discharge inplastics applications.
The Company’s inkjet colorants are high-quality pigment-based black and color dispersions based on its patented carbon blacksurface modification technology. The dispersions are used in aqueous inkjet inks to impart color, sharp print characteristics anddurability, while maintaining high printhead reliability. These products are used in various inkjet printing applications, includingcommercial printing, small office/home office and corporate office, and niche applications that require a high level of dispersibilityand colloidal stability. Cabot’s inkjet inks, which utilize its pigment-based colorant dispersions, are used in the commercial printingsegment for digital print.
Metal Oxides Business
Fumed silica is an ultra-fine, high-purity particle used as a reinforcing, thickening, abrasive, thixotropic, suspending or anti-caking agent in a wide variety of products for the automotive, construction, microelectronics, batteries, and consumer productsindustries. These products include adhesives, sealants, cosmetics, inks, toners, silicone rubber, coatings, polishing slurries andpharmaceuticals. Fumed alumina, also an ultra-fine, high-purity particle, is used as an abrasive, absorbent or barrier agent in avariety of products, such as inkjet media, lighting, coatings, cosmetics and polishing slurries.
Aerogel is a hydrophobic, silica-based particle with a high surface area that is used in a variety of thermal insulation andspecialty chemical applications. In the building and construction industry, the product is used in insulative sprayable plasters andcomposite building products, as well as translucent skylight, window, wall and roof systems for insulating eco-daylightingapplications. In the specialty chemicals industry, the product is used to provide matte finishing, insulating and thickening propertiesfor use in a variety of applications.
Purification Solutions
The Company’s activated carbon products are used for the purification of water, air, food and beverages, pharmaceuticals andother liquids and gases, as either a colorant or a decolorizing agent in the production of products for food and beverage applicationsand as a chemical carrier in slow release applications. In gas and air applications, one of the uses of activated carbon is for theremoval of mercury in flue gas streams. In certain applications, used activated carbon can be reactivated for further use by removingthe contaminants from the pores of the activated carbon product. The most common applications for the Company’s reactivatedcarbon are water treatment and food and beverage purification. In addition to activated carbon production and reactivation, theCompany also provides activated carbon solutions through on-site equipment and services, including delivery systems for activatedcarbon injection in coal-fired utilities, mobile water filter units and carbon reactivation services.
Specialty Fluids
The Specialty Fluids segment principally produces and markets cesium formate as a drilling and completion fluid for useprimarily in high pressure and high temperature oil and gas well construction. Cesium formate products are solids-free, high-densityfluids that have a low viscosity, enabling safe and efficient well construction and workover operations. The fluid is resistant to hightemperatures, minimizes damage to producing reservoirs and is readily biodegradable in accordance with testing guidelines set bythe Organization for Economic Cooperation and Development. The business also manufactures and sells fine cesium chemicals thatare used in a wide range of applications, including catalysts and brazing fluxes.

89
Financial information by reportable segment is as follows:
ReinforcementMaterials
PerformanceChemicals
PurificationSolutions
SpecialtyFluids
SegmentTotal
Unallocatedand
Other(1), (3)Consolidated
Total(Dollars in millions)
Years Ended September 302016Revenues from external customers(2) $ 1,108 $ 865 $ 290 $ 47 $ 2,310 $ 101 $ 2,411Depreciation and amortization 74 48 39 3 164 (3) 161Equity in earnings of affiliated companies — 1 7 — 8 (5) 3Income (loss) from continuing operations before taxes(3) 137 225 (5) 13 370 (176) 194Assets(4) 1,093 629 736 139 2,597 447 3,044Total expenditures for additions to long-lived assets(5) 46 33 30 1 110 2 1122015Revenues from external customers(2) $ 1,507 $ 927 $ 296 $ 42 $ 2,772 $ 99 $ 2,871Depreciation and amortization 83 54 45 2 184 (1) 183Equity in earnings of affiliated companies 2 1 6 — 9 (5) 4Income (loss) from continuing operations before taxes(3) 143 178 5 6 332 (709) (377)Assets(4) 1,220 625 789 119 2,753 322 3,075Total expenditures for additions to long-lived assets(5) 44 29 48 16 137 4 1412014Revenues from external customers(2) 2,108 1,022 315 98 3,543 104 3,647Depreciation and amortization 88 56 54 3 201 — 201Equity in earnings of affiliated companies (3) 1 6 — 4 (4) —Income (loss) from continuing operations before taxes(3) 259 168 (19) 39 447 (139) 308Assets(4) 1,632 731 1,389 115 3,867 217 4,084Total expenditures for additions to long-lived assets(5) 65 29 64 7 165 6 171(1) Unallocated and Other includes certain items and eliminations necessary to reflect management’s reporting of operating
segment results. These items are reflective of the segment reporting presented to the CODM.(2) Revenue from external customers that are categorized as Unallocated and Other reflects royalties, other operating revenues,
external shipping and handling fees, the impact of unearned revenue, the removal of 100% of the sales of an equity methodaffiliate and discounting charges for certain Notes receivable. Details are provided in the table below.
Years Ended September 302016 2015 2014
(Dollars in millions)Royalties, other operating revenues, the impact of unearned revenue, the removal of 100% of the sales of an equity method affiliate and discounting charges for certain Notes receivable $ 13 $ 9 $ (7)Shipping and handling fees 88 90 111
Total $ 101 $ 99 $ 104
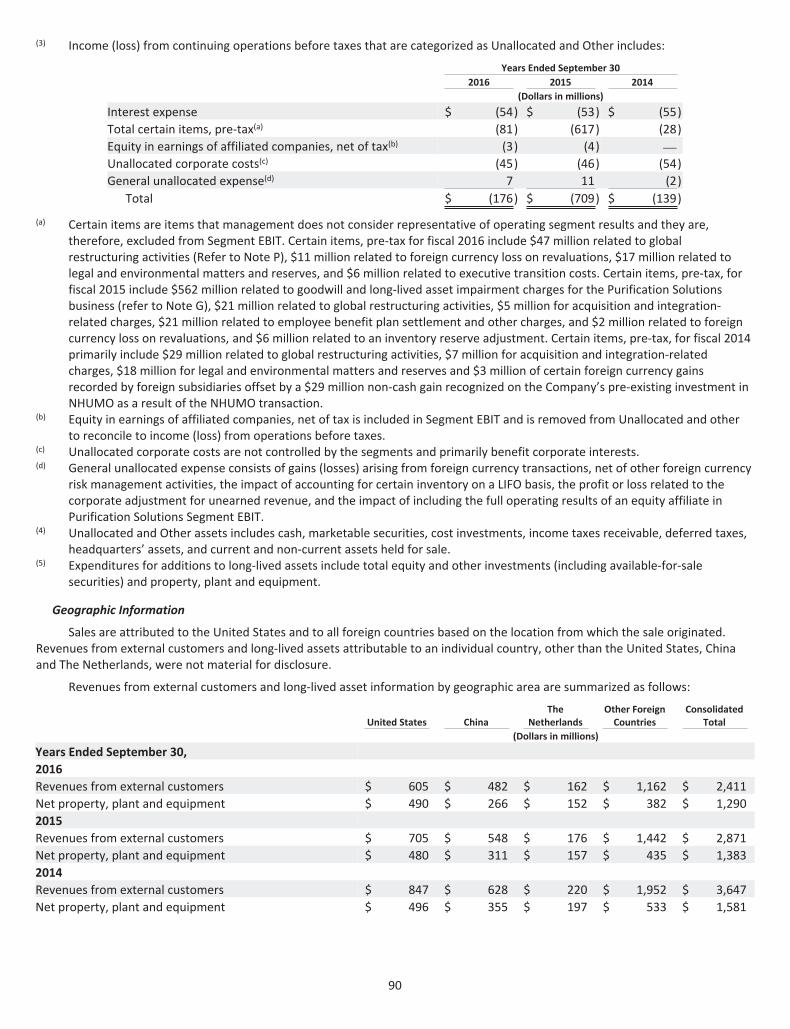
90
(3) Income (loss) from continuing operations before taxes that are categorized as Unallocated and Other includes:
Years Ended September 302016 2015 2014
(Dollars in millions)Interest expense $ (54) $ (53) $ (55)Total certain items, pre-tax(a) (81) (617) (28)Equity in earnings of affiliated companies, net of tax(b) (3) (4) —Unallocated corporate costs(c) (45) (46) (54)General unallocated expense(d) 7 11 (2)
Total $ (176) $ (709) $ (139)
(a) Certain items are items that management does not consider representative of operating segment results and they are,therefore, excluded from Segment EBIT. Certain items, pre-tax for fiscal 2016 include $47 million related to globalrestructuring activities (Refer to Note P), $11 million related to foreign currency loss on revaluations, $17 million related tolegal and environmental matters and reserves, and $6 million related to executive transition costs. Certain items, pre-tax, forfiscal 2015 include $562 million related to goodwill and long-lived asset impairment charges for the Purification Solutionsbusiness (refer to Note G), $21 million related to global restructuring activities, $5 million for acquisition and integration-related charges, $21 million related to employee benefit plan settlement and other charges, and $2 million related to foreigncurrency loss on revaluations, and $6 million related to an inventory reserve adjustment. Certain items, pre-tax, for fiscal 2014primarily include $29 million related to global restructuring activities, $7 million for acquisition and integration-relatedcharges, $18 million for legal and environmental matters and reserves and $3 million of certain foreign currency gainsrecorded by foreign subsidiaries offset by a $29 million non-cash gain recognized on the Company’s pre-existing investment inNHUMO as a result of the NHUMO transaction.
(b) Equity in earnings of affiliated companies, net of tax is included in Segment EBIT and is removed from Unallocated and otherto reconcile to income (loss) from operations before taxes.
(c) Unallocated corporate costs are not controlled by the segments and primarily benefit corporate interests.(d) General unallocated expense consists of gains (losses) arising from foreign currency transactions, net of other foreign currency
risk management activities, the impact of accounting for certain inventory on a LIFO basis, the profit or loss related to thecorporate adjustment for unearned revenue, and the impact of including the full operating results of an equity affiliate inPurification Solutions Segment EBIT.
(4) Unallocated and Other assets includes cash, marketable securities, cost investments, income taxes receivable, deferred taxes,headquarters’ assets, and current and non-current assets held for sale.
(5) Expenditures for additions to long-lived assets include total equity and other investments (including available-for-salesecurities) and property, plant and equipment.
Geographic Information
Sales are attributed to the United States and to all foreign countries based on the location from which the sale originated.Revenues from external customers and long-lived assets attributable to an individual country, other than the United States, Chinaand The Netherlands, were not material for disclosure.
Revenues from external customers and long-lived asset information by geographic area are summarized as follows:
United States ChinaThe
NetherlandsOther Foreign
CountriesConsolidated
Total(Dollars in millions)
Years Ended September 30,2016Revenues from external customers $ 605 $ 482 $ 162 $ 1,162 $ 2,411Net property, plant and equipment $ 490 $ 266 $ 152 $ 382 $ 1,2902015Revenues from external customers $ 705 $ 548 $ 176 $ 1,442 $ 2,871Net property, plant and equipment $ 480 $ 311 $ 157 $ 435 $ 1,3832014Revenues from external customers $ 847 $ 628 $ 220 $ 1,952 $ 3,647Net property, plant and equipment $ 496 $ 355 $ 197 $ 533 $ 1,581

91
Note V. Unaudited Quarterly Financial Information
Unaudited financial results by quarter for fiscal 2016 and 2015 are summarized below:
Quarter EndedDecember March June September Year
(Dollars in millions, except per share amounts)Fiscal 2016Net sales and other operating revenues $ 603 $ 568 $ 621 $ 619 $ 2,411Gross profit 99 150 160 169 578Income from discontinued operations, net of tax — — — 1 1Net income (loss) (3) 52 60 55 164Net income (loss) attributable to Cabot Corporation (7) 48 56 52 149Income per share—basic:
Income (loss) from continuing operations $ (0.11) $ 0.76 $ 0.90 $ 0.81 $ 2.36Income from discontinued operations — — — 0.02 0.02
Net income (loss) attributable to Cabot Corporation $ (0.11) $ 0.76 $ 0.90 $ 0.83 $ 2.38Income per share—diluted:
Income (loss) from continuing operations $ (0.11) $ 0.76 $ 0.88 $ 0.81 $ 2.34Income (loss) from discontinued operations — — — 0.02 0.02
Net income (loss) attributable to Cabot Corporation $ (0.11) $ 0.76 $ 0.88 $ 0.83 $ 2.36
Quarter EndedDecember March June September Year
(Dollars in millions, except per share amounts)Fiscal 2015Net sales and other operating revenues $ 812 $ 694 $ 694 $ 671 $ 2,871Gross profit 157 139 150 139 585Purification Solutions long-lived assets impairment charge — — 209 1 210Purification Solutions goodwill impairment charge — — 353 (1) 352Income from discontinued operations, net of tax — — 1 1 2Net income (loss) 49 27 (443) 41 (326)Net income (loss) attributable to Cabot Corporation 45 26 (445) 40 (334)Income per share—basic:
Income (loss) from continuing operations $ 0.70 $ 0.41 $ (7.05) $ 0.63 $ (5.29)Income from discontinued operations — — 0.01 0.01 0.02
Net income (loss) attributable to Cabot Corporation $ 0.70 $ 0.41 $ (7.04) $ 0.64 $ (5.27)Income per share—diluted:
Income (loss) from continuing operations $ 0.69 $ 0.41 $ (7.05) $ 0.62 $ (5.29)Income (loss) from discontinued operations — — 0.01 0.01 0.02
Net income (loss) attributable to Cabot Corporation $ 0.69 $ 0.41 $ (7.04) $ 0.63 $ (5.27)

92
REPORT OF INDEPENDENT REGISTERED PUBLIC ACCOUNTING FIRM
To the Board of Directors and Stockholders of Cabot CorporationBoston, Massachusetts
We have audited the accompanying consolidated balance sheets of Cabot Corporation and subsidiaries (the “Company”) as ofSeptember 30, 2016 and 2015, and the related consolidated statements of operations, comprehensive income, changes instockholders’ equity and cash flows for each of the three years in the period ended September 30, 2016. These consolidatedfinancial statements are the responsibility of the Company’s management. Our responsibility is to express an opinion on thesefinancial statements based on our audits.
We conducted our audits in accordance with the standards of the Public Company Accounting Oversight Board (UnitedStates). Those standards require that we plan and perform the audit to obtain reasonable assurance about whether the financialstatements are free of material misstatement. An audit includes examining, on a test basis, evidence supporting the amounts anddisclosures in the financial statements. An audit also includes assessing the accounting principles used and significant estimatesmade by management, as well as evaluating the overall financial statement presentation. We believe that our audits provide areasonable basis for our opinion.
In our opinion, such consolidated financial statements present fairly, in all material respects, the financial position of CabotCorporation and subsidiaries as of September 30, 2016 and 2015, and the results of their operations and their cash flows for each ofthe three years in the period ended September 30, 2016, in conformity with accounting principles generally accepted in the UnitedStates of America.
We have also audited, in accordance with the standards of the Public Company Accounting Oversight Board (United States),the Company’s internal control over financial reporting as of September 30, 2016, based on the criteria established in InternalControl—Integrated Framework (2013) issued by the Committee of Sponsoring Organizations of the Treadway Commission and ourreport dated November 23, 2016 expressed an unqualified opinion on the Company’s internal control over financial reporting.
/s/ Deloitte & Touche LLP
Boston, MassachusettsNovember 23, 2016

93
REPORT OF INDEPENDENT REGISTERED PUBLIC ACCOUNTING FIRM
To the Board of Directors and Stockholders of Cabot CorporationBoston, Massachusetts
We have audited the internal control over financial reporting of Cabot Corporation and subsidiaries (the “Company”) as ofSeptember 30, 2016, based on criteria established in Internal Control—Integrated Framework (2013) issued by the Committee ofSponsoring Organizations of the Treadway Commission. The Company’s management is responsible for maintaining effectiveinternal control over financial reporting and for its assessment of the effectiveness of internal control over financial reporting,included in the accompanying Management’s Annual Report on Internal Control over Financial Reporting. Our responsibility is toexpress an opinion on the Company’s internal control over financial reporting based on our audit.
We conducted our audit in accordance with the standards of the Public Company Accounting Oversight Board (UnitedStates). Those standards require that we plan and perform the audit to obtain reasonable assurance about whether effectiveinternal control over financial reporting was maintained in all material respects. Our audit included obtaining an understanding ofinternal control over financial reporting, assessing the risk that a material weakness exists, testing and evaluating the design andoperating effectiveness of internal control based on the assessed risk, and performing such other procedures as we considerednecessary in the circumstances. We believe that our audit provides a reasonable basis for our opinion.
A company’s internal control over financial reporting is a process designed by, or under the supervision of, the company’sprincipal executive and principal financial officers, or persons performing similar functions, and effected by the company’s board ofdirectors, management, and other personnel to provide reasonable assurance regarding the reliability of financial reporting and thepreparation of financial statements for external purposes in accordance with generally accepted accounting principles. A company’sinternal control over financial reporting includes those policies and procedures that (1) pertain to the maintenance of records that,in reasonable detail, accurately and fairly reflect the transactions and dispositions of the assets of the company; (2) providereasonable assurance that transactions are recorded as necessary to permit preparation of financial statements in accordance withgenerally accepted accounting principles, and that receipts and expenditures of the company are being made only in accordancewith authorizations of management and directors of the company; and (3) provide reasonable assurance regarding prevention ortimely detection of unauthorized acquisition, use, or disposition of the company’s assets that could have a material effect on thefinancial statements.
Because of the inherent limitations of internal control over financial reporting, including the possibility of collusion orimproper management override of controls, material misstatements due to error or fraud may not be prevented or detected on atimely basis. Also, projections of any evaluation of the effectiveness of the internal control over financial reporting to future periodsare subject to the risk that the controls may become inadequate because of changes in conditions, or that the degree of compliancewith the policies or procedures may deteriorate.
In our opinion, the Company maintained, in all material respects, effective internal control over financial reporting as ofSeptember 30, 2016, based on the criteria established in Internal Control—Integrated Framework (2013) issued by the Committee ofSponsoring Organizations of the Treadway Commission.
We have also audited, in accordance with the standards of the Public Company Accounting Oversight Board (United States),the consolidated financial statements as of and for the year ended September 30, 2016 of the Company and our report datedNovember 23, 2016 expressed an unqualified opinion on those financial statements.
/s/ Deloitte & Touche LLP
Boston, MassachusettsNovember 23, 2016

94
PART II
Item 9. Changes in and Disagreements with Accountants on Accounting and Financial Disclosure
None.
Item 9A. Controls and Procedures
Disclosure Controls and Procedures
Cabot carried out an evaluation, under the supervision and with the participation of its management, including the Company’sPresident and Chief Executive Officer and its Executive Vice President and Chief Financial Officer, of the effectiveness of theCompany’s disclosure controls and procedures pursuant to Rule 13a-15 under the Securities Exchange Act of 1934, as amended (the“Exchange Act”), as of September 30, 2016. Based on that evaluation, Cabot’s President and Chief Executive Officer and its ExecutiveVice President and Chief Financial Officer concluded that the Company’s disclosure controls and procedures are effective withrespect to the recording, processing, summarizing and reporting, within the time periods specified in the Securities and ExchangeCommission’s rules and forms, of information required to be disclosed by the Company in the reports that it files or submits underthe Exchange Act and such information is accumulated and communicated to management to allow timely decisions regardingrequired disclosure.
Management’s Annual Report on Internal Control Over Financial Reporting
Cabot’s management is responsible for establishing and maintaining adequate internal control over financial reporting forCabot. Internal control over financial reporting is defined in Rules 13a-15(f) and 15d-15(f) under the Exchange Act as a processdesigned by, or under the supervision of, a company’s principal executive and principal financial officers, and effected by thecompany’s board of directors, management and other personnel, to provide reasonable assurance regarding the reliability offinancial reporting and the preparation of financial statements for external purposes in accordance with generally acceptedaccounting principles and includes those policies and procedures that:
• Pertain to the maintenance of records that in reasonable detail accurately and fairly reflect the transactions anddispositions of the assets of the company;
• Provide reasonable assurance that transactions are recorded as necessary to permit preparation of financial statementsin accordance with generally accepted accounting principles, and that receipts and expenditures of the company arebeing made only in accordance with authorizations of management and directors of the company; and
• Provide reasonable assurance regarding prevention or timely detection of unauthorized acquisition, use or disposition ofthe company’s assets that could have a material effect on the financial statements.
Because of its inherent limitations, internal control over financial reporting may not prevent or detect misstatements. Also,projections of any evaluation of the effectiveness to future periods are subject to the risk that controls may become inadequatebecause of changes in conditions, or that the degree of compliance with policies or procedures may deteriorate.
Cabot’s management assessed the effectiveness of Cabot’s internal control over financial reporting as of September 30, 2016based on the framework established in Internal Control—Integrated Framework (2013) issued by the Committee of SponsoringOrganizations of the Treadway Commission (COSO). Based on this assessment, Cabot’s management concluded that Cabot’s internalcontrol over financial reporting was effective as of September 30, 2016.
Cabot’s internal control over financial reporting as of September 30, 2016 has been audited by Deloitte & Touche LLP, anindependent registered public accounting firm, as stated in their report above.
Changes in Internal Control Over Financial Reporting
There were no changes in the Company’s internal control over financial reporting that occurred during the Company’s fiscalquarter ending September 30, 2016 that have materially affected, or are reasonably likely to materially affect, the Company’sinternal control over financial reporting.
Item 9B. Other Information
None.

95
PART III
Item 10. Directors, Executive Officers and Corporate Governance
Certain information regarding our executive officers is included at the end of Part I of this annual report under the heading“Executive Officers of the Registrant.”
Cabot has adopted a Code of Business Ethics that applies to all of the Company’s employees and directors, including the ChiefExecutive Officer, the Chief Financial Officer, the Controller and other senior financial officers. The Code of Business Ethics is postedon our website, www.cabotcorp.com (under the “About Cabot” caption under “Company”). We intend to satisfy the disclosurerequirement regarding any amendment to, or waiver of, a provision of the Code of Business Ethics applicable to the Chief ExecutiveOfficer, the Chief Financial Officer, the Controller or other senior financial officers by posting such information on our website.
The other information required by this item will be included in our Proxy Statement for the 2017 Annual Meeting ofStockholders (“Proxy Statement”) and is herein incorporated by reference.
Item 11. Executive Compensation
The information required by this item will be included in our Proxy Statement and is incorporated herein by reference.
Item 12. Security Ownership of Certain Beneficial Owners and Management and Related Stockholder Matters
The information required by this item will be included in our Proxy Statement and is incorporated herein by reference.
Item 13. Certain Relationships and Related Transactions, and Director Independence
The information required by this item will be included in our Proxy Statement and is incorporated herein by reference.
Item 14. Principal Accounting Fees and Services
The information required by this item will be included in our Proxy Statement and is incorporated herein by reference.

96
PART IV
Item 15. Exhibits, Financial Statement Schedules
(a) Financial Statements. See “Index to Financial Statements” under Item 8 on page 43 of this Form 10-K.
(b) Exhibits. (Certain exhibits not included in copies of the Form 10-K sent to stockholders.)
The exhibit numbers in the following list correspond to the numbers assigned to such exhibits in the Exhibit Table of Item 601of Regulation S-K. Cabot will furnish to any stockholder, upon written request, any exhibit listed below, upon payment by suchstockholder of the Company’s reasonable expenses in furnishing such exhibit.
ExhibitNumber Description
3(a) Restated Certificate of Incorporation of Cabot Corporation effective January 9, 2009 (incorporated herein byreference to Exhibit 3.1 of Cabot’s Quarterly Report on Form 10-Q for the quarterly period ended December 31, 2008,file reference 1-5667, filed with the SEC on February 9, 2009).
3(b) The By-laws of Cabot Corporation as amended January 8, 2016 (incorporated herein by reference to Exhibit 3.1 ofCabot’s Corporation’s Quarterly Report on Form 10-Q for the quarterly period ended December 31, 2015, filereference 1-5667, filed with the SEC on February 5, 2016).
4(a)(i) Indenture, dated as of December 1, 1987, between Cabot Corporation and The First National Bank of Boston, Trustee(the “Indenture”) (incorporated herein by reference to Exhibit 4 of Amendment No. 1 to Cabot’s RegistrationStatement on Form S-3, Registration Statement No. 33-18883, filed with the SEC on December 10, 1987).
4(a)(ii) First Supplemental Indenture, dated as of June 17, 1992, to the Indenture (incorporated herein by reference to Exhibit4.3 of Cabot’s Registration Statement on Form S-3, Registration Statement No. 33-48686, filed with the SEC on June18, 1992).
4(a)(iii) Second Supplemental Indenture, dated as of January 31, 1997, between Cabot Corporation and State Street Bank andTrust Company, Trustee (incorporated herein by reference to Exhibit 4 of Cabot’s Quarterly Report on Form 10-Q forthe quarterly period ended December 31, 1996, file reference 1-5667, filed with the SEC on February 14, 1997).
4(a)(iv) Third Supplemental Indenture, dated as of November 20, 1998, between Cabot Corporation and State Street Bankand Trust Company, Trustee (incorporated herein by reference to Exhibit 4.1 of Cabot’s Current Report on Form 8-K,dated November 20, 1998, file reference 1-5667, filed with the SEC on November 20, 1998).
4(a)(v) Indenture, dated as of September 21, 2009, between Cabot Corporation and U.S. Bank National Association, asTrustee (incorporated herein by reference to Exhibit 4.1 of Cabot’s Registration Statement on Form S-3 ASR,Registration Statement No. 333-162021, filed with the SEC on September 21, 2009).
4(a)(vi) Second Supplemental Indenture, dated as of July 12, 2012 between Cabot Corporation, as Issuer, and U.S. BankNational Association, as Trustee, including the form of Global Note attached as Annex A thereto, supplementing theIndenture dated as of September 21, 2009 (incorporated herein by reference to Exhibit 4.1 of Cabot’s Current Reporton Form 8-K dated July 9, 2012, file reference 1-5667, filed with the SEC on July 12, 2012).
4(a)(vii) Indenture, dated as of September 15, 2016, between Cabot Corporation and U.S. Bank National Association, asTrustee (incorporated herein by reference to Exhibit 4.1 of Cabot Corporation’s Current Report on Form 8-K datedSeptember 15, 2016, file reference 1-5667, filed with the SEC on September 15, 2016).
4(a)(viii) First Supplemental Indenture, dated as of September 15, 2016, between Cabot Corporation and U.S. Bank NationalAssociation, as Trustee, including the form of Global Note attached as Annex A thereto, supplementing the Indenturedated as of September 15, 2016 (incorporated herein by reference to Exhibit 4.2 of Cabot Corporation’s CurrentReport on Form 8-K dated September 15, 2016, file reference 1-5667, filed with the SEC on September 15, 2016).
10(a) Credit Agreement, dated October 23, 2015, among Cabot Corporation, JPMorgan Chase Bank, N.A., J.P. MorganSecurities LLC, Citigroup Global Markets Inc., Citibank, N.A., Bank of America, N.A., Mizuho Bank, Ltd., TD Bank, N.A.,and Wells Fargo Bank, National Association, and the other lenders party thereto (incorporated herein by reference toExhibit 10(a) of Cabot’s Annual Report on Form 10-K for its fiscal year ended September 30, 2015, file reference 1-5667, filed with the SEC on November 25, 2015).
10(b)(i)* 2009 Long-Term Incentive Plan (incorporated herein by reference to Appendix B of Cabot’s Proxy Statement onSchedule 14A relating to the 2012 Annual Meeting of Stockholders, file reference 1-5667, filed with the SEC onJanuary 30, 2012).

97
ExhibitNumber Description
10(b)(ii)* 2015 Directors’ Stock Compensation Plan (incorporated herein by reference to Appendix B of Cabot’s Proxy Statementon Schedule 14A relating to the 2015 Annual Meeting of Stockholders, file reference 1-5667, filed with the SEC onJanuary 28, 2015).
10(b)(iii)* Cabot Corporation Short-Term Incentive Compensation Plan (incorporated herein by reference to Appendix B of CabotCorporation’s Proxy Statement on Schedule 14A relating to the 2016 Annual Meeting of Stockholders, file reference 1-5667, filed with the SEC on January 28, 2016).
10(c)* Summary of Compensation for Non-Employee Directors (incorporated herein by reference to Exhibit 10(c) of Cabot’sAnnual Report on Form 10-K for its fiscal year ended September 30, 2015, file reference 1-5667, filed with the SEC onNovember 25, 2015).
10(d)* Cabot Corporation Amended and Restated Senior Management Severance Protection Plan, dated March 9, 2012(incorporated herein by reference to Exhibit 10.5 of Cabot’s Quarterly Report on Form 10-Q for the quarterly periodended March 31, 2012, file reference 1-5667, filed with the SEC on May 7, 2012).
10(e)* Form of Performance-Based Stock Unit Award Certificate under the Cabot Corporation 2009 Long-Term Incentive Plan(incorporated herein by reference to Exhibit 10.1 of Cabot Corporation’s Quarterly Report on Form 10-Q for thequarterly period ending March 31, 2016, file reference 1-5667, filed with the SEC on May 6, 2016).
10(f)* Form of Time-Based Restricted Stock Unit Award Certificate under the Cabot Corporation 2009 Long-Term IncentivePlan (incorporated herein by reference to Exhibit 10.2 of Cabot Corporation’s Quarterly Report on Form 10-Q for thequarterly period ending March 31, 2016, file reference 1-5667, filed with the SEC on May 6, 2016).
10(g)* Form of Stock Option Award Certificate under the Cabot Corporation 2009 Long-Term Incentive Plan (incorporatedherein by reference to Exhibit 10.3 of Cabot Corporation’s Quarterly Report on Form 10-Q for the quarterly periodending March 31, 2016, file reference 1-5667, filed with the SEC on May 6, 2016).
10(h)* Cabot Corporation Deferred Compensation and Supplemental Retirement Plan, amended and restated January 1,2014 (incorporated herein by reference to Exhibit 10.1 of Cabot’s Quarterly Report on Form 10-Q for the quarterlyperiod ended December 31, 2013, file reference 1-5667, filed with the SEC on February 6, 2014).
10(i)* Cabot Corporation Non-Employee Directors’ Deferral Plan, amended and restated January 1, 2014 (incorporatedherein by reference to Exhibit 10.2 of Cabot’s Quarterly Report on Form 10-Q for the quarterly period endedDecember 31, 2013, file reference 1-5667, filed with the SEC on February 6, 2014).
10(j)* Employment Agreement between Nicholas Stewart Cross and Cabot Switzerland GmbH effective April 1, 2010, asmodified by the Assignment Letter between Nicholas Cross and Cabot Corporation effective May 15, 2015(incorporated herein by reference to Exhibit 10.1 of Cabot Corporation’s Quarterly Report on Form 10-Q for thequarterly period ended June 30, 2015, file reference 1-5667, filed with the SEC on August 6, 2015).
10(k) Asset Transfer Agreement, dated as of June 13, 1995, among Cabot Safety Corporation, Cabot Canada Ltd., CabotSafety Limited, Cabot Corporation, Cabot Safety Holdings Corporation and Cabot Safety Acquisition Corporation(incorporated herein by reference to Exhibit 2(a) of Cabot Corporation’s Current Report on Form 8-K dated July 11,1995, file reference 1-5667, filed with the SEC on July 26, 1995).
21† Subsidiaries of Cabot Corporation.
23† Consent of Deloitte & Touche LLP.
31(i)† Certification of Principal Executive Officer required by Rule 13a-14(a) or Rule 15d-14(a) of the Exchange Act.
31(ii)† Certification of Principal Financial Officer required by Rule 13a-14(a) or Rule 15d-14(a) of the Exchange Act.
32†† Certifications of the Principal Executive Officer and Principal Financial Officer pursuant to 18 U.S.C. Section 1350.
101.INS† XBRL Instance Document.
101.SCH† XBRL Taxonomy Extension Schema Document.
101.CAL† XBRL Taxonomy Calculation Linkbase Document.
101.DEF† XBRL Taxonomy Extension Definition Linkbase Document.
101.LAB† XBRL Taxonomy Label Linkbase Document.

98
ExhibitNumber Description
101.PRE† XBRL Taxonomy Presentation Linkbase Document.
* Management contract or compensatory plan or arrangement.† Filed herewith.†† Furnished herewith.
Attached as Exhibit 101 to the report are the following documents formatted in XBRL (Extensible Business ReportingLanguage): (i) the Consolidated Statements of Operations for the years ended September 30, 2016, 2015, 2014;(ii) Consolidated Statements of Comprehensive Income for years ended September 30, 2016, 2015, or 2014. (iii) theConsolidated Balance Sheets at September 30, 2016 and September 30, 2015; (iv) the Consolidated Statements of Cash Flowsfor the years ended September 30, 2016, 2015 and 2014; (v) the Consolidated Statements of Changes in Stockholders’ Equityfor the years ended September 30, 2016, 2015 and 2014; and (vi) Notes to the Consolidated Financial Statements,September 30, 2016.
(c) Schedules. The Schedules have been omitted because they are not required or are not applicable, or the required informationis shown in the financial statements or notes thereto.

99
SIGNATURES
Pursuant to the requirements of Section 13 or 15(d) of the Securities Exchange Act of 1934, the Registrant has duly caused thisReport to be signed on its behalf by the undersigned, thereunto duly authorized.
CABOT CORPORATION
BY: /S/ SEAN D. KEOHANESean D. Keohane
President and Chief Executive Officer
Date: November 23, 2016
Pursuant to the requirements of the Securities Exchange Act of 1934, this report has been signed below by the followingpersons on behalf of the Registrant and in the capacities and on the dates indicated.
Signatures Title Date
/s/ SEAN D. KEOHANE Director, President and November 23, 2016Sean D. Keohane Chief Executive Officer
/s/ EDUARDO E. CORDEIRO Executive Vice President and November 23, 2016Eduardo E. Cordeiro Chief Financial Officer
(principal financial officer)
/s/ JAMES P. KELLY Vice President and Controller November 23, 2016James P. Kelly (principal accounting officer)
/s/ JOHN F. O’BRIEN Director, Non-Executive November 23, 2016John F. O’Brien Chairman of the Board
/s/ JUAN ENRIQUEZ Director November 23, 2016Juan Enriquez
/s/ WILLIAM C. KIRBY Director November 23, 2016William C. Kirby
/s/ RODERICK C.G. MACLEOD Director November 23, 2016Roderick C.G. MacLeod
/s/ JOHN K. MCGILLICUDDY Director November 23, 2016John K. McGillicuddy
/s/ PATRICK M. PREVOST Director November 23, 2016Patrick M. Prevost
/s/ SUE H. RATAJ Director November 23, 2016Sue H. Rataj
/s/ LYDIA W. THOMAS Director November 23, 2016Lydia W. Thomas
/s/ MATTHIAS L. WOLFGRUBER Director November 23, 2016Matthias L. Wolfgruber
/s/ MARK S. WRIGHTON Director November 23, 2016Mark S. Wrighton

100
EXHIBIT INDEX
ExhibitNumber Description
3(a) Restated Certificate of Incorporation of Cabot Corporation effective January 9, 2009 (incorporated herein by referenceto Exhibit 3.1 of Cabot’s Quarterly Report on Form 10-Q for the quarterly period ended December 31, 2008, filereference 1-5667, filed with the SEC on February 9, 2009).
3(b) The By-laws of Cabot Corporation as amended January 8, 2016 (incorporated herein by reference to Exhibit 3.1 ofCabot’s Corporation’s Quarterly Report on Form 10-Q for the quarterly period ended December 31, 2015, filereference 1-5667, filed with the SEC on February 5, 2016).
4(a)(i) Indenture, dated as of December 1, 1987, between Cabot Corporation and The First National Bank of Boston, Trustee(the “Indenture”) (incorporated herein by reference to Exhibit 4 of Amendment No. 1 to Cabot’s RegistrationStatement on Form S-3, Registration Statement No. 33-18883, filed with the SEC on December 10, 1987).
4(a)(ii) First Supplemental Indenture, dated as of June 17, 1992, to the Indenture (incorporated herein by reference to Exhibit4.3 of Cabot’s Registration Statement on Form S-3, Registration Statement No. 33-48686, filed with the SEC on June18, 1992).
4(a)(iii) Second Supplemental Indenture, dated as of January 31, 1997, between Cabot Corporation and State Street Bank andTrust Company, Trustee (incorporated herein by reference to Exhibit 4 of Cabot’s Quarterly Report on Form 10-Q forthe quarterly period ended December 31, 1996, file reference 1-5667, filed with the SEC on February 14, 1997).
4(a)(iv) Third Supplemental Indenture, dated as of November 20, 1998, between Cabot Corporation and State Street Bank andTrust Company, Trustee (incorporated herein by reference to Exhibit 4.1 of Cabot’s Current Report on Form 8-K, datedNovember 20, 1998, file reference 1-5667, filed with the SEC on November 20, 1998).
4(a)(v) Indenture, dated as of September 21, 2009, between Cabot Corporation and U.S. Bank National Association, asTrustee (incorporated herein by reference to Exhibit 4.1 of Cabot’s Registration Statement on Form S-3 ASR,Registration Statement No. 333-162021, filed with the SEC on September 21, 2009).
4(a)(vi) Second Supplemental Indenture, dated as of July 12, 2012 between Cabot Corporation, as Issuer, and U.S. BankNational Association, as Trustee, including the form of Global Note attached as Annex A thereto, supplementing theIndenture dated as of September 21, 2009 (incorporated herein by reference to Exhibit 4.1 of Cabot’s Current Reporton Form 8-K dated July 9, 2012, file reference 1-5667, filed with the SEC on July 12, 2012).
4(a)(vii) Indenture, dated as of September 15, 2016, between Cabot Corporation and U.S. Bank National Association, asTrustee (incorporated herein by reference to Exhibit 4.1 of Cabot Corporation’s Current Report on Form 8-K datedSeptember 15, 2016, file reference 1-5667, filed with the SEC on September 15, 2016).
4(a)(viii) First Supplemental Indenture, dated as of September 15, 2016, between Cabot Corporation and U.S. Bank NationalAssociation, as Trustee, including the form of Global Note attached as Annex A thereto, supplementing the Indenturedated as of September 15, 2016 (incorporated herein by reference to Exhibit 4.2 of Cabot Corporation’s CurrentReport on Form 8-K dated September 15, 2016, file reference 1-5667, filed with the SEC on September 15, 2016).
10(a) Credit Agreement, dated October 23, 2015, among Cabot Corporation, JPMorgan Chase Bank, N.A., J.P. MorganSecurities LLC, Citigroup Global Markets Inc., Citibank, N.A., Bank of America, N.A., Mizuho Bank, Ltd., TD Bank, N.A.,and Wells Fargo Bank, National Association, and the other lenders party thereto (incorporated herein by reference toExhibit 10(a) of Cabot’s Annual Report on Form 10-K for its fiscal year ended September 30, 2015, file reference 1-5667, filed with the SEC on November 25, 2015).
10(b)(i)* 2009 Long-Term Incentive Plan (incorporated herein by reference to Appendix B of Cabot’s Proxy Statement onSchedule 14A relating to the 2012 Annual Meeting of Stockholders, file reference 1-5667, filed with the SEC on January30, 2012).
10(b)(ii)* 2015 Directors’ Stock Compensation Plan (incorporated herein by reference to Appendix B of Cabot’s Proxy Statementon Schedule 14A relating to the 2015 Annual Meeting of Stockholders, file reference 1-5667, filed with the SEC onJanuary 28, 2015).

101
ExhibitNumber Description
10(b)(iii)* Cabot Corporation Short-Term Incentive Compensation Plan (incorporated herein by reference to Appendix B of CabotCorporation’s Proxy Statement on Schedule 14A relating to the 2016 Annual Meeting of Stockholders, file reference 1-5667, filed with the SEC on January 28, 2016).
10(c)* Summary of Compensation for Non-Employee Directors (incorporated herein by reference to Exhibit 10(c) of Cabot’sAnnual Report on Form 10-K for its fiscal year ended September 30, 2015, file reference 1-5667, filed with the SEC onNovember 25, 2015).
10(d)* Cabot Corporation Amended and Restated Senior Management Severance Protection Plan, dated March 9, 2012(incorporated herein by reference to Exhibit 10.5 of Cabot’s Quarterly Report on Form 10-Q for the quarterly periodended March 31, 2012, file reference 1-5667, filed with the SEC on May 7, 2012).
10(e)* Form of Performance-Based Stock Unit Award Certificate under the Cabot Corporation 2009 Long-Term Incentive Plan(incorporated herein by reference to Exhibit 10.1 of Cabot Corporation’s Quarterly Report on Form 10-Q for thequarterly period ending March 31, 2016, file reference 1-5667, filed with the SEC on May 6, 2016).
10(f)* Form of Time-Based Restricted Stock Unit Award Certificate under the Cabot Corporation 2009 Long-Term IncentivePlan (incorporated herein by reference to Exhibit 10.2 of Cabot Corporation’s Quarterly Report on Form 10-Q for thequarterly period ending March 31, 2016, file reference 1-5667, filed with the SEC on May 6, 2016).
10(g)* Form of Stock Option Award Certificate under the Cabot Corporation 2009 Long-Term Incentive Plan (incorporatedherein by reference to Exhibit 10.3 of Cabot Corporation’s Quarterly Report on Form 10-Q for the quarterly periodending March 31, 2016, file reference 1-5667, filed with the SEC on May 6, 2016).
10(h)* Cabot Corporation Deferred Compensation and Supplemental Retirement Plan, amended and restated January 1, 2014(incorporated herein by reference to Exhibit 10.1 of Cabot’s Quarterly Report on Form 10-Q for the quarterly periodended December 31, 2013, file reference 1-5667, filed with the SEC on February 6, 2014).
10(i)* Cabot Corporation Non-Employee Directors’ Deferral Plan, amended and restated January 1, 2014 (incorporatedherein by reference to Exhibit 10.2 of Cabot’s Quarterly Report on Form 10-Q for the quarterly period endedDecember 31, 2013, file reference 1-5667, filed with the SEC on February 6, 2014).
10(j)* Employment Agreement between Nicholas Stewart Cross and Cabot Switzerland GmbH effective April 1, 2010, asmodified by the Assignment Letter between Nicholas Cross and Cabot Corporation effective May 15, 2015(incorporated herein by reference to Exhibit 10.1 of Cabot Corporation’s Quarterly Report on Form 10-Q for thequarterly period ended June 30, 2015, file reference 1-5667, filed with the SEC on August 6, 2015).
10(k) Asset Transfer Agreement, dated as of June 13, 1995, among Cabot Safety Corporation, Cabot Canada Ltd., CabotSafety Limited, Cabot Corporation, Cabot Safety Holdings Corporation and Cabot Safety Acquisition Corporation(incorporated herein by reference to Exhibit 2(a) of Cabot Corporation’s Current Report on Form 8-K dated July 11,1995, file reference 1-5667, filed with the SEC on July 26, 1995).
21† Subsidiaries of Cabot Corporation.
23† Consent of Deloitte & Touche LLP.
31(i)† Certification of Principal Executive Officer required by Rule 13a-14(a) or Rule 15d-14(a) of the Exchange Act.
31(ii)† Certification of Principal Financial Officer required by Rule 13a-14(a) or Rule 15d-14(a) of the Exchange Act.
32†† Certifications of the Principal Executive Officer and Principal Financial Officer pursuant to 18 U.S.C. Section 1350.
101.INS† XBRL Instance Document.
101.SCH† XBRL Taxonomy Extension Schema Document.
101.CAL† XBRL Taxonomy Calculation Linkbase Document.
101.DEF† XBRL Taxonomy Extension Definition Linkbase Document.
101.LAB† XBRL Taxonomy Label Linkbase Document.
101.PRE† XBRL Taxonomy Presentation Linkbase Document.
* Management contract or compensatory plan or arrangement.

102
† Filed herewith.†† Furnished herewith.
Attached as Exhibit 101 to the report are the following documents formatted in XBRL (Extensible Business ReportingLanguage): (i) the Consolidated Statements of Operations for the years ended September 30, 2016, 2015, 2014;(ii) Consolidated Statements of Comprehensive Income for years ended September 30, 2016, 2015, or 2014. (iii) theConsolidated Balance Sheets at September 30, 2016 and September 30, 2015; (iv) the Consolidated Statements of Cash Flowsfor the years ended September 30, 2016, 2015 and 2014; (v) the Consolidated Statements of Changes in Stockholders’ Equityfor the years ended September 30, 2016, 2015 and 2014; and (vi) Notes to the Consolidated Financial Statements,September 30, 2016.

Exhibit 31(i)
Principal Executive Officer Certification
I, Sean D. Keohane, certify that:
1. I have reviewed this annual report on Form 10-K of Cabot Corporation;
2. Based on my knowledge, this report does not contain any untrue statement of a material fact or omit to state a materialfact necessary to make the statements made, in light of the circumstances under which such statements were made, not misleadingwith respect to the period covered by this report;
3. Based on my knowledge, the financial statements, and other financial information included in this report, fairly present in allmaterial respects the financial condition, results of operations and cash flows of the registrant as of, and for, the periods presentedin this report;
4. The registrant’s other certifying officer(s) and I are responsible for establishing and maintaining disclosure controls andprocedures (as defined in Exchange Act Rules 13a-15(e) and 15d-15(e)) and internal control over financial reporting (as defined inExchange Act Rules 13a-15(f) and 15d-15(f)) for the registrant and have:
a) designed such disclosure controls and procedures, or caused such disclosure controls and procedures to be designedunder our supervision, to ensure that material information relating to the registrant, including its consolidated subsidiaries, ismade known to us by others within those entities, particularly during the period in which this report is being prepared;
b) designed such internal control over financial reporting, or caused such internal control over financial reporting to bedesigned under our supervision, to provide reasonable assurance regarding the reliability of financial reporting and thepreparation of financial statements for external purposes in accordance with generally accepted accounting principles;
c) evaluated the effectiveness of the registrant’s disclosure controls and procedures and presented in this report ourconclusions about the effectiveness of the disclosure controls and procedures, as of the end of the period covered by thisreport based on such evaluation; and
d) disclosed in this report any change in the registrant’s internal control over financial reporting that occurred during theregistrant’s most recent fiscal quarter (the registrant’s fourth fiscal quarter in the case of an annual report) that has materiallyaffected, or is reasonably likely to materially affect, the registrant’s internal control over financial reporting; and
5. The registrant’s other certifying officer(s) and I have disclosed, based on our most recent evaluation of internal control overfinancial reporting, to the registrant’s auditors and the audit committee of the registrant’s board of directors (or persons performingthe equivalent functions):
a) all significant deficiencies and material weaknesses in the design or operation of internal control over financialreporting which are reasonably likely to adversely affect the registrant’s ability to record, process, summarize and reportfinancial information; and
b) any fraud, whether or not material, that involves management or other employees who have a significant role in theregistrant’s internal control over financial reporting.
Date: November 23, 2016 /S/ SEAN D. KEOHANESean D. Keohane
President andChief Executive Officer

Exhibit 31(ii)
Principal Financial Officer Certification
I, Eduardo E. Cordeiro, certify that:
1. I have reviewed this annual report on Form 10-K of Cabot Corporation;
2. Based on my knowledge, this report does not contain any untrue statement of a material fact or omit to state a materialfact necessary to make the statements made, in light of the circumstances under which such statements were made, not misleadingwith respect to the period covered by this report;
3. Based on my knowledge, the financial statements, and other financial information included in this report, fairly present in allmaterial respects the financial condition, results of operations and cash flows of the registrant as of, and for, the periods presentedin this report;
4. The registrant’s other certifying officer(s) and I are responsible for establishing and maintaining disclosure controls andprocedures (as defined in Exchange Act Rules 13a-15(e) and 15d-15(e)) and internal control over financial reporting (as defined inExchange Act Rules 13a-15(f) and 15d-15(f)) for the registrant and have:
a) designed such disclosure controls and procedures, or caused such disclosure controls and procedures to be designedunder our supervision, to ensure that material information relating to the registrant, including its consolidated subsidiaries, ismade known to us by others within those entities, particularly during the period in which this report is being prepared;
b) designed such internal control over financial reporting, or caused such internal control over financial reporting to bedesigned under our supervision, to provide reasonable assurance regarding the reliability of financial reporting and thepreparation of financial statements for external purposes in accordance with generally accepted accounting principles;
c) evaluated the effectiveness of the registrant’s disclosure controls and procedures and presented in this report ourconclusions about the effectiveness of the disclosure controls and procedures, as of the end of the period covered by thisreport based on such evaluation; and
d) disclosed in this report any change in the registrant’s internal control over financial reporting that occurred during theregistrant’s most recent fiscal quarter (the registrant’s fourth fiscal quarter in the case of an annual report) that has materiallyaffected, or is reasonably likely to materially affect, the registrant’s internal control over financial reporting; and
5. The registrant’s other certifying officer(s) and I have disclosed, based on our most recent evaluation of internal control overfinancial reporting, to the registrant’s auditors and the audit committee of the registrant’s board of directors (or persons performingthe equivalent functions):
a) all significant deficiencies and material weaknesses in the design or operation of internal control over financialreporting which are reasonably likely to adversely affect the registrant’s ability to record, process, summarize and reportfinancial information; and
b) any fraud, whether or not material, that involves management or other employees who have a significant role in theregistrant’s internal control over financial reporting.
Date: November 23, 2016 /s/ EDUARDO E. CORDEIROEduardo E. Cordeiro
Executive Vice President andChief Financial Officer

Exhibit 32
Certifications Pursuant to 18 U.S.C. Section 1350,as Adopted Pursuant to Section 906 of the
Sarbanes-Oxley Act of 2002
In connection with the filing of the Annual Report on Form 10-K for the year ended September 30, 2016 (the “Report”) byCabot Corporation (the “Company”), each of the undersigned hereby certifies pursuant to 18 U.S.C. Section 1350, as adoptedpursuant to Section 906 of the Sarbanes-Oxley Act of 2002, that, to his knowledge:
1. The Report fully complies with the requirements of section 13 (a) or 15 (d) of the Securities Exchange Act of 1934, asamended; and
2. The information contained in the Report fairly presents, in all material respects, the financial condition and results ofoperations of the Company.
November 23, 2016 /s/ SEAN D. KEOHANESean D. Keohane
President andChief Executive Officer
November 23, 2016 /s/ EDUARDO E. CORDEIRO
Eduardo E. CordeiroExecutive Vice President and
Chief Financial Officer

[THIS PAGE INTENTIONALLY LEFT BLANK]

[THIS PAGE INTENTIONALLY LEFT BLANK]

[THIS PAGE INTENTIONALLY LEFT BLANK]

Corporate Headquarters
Cabot CorporationTwo Seaport Lane, Suite 1300Boston, Massachusetts 02210-2019617 345 0100
Investor Relations
Investor inquiries are welcome and individuals are invited to contact us through our investor website at investor.cabot-corp.com or by telephone at 617 342 6255.
Stock Listing
Cabot Corporation common stock is listed on the New York Stock Exchange under the symbol CBT.
Annual Meeting
The Annual Meeting of Stockholders will be held on Thursday, March 9, 2017 at 4:00 p.m. ET, at the company’s corporate headquarters at Two Seaport Lane, Suite 1300, Boston, Massachusetts. All stockholders are invited to attend.
Stock Transfer Agent and Registrar
Registered shareholders may contact the transfer agent by Internet or by phone for information or assistance with receiving proxy materials electronically by Internet, direct deposit of dividend payments, dividend check replacements, account history, lost stock certificates, taxable income or to report address changes. The transfer agent provides telephone assistance Monday through Friday, 9:00 a.m. to 5:00 p.m. ET. Extended service is available 24 hours a day, seven days a week to callers with touch-tone telephones through the transfer agent’s Interactive Voice Response System.
When using the IVR system, mention Cabot Corporation as your stock holding and be prepared to provide your name, Social Security number, if applicable, or your Computershare account number. Please include your address and telephone number in all correspondence with the transfer agent.
Computershare Trust Company, N.A.c/o Computershare Investor ServicesP.O. Box 30170College Station, TX 77842-3170
Overnight correspondence should be sent to:Computershare211 Quality Circle, Suite 210College Station, TX 77845
Stockholder Inquiries: 781 575 3170 or 800 730 4001
For the hearing impaired: 800 952 9245 (TTY/TDD)
Stockholder Website: computershare.com/investorClick on “Contact Us” link at the top or bottom of the webpage for online stockholder inquiries.
For more information about Cabot Corporation and our businesses, please visit our website at: cabotcorp.com

002CSN780E