cabg-valve 2005 tech notes - phc4 notes for phc4’s report on cabg and valve surgery, 2005 i table...
TRANSCRIPT

Technical Notes
for
PHC4’s Report on CABG and Valve Surgery
Calendar Year 2005
The Pennsylvania Health Care Cost Containment Council
April 2007
Preface
This document serves as a technical supplement to PHC4’s report on coronary artery bypass graft (CABG) and valve surgery for calendar year 2005 (January 1, 2005 to December 31, 2005). The Technical Notes for PHC4’s Report on CABG and Valve Surgery describes the methodology and development of the report. This document also includes information on statewide results, cases excluded from analysis, and risk-adjustment models.
• For the first time, this report presents data on the outcomes associated with heart valve surgery in addition to data on CABG surgery.
• Commercial insurance payment data and Medicare payment data are also reported at the hospital level for the first time.
• The analysis included adult patients at least 30 years of age who underwent a CABG procedure, a valve procedure, or combined valve and CABG procedures in a Pennsylvania general acute care hospital.
• Risk-adjusted measures for hospitals and surgeons with at least 30 cases are reported for:
• In-hospital mortality
• Operative mortality (includes in-hospital and 30-day)
• 7-day readmissions
• 30-day readmissions
• Post-surgical length of stay
• The following measures are reported for hospitals with at least 5 cases:
• Average hospital charge (case-mix adjusted)
• Average commercial insurance payment
• Currently, the following measure is reported for hospitals with at least 13 cases:
• Average Medicare payment The rigorous methodology described in this document was developed to account for the differences among individual patients that had the potential to influence the outcome of CABG and/or valve surgery.
Pennsylvania Health Care Cost Containment Council 225 Market Street, Suite 400
Harrisburg, PA 17101
Phone: (717) 232-6787 Fax: (717) 232-3821
www.phc4.org
Marc P. Volavka, Executive Director

Technical Notes for PHC4’s Report on CABG and Valve Surgery, 2005
i
TABLE OF CONTENTS Data Collection and Verification ...................................................................................................... 1
Hospital and Cardiothoracic Surgeon Verification of Data ..................................................... 1 Study Population.............................................................................................................................. 2 Exclusions for Outcome Analyses ................................................................................................... 3 Measures Reported ......................................................................................................................... 3
Number of Cases.................................................................................................................... 3 In-Hospital Mortality ................................................................................................................ 3 Operative Mortality.................................................................................................................. 3 7-Day Readmissions............................................................................................................... 4 30-Day Readmissions............................................................................................................. 4 Post-Surgical Length of Stay .................................................................................................. 4 Average Hospital Charge ....................................................................................................... 4 Average Commercial Payment............................................................................................... 4 Average Medicare Payment ................................................................................................... 5
Risk-Adjustment............................................................................................................................... 5 Mortality and Readmissions Analyses............................................................................................. 6
Risk-Adjustment Methodology................................................................................................ 6 Data Preparation............................................................................................................... 6 Building the Risk-Adjustment Models ............................................................................... 6
Coefficients and Odds Ratios ............................................................................................... 11 Calculation of Statistical Ratings .......................................................................................... 13
Determining Actual (Observed) Rates ............................................................................ 13 Determining Expected Rates .......................................................................................... 14
Post-Surgical Length of Stay Analysis .......................................................................................... 16
Risk-Adjustment Methodology.............................................................................................. 16 Data Preparation............................................................................................................. 16 Building the Risk-Adjustment Model ............................................................................... 16
Coefficients ........................................................................................................................... 19 Calculation of Risk-Adjusted Post-Surgical Length of Stay.................................................. 19
Actual Length of Stay...................................................................................................... 19 Expected Length of Stay................................................................................................. 20 Risk-Adjusted Post-Surgical Length of Stay................................................................... 20
Average Hospital Charge Analysis ................................................................................................ 22
Construction of Reference Database ................................................................................... 22 Trim Methodology................................................................................................................. 22 Case-Mix Adjustment of Average Hospital Charge .............................................................. 25
Average Payment Analysis............................................................................................................ 27
Average Commercial Payment............................................................................................. 27 Average Medicare Payment ................................................................................................. 27
Appendix A: Exclusion Definitions ................................................................................................ 29 Appendix B: Exclusion Data ......................................................................................................... 32 Appendix C: Readmissions Data.................................................................................................. 34 Appendix D: Candidate Variable Definitions ................................................................................ 38 Appendix E: Candidate Variable Data.......................................................................................... 43 Appendix F: Atlas Outcomes Approach to Risk-Adjustment ...................................................... 51
Technical Notes for PHC4’s Report on CABG and Valve Surgery, 2005
1
DATA COLLECTION AND VERIFICATION
The Pennsylvania Health Care Cost Containment Council (PHC4) is mandated by state law to collect and disseminate health care data. The data for PHC4’s 2005 report on CABG and valve surgery were submitted electronically on a quarterly basis to PHC4 by Pennsylvania general acute care (GAC) hospitals as directed by the data submission requirements of Act 89 of 1986 (currently Act 14 of 2003). The data submitted by hospitals included demographic information, hospital charges, and diagnosis and procedure codes. Facilities were required to submit data to PHC4 within 90 days from the last day of each quarter. The standard data verification process included extensive quality assurance and data quality checks. Error reports were generated and returned to each facility with an opportunity to correct any problems.
In addition, hospitals were required to use the MediQual Atlas Outcomes System to abstract information from the medical record that described each patient’s state of health on admission. Commercial and Medicare payment data were obtained directly from the payors. Commercial payment data were received from commercial payors, and Medicare payment data were provided by the Centers for Medicare and Medicaid Services (CMS). Death certificate data were obtained from the Pennsylvania Department of Health to identify deaths that occurred subsequent to the hospitalization in which the CABG/valve surgery was performed. Hospital and Cardiothoracic Surgeon Verification of Data Discharge records for patients who underwent an open heart procedure in 2005 were subjected to extensive data verification and quality assurance checks. Hospitals were requested to confirm the accuracy of discharge records, provide six additional diagnoses and three additional procedure codes as appropriate, and confirm that cases had the correct surgeon assignment. Surgeons were requested to perform a patient level review of the submitted records and then attest to the accuracy of the data and the surgeon assignment. Hospitals and/or surgeons had the opportunity to request special exclusions for cases in which the patient’s outcome was most directly associated with conditions unrelated to the CABG/valve surgery and not accounted for through risk adjustment. In addition, hospitals and/or surgeons had the opportunity to identify cases in which cardiogenic shock and/or acute renal failure were present at or immediately prior to the surgery, because of their importance as risk factors. Medical records were reviewed to verify the presence of these risk factors and to determine whether special requests for exclusion would be granted.
Technical Notes for PHC4’s Report on CABG and Valve Surgery, 2005
2
STUDY POPULATION
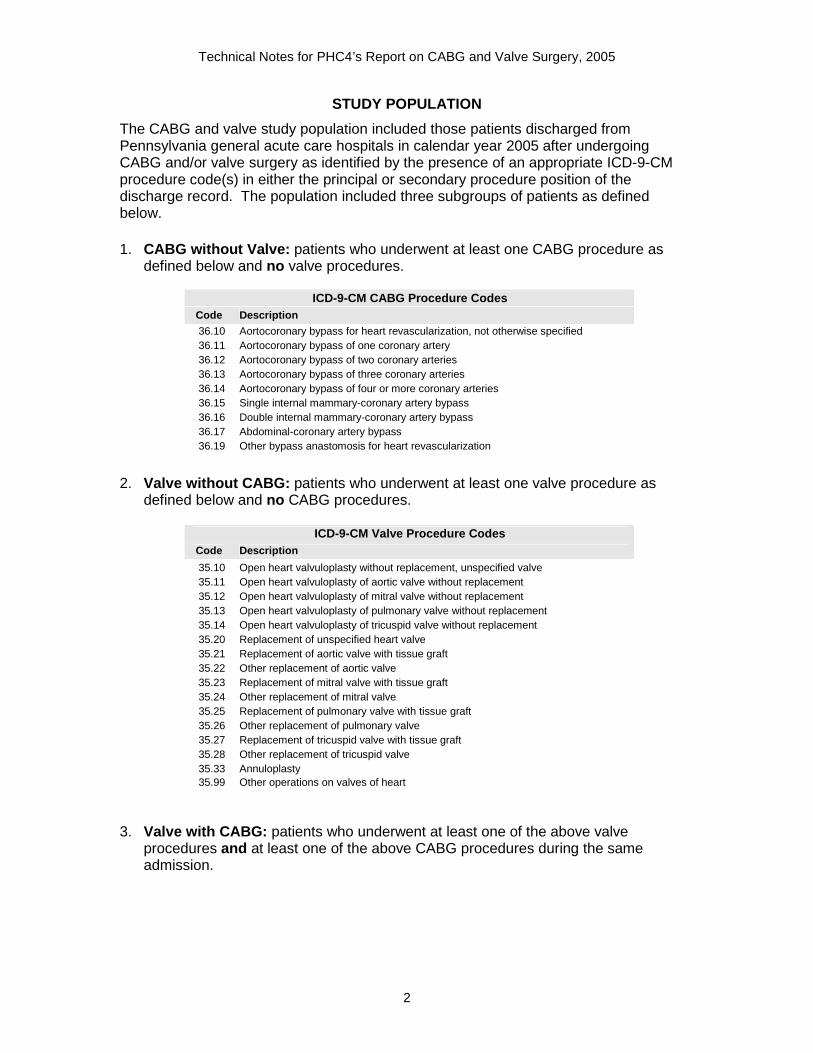
The CABG and valve study population included those patients discharged from Pennsylvania general acute care hospitals in calendar year 2005 after undergoing CABG and/or valve surgery as identified by the presence of an appropriate ICD-9-CM procedure code(s) in either the principal or secondary procedure position of the discharge record. The population included three subgroups of patients as defined below.
1. CABG without Valve: patients who underwent at least one CABG procedure as defined below and no valve procedures.
2. Valve without CABG: patients who underwent at least one valve procedure as
defined below and no CABG procedures.
ICD-9-CM Valve Procedure Codes Code Description
35.10 Open heart valvuloplasty without replacement, unspecified valve 35.11 Open heart valvuloplasty of aortic valve without replacement 35.12 Open heart valvuloplasty of mitral valve without replacement 35.13 Open heart valvuloplasty of pulmonary valve without replacement 35.14 Open heart valvuloplasty of tricuspid valve without replacement 35.20 Replacement of unspecified heart valve 35.21 Replacement of aortic valve with tissue graft 35.22 Other replacement of aortic valve 35.23 Replacement of mitral valve with tissue graft 35.24 Other replacement of mitral valve 35.25 Replacement of pulmonary valve with tissue graft 35.26 Other replacement of pulmonary valve 35.27 Replacement of tricuspid valve with tissue graft 35.28 Other replacement of tricuspid valve 35.33 Annuloplasty 35.99 Other operations on valves of heart
3. Valve with CABG: patients who underwent at least one of the above valve procedures and at least one of the above CABG procedures during the same admission.
ICD-9-CM CABG Procedure Codes Code Description
36.10 Aortocoronary bypass for heart revascularization, not otherwise specified 36.11 Aortocoronary bypass of one coronary artery 36.12 Aortocoronary bypass of two coronary arteries 36.13 Aortocoronary bypass of three coronary arteries 36.14 Aortocoronary bypass of four or more coronary arteries 36.15 Single internal mammary-coronary artery bypass 36.16 Double internal mammary-coronary artery bypass 36.17 Abdominal-coronary artery bypass 36.19 Other bypass anastomosis for heart revascularization
Technical Notes for PHC4’s Report on CABG and Valve Surgery, 2005
3
EXCLUSIONS FOR OUTCOME ANALYSES
Cases meeting certain criteria were excluded from the outcome analyses. Standard exclusions consisted of the following: 1) clinically complex cases, 2) patients less than 30 years of age, and 3) patients who left against medical advice. Standard exclusion criteria were applied to the in-hospital mortality analysis. Standard exclusion and exclusion criteria particular to the measure of interest were applied to the analyses of operative mortality, 7-day and 30-day readmissions, post-surgical length of stay, and average hospital charge. Appendix B displays exclusion data for each outcome measure.
MEASURES REPORTED
Number of Cases The number of cases (after standard exclusions were removed) is reported for hospitals and surgeons. The number of cases is displayed for each of the following reporting groups:
� CABG without Valve is the number of patients who underwent at least one CABG procedure without any valve procedures during the same admission.
� Valve without CABG is the number of patients who underwent at least one valve procedure without any CABG procedures during the same admission.
� Valve with CABG is the number of patients who underwent at least one valve procedure and at least one CABG procedure during the same admission.
� Total Valve is the total number of patients who underwent at least one valve procedure with or without a CABG procedure during the same admission.
Note that the actual number of CABG/valve surgeries performed by a particular surgeon may be underreported. For example, procedures done in Veterans’ hospitals and in other states were not included in this analysis. In-Hospital Mortality The in-hospital mortality rating was based on the number of deaths that occurred during the hospital admission in which the CABG/valve surgery was performed compared to the expected number of deaths. Information on whether the patient died during the hospital stay was provided by hospitals. Operative Mortality
The operative mortality rating was based on the total number of operative deaths compared to the expected number of deaths. Operative deaths were defined as:
� The number of deaths that occurred during the hospitalization in which the CABG/valve surgery was performed, even if after 30 days, and
� The number of deaths that occurred after the patient was discharged from the hospital, but within 30 days of the procedure, unless the death was clearly

Technical Notes for PHC4’s Report on CABG and Valve Surgery, 2005
4
unrelated to the procedure (e.g., drug/alcohol poisoning). To determine whether a patient died within 30 days, death certificate information was obtained from the Pennsylvania Department of Health. Out-of-state residents were excluded from the analysis, because death certificate information was not available for these patients.
7-Day Readmissions Some patients discharged from the hospital following CABG/valve surgery were readmitted at a later date. The 7-day readmissions rating was based on the number of patients who were readmitted to a general acute care hospital (in Pennsylvania) within 1 to 7 days of being discharged from the hospitalization in which the CABG/valve surgery was performed compared to the expected number of readmissions. Readmissions were counted when the principal diagnosis indicated a heart-related condition, an infection, and/or a complication related to the surgery. Appendix C contains a list of diagnosis categories for which there was one or more readmissions. 30-Day Readmissions Similar to 7-day readmissions, the 30-day readmission rating was based on the number of patients who were readmitted to a general acute care hospital within 1 to 30 days of being discharged from the hospitalization in which the CABG/valve surgery was performed compared to the expected number of readmissions. Readmissions were counted using the same principal diagnosis criteria used for 7-day readmissions. Appendix C contains a list of diagnosis categories for which there was one or more readmissions. Post-Surgical Length of Stay Post-surgical length of stay is the risk-adjusted number of days, on average, that patients stayed in the hospital following CABG/valve surgery. Average Hospital Charge Average hospital charge is reported for hospitals that had at least 5 cases in the reporting group of interest. The average charges that appear in the report were trimmed for outliers and case-mix adjusted. The charges reported are those associated with the entire hospitalization during which the CABG/valve surgery was performed (not just the treatment associated with surgery). The charges do not include professional fees (e.g., physician fees). While charges are a standard way of reporting data, they do not reflect the actual cost of treatment, nor do they reflect the payment that the hospital may have actually received. Average Commercial Payment The average commercial payment is reported for hospitals that had at least 5 cases in the reporting group of interest for which commercial payment data was available. Average payments were not trimmed for outliers and not case-mix adjusted; that is, actual average commercial payments are reported.
Technical Notes for PHC4’s Report on CABG and Valve Surgery, 2005
5
Average Medicare Payment Currently, the average Medicare payment is reported for hospitals that had at least 13 cases in the reporting group of interest for which Medicare payment data was available. Average payments were not trimmed for outliers and not case-mix adjusted; that is, actual average Medicare payments are reported.
RISK-ADJUSTMENT
In-hospital mortality, operative mortality, 7-day readmissions, 30-day readmissions, and post-surgical length of stay were risk-adjusted, which means that the measure took into account the patient’s health condition before surgery. Some patients who underwent CABG/valve surgery were more seriously ill than others. In order to report fair comparisons among hospitals and surgeons, PHC4 developed a complex mathematical formula to “risk adjust” the data, meaning that hospitals and surgeons receive “extra credit” for operating on patients that were more seriously ill or at a greater risk than others. Risk adjusting the data was important because sicker patients might be more likely to die, stay in the hospital longer, or be readmitted. Through logistic or linear regression modeling, risk factors (e.g., the age and sex of the patient and factors that indicate the illness level of the patient) were “tested” to determine which factors predicted patient outcomes (i.e., in-hospital mortality, operative mortality, 7-day and 30-day readmissions, and post-surgical length of stay). Note that a separate risk-adjustment model was built for each of these outcome measures. The risk-adjustment models were then used to calculate the risk-adjusted ratings displayed in the report. Each hospital and surgeon with at least 30 cases in a particular procedure group (after exclusions) received ratings for in-hospital mortality, operative mortality, 7-day readmissions, and 30-day readmissions. The ratings indicate whether the hospital or the surgeon’s mortality or readmissions rate was within the expected range or higher or lower than expected, taking into account the risk factors that were included in the risk-adjustment models. Rather than reporting a statistical rating for post-surgical length of stay, the risk-adjusted length of stay is reported in days. Additional detail on the methodology used to build the models and compute statistical ratings can be found in the sections titled “Risk-Adjustment Methodology.”

Technical Notes for PHC4’s Report on CABG and Valve Surgery, 2005
6
MORTALITY AND READMISSIONS ANALYSES
Risk-Adjustment Methodology Data Preparation After cases to be excluded from the analyses were removed, the remaining cases were randomly split into two equal-size samples by procedure group (CABG without valve, valve without CABG, and valve with CABG)—a development sample and a cross-validation sample. The number of relevant cases for each sample is shown in Table 1.
Table 1. Frequencies for Development Sample, Cross-Validation Sample, and Full Data Set
Development
Sample Cross-Validation
Sample Full Data
Set In-hospital mortality
Number of cases 8,666 8,665 17,331
Number of in-hospital deaths 254 253 507
Mortality rate (%) 2.9 2.9 2.9
Operative mortality Number of cases 7,873 7,871 15,744
Number of operative deaths 272 274 546
Mortality rate (%) 3.5 3.5 3.5
7-day readmissions Number of cases 7,650 7,647 15,297
Number of readmissions within 7 days 437 481 918
Readmissions rate (%) 5.7 6.3 6.0
30-day readmissions Number of cases 7,650 7,647 15,297
Number of readmissions within 30 days 1,139 1,160 2,299
Readmissions rate (%) 14.9 15.2 15.0
Building the Risk-Adjustment Models Identifying possible risk factors. The first step in building the risk-adjustment models for in-hospital mortality, operative mortality, 7-day readmissions, and 30-day readmissions was to identify possible risk factors, that is, those factors that potentially contributed to these events. In doing so, both clinical and demographic factors identified in the literature were considered, taking into account the availability and usability of the variables in the database. Also considered were factors tested in previous cardiac-related reports released by the Council and MediQual’s Key Clinical Findings (KCFs; see Appendix F). These possible risk-adjustment factors are called candidate variables. Appendices D and E provide definitions and data for candidate variables that were considered in the present analyses. Once the candidate variables were identified, models for each outcome measure were developed using the following processes: model selection, cross-validation, and calculation of model adequacy measures. Model selection for mortality models. Binary logistic regression was used to select risk factors for the in-hospital and operative mortality models. For the mortality models, the variables in Table 2a, which were developed primarily by MediQual for their CABG/valve in-hospital mortality model using the MediQual Atlas Outcomes
System data, were entered into the models and retained, unless the analysis did not suggest that the variable would be predictive of the outcome.

Technical Notes for PHC4’s Report on CABG and Valve Surgery, 2005
7
Table 2a. Development Models: Candidate Variables Entered Into the Model that were Developed Primarily by MediQual
1 This variable was not retained in the operative mortality model because the analysis did not suggest that the variable would be predictive of operative mortality.
The variables in Table 2b were entered into the mortality models and tested for their impact in each model. Using a backward stepwise technique, candidate variables that had the least impact in the model were eliminated one at a time, until all variables remaining in the model were statistically significant. All tests of significance (p < 0.10) were based on the likelihood ratio. Table 2b notes the tested variables that were found to be significant in the mortality models.
Table 2b. Development Models: Variables Tested as Potential Predictors for Mortality
Results for Mortality
Candidate Variables In-Hospital Operative
Clinical Variables Other Than Laboratory Variables
AMI Except Other Anterior or Other Inferior Wall � ns
Cachexia � �
Cancer not tested1 �
Cardiogenic Shock, Preoperative � �
Cardiomyopathy not tested1 ns
Chronic Lung Disease ns ns
Chronic Pulmonary Hypertension ns ns
Coagulopathy � ns
Excision of Other Lesion/Heart Tissue, Open Approach – Same Date as Valve Surgery w/wo CABG
ns not tested1
Hypertension with Complications � �
Intra-Aortic Balloon Pump (IABP) Prior to Date of CABG/Valve Surgery ns �
Liver Disease � not tested1
Multiple Valve Procedures ns �
Renal Failure/Dialysis (category) ns ns
� : significant predictor (p < 0.10) ns: not significant 1 This variable was not tested because the preliminary analysis did not suggest that the variable would be
predictive of the relevant outcome.
Demographic Variables Laboratory Variables Age in Years Albumin < 3.1 Age # Years > 65 BUN > 40 Female Creatinine > 1.4 Glucose > 1651 Clinical Variables Other Than Laboratory Variables AMI Other Inferior Wall Initial Episode History of Peripheral Vascular Disease ASA Class 5 MI Other Anterior Wall ASA Emergency Flag Mild Moderate or Severe AMS CAD > 70, 5-7 Vessels Grp Other CV Procedure Group Current Med Immunosuppressants Percent of Left Main Stenosis1 Current Med Insulin Procedure Group
Ejection Fraction PTCA/Stent/Tear Same Day as CABG/Valve Surgery Heart Failure Septal Other Anomalous Repair Heart History of CABG or Valve Surgery SIRS Group
Technical Notes for PHC4’s Report on CABG and Valve Surgery, 2005
8
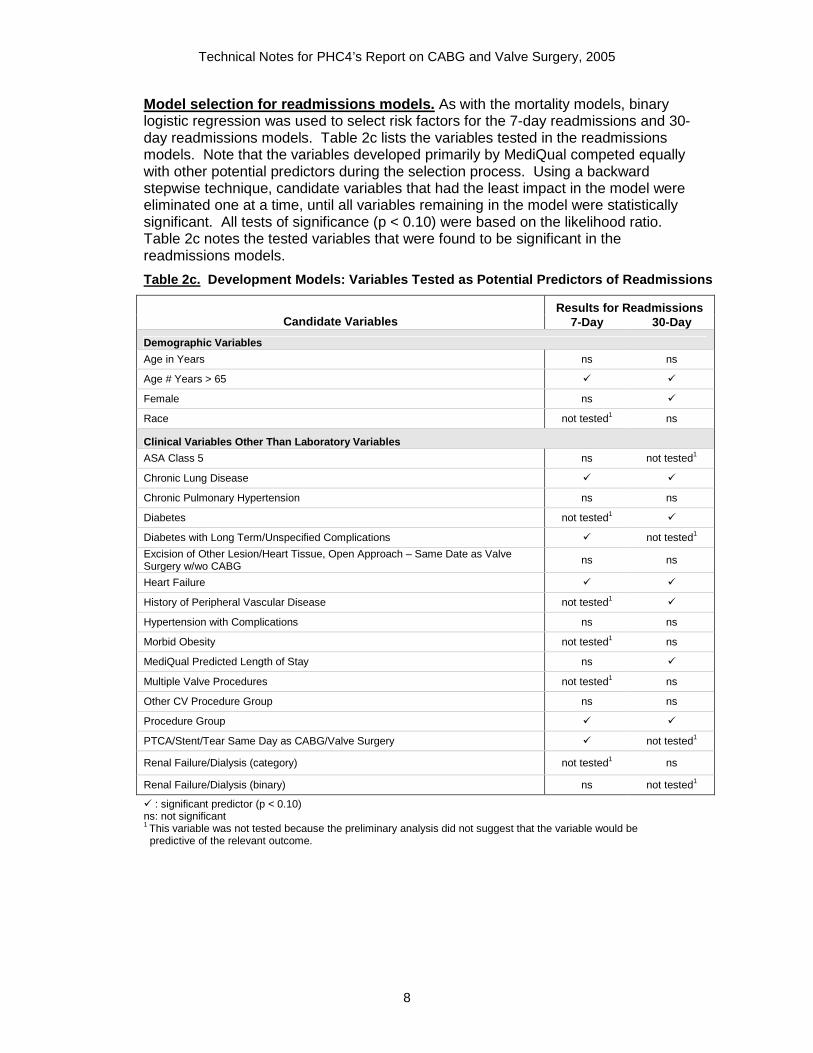
Model selection for readmissions models. As with the mortality models, binary logistic regression was used to select risk factors for the 7-day readmissions and 30-day readmissions models. Table 2c lists the variables tested in the readmissions models. Note that the variables developed primarily by MediQual competed equally with other potential predictors during the selection process. Using a backward stepwise technique, candidate variables that had the least impact in the model were eliminated one at a time, until all variables remaining in the model were statistically significant. All tests of significance (p < 0.10) were based on the likelihood ratio. Table 2c notes the tested variables that were found to be significant in the readmissions models.
Table 2c. Development Models: Variables Tested as Potential Predictors of Readmissions
Results for Readmissions Candidate Variables 7-Day 30-Day
Demographic Variables
Age in Years ns ns
Age # Years > 65 � �
Female ns �
Race not tested1 ns
Clinical Variables Other Than Laboratory Variables
ASA Class 5 ns not tested1
Chronic Lung Disease � �
Chronic Pulmonary Hypertension ns ns
Diabetes not tested1 �
Diabetes with Long Term/Unspecified Complications � not tested1
Excision of Other Lesion/Heart Tissue, Open Approach – Same Date as Valve Surgery w/wo CABG
ns ns
Heart Failure � �
History of Peripheral Vascular Disease not tested1 �
Hypertension with Complications ns ns
Morbid Obesity not tested1 ns
MediQual Predicted Length of Stay ns �
Multiple Valve Procedures not tested1 ns
Other CV Procedure Group ns ns
Procedure Group � �
PTCA/Stent/Tear Same Day as CABG/Valve Surgery � not tested1
Renal Failure/Dialysis (category) not tested1 ns
Renal Failure/Dialysis (binary) ns not tested1
� : significant predictor (p < 0.10) ns: not significant 1 This variable was not tested because the preliminary analysis did not suggest that the variable would be
predictive of the relevant outcome.
Technical Notes for PHC4’s Report on CABG and Valve Surgery, 2005
9
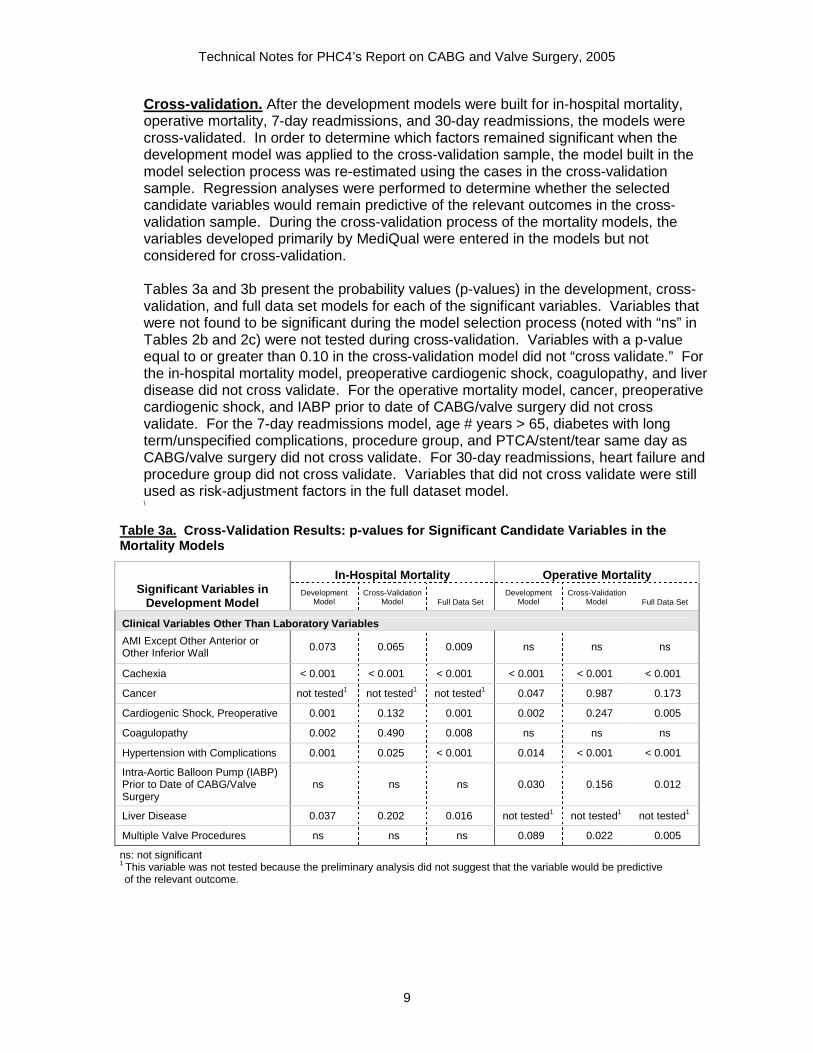
Cross-validation. After the development models were built for in-hospital mortality, operative mortality, 7-day readmissions, and 30-day readmissions, the models were cross-validated. In order to determine which factors remained significant when the development model was applied to the cross-validation sample, the model built in the model selection process was re-estimated using the cases in the cross-validation sample. Regression analyses were performed to determine whether the selected candidate variables would remain predictive of the relevant outcomes in the cross-validation sample. During the cross-validation process of the mortality models, the variables developed primarily by MediQual were entered in the models but not considered for cross-validation. Tables 3a and 3b present the probability values (p-values) in the development, cross-validation, and full data set models for each of the significant variables. Variables that were not found to be significant during the model selection process (noted with “ns” in Tables 2b and 2c) were not tested during cross-validation. Variables with a p-value equal to or greater than 0.10 in the cross-validation model did not “cross validate.” For the in-hospital mortality model, preoperative cardiogenic shock, coagulopathy, and liver disease did not cross validate. For the operative mortality model, cancer, preoperative cardiogenic shock, and IABP prior to date of CABG/valve surgery did not cross validate. For the 7-day readmissions model, age # years > 65, diabetes with long term/unspecified complications, procedure group, and PTCA/stent/tear same day as CABG/valve surgery did not cross validate. For 30-day readmissions, heart failure and procedure group did not cross validate. Variables that did not cross validate were still used as risk-adjustment factors in the full dataset model. \
Table 3a. Cross-Validation Results: p-values for Significant Candidate Variables in the Mortality Models
In-Hospital Mortality Operative Mortality Significant Variables in
Development Model Development
Model Cross-Validation
Model Full Data Set Development
Model Cross-Validation
Model Full Data Set
Clinical Variables Other Than Laboratory Variables
AMI Except Other Anterior or Other Inferior Wall
0.073 0.065 0.009 ns ns ns
Cachexia < 0.001 < 0.001 < 0.001 < 0.001 < 0.001 < 0.001
Cancer not tested1 not tested1 not tested1 0.047 0.987 0.173
Cardiogenic Shock, Preoperative 0.001 0.132 0.001 0.002 0.247 0.005
Coagulopathy 0.002 0.490 0.008 ns ns ns
Hypertension with Complications 0.001 0.025 < 0.001 0.014 < 0.001 < 0.001
Intra-Aortic Balloon Pump (IABP) Prior to Date of CABG/Valve Surgery
ns ns ns 0.030 0.156 0.012
Liver Disease 0.037 0.202 0.016 not tested1 not tested1 not tested1
Multiple Valve Procedures ns ns ns 0.089 0.022 0.005
ns: not significant 1 This variable was not tested because the preliminary analysis did not suggest that the variable would be predictive of the relevant outcome.
Technical Notes for PHC4’s Report on CABG and Valve Surgery, 2005
10
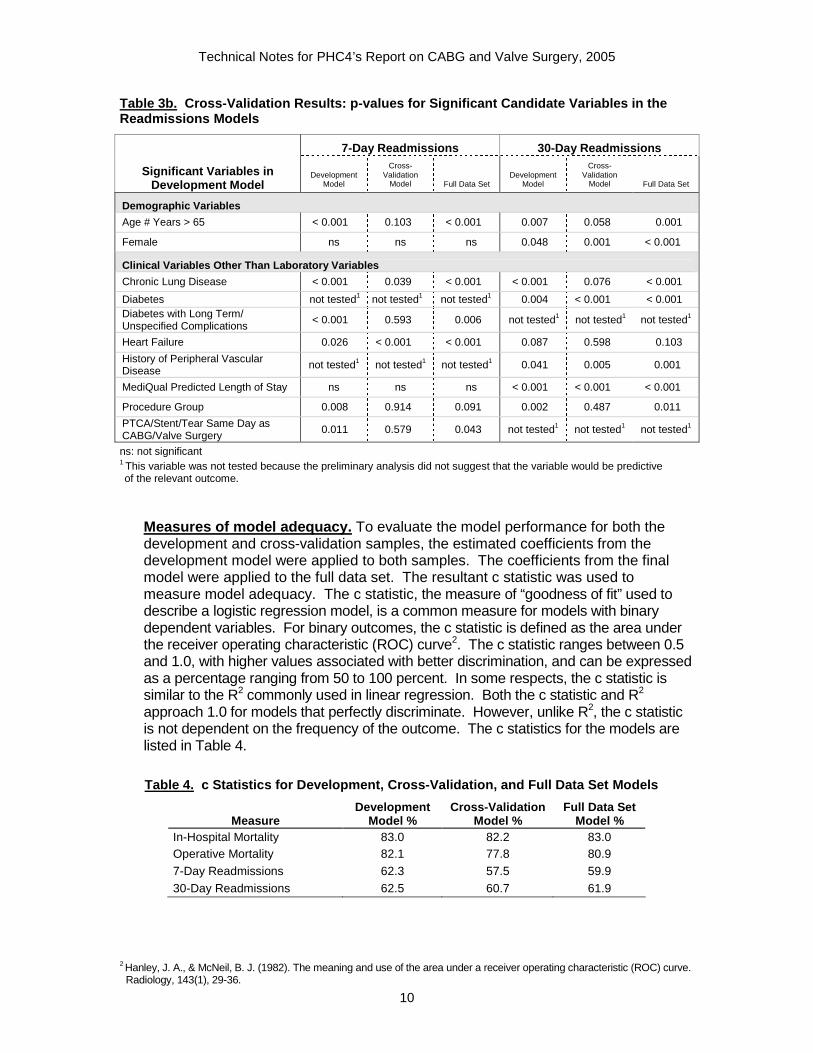
Table 3b. Cross-Validation Results: p-values for Significant Candidate Variables in the Readmissions Models
7-Day Readmissions 30-Day Readmissions
Significant Variables in Development Model
Development Model
Cross-Validation
Model Full Data Set Development
Model
Cross-Validation
Model Full Data Set
Demographic Variables
Age # Years > 65 < 0.001 0.103 < 0.001 0.007 0.058 0.001
Female ns ns ns 0.048 0.001 < 0.001
Clinical Variables Other Than Laboratory Variables
Chronic Lung Disease < 0.001 0.039 < 0.001 < 0.001 0.076 < 0.001
Diabetes not tested1 not tested1 not tested1 0.004 < 0.001 < 0.001 Diabetes with Long Term/ Unspecified Complications
< 0.001 0.593 0.006 not tested1 not tested1 not tested1
Heart Failure 0.026 < 0.001 < 0.001 0.087 0.598 0.103
History of Peripheral Vascular Disease not tested1 not tested1 not tested1 0.041 0.005 0.001
MediQual Predicted Length of Stay ns ns ns < 0.001 < 0.001 < 0.001
Procedure Group 0.008 0.914 0.091 0.002 0.487 0.011
PTCA/Stent/Tear Same Day as CABG/Valve Surgery
0.011 0.579 0.043 not tested1 not tested1 not tested1
ns: not significant 1 This variable was not tested because the preliminary analysis did not suggest that the variable would be predictive of the relevant outcome.
Measures of model adequacy. To evaluate the model performance for both the development and cross-validation samples, the estimated coefficients from the development model were applied to both samples. The coefficients from the final model were applied to the full data set. The resultant c statistic was used to measure model adequacy. The c statistic, the measure of “goodness of fit” used to describe a logistic regression model, is a common measure for models with binary dependent variables. For binary outcomes, the c statistic is defined as the area under the receiver operating characteristic (ROC) curve2. The c statistic ranges between 0.5 and 1.0, with higher values associated with better discrimination, and can be expressed as a percentage ranging from 50 to 100 percent. In some respects, the c statistic is similar to the R2 commonly used in linear regression. Both the c statistic and R2 approach 1.0 for models that perfectly discriminate. However, unlike R2, the c statistic is not dependent on the frequency of the outcome. The c statistics for the models are listed in Table 4.
Table 4. c Statistics for Development, Cross-Validation, and Full Data Set Models
Measure Development
Model % Cross-Validation
Model % Full Data Set
Model % In-Hospital Mortality 83.0 82.2 83.0 Operative Mortality 82.1 77.8 80.9 7-Day Readmissions 62.3 57.5 59.9 30-Day Readmissions 62.5 60.7 61.9
2 Hanley, J. A., & McNeil, B. J. (1982). The meaning and use of the area under a receiver operating characteristic (ROC) curve. Radiology, 143(1), 29-36.

Technical Notes for PHC4’s Report on CABG and Valve Surgery, 2005
11
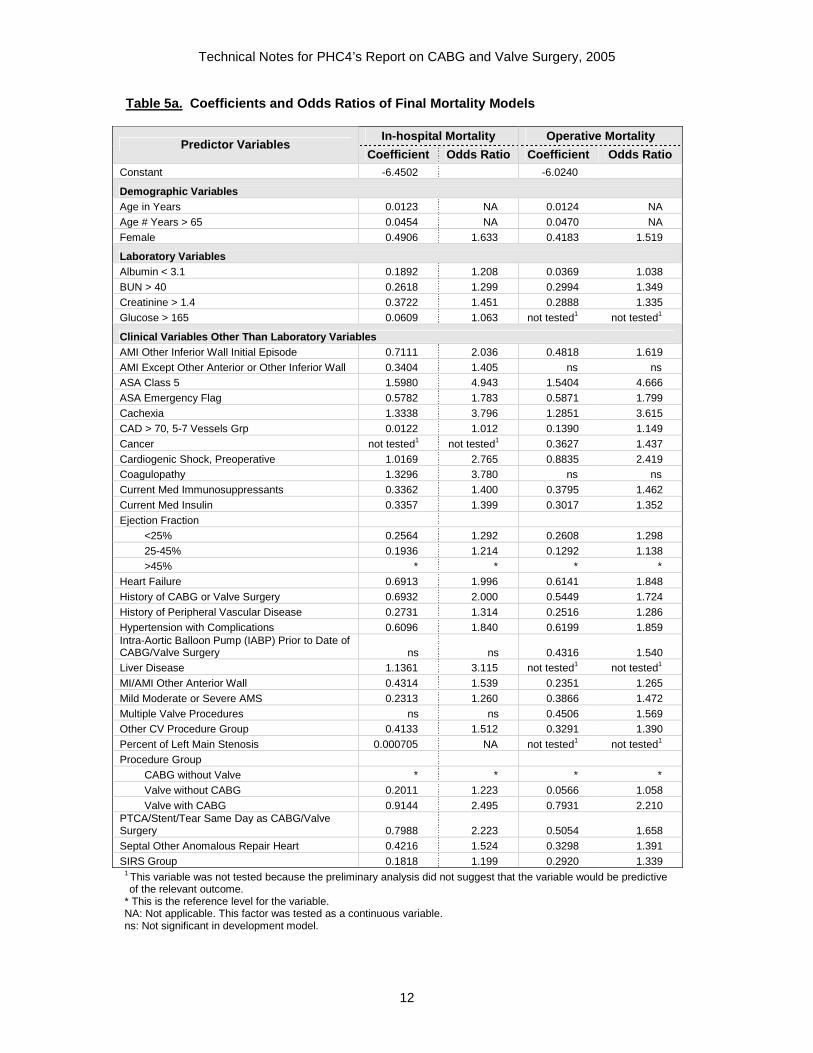
Coefficients and Odds Ratios The coefficients and odds ratios for each risk factor included in the final models are listed in Tables 5a and 5b. The entire data set was used in creating the final coefficients (i.e., the development sample and the cross-validation sample were “recombined”, and the coefficients were re-estimated). For a binary variable, the odds ratio is the change in the odds for a patient with the risk factor compared to a patient without it. For example, the odds ratio for ASA Class 5 is 4.943 for the in-hospital mortality model, meaning that a patient with an anesthesia class of five was almost 5 times as likely to die during the hospital admission as patients not assigned to this classification. Odds ratios are not applicable for continuous variables such as age in years and percent of left main stenosis.
Technical Notes for PHC4’s Report on CABG and Valve Surgery, 2005
12
Table 5a. Coefficients and Odds Ratios of Final Mortality Models
In-hospital Mortality Operative Mortality Predictor Variables
Coefficient Odds Ratio Coefficient Odds Ratio Constant -6.4502 -6.0240
Demographic Variables Age in Years 0.0123 NA 0.0124 NA
Age # Years > 65 0.0454 NA 0.0470 NA
Female 0.4906 1.633 0.4183 1.519
Laboratory Variables Albumin < 3.1 0.1892 1.208 0.0369 1.038 BUN > 40 0.2618 1.299 0.2994 1.349 Creatinine > 1.4 0.3722 1.451 0.2888 1.335 Glucose > 165 0.0609 1.063 not tested1 not tested1
Clinical Variables Other Than Laboratory Variables AMI Other Inferior Wall Initial Episode 0.7111 2.036 0.4818 1.619 AMI Except Other Anterior or Other Inferior Wall 0.3404 1.405 ns ns ASA Class 5 1.5980 4.943 1.5404 4.666 ASA Emergency Flag 0.5782 1.783 0.5871 1.799 Cachexia 1.3338 3.796 1.2851 3.615 CAD > 70, 5-7 Vessels Grp 0.0122 1.012 0.1390 1.149 Cancer not tested1 not tested1 0.3627 1.437 Cardiogenic Shock, Preoperative 1.0169 2.765 0.8835 2.419 Coagulopathy 1.3296 3.780 ns ns Current Med Immunosuppressants 0.3362 1.400 0.3795 1.462 Current Med Insulin 0.3357 1.399 0.3017 1.352 Ejection Fraction
<25% 0.2564 1.292 0.2608 1.298 25-45% 0.1936 1.214 0.1292 1.138 >45% * * * *
Heart Failure 0.6913 1.996 0.6141 1.848 History of CABG or Valve Surgery 0.6932 2.000 0.5449 1.724 History of Peripheral Vascular Disease 0.2731 1.314 0.2516 1.286 Hypertension with Complications 0.6096 1.840 0.6199 1.859 Intra-Aortic Balloon Pump (IABP) Prior to Date of CABG/Valve Surgery ns ns 0.4316 1.540 Liver Disease 1.1361 3.115 not tested1 not tested1 MI/AMI Other Anterior Wall 0.4314 1.539 0.2351 1.265 Mild Moderate or Severe AMS 0.2313 1.260 0.3866 1.472 Multiple Valve Procedures ns ns 0.4506 1.569 Other CV Procedure Group 0.4133 1.512 0.3291 1.390 Percent of Left Main Stenosis 0.000705 NA not tested1 not tested1 Procedure Group
CABG without Valve * * * * Valve without CABG 0.2011 1.223 0.0566 1.058 Valve with CABG 0.9144 2.495 0.7931 2.210
PTCA/Stent/Tear Same Day as CABG/Valve Surgery 0.7988 2.223 0.5054 1.658 Septal Other Anomalous Repair Heart 0.4216 1.524 0.3298 1.391 SIRS Group 0.1818 1.199 0.2920 1.339
1 This variable was not tested because the preliminary analysis did not suggest that the variable would be predictive of the relevant outcome.
* This is the reference level for the variable. NA: Not applicable. This factor was tested as a continuous variable. ns: Not significant in development model.
Technical Notes for PHC4’s Report on CABG and Valve Surgery, 2005
13
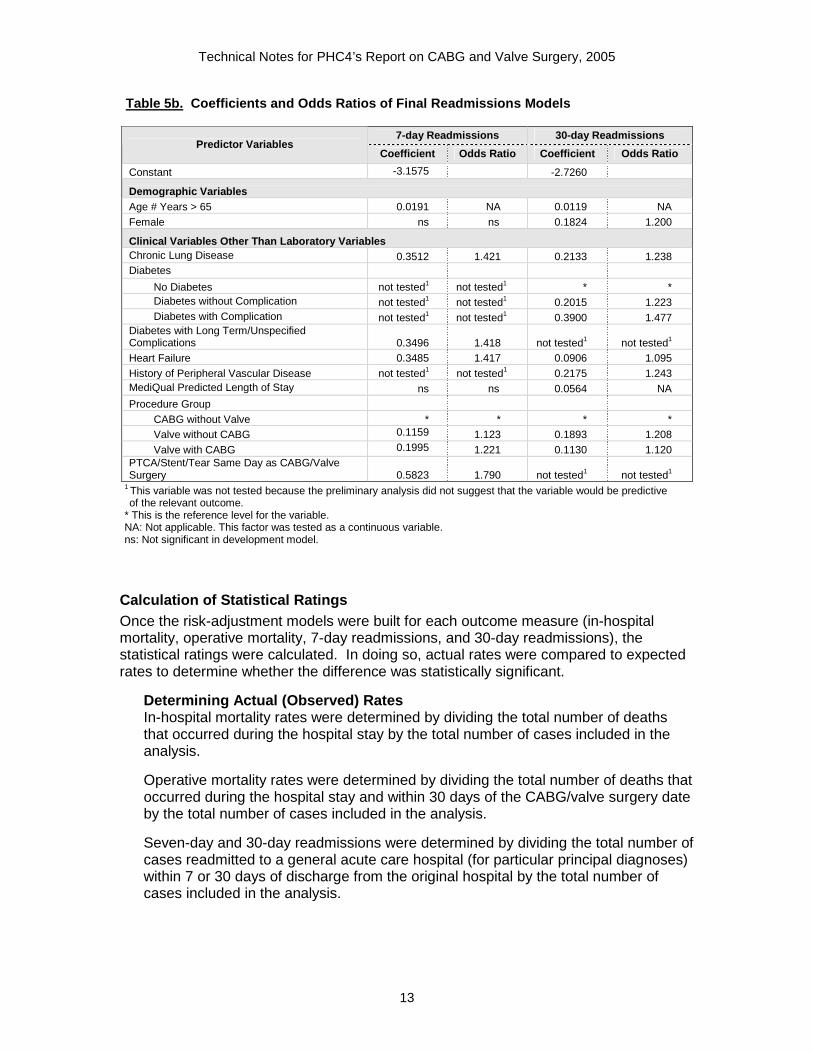
Table 5b. Coefficients and Odds Ratios of Final Readmissions Models
7-day Readmissions 30-day Readmissions Predictor Variables
Coefficient Odds Ratio Coefficient Odds Ratio
Constant -3.1575 -2.7260
Demographic Variables Age # Years > 65 0.0191 NA 0.0119 NA
Female ns ns 0.1824 1.200
Clinical Variables Other Than Laboratory Variables Chronic Lung Disease 0.3512 1.421 0.2133 1.238 Diabetes
No Diabetes not tested1 not tested1 * * Diabetes without Complication not tested1 not tested1 0.2015 1.223 Diabetes with Complication not tested1 not tested1 0.3900 1.477
Diabetes with Long Term/Unspecified Complications 0.3496 1.418 not tested1 not tested1 Heart Failure 0.3485 1.417 0.0906 1.095 History of Peripheral Vascular Disease not tested1 not tested1 0.2175 1.243 MediQual Predicted Length of Stay ns ns 0.0564 NA
Procedure Group CABG without Valve * * * * Valve without CABG 0.1159 1.123 0.1893 1.208 Valve with CABG 0.1995 1.221 0.1130 1.120
PTCA/Stent/Tear Same Day as CABG/Valve Surgery 0.5823 1.790 not tested1 not tested1
1 This variable was not tested because the preliminary analysis did not suggest that the variable would be predictive of the relevant outcome.
* This is the reference level for the variable. NA: Not applicable. This factor was tested as a continuous variable. ns: Not significant in development model.
Calculation of Statistical Ratings Once the risk-adjustment models were built for each outcome measure (in-hospital mortality, operative mortality, 7-day readmissions, and 30-day readmissions), the statistical ratings were calculated. In doing so, actual rates were compared to expected rates to determine whether the difference was statistically significant.
Determining Actual (Observed) Rates In-hospital mortality rates were determined by dividing the total number of deaths that occurred during the hospital stay by the total number of cases included in the analysis.
Operative mortality rates were determined by dividing the total number of deaths that occurred during the hospital stay and within 30 days of the CABG/valve surgery date by the total number of cases included in the analysis.
Seven-day and 30-day readmissions were determined by dividing the total number of cases readmitted to a general acute care hospital (for particular principal diagnoses) within 7 or 30 days of discharge from the original hospital by the total number of cases included in the analysis.

Technical Notes for PHC4’s Report on CABG and Valve Surgery, 2005
14
Determining Expected Rates The first step in calculating the expected rates was to estimate the probability of each of the relevant events occurring for each patient, that is: 1) the probability of in-hospital death, 2) the probability of death in the hospital or within 30 days, 3) the probability of being readmitted within 7 days, and 4) the probability of being readmitted within 30 days. The probability of each of these events occurring was estimated by using the statistical technique of logistic regression. In logistic regression each category for each clinical or demographic risk factor was assigned a coefficient or “weight.” A factor category’s weight was higher (or lower) if patients with that factor category tended to have a higher (or lower) chance of the event occurring. These weights, determined using the statewide CABG and valve data set, were used to estimate each individual patient's probability of in-hospital death, operative death (in-hospital or within 30 days), or 7-day or 30-day readmissions given the risk factors of the patient. (Note that coefficients are displayed in Tables 5a and 5b in the “Coefficients and Odds Ratios” section.)
The results for all patients were then summed to determine the expected number of in-hospital deaths, deaths in the hospital or within 30 days, and readmissions within 7 days or 30 days for a given hospital/surgeon. The expected rate was calculated by dividing the total number of expected events by the total number of cases in the analysis.
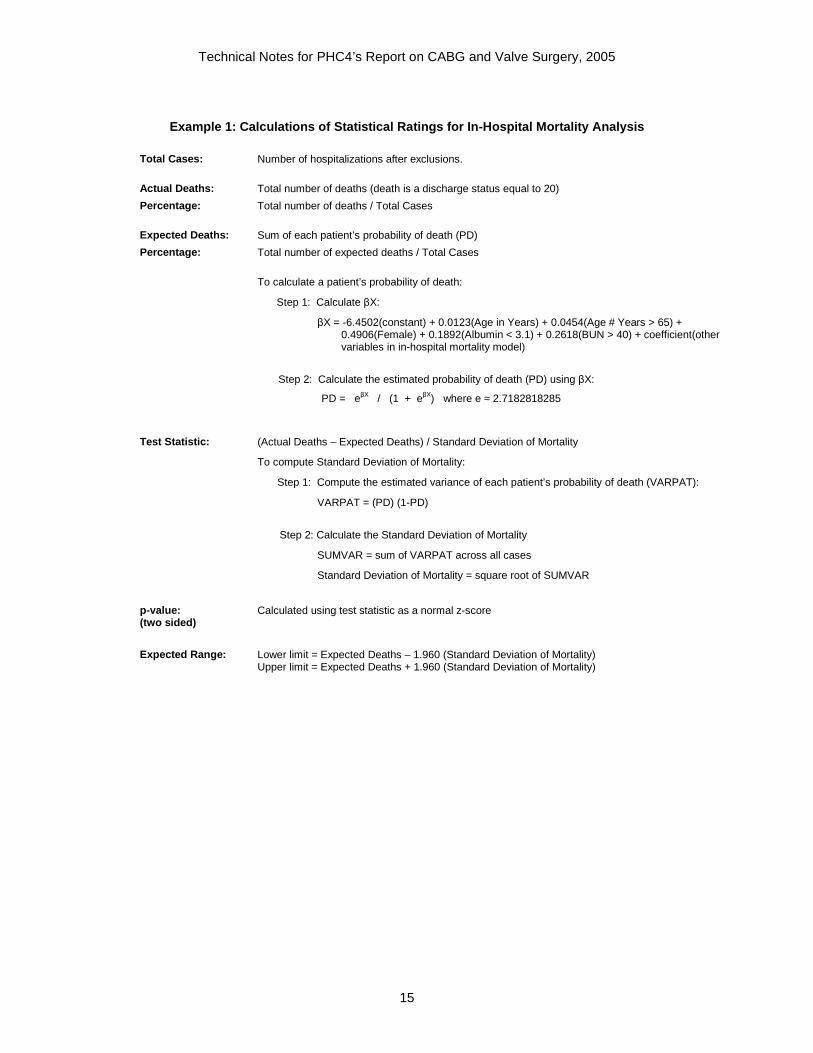
The following example of the in-hospital mortality analysis illustrates the calculations used in determining the statistical ratings. Similar calculations apply to operative mortality and 7-day and 30-day readmissions.
Technical Notes for PHC4’s Report on CABG and Valve Surgery, 2005
15
Example 1: Calculations of Statistical Ratings for In-Hospital Mortality Analysis
Total Cases: Number of hospitalizations after exclusions.
Actual Deaths: Total number of deaths (death is a discharge status equal to 20)
Percentage: Total number of deaths / Total Cases
Expected Deaths: Sum of each patient’s probability of death (PD)
Percentage: Total number of expected deaths / Total Cases
To calculate a patient’s probability of death:
Step 1: Calculate βX:
βX = -6.4502(constant) + 0.0123(Age in Years) + 0.0454(Age # Years > 65) + 0.4906(Female) + 0.1892(Albumin < 3.1) + 0.2618(BUN > 40) + coefficient(other variables in in-hospital mortality model)
Step 2: Calculate the estimated probability of death (PD) using βX:
PD = eβX / (1 + eβX) where e ≈ 2.7182818285
Test Statistic: (Actual Deaths – Expected Deaths) / Standard Deviation of Mortality
To compute Standard Deviation of Mortality:
Step 1: Compute the estimated variance of each patient’s probability of death (VARPAT):
VARPAT = (PD) (1-PD)
Step 2: Calculate the Standard Deviation of Mortality
SUMVAR = sum of VARPAT across all cases
Standard Deviation of Mortality = square root of SUMVAR
p-value: (two sided)
Calculated using test statistic as a normal z-score
Expected Range:
Lower limit = Expected Deaths – 1.960 (Standard Deviation of Mortality) Upper limit = Expected Deaths + 1.960 (Standard Deviation of Mortality)
Technical Notes for PHC4’s Report on CABG and Valve Surgery, 2005
16
POST-SURGICAL LENGTH OF STAY ANALYSIS
Risk-Adjustment Methodology
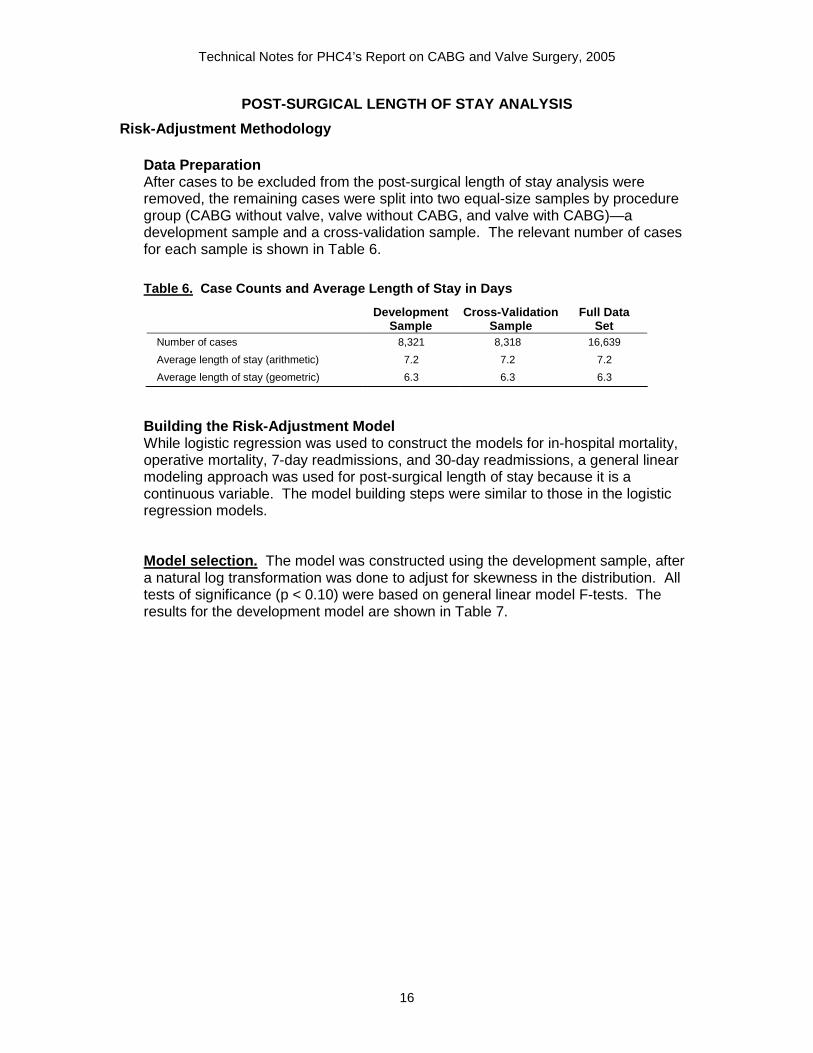
Data Preparation After cases to be excluded from the post-surgical length of stay analysis were removed, the remaining cases were split into two equal-size samples by procedure group (CABG without valve, valve without CABG, and valve with CABG)—a development sample and a cross-validation sample. The relevant number of cases for each sample is shown in Table 6.
Table 6. Case Counts and Average Length of Stay in Days
Development
Sample Cross- Validation
Sample Full Data
Set Number of cases 8,321 8,318 16,639
Average length of stay (arithmetic) 7.2 7.2 7.2
Average length of stay (geometric) 6.3 6.3 6.3
Building the Risk-Adjustment Model While logistic regression was used to construct the models for in-hospital mortality, operative mortality, 7-day readmissions, and 30-day readmissions, a general linear modeling approach was used for post-surgical length of stay because it is a continuous variable. The model building steps were similar to those in the logistic regression models. Model selection. The model was constructed using the development sample, after a natural log transformation was done to adjust for skewness in the distribution. All tests of significance (p < 0.10) were based on general linear model F-tests. The results for the development model are shown in Table 7.

Technical Notes for PHC4’s Report on CABG and Valve Surgery, 2005
17
Table 7. Development Model: Variables Tested as Potential Predictors of Post-Surgical Length of Stay
Candidate Variables
Results
Demographic Variables
Age in Years �
Age # Years > 65 �
Female �
Race �
Clinical Variables Other Than Laboratory Variables
Acute Myocardial Infarction (AMI) ns
Anemia �
Cachexia �
Cancer ns
Cardiogenic Shock, Preoperative �
Chronic Lung Disease �
Chronic Pulmonary Hypertension ns
Coagulopathy �
Diabetes with Long Term/Unspecified Complications �
Excision of Other Lesion/Heart Tissue, Open Approach – Same Date as Valve Surgery w/wo CABG ns
Heart Failure �
History of CABG or Valve Surgery ns
Hypertension with Complications �
Intra-Aortic Balloon Pump (IABP) Prior to Date of CABG/Valve Surgery �
Liver Disease �
MediQual Predicted Length of Stay �
Multiple Valve Procedures �
Other Open Heart Procedure �
Procedure Group �
PTCA/Stent Same Day as CABG/Valve Surgery �
Renal Failure/Dialysis (binary) �
� : significant predictor (p < 0.10) ns: not significant
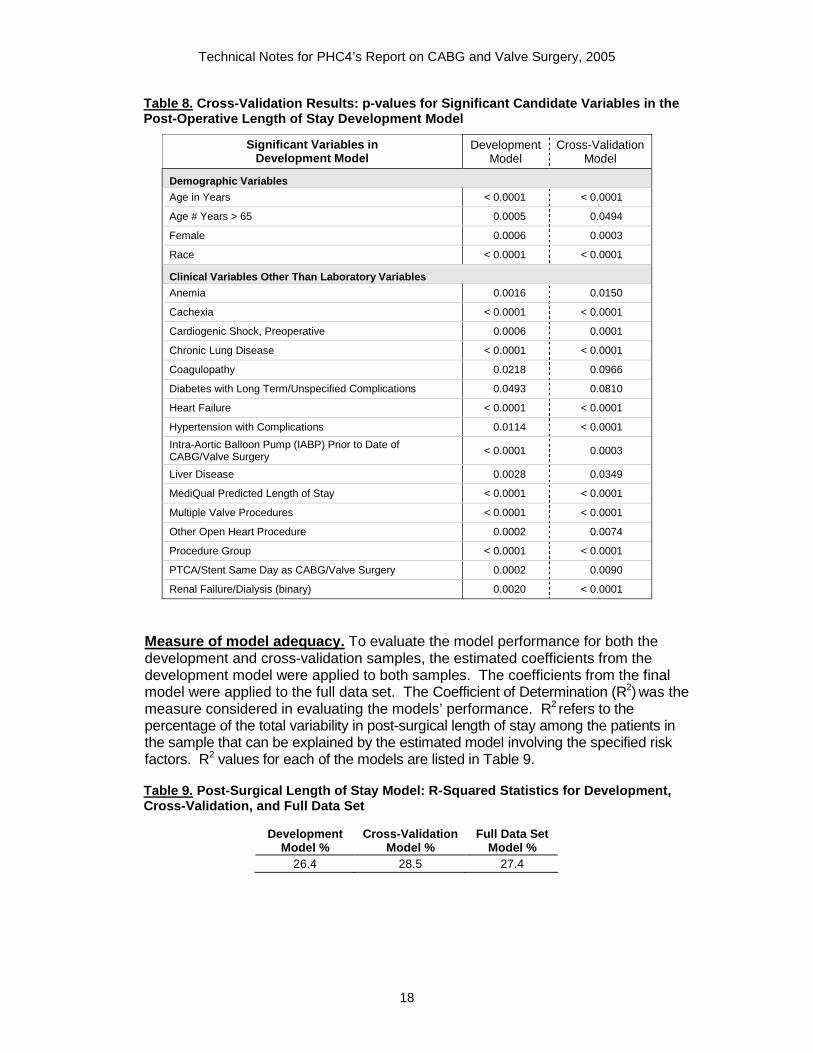
Cross-validation. After the development model was built for post-surgical length of stay, the model was cross-validated. In order to determine which factors remained significant when the development model was applied to the cross-validation sample, the model built in the model selection process was re-estimated using the cases in the cross-validation sample. Table 8 presents the probability values (p-values) in the development and cross validation samples for each of the significant variables. All candidate variables that were significant in the development model did cross validate.
Technical Notes for PHC4’s Report on CABG and Valve Surgery, 2005
18
Table 8. Cross-Validation Results: p-values for Significant Candidate Variables in the Post-Operative Length of Stay Development Model
Significant Variables in Development Model
Development Model
Cross-Validation Model
Demographic Variables
Age in Years < 0.0001 < 0.0001
Age # Years > 65 0.0005 0.0494
Female 0.0006 0.0003
Race < 0.0001 < 0.0001
Clinical Variables Other Than Laboratory Variables
Anemia 0.0016 0.0150
Cachexia < 0.0001 < 0.0001
Cardiogenic Shock, Preoperative 0.0006 0.0001
Chronic Lung Disease < 0.0001 < 0.0001
Coagulopathy 0.0218 0.0966
Diabetes with Long Term/Unspecified Complications 0.0493 0.0810
Heart Failure < 0.0001 < 0.0001
Hypertension with Complications 0.0114 < 0.0001
Intra-Aortic Balloon Pump (IABP) Prior to Date of CABG/Valve Surgery < 0.0001 0.0003
Liver Disease 0.0028 0.0349
MediQual Predicted Length of Stay < 0.0001 < 0.0001
Multiple Valve Procedures < 0.0001 < 0.0001
Other Open Heart Procedure 0.0002 0.0074
Procedure Group < 0.0001 < 0.0001
PTCA/Stent Same Day as CABG/Valve Surgery 0.0002 0.0090
Renal Failure/Dialysis (binary) 0.0020 < 0.0001
Measure of model adequacy. To evaluate the model performance for both the development and cross-validation samples, the estimated coefficients from the development model were applied to both samples. The coefficients from the final model were applied to the full data set. The Coefficient of Determination (R2) was the measure considered in evaluating the models’ performance. R2 refers to the percentage of the total variability in post-surgical length of stay among the patients in the sample that can be explained by the estimated model involving the specified risk factors. R2 values for each of the models are listed in Table 9.
Table 9. Post-Surgical Length of Stay Model: R-Squared Statistics for Development, Cross-Validation, and Full Data Set
Development
Model % Cross-Validation
Model % Full Data Set
Model % 26.4 28.5 27.4
Technical Notes for PHC4’s Report on CABG and Valve Surgery, 2005
19
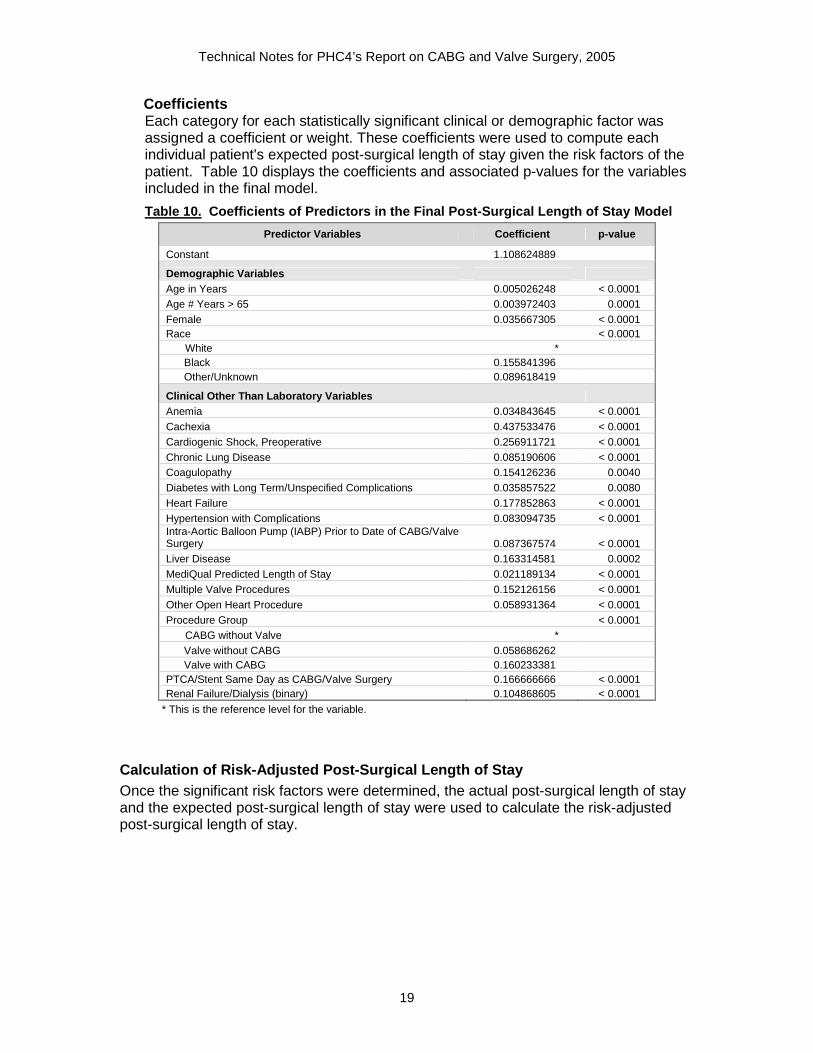
Coefficients Each category for each statistically significant clinical or demographic factor was assigned a coefficient or weight. These coefficients were used to compute each individual patient's expected post-surgical length of stay given the risk factors of the patient. Table 10 displays the coefficients and associated p-values for the variables included in the final model.
Table 10. Coefficients of Predictors in the Final Post-Surgical Length of Stay Model
Predictor Variables Coefficient p-value
Constant 1.108624889
Demographic Variables Age in Years 0.005026248 < 0.0001 Age # Years > 65 0.003972403 0.0001 Female 0.035667305 < 0.0001 Race < 0.0001
White * Black 0.155841396 Other/Unknown 0.089618419
Clinical Other Than Laboratory Variables Anemia 0.034843645 < 0.0001 Cachexia 0.437533476 < 0.0001 Cardiogenic Shock, Preoperative 0.256911721 < 0.0001 Chronic Lung Disease 0.085190606 < 0.0001 Coagulopathy 0.154126236 0.0040 Diabetes with Long Term/Unspecified Complications 0.035857522 0.0080 Heart Failure 0.177852863 < 0.0001 Hypertension with Complications 0.083094735 < 0.0001 Intra-Aortic Balloon Pump (IABP) Prior to Date of CABG/Valve Surgery 0.087367574 < 0.0001 Liver Disease 0.163314581 0.0002 MediQual Predicted Length of Stay 0.021189134 < 0.0001 Multiple Valve Procedures 0.152126156 < 0.0001 Other Open Heart Procedure 0.058931364 < 0.0001 Procedure Group < 0.0001
CABG without Valve * Valve without CABG 0.058686262 Valve with CABG 0.160233381
PTCA/Stent Same Day as CABG/Valve Surgery 0.166666666 < 0.0001 Renal Failure/Dialysis (binary) 0.104868605 < 0.0001
* This is the reference level for the variable. Calculation of Risk-Adjusted Post-Surgical Length o f Stay Once the significant risk factors were determined, the actual post-surgical length of stay and the expected post-surgical length of stay were used to calculate the risk-adjusted post-surgical length of stay.

Technical Notes for PHC4’s Report on CABG and Valve Surgery, 2005
20
Actual Length of Stay The actual post-surgical length of stay was derived by subtracting the CABG/valve procedure date from the discharge date. The average post-surgical length of stay is reported as a geometric mean1, rather than an arithmetic mean.
Expected Length of Stay Coefficients in the final model were summed to compute each individual patient's expected length of stay, given the risk factors of the patient. The coefficient for a category represented the estimated difference in mean (log) length of stay for the category compared to the base category of that factor. Thus, the coefficient for the base category of a factor was always 0. When dealing with categorical variables in the length of stay model there was no particular importance to the order of these categories. The constant term in the model represents the predicted value for all categorical factors at the base level. The coefficients for the other levels within a factor represent adjustments to that “baseline.” No adjustment was required at the base level for any factor, because it was already accounted for in the constant. For example, a patient without heart failure had a “0” or “baseline” coefficient; while a patient with heart failure would be adjusted upward by 0.177852863 (see Table 10). The order was not important because each ordering scheme would result in different coefficients, but the estimated difference between any pairs of levels would be the same (i.e., the difference between heart failure and no heart failure would always be 0.177852863 independent of what the specific coefficients were for each). For quantitative factor age, there is always an adjustment because the “baseline” is 0.
Risk-Adjusted Post-Surgical Length of Stay Post-surgical length of stay is reported in average days instead of a statistical rating. Unlike other measures (such as mortality where a lower number of deaths is obviously better than a higher number), it is not known whether shorter lengths of stay are “better” than longer lengths of stay or vice versa. Reporting the average length of stay in days, therefore, presents information that can be used to examine differences in lengths of stay without taking a position on what is “best.” The following example illustrates the complete calculation.
1 Because a natural log transformation of each length of stay value was done to adjust for skewness in the distribution, it was necessary to convert the logarithm values back to days when reporting or displaying post-surgical length of stay. This process results in geometric means, rather than arithmetic means. Unlike an arithmetic mean that is derived by summing individual values and dividing by the number of observations, a geometric mean is calculated by multiplying the individual values and taking the nth root of the product. Geometric means are averages and are the natural result when using the log transformation.
Technical Notes for PHC4’s Report on CABG and Valve Surgery, 2005
21
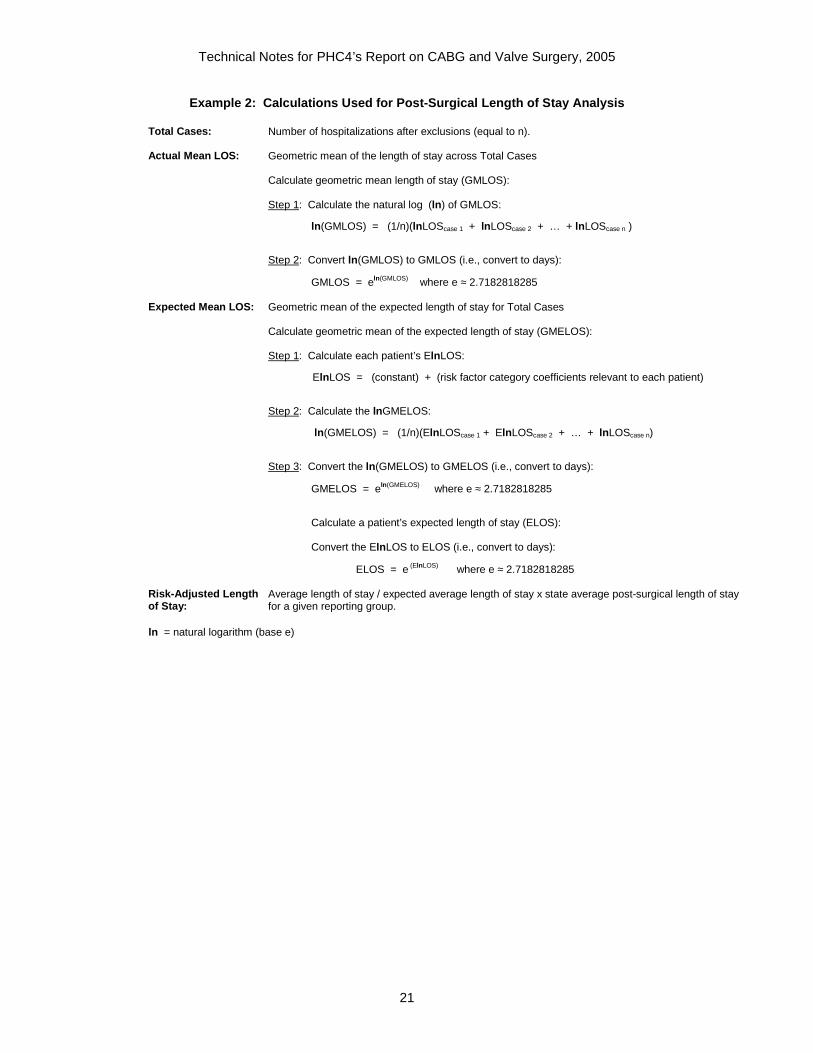
Example 2: Calculations Used for Post-Surgical Length of Stay Analysis
Total Cases: Number of hospitalizations after exclusions (equal to n).
Actual Mean LOS: Geometric mean of the length of stay across Total Cases Calculate geometric mean length of stay (GMLOS): Step 1: Calculate the natural log (ln ) of GMLOS: ln (GMLOS) = (1/n)(lnLOScase 1 + lnLOScase 2 + … + lnLOScase n ) Step 2: Convert ln (GMLOS) to GMLOS (i.e., convert to days): GMLOS = eln (GMLOS) where e ≈ 2.7182818285
Expected Mean LOS: Geometric mean of the expected length of stay for Total Cases Calculate geometric mean of the expected length of stay (GMELOS): Step 1: Calculate each patient’s ElnLOS: ElnLOS = (constant) + (risk factor category coefficients relevant to each patient) Step 2: Calculate the lnGMELOS: ln (GMELOS) = (1/n)(ElnLOScase 1 + ElnLOScase 2 + … + lnLOScase n) Step 3: Convert the ln (GMELOS) to GMELOS (i.e., convert to days): GMELOS = eln (GMELOS) where e ≈ 2.7182818285 Calculate a patient’s expected length of stay (ELOS): Convert the ElnLOS to ELOS (i.e., convert to days): ELOS = e (ElnLOS) where e ≈ 2.7182818285
Risk-Adjusted Length of Stay:
Average length of stay / expected average length of stay x state average post-surgical length of stay for a given reporting group.
ln = natural logarithm (base e)
Technical Notes for PHC4’s Report on CABG and Valve Surgery, 2005
22
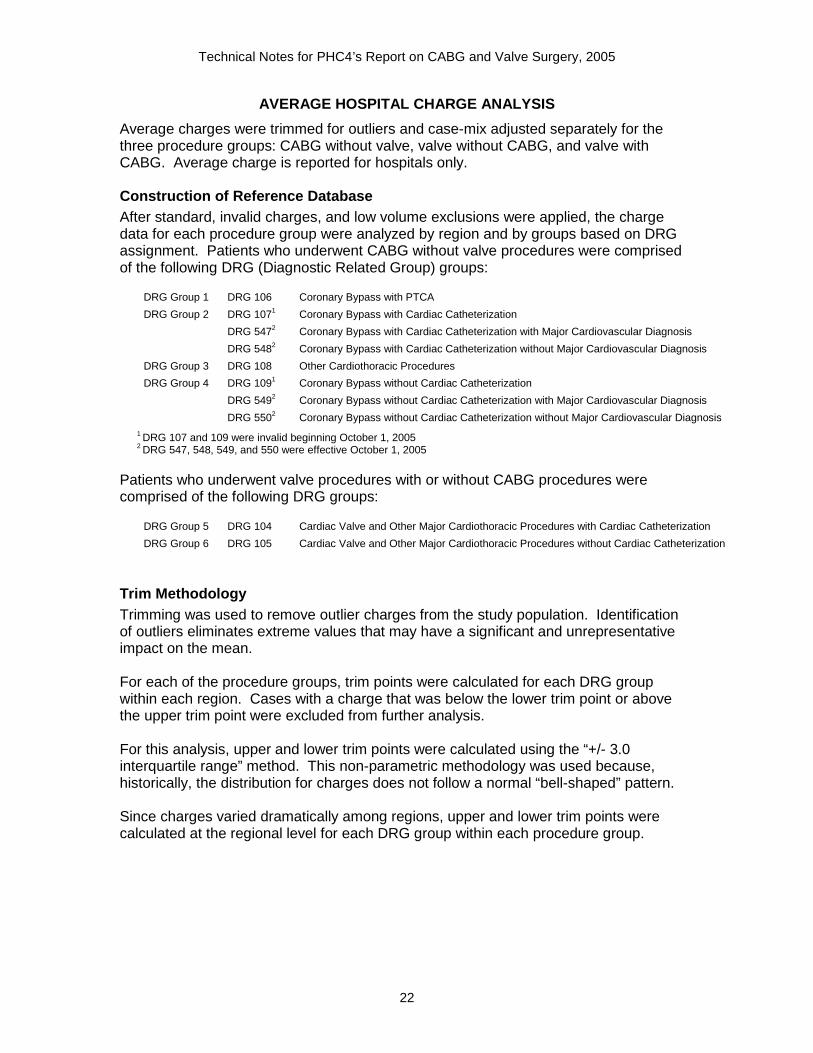
AVERAGE HOSPITAL CHARGE ANALYSIS
Average charges were trimmed for outliers and case-mix adjusted separately for the three procedure groups: CABG without valve, valve without CABG, and valve with CABG. Average charge is reported for hospitals only. Construction of Reference Database After standard, invalid charges, and low volume exclusions were applied, the charge data for each procedure group were analyzed by region and by groups based on DRG assignment. Patients who underwent CABG without valve procedures were comprised of the following DRG (Diagnostic Related Group) groups:
DRG Group 1 DRG 106 Coronary Bypass with PTCA
DRG 1071 Coronary Bypass with Cardiac Catheterization
DRG 5472 Coronary Bypass with Cardiac Catheterization with Major Cardiovascular Diagnosis
DRG Group 2
DRG 5482 Coronary Bypass with Cardiac Catheterization without Major Cardiovascular Diagnosis
DRG Group 3 DRG 108 Other Cardiothoracic Procedures
DRG 1091 Coronary Bypass without Cardiac Catheterization
DRG 5492 Coronary Bypass without Cardiac Catheterization with Major Cardiovascular Diagnosis
DRG Group 4
DRG 5502 Coronary Bypass without Cardiac Catheterization without Major Cardiovascular Diagnosis 1 DRG 107 and 109 were invalid beginning October 1, 2005 2 DRG 547, 548, 549, and 550 were effective October 1, 2005
Patients who underwent valve procedures with or without CABG procedures were comprised of the following DRG groups:
DRG Group 5 DRG 104 Cardiac Valve and Other Major Cardiothoracic Procedures with Cardiac Catheterization
DRG Group 6 DRG 105 Cardiac Valve and Other Major Cardiothoracic Procedures without Cardiac Catheterization
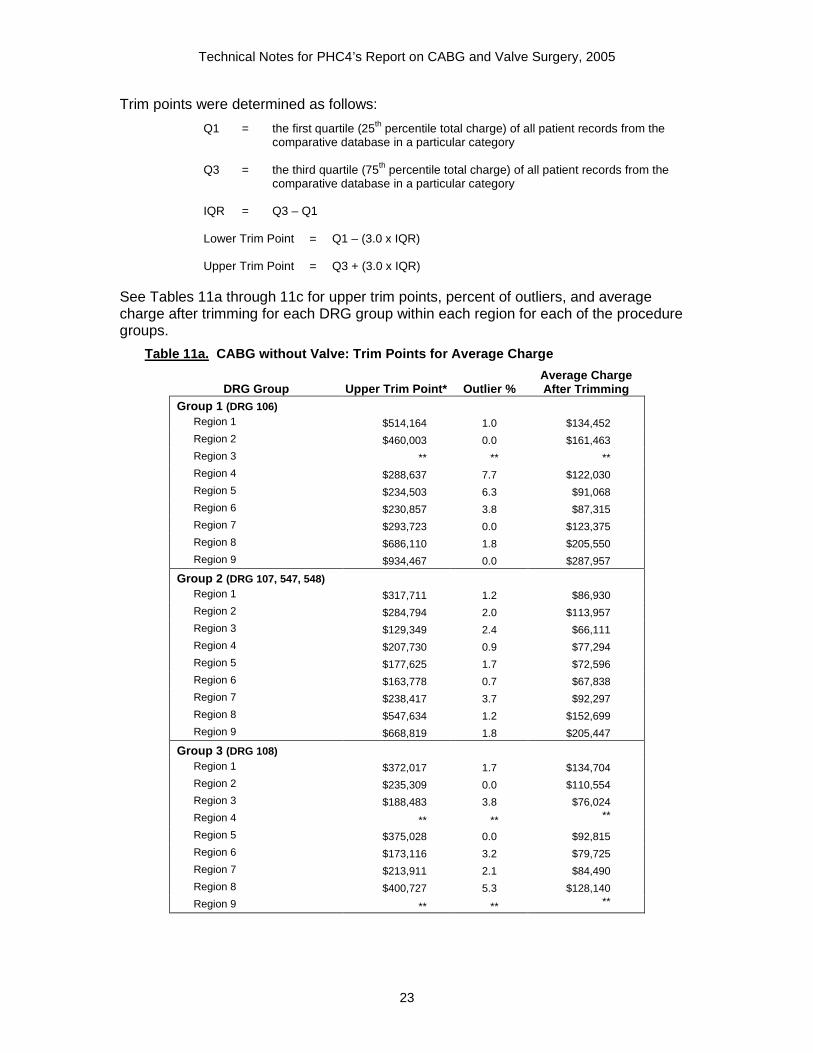
Trim Methodology Trimming was used to remove outlier charges from the study population. Identification of outliers eliminates extreme values that may have a significant and unrepresentative impact on the mean. For each of the procedure groups, trim points were calculated for each DRG group within each region. Cases with a charge that was below the lower trim point or above the upper trim point were excluded from further analysis. For this analysis, upper and lower trim points were calculated using the “+/- 3.0 interquartile range” method. This non-parametric methodology was used because, historically, the distribution for charges does not follow a normal “bell-shaped” pattern. Since charges varied dramatically among regions, upper and lower trim points were calculated at the regional level for each DRG group within each procedure group.
Technical Notes for PHC4’s Report on CABG and Valve Surgery, 2005
23
Trim points were determined as follows:
Q1 = the first quartile (25th percentile total charge) of all patient records from the comparative database in a particular category
Q3 = the third quartile (75th percentile total charge) of all patient records from the comparative database in a particular category
IQR = Q3 – Q1
Lower Trim Point = Q1 – (3.0 x IQR)
Upper Trim Point = Q3 + (3.0 x IQR) See Tables 11a through 11c for upper trim points, percent of outliers, and average charge after trimming for each DRG group within each region for each of the procedure groups.
Table 11a. CABG without Valve: Trim Points for Average Charge
DRG Group Upper Trim Point* Outlier % Average Charge After Trimming
Group 1 (DRG 106) Region 1 $514,164 1.0 $134,452
Region 2 $460,003 0.0 $161,463
Region 3 ** ** **
Region 4 $288,637 7.7 $122,030
Region 5 $234,503 6.3 $91,068
Region 6 $230,857 3.8 $87,315
Region 7 $293,723 0.0 $123,375
Region 8 $686,110 1.8 $205,550
Region 9 $934,467 0.0 $287,957
Group 2 (DRG 107, 547, 548)
Region 1 $317,711 1.2 $86,930
Region 2 $284,794 2.0 $113,957
Region 3 $129,349 2.4 $66,111
Region 4 $207,730 0.9 $77,294
Region 5 $177,625 1.7 $72,596
Region 6 $163,778 0.7 $67,838
Region 7 $238,417 3.7 $92,297
Region 8 $547,634 1.2 $152,699
Region 9 $668,819 1.8 $205,447
Group 3 (DRG 108)
Region 1 $372,017 1.7 $134,704
Region 2 $235,309 0.0 $110,554
Region 3 $188,483 3.8 $76,024
Region 4 ** ** **
Region 5 $375,028 0.0 $92,815
Region 6 $173,116 3.2 $79,725
Region 7 $213,911 2.1 $84,490
Region 8 $400,727 5.3 $128,140
Region 9 ** ** **

Technical Notes for PHC4’s Report on CABG and Valve Surgery, 2005
24
Table 11a. continued
DRG Group Upper Trim Point* Outlier % Average Charge After Trimming
Group 4 (DRG 109, 549, 550)
Region 1 $351,993 0.8 $84,912
Region 2 $171,866 3.3 $79,561
Region 3 $85,710 1.5 $49,117
Region 4 $144,733 3.2 $60,635
Region 5 $130,571 2.9 $53,890
Region 6 $109,859 1.7 $45,808
Region 7 $165,279 7.9 $64,609
Region 8 $357,544 0.5 $109,321
Region 9 $622,695 0.9 $173,226 * Charges of less than $10,000 were considered invalid. Therefore, with the exception of Group 4
in Region 3, there were no lower trim points. The lower trim point for Group 4 in Region 3 was $11,204.
** These regions under the DRG group were excluded from analysis due to low volume.
Table 11b. Valve without CABG: Trim Points for Average Charge
DRG Group Upper Trim Point* Outlier % Average Charge After Trimming
Group 5 (DRG 104)
Region 1 $520,142 1.3 $149,014
Region 2 $444,688 2.8 $163,666
Region 3 $227,337 2.5 $92,233
Region 4 $387,862 0.0 $127,811
Region 5 $245,921 3.4 $96,121
Region 6 $229,462 2.4 $95,536
Region 7 $371,970 1.1 $125,590
Region 8 $667,513 1.1 $217,027
Region 9 $859,504 0.0 $266,726
Group 6 (DRG 105)
Region 1 $413,432 0.5 $111,255
Region 2 $246,473 5.8 $100,838
Region 3 $170,114 3.2 $72,736
Region 4 $334,194 1.1 $113,065
Region 5 $148,180 3.6 $66,438
Region 6 $173,366 0.9 $71,698
Region 7 $241,280 3.3 $90,595
Region 8 $466,089 1.4 $155,036
Region 9 $581,332 1.9 $183,671
*Charges of less than $10,000 were considered invalid; therefore, there were no lower trim points.
Technical Notes for PHC4’s Report on CABG and Valve Surgery, 2005
25
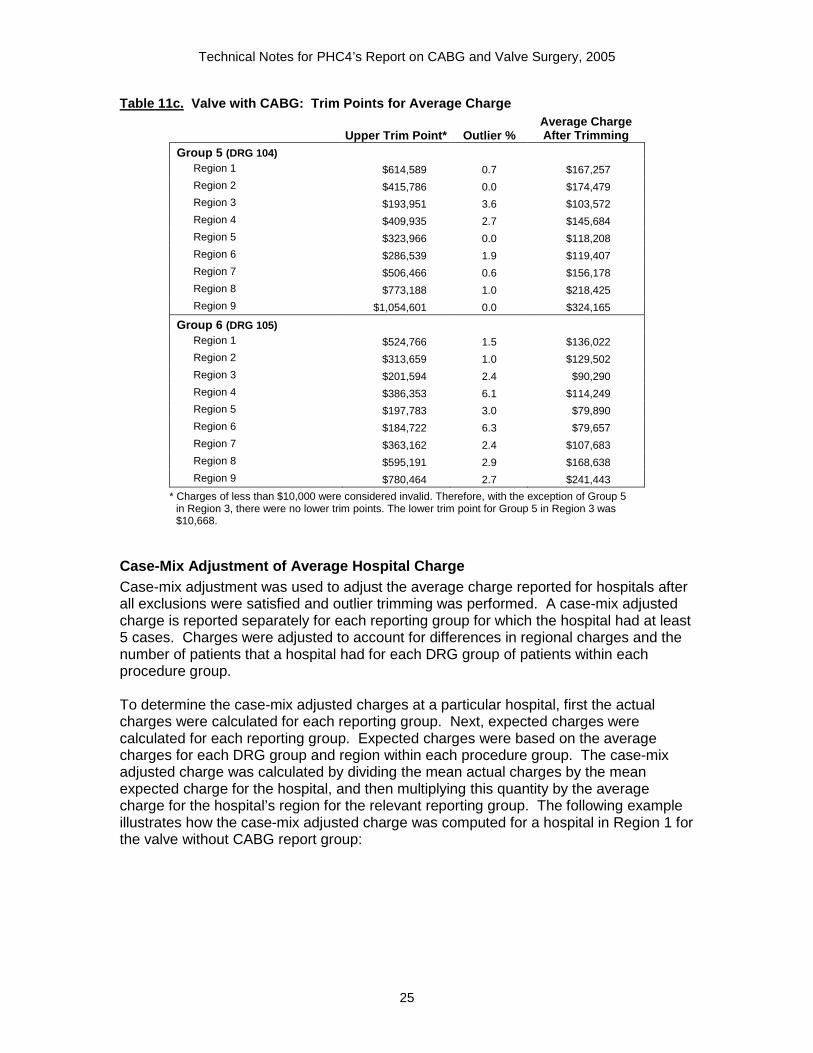
Table 11c. Valve with CABG: Trim Points for Average Charge
Upper Trim Point* Outlier % Average Charge After Trimming
Group 5 (DRG 104)
Region 1 $614,589 0.7 $167,257
Region 2 $415,786 0.0 $174,479
Region 3 $193,951 3.6 $103,572
Region 4 $409,935 2.7 $145,684
Region 5 $323,966 0.0 $118,208
Region 6 $286,539 1.9 $119,407
Region 7 $506,466 0.6 $156,178
Region 8 $773,188 1.0 $218,425
Region 9 $1,054,601 0.0 $324,165
Group 6 (DRG 105)
Region 1 $524,766 1.5 $136,022
Region 2 $313,659 1.0 $129,502
Region 3 $201,594 2.4 $90,290
Region 4 $386,353 6.1 $114,249
Region 5 $197,783 3.0 $79,890
Region 6 $184,722 6.3 $79,657
Region 7 $363,162 2.4 $107,683
Region 8 $595,191 2.9 $168,638
Region 9 $780,464 2.7 $241,443
* Charges of less than $10,000 were considered invalid. Therefore, with the exception of Group 5 in Region 3, there were no lower trim points. The lower trim point for Group 5 in Region 3 was $10,668.
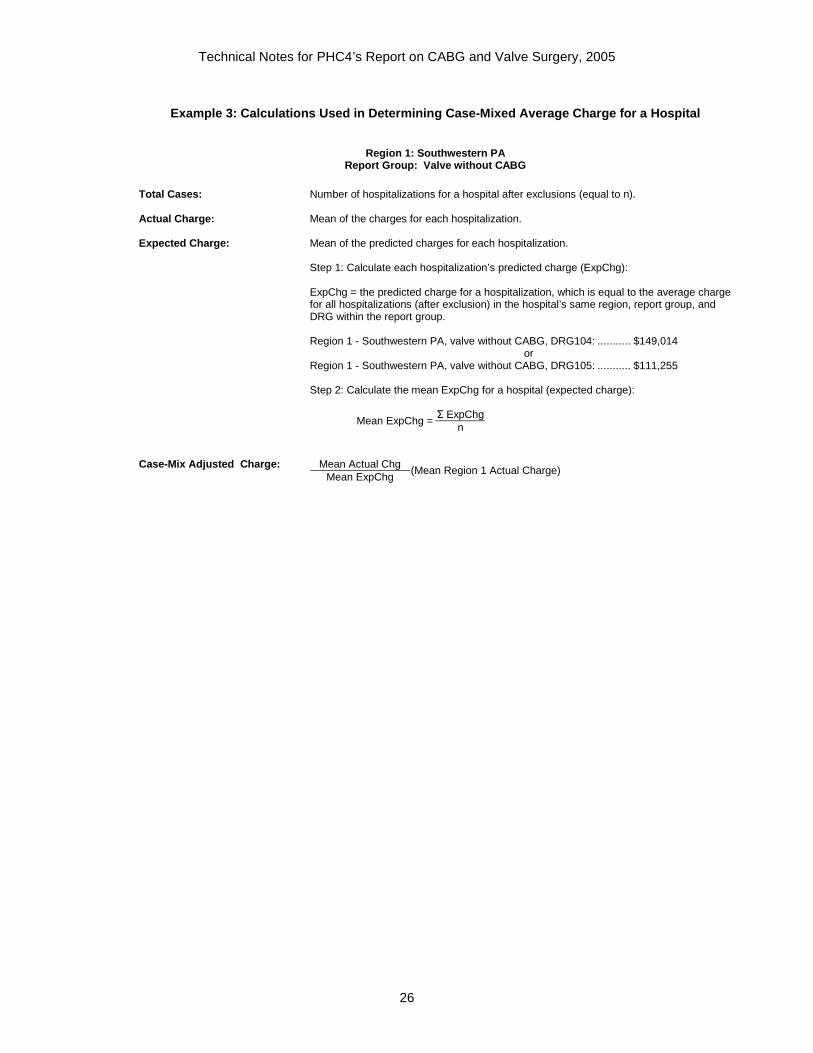
Case-Mix Adjustment of Average Hospital Charge Case-mix adjustment was used to adjust the average charge reported for hospitals after all exclusions were satisfied and outlier trimming was performed. A case-mix adjusted charge is reported separately for each reporting group for which the hospital had at least 5 cases. Charges were adjusted to account for differences in regional charges and the number of patients that a hospital had for each DRG group of patients within each procedure group. To determine the case-mix adjusted charges at a particular hospital, first the actual charges were calculated for each reporting group. Next, expected charges were calculated for each reporting group. Expected charges were based on the average charges for each DRG group and region within each procedure group. The case-mix adjusted charge was calculated by dividing the mean actual charges by the mean expected charge for the hospital, and then multiplying this quantity by the average charge for the hospital’s region for the relevant reporting group. The following example illustrates how the case-mix adjusted charge was computed for a hospital in Region 1 for the valve without CABG report group:
Technical Notes for PHC4’s Report on CABG and Valve Surgery, 2005
26
Example 3: Calculations Used in Determining Case-Mixed Average Charge for a Hospital
Region 1: Southwestern PA Report Group : Valve without CABG
Total Cases: Number of hospitalizations for a hospital after exclusions (equal to n). Actual Charge: Mean of the charges for each hospitalization. Expected Charge: Mean of the predicted charges for each hospitalization. Step 1: Calculate each hospitalization’s predicted charge (ExpChg):
ExpChg = the predicted charge for a hospitalization, which is equal to the average charge for all hospitalizations (after exclusion) in the hospital’s same region, report group, and DRG within the report group.
Region 1 - Southwestern PA, valve without CABG, DRG104: ........... $149,014
or Region 1 - Southwestern PA, valve without CABG, DRG105: ........... $111,255
Step 2: Calculate the mean ExpChg for a hospital (expected charge):
Σ ExpChg Mean ExpChg =
n Case-Mix Adjusted Charge: Mean Actual Chg
Mean ExpChg (Mean Region 1 Actual Charge)
Technical Notes for PHC4’s Report on CABG and Valve Surgery, 2005
27
AVERAGE PAYMENT ANALYSIS
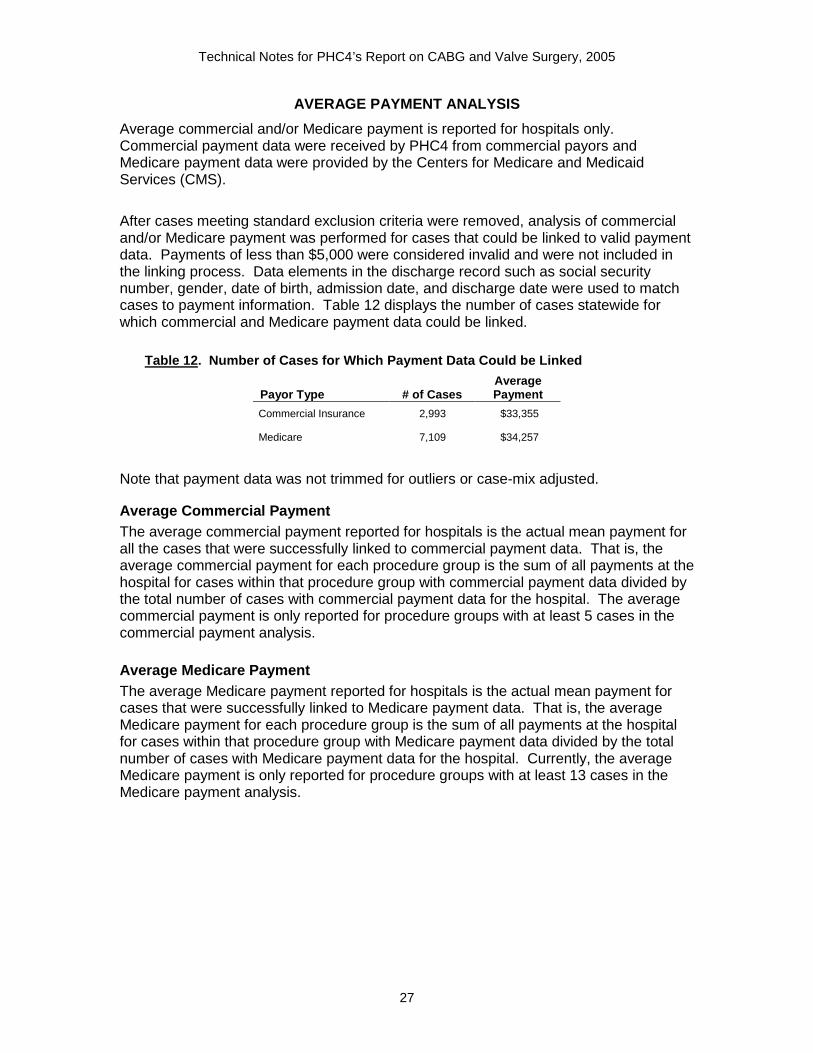
Average commercial and/or Medicare payment is reported for hospitals only. Commercial payment data were received by PHC4 from commercial payors and Medicare payment data were provided by the Centers for Medicare and Medicaid Services (CMS). After cases meeting standard exclusion criteria were removed, analysis of commercial and/or Medicare payment was performed for cases that could be linked to valid payment data. Payments of less than $5,000 were considered invalid and were not included in the linking process. Data elements in the discharge record such as social security number, gender, date of birth, admission date, and discharge date were used to match cases to payment information. Table 12 displays the number of cases statewide for which commercial and Medicare payment data could be linked.
Table 12. Number of Cases for Which Payment Data Could be Linked
Payor Type # of Cases Average Payment
Commercial Insurance 2,993 $33,355
Medicare 7,109 $34,257
Note that payment data was not trimmed for outliers or case-mix adjusted. Average Commercial Payment The average commercial payment reported for hospitals is the actual mean payment for all the cases that were successfully linked to commercial payment data. That is, the average commercial payment for each procedure group is the sum of all payments at the hospital for cases within that procedure group with commercial payment data divided by the total number of cases with commercial payment data for the hospital. The average commercial payment is only reported for procedure groups with at least 5 cases in the commercial payment analysis. Average Medicare Payment The average Medicare payment reported for hospitals is the actual mean payment for cases that were successfully linked to Medicare payment data. That is, the average Medicare payment for each procedure group is the sum of all payments at the hospital for cases within that procedure group with Medicare payment data divided by the total number of cases with Medicare payment data for the hospital. Currently, the average Medicare payment is only reported for procedure groups with at least 13 cases in the Medicare payment analysis.

APPENDICES

Technical Notes for PHC4’s Report on CABG and Valve Surgery, 2005
APPENDIX A: EXCLUSION DEFINTIONS
29
Table A. Major Organ Transplants ICD-9-CM Code Description Procedure code in any position: 37.51, 37.52, 37.53 Heart transplant
33.50. 33.51, 33.52 Lung transplant
33.6 Combined heart and lung transplant
55.61, 55.69 Kidney transplant
50.51, 50.59 Liver transplant
Table B. Study DRGs (Diagnostic Related Groups): Cases not in the following DRGs were excluded from the study CABG without Valve DRG 103 Heart Transplant or Implant of Heart Assist System
DRG 106 Coronary Bypass with PTCA
DRG 1071 Coronary Bypass with Cardiac Catheterization
DRG 108 Other Cardiothoracic Procedures
DRG 1091 Coronary Bypass without Cardiac Catheterization
DRG 515 Cardiac Defibrillator Implant without Cardiac Catheterization
DRG 525 Other Heart Assist System Implant
DRG 535 Cardiac Defibrillator Implant with Cardiac Catheterization with Acute Myocardial Infarction, Heart Failure, or Shock
DRG 536 Cardiac Defibrillator Implant with Cardiac Catheterization without Acute Myocardial Infarction, Heart Failure, or Shock
DRG 5412 and MDC 5
Tracheostomy with Mechanical Ventilation 96+ Hours or Principal Diagnosis Except Face, Mouth, Neck with Major O.R. Procedures
DRG 5473 Coronary Bypass with Cardiac Catheterization with Major Cardiovascular Diagnosis
DRG 5483 Coronary Bypass with Cardiac Catheterization without Major Cardiovascular Diagnosis
DRG 5493 Coronary Bypass without Cardiac Catheterization with Major Cardiovascular Diagnosis
DRG 5503 Coronary Bypass without Cardiac Catheterization without Major Cardiovascular Diagnosis
Valve with CABG, Valve without CABG DRG 103 Heart Transplant or Implant of Heart Assist System
DRG 104 Cardiac Valve and Other Major Cardiothoracic Procedures with Cardiac Catheterization
DRG 105 Cardiac Valve and Other Major Cardiothoracic Procedures without Cardiac Catheterization
DRG 108 Other Cardiothoracic Procedures
DRG 515 Cardiac Defibrillator Implant without Cardiac Catheterization
DRG 525 Other Heart Assist System Implant
DRG 535 Cardiac Defibrillator Implant with Cardiac Catheterization with Acute Myocardial Infarction, Heart Failure, or Shock
DRG 536 Cardiac Defibrillator Implant with Cardiac Catheterization without Acute Myocardial Infarction, Heart Failure, or Shock
DRG 5412 and MDC 5
Tracheostomy with Mechanical Ventilation 96+ Hours or Principal Diagnosis Except Face, Mouth, Neck with Major O.R. Procedures
1 DRG 107 are 109 were invalid beginning October 1, 2005 2 DRG 541 has an updated description and an additional procedure, Extracorporeal membrane oxygenation (code 39.65), effective October 1, 2005
3 DRG 547, 548, 549, and 550 were effective October 1, 2005
Technical Notes for PHC4’s Report on CABG and Valve Surgery, 2005
APPENDIX A: EXCLUSION DEFINTIONS continued
30
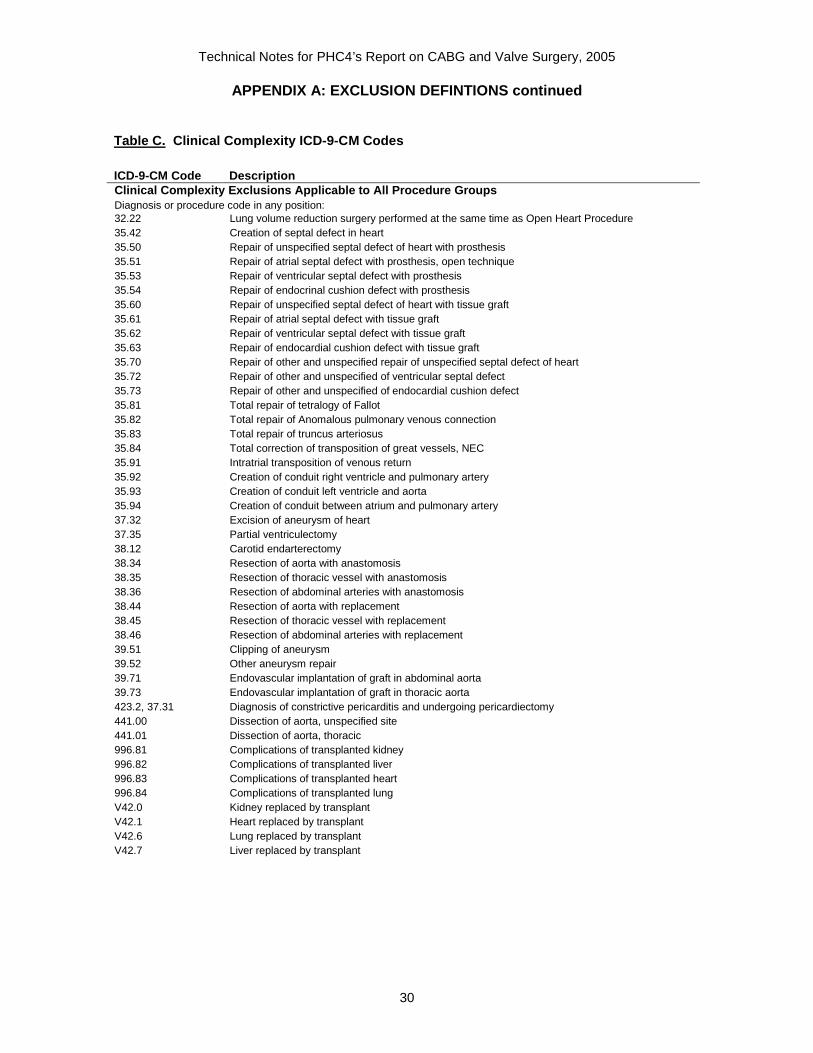
Table C. Clinical Complexity ICD-9-CM Codes ICD-9-CM Code Description Clinical Complexity Exclusions Applicable to All Procedure Groups Diagnosis or procedure code in any position: 32.22 Lung volume reduction surgery performed at the same time as Open Heart Procedure 35.42 Creation of septal defect in heart 35.50 Repair of unspecified septal defect of heart with prosthesis 35.51 Repair of atrial septal defect with prosthesis, open technique 35.53 Repair of ventricular septal defect with prosthesis 35.54 Repair of endocrinal cushion defect with prosthesis 35.60 Repair of unspecified septal defect of heart with tissue graft 35.61 Repair of atrial septal defect with tissue graft 35.62 Repair of ventricular septal defect with tissue graft 35.63 Repair of endocardial cushion defect with tissue graft 35.70 Repair of other and unspecified repair of unspecified septal defect of heart 35.72 Repair of other and unspecified of ventricular septal defect 35.73 Repair of other and unspecified of endocardial cushion defect 35.81 Total repair of tetralogy of Fallot 35.82 Total repair of Anomalous pulmonary venous connection 35.83 Total repair of truncus arteriosus 35.84 Total correction of transposition of great vessels, NEC 35.91 Intratrial transposition of venous return 35.92 Creation of conduit right ventricle and pulmonary artery 35.93 Creation of conduit left ventricle and aorta 35.94 Creation of conduit between atrium and pulmonary artery 37.32 Excision of aneurysm of heart 37.35 Partial ventriculectomy 38.12 Carotid endarterectomy 38.34 Resection of aorta with anastomosis 38.35 Resection of thoracic vessel with anastomosis 38.36 Resection of abdominal arteries with anastomosis 38.44 Resection of aorta with replacement 38.45 Resection of thoracic vessel with replacement 38.46 Resection of abdominal arteries with replacement 39.51 Clipping of aneurysm 39.52 Other aneurysm repair 39.71 Endovascular implantation of graft in abdominal aorta 39.73 Endovascular implantation of graft in thoracic aorta 423.2, 37.31 Diagnosis of constrictive pericarditis and undergoing pericardiectomy 441.00 Dissection of aorta, unspecified site 441.01 Dissection of aorta, thoracic 996.81 Complications of transplanted kidney 996.82 Complications of transplanted liver 996.83 Complications of transplanted heart 996.84 Complications of transplanted lung V42.0 Kidney replaced by transplant V42.1 Heart replaced by transplant V42.6 Lung replaced by transplant V42.7 Liver replaced by transplant

Technical Notes for PHC4’s Report on CABG and Valve Surgery, 2005
APPENDIX A: EXCLUSION DEFINTIONS continued
31
Table C. Clinical Complexity ICD-9-CM Codes continued ICD-9-CM Code Description Clinical Complexity Exclusions Applicable to CABG without Valve Procedure Group Procedure code in any position: 35.31 Operations on papillary muscle 35.32 Operations on chordae tendineae 35.34 Infundibulectomy 35.35 Operations on trabeculae carneae cordis 35.39 Operations on other structures adjacent to valves of heart 35.71 Other and unspecified repair of atrial septal defect 35.95 Revision of corrective procedure on heart 35.98 Other operations on septa of heart 36.91 Repair of aneurysm of coronary vessel 37.33 Excision or destruction of other lesion or tissue of heart, open approach
Clinical Complexity Exclusions Applicable to Valve without CABG Procedure Group Principal diagnosis position only: 038.x, 38.xx Septicemia 421.0 Acute and subacute bacterial endocarditis 421.1 Acute and subacute infective endocarditis, diseases classified elsewhere 421.9 Acute endocarditis, unspecified 424.90 Endocarditis, valve unspecified, unspecified cause 424.91 Endocarditis in diseases classified elsewhere 424.99 Endocarditis, valve unspecified 996.02 Mechanical complication due to heart valve prosthesis 996.61 Infection and inflammatory reaction due to cardiac device/implant/graft 996.71 Other complications due to heart valve prosthesis
Diagnosis code in any position: 277.3, 425.7 Amyloidosis plus nutritional & metabolic cardiomyopathy (both codes must be present) 414.10 Aneurysm of heart (wall) 414.19 Aneurysm of heart Clinical Complexity Exclusions Applicable to Valve with CABG Procedure Group Principal diagnosis position only: 038.x, 38.xx Septicemia 421.0 Acute and subacute bacterial endocarditis 421.1 Acute and subacute infective endocarditis, diseases classified elsewhere 421.9 Acute endocarditis, unspecified 424.90 Endocarditis, valve unspecified, unspecified cause 424.91 Endocarditis in diseases classified elsewhere 424.99 Endocarditis, valve unspecified 996.02 Mechanical complication of cardiac device, implant, and graft due to heart valve prosthesis 996.61 Infection and inflammatory reaction due to cardiac device/implant/graft 996.71 Other complication of internal prosthetic device due to heart valve prosthesis
Diagnosis code in any position: 277.3, 425.7 Amyloidosis plus nutritional & metabolic cardiomyopathy (both codes must be present) 414.10 Aneurysm of heart (wall) 414.19 Other aneurysm of heart
Procedure code in any position: 35.95 Revision of corrective procedure on heart 35.98 Other operations on septa of heart 36.91 Repair of aneurysm of coronary vessel

Technical Notes for PHC4’s Report on CABG and Valve Surgery, 2005
APPENDIX B: EXCLUSION DATA
32
Specific cases were excluded from the analysis. Exclusion criteria that were relevant to all outcome measures (i.e., standard exclusions) were first applied to the in-hospital mortality analysis (see Table A below). For the other outcome measures in the report, additional exclusion criteria were applied as appropriate.
Table A. Exclusions for In-Hospital Mortality Analysis
Cases In-Hospital Mortality # % # % Total cases prior to in-hospital mortality exclusions 19,271 100.0 682 3.5
Exclusions:
• Patients < 30 years of age 127 0.7 7 5.5
• Patients who left against medical advice 18 0.1 0 0.0
• Clinically complex cases1 1,795 9.3 168 9.4
Total exclusions 1,940 10.1 175 9.0
Total cases remaining in analysis 17,331 89.9 507 2.9 1 Clinically complex cases included major organ transplant cases (see Appendix A, Table A), cases not in the study DRGs (See Appendix A, Table B for DRGs in the study), and clinically complex cases based on ICD-9-CM codes (see Appendix A, Table C), and cases granted special request for exclusion.
Table B. Additional Exclusions for Operative Mortality Analysis
Cases Operative Mortality # % # % Total cases after in-hospital mortality exclusions 17,331 100.0 — —
Additional Exclusions:
• Cases with invalid/inconsistent data1 91 0.5 — —
• Out-of state residents2 1,496 8.6 — —
Total exclusions 1,587 9.2 — —
Total cases remaining in analysis 15,744 90.8 546 3.5 1 Cases with invalid/inconsistent data (i.e., social security number, date of birth, or sex) could not be linked to death certificate information.
2 Out-of-state residents were excluded because death certificate data was not available for these patients.
Table C. Additional Exclusions for 7-day and 30-day Readmissions Analyses
Cases Readmissions # % 7-day % 30-day % Total cases after in-hospital mortality exclusions 17,331 100.0 — —
Additional exclusions:
• Patients who died during hospitalization in which surgery was performed 507 2.9 — —
• Cases with invalid/inconsistent data1 84 0.5 — —
• Out-of state residents2 1,443 8.3 — —
Total exclusions 2,034 11.7 — —
Total cases remaining in analysis 15,297 88.3 6.0 15.0 1 Cases with invalid/inconsistent data (i.e., social security number, date of birth, or sex) could not be linked to subsequent hospitalizations.
2 Out-of-state residents were excluded because such patients could undergo a CABG and/or valve surgery in a Pennsylvania hospital, return to their home, and be readmitted there. Therefore, readmission data would not be available for these patients.

Technical Notes for PHC4’s Report on CABG and Valve Surgery, 2005
APPENDIX B: EXCLUSION DATA continued
33
Table D. Additional Exclusions for Post-Surgical Length of Stay (LOS) Analysis
Cases
# %
Average Post-Surgical LOS in Days
Total cases after in-hospital mortality exclusions 17,331 100.0 —
Additional exclusions:
• Patients who died during hospitalization in which surgery was performed 507 2.9 —
• Cases that were length of stay outliers 185 1.1 —
Total exclusions 692 4.0 —
Total cases remaining in analysis 16,639 96.0 7.2 Table E. Additional Exclusions for Average Hospital Charge Analysis
Cases # %
Average Charge
Total cases after in-hospital mortality exclusions 17,331 100.0 --
Additional exclusions:
• Patients with invalid or missing charges1 3 < 0.1 --
• Cases that were charge outliers2 300 1.7 --
• Cases in low volume DRGs 538 3.1
Total exclusions 841 4.9 --
Total cases remaining in analysis 16,490 95.1 $115,097 1 Invalid/missing charges included cases with charges that were less than $10,000. 2 Charge outliers were determined using the “+/- 3.0 interquartile range” method—after accounting for differences in charges by DRG group, region, and procedure type.
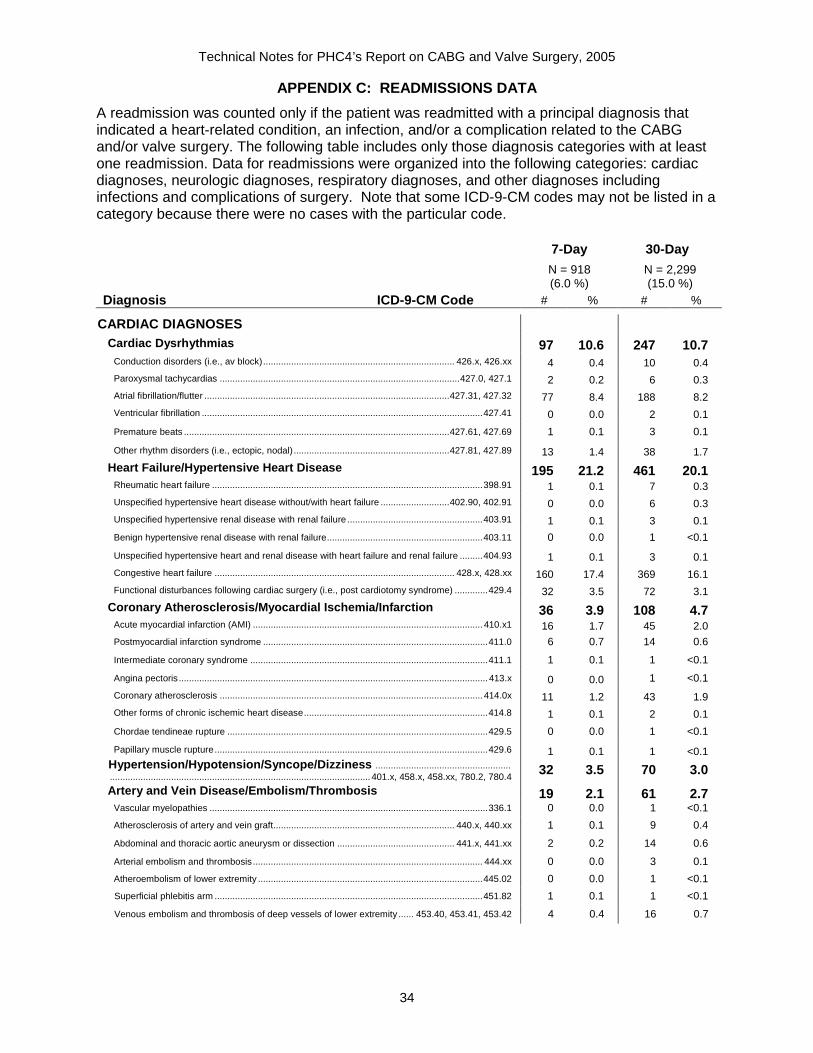
Technical Notes for PHC4’s Report on CABG and Valve Surgery, 2005
APPENDIX C: READMISSIONS DATA
34
A readmission was counted only if the patient was readmitted with a principal diagnosis that indicated a heart-related condition, an infection, and/or a complication related to the CABG and/or valve surgery. The following table includes only those diagnosis categories with at least one readmission. Data for readmissions were organized into the following categories: cardiac diagnoses, neurologic diagnoses, respiratory diagnoses, and other diagnoses including infections and complications of surgery. Note that some ICD-9-CM codes may not be listed in a category because there were no cases with the particular code.
7-Day 30-Day
N = 918 (6.0 %)
N = 2,299 (15.0 %)
Diagnosis ICD-9-CM Code # % # %
CARDIAC DIAGNOSES
Cardiac Dysrhythmias 97 10.6 247 10.7 Conduction disorders (i.e., av block)........................................................................... 426.x, 426.xx 4 0.4 10 0.4 Paroxysmal tachycardias ..............................................................................................427.0, 427.1 2 0.2 6 0.3 Atrial fibrillation/flutter ................................................................................................427.31, 427.32 77 8.4 188 8.2 Ventricular fibrillation ..............................................................................................................427.41 0 0.0 2 0.1
Premature beats ........................................................................................................427.61, 427.69 1 0.1 3 0.1
Other rhythm disorders (i.e., ectopic, nodal) .............................................................427.81, 427.89 13 1.4 38 1.7
Heart Failure/Hypertensive Heart Disease 195 21.2 461 20.1 Rheumatic heart failure ..........................................................................................................398.91 1 0.1 7 0.3 Unspecified hypertensive heart disease without/with heart failure ...........................402.90, 402.91 0 0.0 6 0.3 Unspecified hypertensive renal disease with renal failure .....................................................403.91 1 0.1 3 0.1
Benign hypertensive renal disease with renal failure.............................................................403.11 0 0.0 1 <0.1
Unspecified hypertensive heart and renal disease with heart failure and renal failure .........404.93 1 0.1 3 0.1 Congestive heart failure .............................................................................................. 428.x, 428.xx 160 17.4 369 16.1 Functional disturbances following cardiac surgery (i.e., post cardiotomy syndrome) .............429.4 32 3.5 72 3.1
Coronary Atherosclerosis/Myocardial Ischemia/Infarc tion 36 3.9 108 4.7 Acute myocardial infarction (AMI) .......................................................................................... 410.x1 16 1.7 45 2.0 Postmyocardial infarction syndrome ........................................................................................411.0 6 0.7 14 0.6
Intermediate coronary syndrome .............................................................................................411.1 1 0.1 1 <0.1
Angina pectoris ......................................................................................................................... 413.x 0 0.0 1 <0.1
Coronary atherosclerosis ....................................................................................................... 414.0x 11 1.2 43 1.9 Other forms of chronic ischemic heart disease........................................................................414.8 1 0.1 2 0.1
Chordae tendineae rupture ......................................................................................................429.5 0 0.0 1 <0.1
Papillary muscle rupture...........................................................................................................429.6 1 0.1 1 <0.1 Hypertension/Hypotension/Syncope/Dizziness ........................................................................................................................................................... 401.x, 458.x, 458.xx, 780.2, 780.4 32 3.5 70 3.0
Artery and Vein Disease/Embolism/Thrombosis 19 2.1 61 2.7 Vascular myelopathies .............................................................................................................336.1 0 0.0 1 <0.1
Atherosclerosis of artery and vein graft....................................................................... 440.x, 440.xx 1 0.1 9 0.4
Abdominal and thoracic aortic aneurysm or dissection .............................................. 441.x, 441.xx 2 0.2 14 0.6
Arterial embolism and thrombosis.......................................................................................... 444.xx 0 0.0 3 0.1
Atheroembolism of lower extremity ........................................................................................445.02 0 0.0 1 <0.1
Superficial phlebitis arm .........................................................................................................451.82 1 0.1 1 <0.1
Venous embolism and thrombosis of deep vessels of lower extremity ...... 453.40, 453.41, 453.42 4 0.4 16 0.7
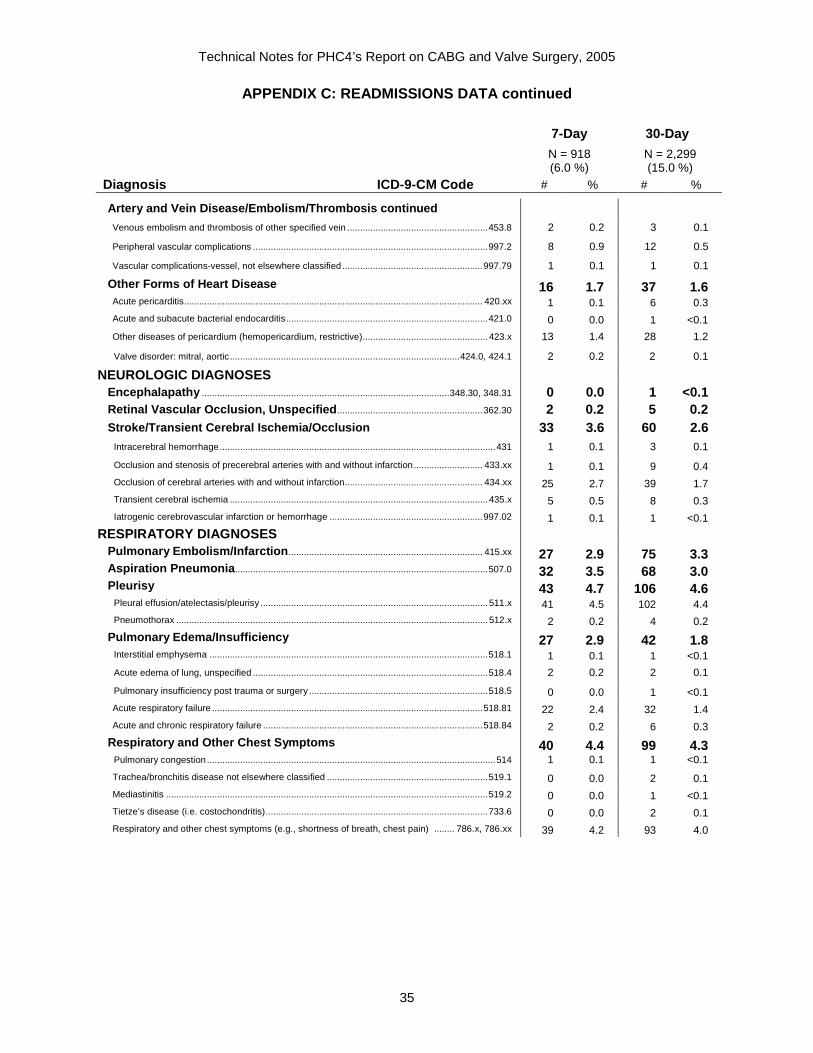
Technical Notes for PHC4’s Report on CABG and Valve Surgery, 2005
APPENDIX C: READMISSIONS DATA continued
35
7-Day 30-Day
N = 918 (6.0 %)
N = 2,299 (15.0 %)
Diagnosis ICD-9-CM Code # % # %
Artery and Vein Disease/Embolism/Thrombosis continued
Venous embolism and thrombosis of other specified vein .......................................................453.8 2 0.2 3 0.1
Peripheral vascular complications ............................................................................................997.2 8 0.9 12 0.5
Vascular complications-vessel, not elsewhere classified .......................................................997.79 1 0.1 1 0.1
Other Forms of Heart Disease 16 1.7 37 1.6 Acute pericarditis..................................................................................................................... 420.xx 1 0.1 6 0.3 Acute and subacute bacterial endocarditis...............................................................................421.0 0 0.0 1 <0.1
Other diseases of pericardium (hemopericardium, restrictive)................................................. 423.x 13 1.4 28 1.2
Valve disorder: mitral, aortic..........................................................................................424.0, 424.1 2 0.2 2 0.1
NEUROLOGIC DIAGNOSES
Encephalapathy .................................................................................................348.30, 348.31 0 0.0 1 <0.1 Retinal Vascular Occlusion, Unspecified .........................................................362.30 2 0.2 5 0.2 Stroke/Transient Cerebral Ischemia/Occlusion 33 3.6 60 2.6
Intracerebral hemorrhage............................................................................................................431 1 0.1 3 0.1
Occlusion and stenosis of precerebral arteries with and without infarction........................... 433.xx 1 0.1 9 0.4 Occlusion of cerebral arteries with and without infarction...................................................... 434.xx 25 2.7 39 1.7 Transient cerebral ischemia ..................................................................................................... 435.x 5 0.5 8 0.3 Iatrogenic cerebrovascular infarction or hemorrhage ............................................................997.02 1 0.1 1 <0.1
RESPIRATORY DIAGNOSES
Pulmonary Embolism/Infarction ............................................................................ 415.xx 27 2.9 75 3.3 Aspiration Pneumonia ...................................................................................................507.0 32 3.5 68 3.0 Pleurisy 43 4.7 106 4.6
Pleural effusion/atelectasis/pleurisy ......................................................................................... 511.x 41 4.5 102 4.4 Pneumothorax .......................................................................................................................... 512.x 2 0.2 4 0.2
Pulmonary Edema/Insufficiency 27 2.9 42 1.8 Interstitial emphysema .............................................................................................................518.1 1 0.1 1 <0.1
Acute edema of lung, unspecified ............................................................................................518.4 2 0.2 2 0.1
Pulmonary insufficiency post trauma or surgery ......................................................................518.5 0 0.0 1 <0.1 Acute respiratory failure ..........................................................................................................518.81 22 2.4 32 1.4 Acute and chronic respiratory failure ......................................................................................518.84 2 0.2 6 0.3
Respiratory and Other Chest Symptoms 40 4.4 99 4.3 Pulmonary congestion .................................................................................................................514 1 0.1 1 <0.1
Trachea/bronchitis disease not elsewhere classified ...............................................................519.1 0 0.0 2 0.1 Mediastinitis ..............................................................................................................................519.2 0 0.0 1 <0.1 Tietze’s disease (i.e. costochondritis).......................................................................................733.6 0 0.0 2 0.1 Respiratory and other chest symptoms (e.g., shortness of breath, chest pain) ........ 786.x, 786.xx 39 4.2 93 4.0

Technical Notes for PHC4’s Report on CABG and Valve Surgery, 2005
APPENDIX C: READMISSIONS DATA continued
36
7-Day 30-Day
N = 918 (6.0 %)
N = 2,299 (15.0 %)
Diagnosis ICD-9-CM Code # % # %
OTHER DIAGNOSES
Infections 155 16.9 483 21.0 Intestinal infection due to Clostridium difficile .........................................................................008.45 8 0.9 25 1.1 Septicemia............................................................................................................................... 038.xx 15 1.6 42 1.8
Pneumonia ...........................................................................................481, 482.x, 482.xx, 485, 486 28 3.1 72 3.1
Empyema ..................................................................................................................................510.9 0 0.0 2 0.1 Urinary tract infection ................................................................................................................599.0 3 0.3 21 0.9
Cellulitis ..................................................................................................................................... 682.x 6 0.7 12 0.5
Fever .........................................................................................................................................780.6 9 1.0 14 0.6 Bacteremia ................................................................................................................................790.7 3 0.3 6 0.3
Infection and inflammatory reaction due to heart device ........................................................996.61 2 0.2 7 0.3
Infection and inflammatory reaction due to vascular device...................................................996.62 2 0.2 6 0.3 Infection and inflammatory reaction due to urethral catheter .................................................996.64 0 0.0 2 0.1
Infected post-surgical seroma.................................................................................................998.51 0 0.0 2 0.1
Other post-surgical infection ...................................................................................................998.59 79 8.6 269 11.7 Non-healing surgical wound....................................................................................................998.83 0 0.0 3 0.1
Device, Implant, or Graft Complications 8 0.9 19 0.8 Mechanical complication of cardiac device, implant, graft...................................................... 996.0x 0 0.0 3 0.1 Mechanical complication of other vascular device ...................................................................996.1 1 0.1 1 <0.1 Complication due to heart valve prosthesis ............................................................................996.71 2 0.2 3 0.1 Other complication of cardiac device, implant, graft ...............................................................996.72 5 0.5 11 0.5 Adjustment of other cardiac device........................................................................................ V53.39 0 0.0 1 <0.1
Gastrointestinal Hemorrhage/Complications 30 3.3 76 3.3 Gastric ulcer ............................................................................................................................ 531.xx 0 0.0 5 0.2 Duodenal ulcer ........................................................................................................................ 532.xx 14 1.5 24 1.0 Peptic ulcer.............................................................................................................................. 533.xx 0 0.0 1 <0.1 Gastritis and duodenitis........................................................................................................... 535.xx 1 0.1 7 0.3 Vascular insufficiency of intestine (bowel infarction, ischemic colitis) ...........................557.0, 557.9 1 0.1 6 0.3 Intestinal obstruction/paralytic ileus ...................................................................560.1,560.89, 560.9 2 0.2 6 0.3 Hemorrhage of rectum and anus ..............................................................................................569.3 1 0.1 3 0.1 Hematemesis ............................................................................................................................578.0 0 0.0 1 <0.1 Blood in stool .............................................................................................................................578.1 2 0.2 6 0.3 Hemorrhage of gastrointestinal tract, unspecified ....................................................................578.9 3 0.3 11 0.5 Digestive system complications due to procedure ...................................................................997.4 6 0.7 6 0.3
Genitourinary Complications 18 2.0 44 1.9 Acute renal failure/insufficiency .....................................................................................584.x, 593.9 14 1.5 35 1.5 Renal vascular disorder ..........................................................................................................593.81 3 0.3 3 0.1 Hematuria ..................................................................................................................................599.7 0 0.0 4 0.2 Urinary complications not elsewhere classified ........................................................................997.5 1 0.1 2 0.1
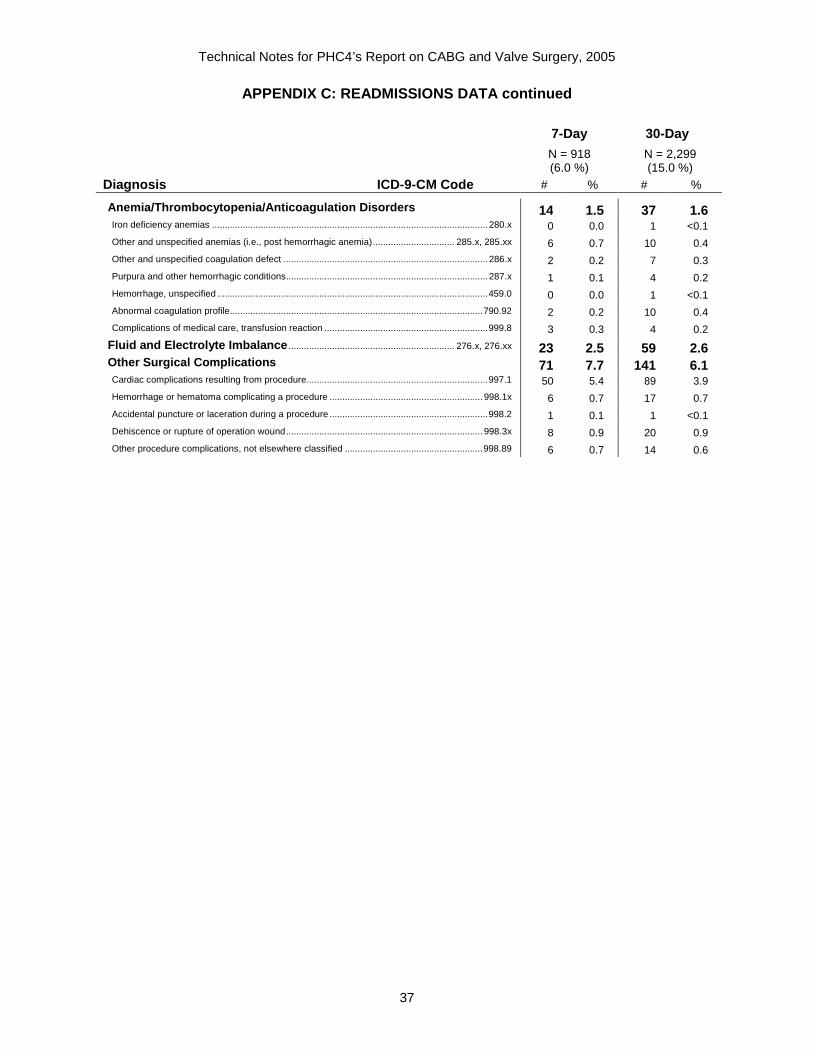
Technical Notes for PHC4’s Report on CABG and Valve Surgery, 2005
APPENDIX C: READMISSIONS DATA continued
37
7-Day 30-Day
N = 918 (6.0 %)
N = 2,299 (15.0 %)
Diagnosis ICD-9-CM Code # % # %
Anemia/Thrombocytopenia/Anticoagulation Disorders 14 1.5 37 1.6 Iron deficiency anemias ............................................................................................................ 280.x 0 0.0 1 <0.1 Other and unspecified anemias (i.e., post hemorrhagic anemia)................................ 285.x, 285.xx 6 0.7 10 0.4 Other and unspecified coagulation defect ................................................................................ 286.x 2 0.2 7 0.3 Purpura and other hemorrhagic conditions............................................................................... 287.x 1 0.1 4 0.2 Hemorrhage, unspecified ..........................................................................................................459.0 0 0.0 1 <0.1 Abnormal coagulation profile...................................................................................................790.92 2 0.2 10 0.4 Complications of medical care, transfusion reaction ................................................................999.8 3 0.3 4 0.2
Fluid and Electrolyte Imbalance ................................................................. 276.x, 276.xx 23 2.5 59 2.6 Other Surgical Complications 71 7.7 141 6.1 Cardiac complications resulting from procedure.......................................................................997.1 50 5.4 89 3.9 Hemorrhage or hematoma complicating a procedure ............................................................ 998.1x 6 0.7 17 0.7 Accidental puncture or laceration during a procedure ..............................................................998.2 1 0.1 1 <0.1 Dehiscence or rupture of operation wound............................................................................. 998.3x 8 0.9 20 0.9 Other procedure complications, not elsewhere classified ......................................................998.89 6 0.7 14 0.6

Technical Notes for PHC4’s Report on CABG and Valve Surgery, 2005
APPENDIX D: CANDIDATE VARIABLE DEFINITIONS
38
This appendix includes definitions of all variables that were tested and/or retained for the mortality, readmissions, and length of stay models. When variables were defined by the presence of ICD-9-CM codes in the discharge record, the ICD-9-CM codes are listed. Note that not every variable in this appendix was tested in every model. Moreover, when a variable had more than one overlapping definition, only one definition was used for a particular model. The columns to the right indicate which variable definitions were used in a particular group of models.
Variable Name Description Mortality
Read-missions
Length of Stay
Demographic Variables
Age in Years X X X
Age # Years > 65 Number of years older than 65.
X X X
Female X X X
Race Category 1: White Category 2: Black Category 3: Other/Unknown
30-day only X
Laboratory Variables Albumin < 3.1 1 Laboratory value for albumin was less than or equal to 3.0 g/dL, as indicated by any of the following:
• Albumin g/dL A (value in the range 1.0 – 2.4 g/dL), • Albumin g/dL B (value in the range 2.5 – 2.7g/dL), or • Albumin g/dL C (value in the range 2.8 – 3.0 g/dL).
X
BUN > 401 Laboratory value for blood urea nitrogen (BUN) was greater than 40 mg/dL, as indicated by any of the following:
• BUN mg/dL D (value in the range 41- 55 mg/dL), or • BUN mg/dL E (value in the range 56 – 250 mg/dL).
X
Creatinine > 1.4 1 Laboratory value for creatinine was greater than 1.4 mg/dL, as indicated by any of the following:
• Creatinine mg/dL B (value in the range: 1.5 – 2.0 mg/dL), • Creatinine mg/dL C (value in the range: 2.1 – 2.5 mg/dL), • Creatinine mg/dL D (value in the range: 2.6 – 3.0 mg/dL), or • Creatinine mg/dL E (value in the range: 3.1 – 25.0 mg/dL).
X
Glucose > 165 1 Laboratory value for glucose was greater than 165 mg/dL, as indicated by either of the following:
• Glucose mg/dL D (value in the range: 166 – 240 mg/dL), or • Glucose mg/dL E (value in the range: 241 – 2000 mg/dL).
In-hospital only
Clinical Variables Other Than Laboratory Variables Acute Myocardial Infarction (AMI) AMI as indicated by code 410.x1 in the principal diagnosis position in PHC4 data.
X
AMI Other Inferior Wall Initial Episode AMI of other inferior wall, as indicated by:
• 410.41 in any position in MediQual data, or • 410.41 in the principal diagnosis position in PHC4 data.
X
AMI Except Other Anterior or Other Inferior Wall Any of the following codes in any position in PHC4 data: 410.01, 410.21, 410.31, 410.51, 410.61, 410.71, 410.81, or 410.91 in the principal diagnosis position in PHC4 data.
X
1 This variable was developed by MediQual for their CABG/valve in-hospital mortality model using the MediQual Atlas Outcomes
System data.

Technical Notes for PHC4’s Report on CABG and Valve Surgery, 2005
APPENDIX D: CANDIDATE VARIABLE DEFINITIONS continued
39
Variable Name Description Mortality
Read-missions
Length of Stay
Anemia Any of the following codes in any position in PHC4 data: 280.0, 280.1, 280.8, 280.9, 281.0, 281.1, 281.2, 281.3, 281.4, 281.8, 281.9, 282.0, 282.1, 282.2, 282.3, 282.41, 282.42, 282.49, 282.5, 282.60, 282.61, 282.62, 282.63, 282.64, 282.68, 282.69, 282.7, 282.8, 282.9 283.0, 283.10, 283.11, 283.19, 283.2, 283.9, 284.0, 284.8, 284.9, 285.0, 285.21, 285.22, 285.29, 285.8, 285.9.
X
ASA Class 5 1 High risk operation, as indicated by an anesthesia class of 5 for the first open heart procedure. This physical status classification system was created by the American Society of Anesthesiologists. Scale: 1 – 5, where 5 is the highest risk category.
X 7-day only
ASA Emergency Flag 1 Emergency operation, as indicated by an anesthesia emergency flag for the first open heart procedure. This physical status classification system was created by the American Society of Anesthesiologists.
X
Cachexia Any of the following codes in any position in PHC4 data: 261, 262, 263.0, 263.1, 263.2, 263.8, 263.9, 799.4, V85.0*.
X X
CAD > 70, 5-7 Vessels Group 1 Coronary Artery Disease (CAD) with greater than 70% occlusion in 5 to 7 coronary arteries.
X
Cancer Any of the following codes in any position in PHC4 data: 140.0 - 208.9, 230.0 - 239.9.
Operative only X
Cardiogenic Shock, Preoperative Medical record review to determine if cardiogenic shock was present prior to CABG and/or valve surgery.
X X
Cardiomyopathy Any of the following codes in any position in PHC4 data: 414.8, 425.1, 425.3, 425.4, 425.5, 425.8, 425.9, 429.1, 429.3.
Operative only
Chronic Lung Disease Any of the following codes in any position in PHC4 data: 491.0, 491.1, 491.20, 491.21, 491.22, 492.0, 492.8, 493.20, 493.21, 493.22, 494.0, 494.1, 496, 500, 501, 502, 503, 504, 505, 506.4, 508.1, 518.2, 518.83.
X X X
Chronic Pulmonary Hypertension Any of the following codes in any position in PHC4 data: 416.0, 416.1, 416.8, 416.9.
X X X
Coagulopathy Any of the following codes in any position in PHC4 data: 286.0, 286.1, 286.2, 286.3, 286.4, 287.3**, 287.30*, 287.31*, 287.32*, 287.33*, 287.39*, 289.81.
X X
Current Med Immunosuppressants 1 Based on the presence of the Current Med Immunosuppressive History KCF.
X
Current Med Insulin 1 Based on the presence of the Current Med Insulin History KCF.
X
Diabetes Category 1: No diabetes Category 2: Diabetes without complication was indicated by the presence of code 250.0x in any position in PHC4 data. Category 3: Diabetes with complication was indicated by any code in the following range in PHC4 data: 250.1x - 250.9x.
30-day only
Diabetes with Long Term/Unspecified Complications Diabetes with long term or unspecified complications, as indicated by any of the following codes in any position in PHC4 data: 250.4x - 250.9x.
7-day only X
Ejection Fraction 1 Category 1: EF > 45% was based on the presence of an ejection fraction or fractional shortening greater than 45% as a transfer, preadmission, or admission KCF. Category 2: 25% to 45% was based on the presence of an ejection fraction or fractional shortening greater than 25% and less than or equal to 45% as a transfer, preadmission, or admission KCF. Also included cases without an EF finding. Category 3: EF < 25% was based on the presence of an ejection fraction or fractional shortening less than 25% as a transfer, preadmission, or admission KCF.
X
1 This variable was developed by MediQual for their CABG/valve in-hospital mortality model using the MediQual Atlas Outcomes
System data. * Effective Q4 2005 ** Invalid after Q3 2005

Technical Notes for PHC4’s Report on CABG and Valve Surgery, 2005
APPENDIX D: CANDIDATE VARIABLE DEFINITIONS continued
40
Variable Name Description Mortality
Read-missions
Length of Stay
Excision of Other Lesion/Heart Tissue, Open Approac h – Same Date as Valve Surgery w/wo CABG This procedure is indicated by the presence of code 37.33 on the same date as valve surgery with or without CABG in any position in PHC4 data. If valve and CABG surgeries were performed during the same admission but on different dates the date of the valve surgery was used.
In-hospital only X X
Heart Failure Heart failure, as indicated by either of the following:
• The presence of congestive heart failure (CHF) as a preadmission or admission KCF in MediQual data, or
• Any of the following codes in any position in PHC4 data: 398.91, 428.0, 428.1, 428.20, 428.21, 428.22, 428.23, 428.30, 428.31, 428.32, 428.33, 428.40, 428.41, 428.42, 428.43, 428.9. For those cases having one of the above heart failure codes and a hypertension with congestive heart failure code (402.x1, 404.x1, 404.x3) in the same record, the case was assigned to hypertension with complications.
X X
Heart Failure 2 Any of the following codes in any position in PHC4 data: 398.91, 428.0, 428.1, 428.20, 428.21, 428.22, 428.23, 428.30, 428.31, 428.32, 428.33, 428.40, 428.41, 428.42, 428.43, 428.9. For those cases having one of the above heart failure codes and a hypertension with congestive heart failure code (402.x1, 404.x1, 404.x3) in the same record, the case was assigned to hypertension with complications.
X
History of CABG or Valve Surgery History of CABG and/or valve surgery, as indicated by any of the following:
• The presence of the Previous CABG History KCF in MediQual data, or • Any of the following codes in the principal diagnosis position in PHC4 data:
996.02, 996.03, 996.61, 996.71, 996.72, or • Any of the following codes in any position in PHC4 data: V42.2, V43.3,
V45.81, 414.02 - 414.05.
X
History of CABG or Valve Surgery 2 History of CABG and/or valve surgery, as indicated by either of the following:
• Any of the following codes in the principal diagnosis position in PHC4 data: 996.02, 996.03, 996.61, 996.71, 996.72, or
• Any of the following codes in any position in PHC4 data: V42.2, V43.3, V45.81, 414.02 - 414.05.
X
History of Peripheral Vascular Disease History of peripheral vascular disease was indicated by either:
• The presence of the Peripheral Vascular Disease History KCF in MediQual data, or
• Any of the following codes in any position in PHC4 data: 440.0, 440.1, 440.20, 440.21 440.22, 440.23, 440.24, 440.29, 440.30, 440.31, 440.32, 440.8, 440.9, 441.2, 441.4, 441.7, 441.9, 442.0, 442.1, 442.2, 442.3, 442.82, 442.83, 442.84, 443.0, 443.1, 443.81, 443.82*, 443.89, 443.9, 454.0, 454.1, 454.2, 454.8, 454.9, 459.30, 459.31, 459.32, 459.33, 459.39, 459.81, 557.1, 593.81.
X
History of Peripheral Vascular Disease 2 Any of the following codes in any position in PHC4 data: 440.0, 440.1, 440.20, 440.21 440.22, 440.23, 440.24, 440.29, 440.30, 440.31, 440.32, 440.8, 440.9, 441.2, 441.4, 441.7, 441.9, 442.0, 442.1, 442.2, 442.3, 442.82, 442.83, 442.84, 443.0, 443.1, 443.81, 443.82*, 443.89, 443.9, 454.0, 454.1, 454.2, 454.8, 454.9, 459.30, 459.31, 459.32, 459.33, 459.39, 459.81, 557.1, 593.81.
30-day only
Hypertension with Complications Any of the following codes in any position in PHC4 data: 402.01, 402.11, 402.91, 403.01, 403.11, 403.91, 404.01, 404.11, 404.91, 404.02, 404.12, 404.92, 404.03, 404.13, 404.93, 405.01, 405.09, 405.11, 405.19, 405.91, 405.99.
X X X
Intra-Aortic Balloon Pump (IABP) Prior to Date of C ABG/Valve Surgery An intra-aortic balloon pump inserted prior to the date of CABG/valve surgery, as indicated by the following code in any position in PHC4 data: 37.61.
X X
2 This variable definition does not include the MediQual KCF. The KCF was included in the MediQual Predicted Length of Stay variable.

Technical Notes for PHC4’s Report on CABG and Valve Surgery, 2005
APPENDIX D: CANDIDATE VARIABLE DEFINITIONS continued
41
Variable Name Description Mortality
Read-missions
Length of Stay
Liver Disease Any of the following codes in any position in PHC4 data: 456.0, 456.20, 456.21, 571.0, 571.3, 571.40, 571.41, 571.49, 571.5, 571.6, 571.8, 571.9, 572.3, 573.3.
In-hospital only X
MI/AMI Other Anterior Wall Myocardial infarction/acute myocardial infarction of other anterior wall, as indicated by either one of the following:
• The presence of myocardial infarction as either a preadmission or admission KCF and the diagnosis code 410.11 in any position in MediQual data, or
• 410.11 as the principal diagnosis code in PHC4 data.
X
Mild Moderate or Severe AMS 1 Altered mental status is based on the presence of the following preadmission or admission KCF in MediQual data:
• Mild – Disoriented, lethargy, or Glascow Coma Score from 10 – 14, • Moderate – Glascow Coma Score from 5 – 9, or • Severe – Coma/stupor or Glascow Coma Score < 5.
X
Morbid Obesity Code 278.01 in any position in PHC4 data.
30-day only
MediQual Predicted Length of Stay The predicted length of stay derived from MediQual’s Predicted Length of Stay model for CABG/valve. This variable consists of demographic and clinical data including laboratory findings.
X X
Multiple Valve Procedures Any combination of valve procedure codes (i.e., two or more codes in any position in PHC4 data): 35.20, 35.21, 35.22, 35.23, 35.24, 35.25 35.26, 35.27, 35.28, 35.10, 35.11, 35.12, 35.13, 35.14, 35.33, 35.99.
X 30-day only X
Other CV Procedure Group Other cardiovascular procedures indicated by any of the following codes in any position:
• 36.31, 36.32, 36.39, 36.91, 36.99, 37.10, 37.11, 37.32, 37.33, 38.44, 38.45, 38.46, 39.51, 39.52. in MediQual data, or
• 35.00, 35.01, 35.02, 35.03, 35.04, 35.31, 35.32, 35.34, 35.35, 35.39, 35.50, 35.51, 35.53, 35.54, 35.60, 35.61, 35.62, 35.63, 35.70, 35.71, 35.72, 35.73, 35.81, 35.82, 35.83, 35.84, 35.91, 35.92, 35.93, 35.94, 35.95, 35.98, 36.2, 36.31, 36.32, 36.39, 36.91, 36.99, 37.10, 37.11, 37.12, 37.31, 37.32, 37.33, 37.41, 37.49, 37.51, 37.52, 37.53 in PHC4 data.
X X
Other Open Heart Procedure Other heart procedures, as indicated by any of the following procedure codes in any position in PHC4 data: 35.00, 35.01, 35.02, 35.03, 35.04, 35.31, 35.32, 35.34, 35.35, 35.39, 35.50, 35.51, 35.53, 35.54, 35.60, 35.61, 35.62, 35.63, 35.70, 35.71, 35.72, 35.73, 35.81, 35.82, 35.83, 35.84, 35.91, 35.92, 35.93, 35.94, 35.95, 35.98, 36.2, 36.31, 36.32, 36.39, 36.91, 36.99, 37.10, 37.11, 37.12, 37.31, 37.32, 37.33, 37.41, 37.49, 37.51, 37.52, 37.53.
X
Percent of Left Main Stenosis 1 Percent of occlusion in the left main coronary artery (continuous variable).
In-hospital only
Procedure Group Category 1: CABG without valve: any of the following codes with no valve procedure codes: 36.10, 36.11, 36.12, 36.13, 36.14, 36.15, 36.16, 36.17, 36.19. Category 2: Valve without CABG: any of the following codes with no CABG codes: 35.10, 35.11, 35.12, 35.13, 35.14, 35.20, 35.21, 35.22, 35.23, 35.24, 35.25, 35.26, 35.27, 35.28, 35.33, 35.99. Category 3: Valve with CABG: cases with at least one CABG code from and at least one valve code.
X X X
PTCA/Stent Same Day as CABG/Valve Surgery Any of the following procedure codes in any position in PHC4 data on the same date as a CABG/valve procedure: 36.01**, 36.02**, 36.05**, 36.06, 36.07, 36.09, 00.66.*
X
1 This variable was developed by MediQual for their CABG/valve in-hospital mortality model using the MediQual Atlas Outcomes
System data. * Effective Q4 2005 ** Invalid after Q3 2005
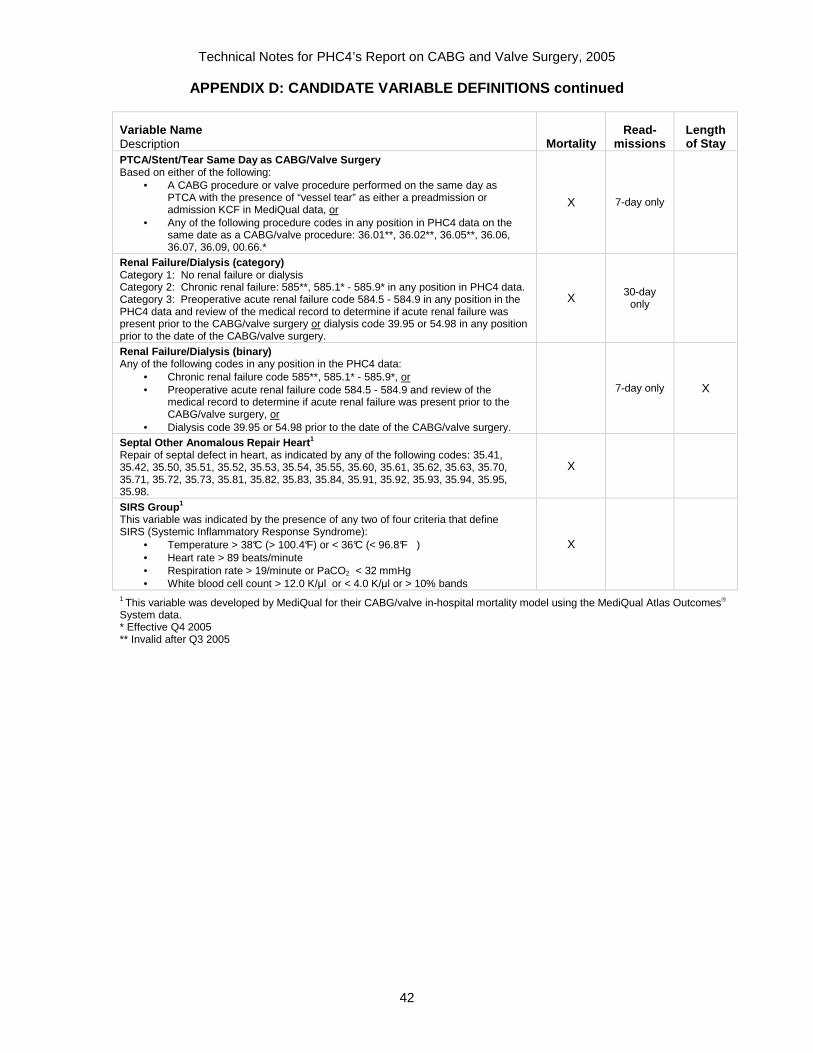
Technical Notes for PHC4’s Report on CABG and Valve Surgery, 2005
APPENDIX D: CANDIDATE VARIABLE DEFINITIONS continued
42
Variable Name Description Mortality
Read-missions
Length of Stay
PTCA/Stent/Tear Same Day as CABG/Valve Surgery Based on either of the following:
• A CABG procedure or valve procedure performed on the same day as PTCA with the presence of “vessel tear” as either a preadmission or admission KCF in MediQual data, or
• Any of the following procedure codes in any position in PHC4 data on the same date as a CABG/valve procedure: 36.01**, 36.02**, 36.05**, 36.06, 36.07, 36.09, 00.66.*
X 7-day only
Renal Failure/Dialysis (category) Category 1: No renal failure or dialysis Category 2: Chronic renal failure: 585**, 585.1* - 585.9* in any position in PHC4 data. Category 3: Preoperative acute renal failure code 584.5 - 584.9 in any position in the PHC4 data and review of the medical record to determine if acute renal failure was present prior to the CABG/valve surgery or dialysis code 39.95 or 54.98 in any position prior to the date of the CABG/valve surgery.
X 30-day only
Renal Failure/Dialysis (binary) Any of the following codes in any position in the PHC4 data:
• Chronic renal failure code 585**, 585.1* - 585.9*, or • Preoperative acute renal failure code 584.5 - 584.9 and review of the
medical record to determine if acute renal failure was present prior to the CABG/valve surgery, or
• Dialysis code 39.95 or 54.98 prior to the date of the CABG/valve surgery.
7-day only X
Septal Other Anomalous Repair Heart 1 Repair of septal defect in heart, as indicated by any of the following codes: 35.41, 35.42, 35.50, 35.51, 35.52, 35.53, 35.54, 35.55, 35.60, 35.61, 35.62, 35.63, 35.70, 35.71, 35.72, 35.73, 35.81, 35.82, 35.83, 35.84, 35.91, 35.92, 35.93, 35.94, 35.95, 35.98.
X
SIRS Group 1 This variable was indicated by the presence of any two of four criteria that define SIRS (Systemic Inflammatory Response Syndrome):
• Temperature > 38°C (> 100.4°F) or < 36°C (< 96.8°F ) • Heart rate > 89 beats/minute • Respiration rate > 19/minute or PaCO2 < 32 mmHg • White blood cell count > 12.0 K/µl or < 4.0 K/µl or > 10% bands
X
1 This variable was developed by MediQual for their CABG/valve in-hospital mortality model using the MediQual Atlas Outcomes
System data. * Effective Q4 2005 ** Invalid after Q3 2005
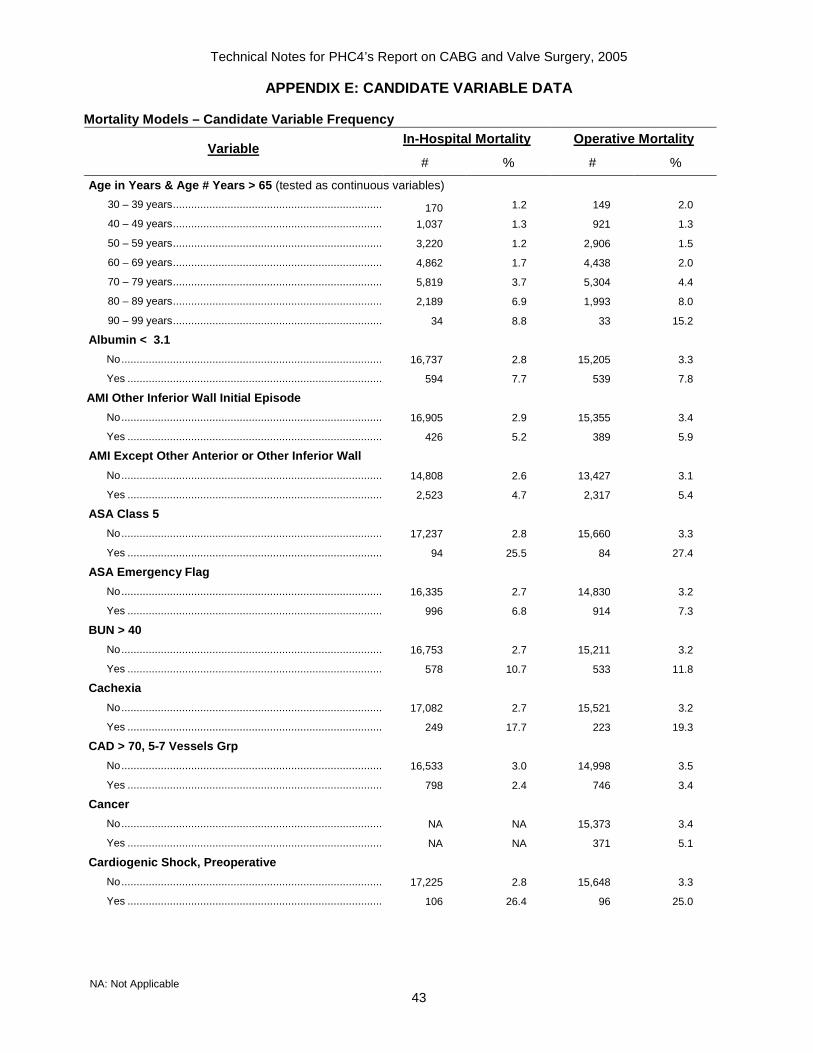
Technical Notes for PHC4’s Report on CABG and Valve Surgery, 2005
APPENDIX E: CANDIDATE VARIABLE DATA
NA: Not Applicable 43
Mortality Models – Candidate Variable Frequency In-Hospital Mortality Operative Mortality
Variable # % # %
Age in Years & Age # Years > 65 (tested as continuous variables)
30 – 39 years......................................................................... 170 1.2 149 2.0
40 – 49 years......................................................................... 1,037 1.3 921 1.3
50 – 59 years......................................................................... 3,220 1.2 2,906 1.5
60 – 69 years......................................................................... 4,862 1.7 4,438 2.0
70 – 79 years......................................................................... 5,819 3.7 5,304 4.4
80 – 89 years......................................................................... 2,189 6.9 1,993 8.0
90 – 99 years......................................................................... 34 8.8 33 15.2
Albumin < 3.1
No.......................................................................................... 16,737 2.8 15,205 3.3
Yes ........................................................................................ 594 7.7 539 7.8
AMI Other Inferior Wall Initial Episode
No.......................................................................................... 16,905 2.9 15,355 3.4
Yes ........................................................................................ 426 5.2 389 5.9
AMI Except Other Anterior or Other Inferior Wall
No.......................................................................................... 14,808 2.6 13,427 3.1
Yes ........................................................................................ 2,523 4.7 2,317 5.4
ASA Class 5
No.......................................................................................... 17,237 2.8 15,660 3.3
Yes ........................................................................................ 94 25.5 84 27.4
ASA Emergency Flag
No.......................................................................................... 16,335 2.7 14,830 3.2
Yes ........................................................................................ 996 6.8 914 7.3
BUN > 40
No.......................................................................................... 16,753 2.7 15,211 3.2
Yes ........................................................................................ 578 10.7 533 11.8
Cachexia
No.......................................................................................... 17,082 2.7 15,521 3.2
Yes ........................................................................................ 249 17.7 223 19.3
CAD > 70, 5-7 Vessels Grp
No.......................................................................................... 16,533 3.0 14,998 3.5
Yes ........................................................................................ 798 2.4 746 3.4
Cancer
No.......................................................................................... NA NA 15,373 3.4
Yes ........................................................................................ NA NA 371 5.1
Cardiogenic Shock, Preoperative
No.......................................................................................... 17,225 2.8 15,648 3.3
Yes ........................................................................................ 106 26.4 96 25.0

Technical Notes for PHC4’s Report on CABG and Valve Surgery, 2005
APPENDIX E: CANDIDATE VARIABLE DATA continued
NA: Not Applicable 44
In-Hospital Mortality Operative Mortality Variable
# % # %
Cardiomyopathy
No.......................................................................................... NA NA 13,840 3.3
Yes ........................................................................................ NA NA 1,904 4.5
Chronic Lung Disease
No........................................................................................................... 13,824 2.7 12,498 3.2
Yes......................................................................................................... 3,507 3.8 3,246 4.6
Chronic Pulmonary Hypertension
No.......................................................................................... 16,249 2.8 14,780 3.4
Yes ........................................................................................ 1,082 4.2 964 5.0
Coagulopathy
No.......................................................................................... 17,261 2.9 15,679 3.4
Yes ........................................................................................ 70 11.4 65 12.3
Creatinine > 1.4
No.......................................................................................... 15,451 2.4 13,996 2.9
Yes ........................................................................................ 1,880 7.4 1,748 8.2
Current Med Immunosuppressants
No.......................................................................................... 16,838 2.9 15,294 3.4
Yes ........................................................................................ 493 4.7 450 5.6
Current Med Insulin
No.......................................................................................... 15,755 2.7 14,290 3.3
Yes ........................................................................................ 1,576 4.9 1,454 5.4
Ejection Fraction
>45% ..................................................................................... 8,348 2.1 7,594 2.6
25%-45% ............................................................................... 8,373 3.5 7,604 4.1
<25% ..................................................................................... 610 6.1 546 7.1
Excision of Other Lesion/Heart Tissue, Open Approac h – Same Date as Valve Surgery w/wo CABG
No.......................................................................................... 16,733 2.8 NA NA
Yes ........................................................................................ 598 5.5 NA NA
Female
No.......................................................................................... 11,551 2.2 10,453 2.7
Yes ........................................................................................ 5,780 4.3 5,291 5.0
Glucose > 165
No.......................................................................................... 13,482 2.6 NA NA
Yes ........................................................................................ 3,849 4.2 NA NA
Heart Failure
No.......................................................................................... 11,771 1.4 10,851 1.8
Yes ........................................................................................ 5,560 6.1 4,893 7.1
History of CABG or Valve Surgery
No.......................................................................................... 15,991 2.6 14,559 3.2
Yes ........................................................................................ 1,340 6.4 1,185 6.8
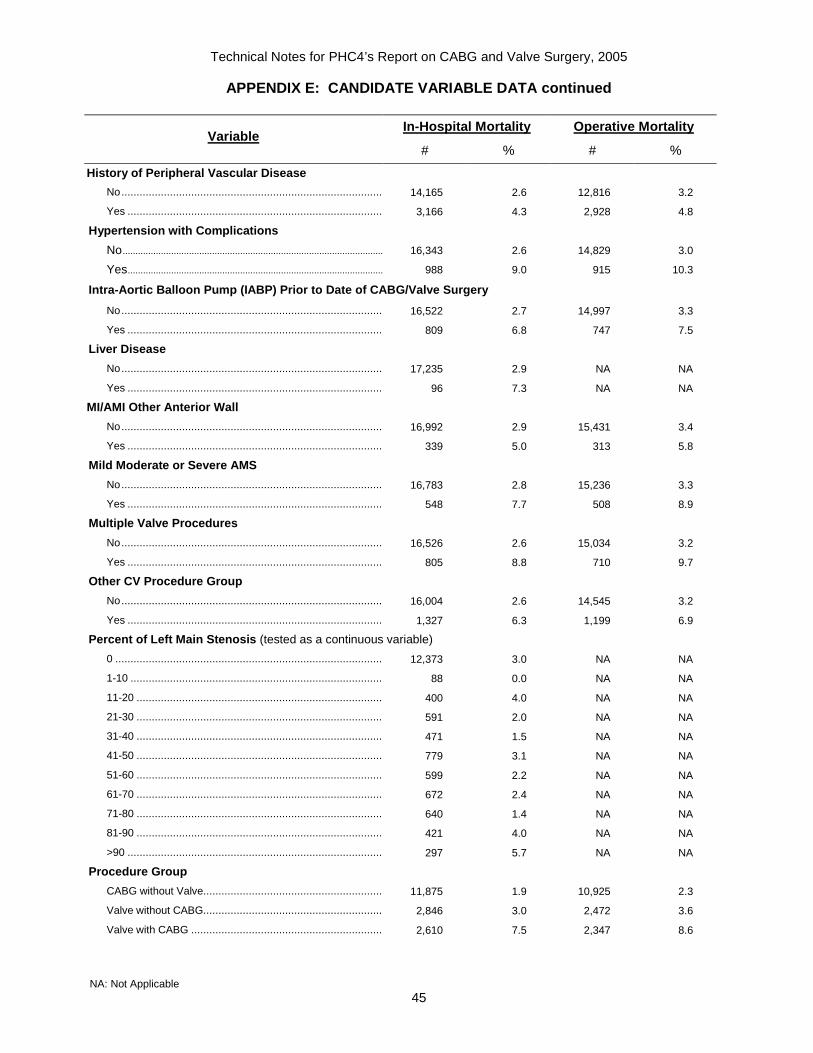
Technical Notes for PHC4’s Report on CABG and Valve Surgery, 2005
APPENDIX E: CANDIDATE VARIABLE DATA continued
NA: Not Applicable 45
In-Hospital Mortality Operative Mortality Variable
# % # %
History of Peripheral Vascular Disease No.......................................................................................... 14,165 2.6 12,816 3.2
Yes ........................................................................................ 3,166 4.3 2,928 4.8
Hypertension with Complications
No........................................................................................................... 16,343 2.6 14,829 3.0
Yes......................................................................................................... 988 9.0 915 10.3
Intra-Aortic Balloon Pump (IABP) Prior to Date of C ABG/Valve Surgery
No.......................................................................................... 16,522 2.7 14,997 3.3
Yes ........................................................................................ 809 6.8 747 7.5
Liver Disease
No.......................................................................................... 17,235 2.9 NA NA
Yes ........................................................................................ 96 7.3 NA NA
MI/AMI Other Anterior Wall
No.......................................................................................... 16,992 2.9 15,431 3.4
Yes ........................................................................................ 339 5.0 313 5.8
Mild Moderate or Severe AMS
No.......................................................................................... 16,783 2.8 15,236 3.3
Yes ........................................................................................ 548 7.7 508 8.9
Multiple Valve Procedures
No.......................................................................................... 16,526 2.6 15,034 3.2
Yes ........................................................................................ 805 8.8 710 9.7
Other CV Procedure Group
No.......................................................................................... 16,004 2.6 14,545 3.2
Yes ........................................................................................ 1,327 6.3 1,199 6.9
Percent of Left Main Stenosis (tested as a continuous variable)
0 ............................................................................................ 12,373 3.0 NA NA
1-10 ....................................................................................... 88 0.0 NA NA
11-20 ..................................................................................... 400 4.0 NA NA
21-30 ..................................................................................... 591 2.0 NA NA
31-40 ..................................................................................... 471 1.5 NA NA
41-50 ..................................................................................... 779 3.1 NA NA
51-60 ..................................................................................... 599 2.2 NA NA
61-70 ..................................................................................... 672 2.4 NA NA
71-80 ..................................................................................... 640 1.4 NA NA
81-90 ..................................................................................... 421 4.0 NA NA
>90 ........................................................................................ 297 5.7 NA NA
Procedure Group
CABG without Valve............................................................... 11,875 1.9 10,925 2.3
Valve without CABG............................................................... 2,846 3.0 2,472 3.6
Valve with CABG ................................................................ 2,610 7.5 2,347 8.6

Technical Notes for PHC4’s Report on CABG and Valve Surgery, 2005
APPENDIX E: CANDIDATE VARIABLE DATA continued
NA: Not Applicable 46
In-Hospital Mortality Operative Mortality Variable
# % # %
PTCA/Stent/Tear Same Day as CABG/Valve Surgery No.......................................................................................... 17,126 2.9 15,563 3.4
Yes ........................................................................................ 205 8.8 181 8.3
Renal Failure/Dialysis
No.......................................................................................... 16,745 2.7 15,196 3.3
Chronic .................................................................................. 423 7.8 393 8.4
Acute/Dialysis ........................................................................ 163 9.8 155 11.0
Septal Other Anomalous Repair Heart
No.......................................................................................... 17,123 2.9 15,560 3.4
Yes ........................................................................................ 208 7.7 184 8.7
SIRS Group
No.......................................................................................... 11,530 2.3 10,388 2.7
Yes ........................................................................................ 5,801 4.2 5,356 5.0
Readmissions Models – Candidate Variable Frequency
Variable 7- & 30-Day
Readmissions
#
7-Day Readmissions
%
30-Day Readmissions
%
Age in Years & Age # Years > 65 (tested as continuous variables)
30-39 ..................................................................................... 22 4.1 15.0
40-49 ..................................................................................... 123 4.7 13.5
50-59 ..................................................................................... 340 4.7 11.8
60-69 ..................................................................................... 625 5.9 14.3
70-79 ..................................................................................... 821 6.5 16.1
80-89 ..................................................................................... 363 7.8 19.5
90-99 ..................................................................................... 5 6.7 16.7
ASA Class 5
No.......................................................................................... 2,286 6.0 NA
Yes ........................................................................................ 13 9.7 NA
Chronic Lung Disease
No.......................................................................................... 1,699 5.5 14.0
Yes ........................................................................................ 600 8.0 19.2
Chronic Pulmonary Hypertension
No.......................................................................................... 2,104 5.9 14.6
Yes ........................................................................................ 195 8.3 21.1
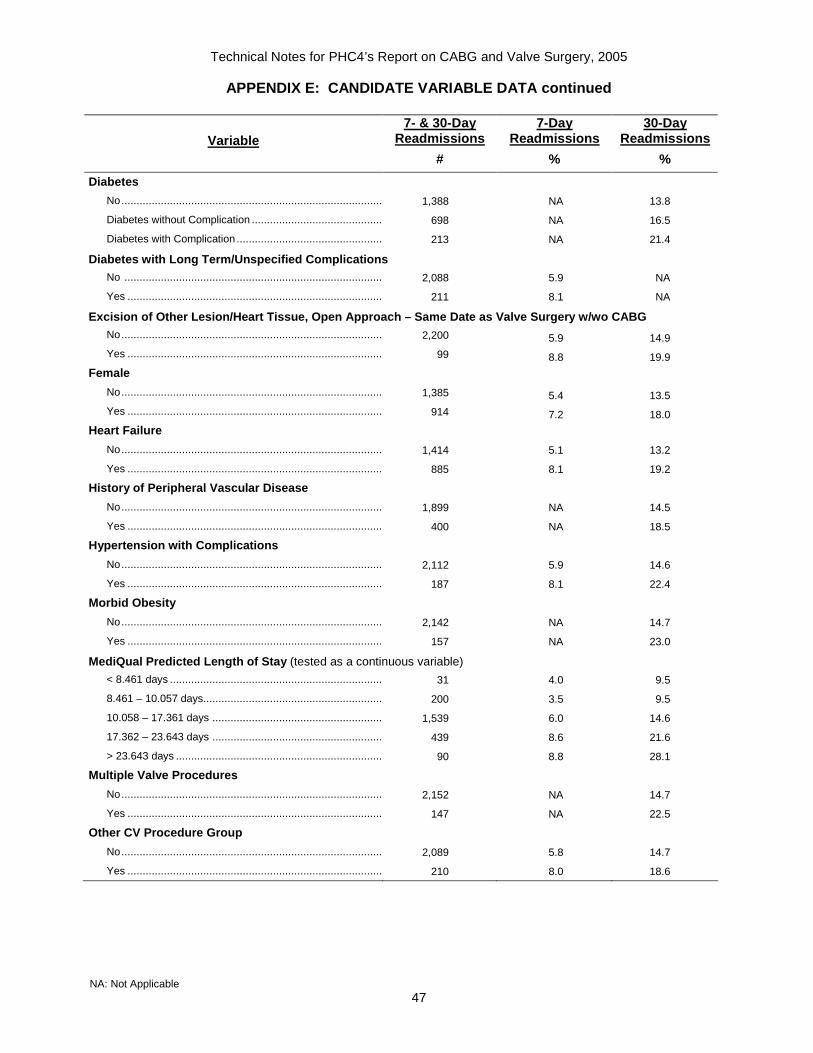
Technical Notes for PHC4’s Report on CABG and Valve Surgery, 2005
APPENDIX E: CANDIDATE VARIABLE DATA continued
NA: Not Applicable 47
Variable 7- & 30-Day
Readmissions
#
7-Day Readmissions
%
30-Day Readmissions
%
Diabetes
No.......................................................................................... 1,388 NA 13.8
Diabetes without Complication ............................................... 698 NA 16.5
Diabetes with Complication .................................................... 213 NA 21.4
Diabetes with Long Term/Unspecified Complications
No ......................................................................................... 2,088 5.9 NA
Yes ........................................................................................ 211 8.1 NA
Excision of Other Lesion/Heart Tissue, Open Approac h – Same Date as Valve Surgery w/wo CABG No.......................................................................................... 2,200 5.9 14.9
Yes ........................................................................................ 99 8.8 19.9
Female
No.......................................................................................... 1,385 5.4 13.5
Yes ........................................................................................ 914 7.2 18.0
Heart Failure
No.......................................................................................... 1,414 5.1 13.2
Yes ........................................................................................ 885 8.1 19.2
History of Peripheral Vascular Disease
No.......................................................................................... 1,899 NA 14.5
Yes ........................................................................................ 400 NA 18.5
Hypertension with Complications
No.......................................................................................... 2,112 5.9 14.6
Yes ........................................................................................ 187 8.1 22.4
Morbid Obesity
No.......................................................................................... 2,142 NA 14.7
Yes ........................................................................................ 157 NA 23.0
MediQual Predicted Length of Stay (tested as a continuous variable)
< 8.461 days .......................................................................... 31 4.0 9.5
8.461 – 10.057 days............................................................... 200 3.5 9.5
10.058 – 17.361 days ............................................................ 1,539 6.0 14.6
17.362 – 23.643 days ............................................................ 439 8.6 21.6
> 23.643 days ........................................................................ 90 8.8 28.1
Multiple Valve Procedures
No.......................................................................................... 2,152 NA 14.7
Yes ........................................................................................ 147 NA 22.5
Other CV Procedure Group
No.......................................................................................... 2,089 5.8 14.7
Yes ........................................................................................ 210 8.0 18.6

Technical Notes for PHC4’s Report on CABG and Valve Surgery, 2005
APPENDIX E: CANDIDATE VARIABLE DATA continued
NA: Not Applicable 48
Variable 7- & 30-Day
Readmissions
#
7-Day Readmissions
%
30-Day Readmissions
%
Procedure Group
CABG without Valve............................................................... 1,455 5.5 13.6
Valve without CABG............................................................... 426 6.6 17.8
Valve with CABG ................................................................ 418 7.8 19.2
PTCA/Stent/Tear Same Day as CABG/Valve Surgery
No.......................................................................................... 2,267 6.0 NA
Yes ........................................................................................ 32 9.6 NA
Race
White ..................................................................................... 2,042 NA 14.7
Black...................................................................................... 142 NA 21.4
Other/Unknown...................................................................... 115 NA 14.8
Renal Failure/Dialysis
No.......................................................................................... 2,188 NA 14.8
Chronic .................................................................................. 75 NA 20.5
Acute/Dialysis ........................................................................ 36 NA 25.5
Renal Failure/Dialysis (binary)
No.......................................................................................... 2,188 5.9 NA
Yes........................................................................................ 111 7.5 NA
Post-Surgical Length of Stay Model – Candidate Vari able Frequency
Variable Length of Stay
# Days Acute Myocardial Infarction (AMI)
No.......................................................................................... 13,622 7.1
Yes ........................................................................................ 3,017 7.6
Age in Years & Age # Years > 65 (tested as continuous variables)
30-39 years............................................................................ 167 5.8
40-49 years............................................................................ 1,015 5.8
50-59 years ........................................................................... 3,151 6.0
60-69 years............................................................................ 4,734 6.8
70-79 years............................................................................ 5,529 7.9
80-89 years............................................................................ 2,012 8.9
90-99 years............................................................................ 31 8.9
Anemia
No.......................................................................................... 14,005 7.1
Yes ........................................................................................ 2,634 7.7
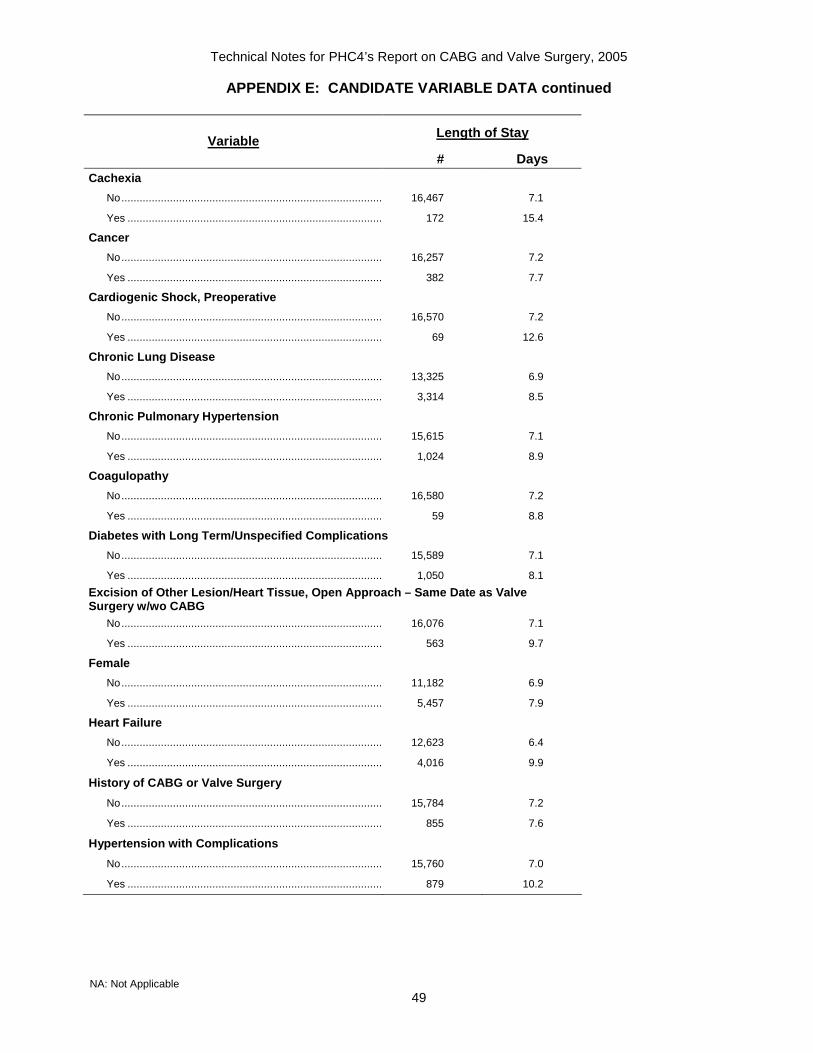
Technical Notes for PHC4’s Report on CABG and Valve Surgery, 2005
APPENDIX E: CANDIDATE VARIABLE DATA continued
NA: Not Applicable 49
Variable
Length of Stay
# Days Cachexia
No.......................................................................................... 16,467 7.1
Yes ........................................................................................ 172 15.4
Cancer
No.......................................................................................... 16,257 7.2
Yes ........................................................................................ 382 7.7
Cardiogenic Shock, Preoperative
No.......................................................................................... 16,570 7.2
Yes ........................................................................................ 69 12.6
Chronic Lung Disease
No.......................................................................................... 13,325 6.9
Yes ........................................................................................ 3,314 8.5
Chronic Pulmonary Hypertension
No.......................................................................................... 15,615 7.1
Yes ........................................................................................ 1,024 8.9
Coagulopathy
No.......................................................................................... 16,580 7.2
Yes ........................................................................................ 59 8.8
Diabetes with Long Term/Unspecified Complications
No.......................................................................................... 15,589 7.1
Yes ........................................................................................ 1,050 8.1
Excision of Other Lesion/Heart Tissue, Open Approac h – Same Date as Valve Surgery w/wo CABG
No.......................................................................................... 16,076 7.1
Yes ........................................................................................ 563 9.7
Female
No.......................................................................................... 11,182 6.9
Yes ........................................................................................ 5,457 7.9
Heart Failure
No.......................................................................................... 12,623 6.4
Yes ........................................................................................ 4,016 9.9
History of CABG or Valve Surgery
No.......................................................................................... 15,784 7.2
Yes ........................................................................................ 855 7.6
Hypertension with Complications
No.......................................................................................... 15,760 7.0
Yes ........................................................................................ 879 10.2
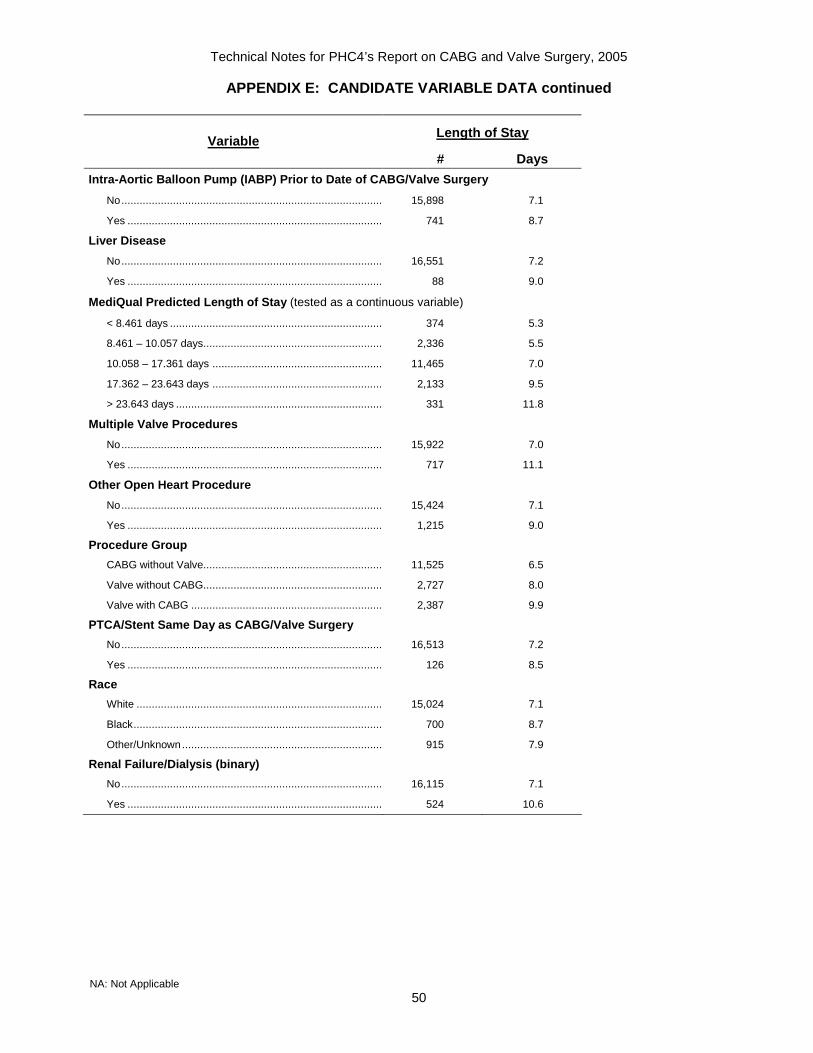
Technical Notes for PHC4’s Report on CABG and Valve Surgery, 2005
APPENDIX E: CANDIDATE VARIABLE DATA continued
NA: Not Applicable 50
Variable
Length of Stay
# Days
Intra-Aortic Balloon Pump (IABP) Prior to Date of C ABG/Valve Surgery
No.......................................................................................... 15,898 7.1
Yes ........................................................................................ 741 8.7
Liver Disease
No.......................................................................................... 16,551 7.2
Yes ........................................................................................ 88 9.0
MediQual Predicted Length of Stay (tested as a continuous variable)
< 8.461 days .......................................................................... 374 5.3
8.461 – 10.057 days............................................................... 2,336 5.5
10.058 – 17.361 days ............................................................ 11,465 7.0
17.362 – 23.643 days ............................................................ 2,133 9.5
> 23.643 days ........................................................................ 331 11.8
Multiple Valve Procedures
No.......................................................................................... 15,922 7.0
Yes ........................................................................................ 717 11.1
Other Open Heart Procedure
No.......................................................................................... 15,424 7.1
Yes ........................................................................................ 1,215 9.0
Procedure Group
CABG without Valve............................................................... 11,525 6.5
Valve without CABG............................................................... 2,727 8.0
Valve with CABG ................................................................ 2,387 9.9
PTCA/Stent Same Day as CABG/Valve Surgery
No.......................................................................................... 16,513 7.2
Yes ........................................................................................ 126 8.5
Race
White ..................................................................................... 15,024 7.1
Black...................................................................................... 700 8.7
Other/Unknown...................................................................... 915 7.9
Renal Failure/Dialysis (binary)
No.......................................................................................... 16,115 7.1
Yes ........................................................................................ 524 10.6
Technical Notes for PHC4’s Report on CABG and Valve Surgery, 2005
APPENDIX F: ATLAS OUTCOMES APPROACH TO RISK-ADJUSTMENT
51
Hospitals were required to use the MediQual Atlas Outcomes System to abstract patient severity information, which is an objective severity of illness grouping, and risk-adjustment system that classifies each patient's risk on admission using data known as Key Clinical Findings (KCFs). The Atlas Outcomes system is based on the examination of numerous Key Clinical Findings (KCFs) such as lab test results, EKG findings, vital signs, the patient’s medical history, imaging results, pathology, age, sex, and operative/endoscopy findings. Hospital personnel abstract these KCFs during specified time frames in the hospitalization. Some pre-admission data are also captured (e.g., cardiac catheterization findings), as are some history findings. MediQual, in consultation with their Clinical Advisory Panel, designed in-hospital mortality and length of stay models focusing specifically on the patients who underwent a CABG and/or valve procedure. These models have many similarities to other disease group models used to calculate Admission Severity Groups (ASGs) in the Atlas Outcomes system, though some differences were introduced to account for the unique characteristics of this population. The KCF variables were entered into algorithms that calculated the overall predicted probability of death or the predicted length of stay for patients undergoing a CABG and/or valve procedure. The predicted probability of death was derived from a logistic regression model and has a value from 0.000 to 1.000. The predicted length of stay was derived from a linear regression model and has a value greater than zero. For PHC4’s in-hospital and operative mortality models, data on the individual KCFs that were found by MediQual to be predictive of in-hospital mortality were obtained and the variables were retained in PHC4’s mortality models, unless the coefficient was negative. For PHC4’s readmissions models, individual KCFs from MediQual’s mortality model and MediQual’s predicted length of stay score were tested as candidate variables. For PHC4’s post-surgical length of stay model, MediQual’s predicted length of stay was tested as a candidate variable.