caa passenger survey report 2014
TRANSCRIPT

Business Intelligence (Shared Service Centre)
CAA Passenger Survey Report 2014 A survey of passengers at Birmingham, Doncaster, East Midlands, Gatwick, Heathrow, Leeds Bradford, Liverpool, London City, Luton, Manchester and Stansted Airports. www.caa.co.uk

Contents Introduction History Planning for 2014 Questionnaire Tabulations Copyright Tables
Table 1 Type of passengers using the 2014 survey airports
Table 2 Characteristics of terminal passengers
Table 3 Characteristics of terminating passengers
Table 4 Origin/destination of terminating passengers
Table 5 Origin/destination patterns of terminating passengers by flight type
Table 6 Origin/destination patterns of terminating passengers by residence and purpose
Table 7 Modes of transport used at the 2014 survey airports
Table 8 Modes of transport by passenger type
Table 9 Arriving mode of transport by origin
Table 10 Number of separate modes of transport used
Table 11 Group size of terminating air travellers
Table 12 People “waving off” terminating air travellers
Table 13 Trip length of terminating passengers
Table 14 Income of UK and foreign passengers
Table 15 Socio-economic group of UK passengers
Table 16 Top passenger residence by journey purpose
Table 17 Family Make-Up of leisure passengers
Table 18 Journey purpose by route and country of residence
Table 19 Journey purpose by flight type and country of residence
Table 20 Terminal passengers by quarter at the 2014 survey airports
Table 21 Age distribution of UK and foreign passengers
1

Introduction This report covers the eleven airports: Birmingham, Doncaster, East Midlands, Gatwick, Heathrow, Leeds Bradford, Liverpool, London City, Luton, Manchester and Stansted Airports.
The CAA would like to extend their thanks to all the many people that helped ensure that the information collected during the 2014 survey met the highest possible standards.
History
Since 1968 a series of surveys has been undertaken to obtain information about air travellers and the determinants of the travel market. These surveys have been designed to obtain information of a kind that could not be collected on a routine basis from the air transport industry.
The surveys have included questions on journey purpose, final and intermediate surface origins/destinations, means of transport to and from airports, route flown, country of residence and income. This information is used in assessing the type of market served by airports and consequently for forecasting air transport demand and for planning airport facilities.
Cycles of surveys were undertaken at major UK airports in the periods 1970-1972, 1975-1978, 1982-1987 and 1990-1996. Each cycle covered, by sample, 95% of terminal passengers in the UK and usually surveys were arranged so that airports in the same broad regions were surveyed at the same time.
Following the 1996 survey run at the five London airports, Birmingham, Manchester and four Scottish Airports demand built up for more regular survey data. After a consultation process with all interested parties, it was decided to run the survey continuously at Gatwick, Heathrow and Manchester Airports. Joining these Continuous Survey airports in 2001 were Luton and Stansted. Further information about survey cycles, including results from previous studies can be found on our website http://www.caa.co.uk/surveys.
Planning for 2014
In planning the 2014 Passenger Survey, the principal concern was to derive maximum value from the information collected, but at the same time to minimise passenger inconvenience. Therefore, it was necessary to impose a constraint on questionnaire length and content, in order to cause as little disruption as possible to passenger flow. To cause minimum delay, most passengers were interviewed whilst waiting to board their aircraft.
The Authority used its own interviewers and the survey ran throughout the whole of 2014, with shifts in each month carefully structured so that all scheduled routes and in most cases all flights within a route were regularly sampled. Further information
2
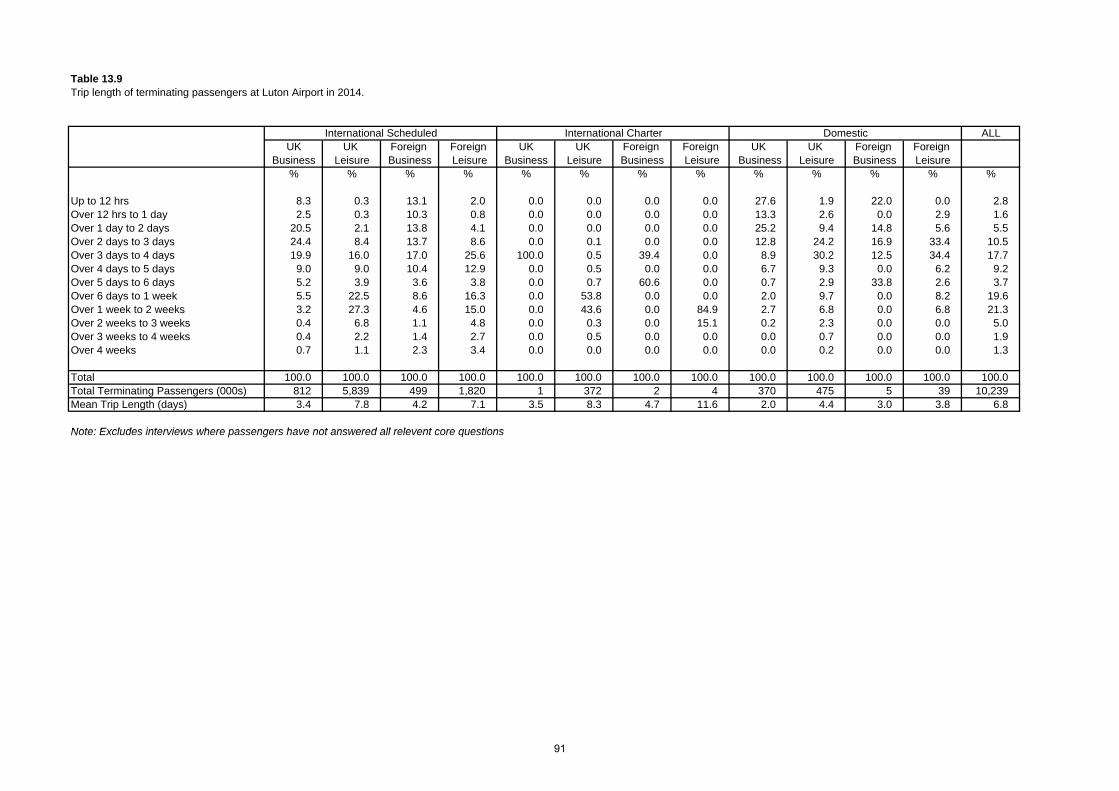
about the sampling procedures employed can be found on our website http://www.caa.co.uk/surveys..
Questionnaire
Several interested parties were consulted over the content of the questionnaire, including government departments and airport and airline management groups. The questionnaires were similar to previous survey questionnaires in that the same basic questions appeared but a number of new questions were included specifically for the co-sponsors of the 2014 survey. A sample questionnaire used on the 2014 Survey can be found on our website http://www.caa.co.uk/surveys.
Tabulations
There are twenty-one standard tabulations included in this summary report that examine the principal travel patterns observed at each of the eleven airports surveyed throughout 2014.
Further information about the definitions used throughout this report can be found on our website http://www.caa.co.uk/surveys.
Those readers that wish to continue their analysis of traffic patterns observed at the airports covered in this report are encouraged to contact us directly at [email protected]. CAA is able to provide tailor prepared subsets of survey data, designed to answer specific questions. Our data fees start from £330.00 (GBP) + VAT. Whilst every care has been taken in producing the summary analysis found in this report, mistakes can occur. Should any reader believe that they have found any inconsistencies throughout this report we would be pleased to hear about them. Please contact us at [email protected] Totals may appear not to balance due to rounding. Copyright
Where every care has been taken to ensure that all figures quoted in this publication are correct, the Authority accepts no liability for errors made and any consequential misuse or misinterpretation of the data.
Extracts from this report may be copied but appropriate accreditation should be given to the Civil Aviation Authority.
3

Table 1Type of passengers using the 2014 survey airports.
Terminate * ConnectAirport International Domestic International Domestic Total
000's % 000's % 000's % 000's % 000's %
Birmingham 7,840 84.4 1,191 12.8 136 1.5 119 1.3 9,286 100.0 Doncaster 712 98.6 10 1.4 0.0 0.0 722 100.0 East Midlands 4,043 90.6 398 8.9 15 0.3 7 0.2 4,464 100.0 Gatwick 32,359 85.4 2,888 7.6 1,878 5.0 761 2.0 37,886 100.0 Heathrow 44,971 61.5 2,403 3.3 22,911 31.3 2,879 3.9 73,164 100.0 Leeds Bradford 2,603 87.2 367 12.3 12 0.4 2 0.1 2,983 100.0 Liverpool 3,115 78.4 738 18.6 67 1.7 51 1.3 3,971 100.0 London City 2,819 77.3 744 20.4 54 1.5 31 0.9 3,648 100.0 Luton 9,349 89.9 890 8.6 116 1.1 45 0.4 10,400 100.0 Manchester 18,841 87.0 2,102 9.7 353 1.6 363 1.7 21,660 100.0 Stansted 18,078 90.8 1,038 5.2 673 3.4 110 0.6 19,899 100.0
Total 144,730 77.0 12,768 6.8 26,215 13.9 4,370 2.3 188,083 100.0
* Includes interviews where passengers may not have answered all relevant core questions
4

Table 2.1Country of Residence and Journey Purpose of terminal passengers at the 2014 survey airports.
International Business International Leisure Domestic Business Domestic LeisureAirport UK Foreign UK Foreign UK Foreign UK Foreign Total
000's % 000's % 000's % 000's % 000's % 000's % 000's % 000's % 000's %
Birmingham 638 6.9 675 7.3 5,203 56.0 1,461 15.7 545 5.9 27 0.3 681 7.3 57 0.6 9,286 100.0 Doncaster 8 1.2 8 1.1 596 82.6 99 13.7 3 0.4 1 0.1 7 0.9 0 0.0 722 100.0 East Midlands 70 1.6 43 1.0 3,530 79.1 415 9.3 184 4.1 4 0.1 208 4.6 11 0.2 4,464 100.0 Gatwick 1,922 5.1 2,140 5.6 22,099 58.3 8,076 21.3 1,115 2.9 102 0.3 2,206 5.8 226 0.6 37,886 100.0 Heathrow 7,161 9.8 12,219 16.7 18,456 25.2 30,046 41.1 1,805 2.5 421 0.6 2,101 2.9 956 1.3 73,164 100.0 Leeds Bradford 90 3.0 79 2.7 2,114 70.9 331 11.1 117 3.9 8 0.3 219 7.4 24 0.8 2,983 100.0 Liverpool 136 3.4 100 2.5 2,196 55.3 750 18.9 131 3.3 11 0.3 604 15.2 43 1.1 3,971 100.0 London City 483 13.2 931 25.5 791 21.7 669 18.3 470 12.9 9 0.2 279 7.6 16 0.4 3,648 100.0 Luton 813 7.8 521 5.0 6,240 60.0 1,892 18.2 376 3.6 9 0.1 502 4.8 47 0.5 10,400 100.0 Manchester 1,715 7.9 1,059 4.9 13,764 63.5 2,656 12.3 966 4.5 122 0.6 1,183 5.5 195 0.9 21,660 100.0 Stansted 1,244 6.3 1,302 6.5 9,387 47.2 6,818 34.3 451 2.3 26 0.1 582 2.9 89 0.4 19,899 100.0
Total 14,281 7.6 19,077 10.1 84,375 44.9 53,213 28.3 6,164 3.3 739 0.4 8,571 4.6 1,664 0.9 188,083 100.0
Note: Excludes interviews where passengers may not have answered all relevant core questions
5

Table 2.2Country of Residence and Journey Purpose of terminal passengers at the 2014 survey airports.
Business LeisureAirport UK Foreign UK Foreign Total
000's % 000's % 000's % 000's % 000's %
Birmingham 1,184 12.7 702 7.6 5,884 63.4 1,518 16.3 9,286 100.0 Doncaster 11 1.6 9 1.2 603 83.5 99 13.7 722 100.0 East Midlands 254 5.7 46 1.0 3,737 83.7 426 9.5 4,464 100.0 Gatwick 3,037 8.0 2,242 5.9 24,305 64.2 8,302 21.9 37,886 100.0 Heathrow 8,966 12.3 12,640 17.3 20,557 28.1 31,002 42.4 73,164 100.0 Leeds Bradford 207 6.9 88 2.9 2,334 78.2 355 11.9 2,983 100.0 Liverpool 267 6.7 111 2.8 2,800 70.5 794 20.0 3,971 100.0 London City 953 26.1 940 25.8 1,070 29.3 685 18.8 3,648 100.0 Luton 1,189 11.4 530 5.1 6,742 64.8 1,939 18.6 10,400 100.0 Manchester 2,681 12.4 1,181 5.5 14,946 69.0 2,851 13.2 21,660 100.0 Stansted 1,695 8.5 1,328 6.7 9,968 50.1 6,908 34.7 19,899 100.0
Total 20,445 10.9 19,816 10.5 92,946 49.4 54,877 29.2 188,083 100.0
Note: Excludes interviews where passengers may not have answered all relevant core questions
6

Table 2.3Characteristics of terminal passengers at the 2014 survey airports.
International DomesticAirport UK Foreign UK Foreign Total
000's % 000's % 000's % 000's % 000's %
Birmingham 5,841 62.9 2,135 23.0 1,226 13.2 84 0.9 9,286 100.0 Doncaster 605 83.8 107 14.8 9 1.3 1 0.1 722 100.0 East Midlands 3,600 80.7 458 10.3 391 8.8 14 0.3 4,464 100.0 Gatwick 24,020 63.4 10,216 27.0 3,322 8.8 327 0.9 37,886 100.0 Heathrow 25,617 35.0 42,265 57.8 3,906 5.3 1,376 1.9 73,164 100.0 Leeds Bradford 2,204 73.9 410 13.8 336 11.3 32 1.1 2,983 100.0 Liverpool 2,332 58.7 850 21.4 735 18.5 54 1.4 3,971 100.0 London City 1,274 34.9 1,600 43.8 749 20.5 25 0.7 3,648 100.0 Luton 7,053 67.8 2,413 23.2 879 8.4 56 0.5 10,400 100.0 Manchester 15,479 71.5 3,715 17.2 2,148 9.9 317 1.5 21,660 100.0 Stansted 10,631 53.4 8,120 40.8 1,033 5.2 116 0.6 19,899 100.0
Total 98,656 52.5 72,289 38.4 14,734 7.8 2,403 1.3 188,083 100.0
Note: Excludes interviews where passengers may not have answered all relevant core questions
7

Table 3.1Characteristics of scheduled terminating passengers at the 2014 survey airports.
International Business International Leisure Domestic Business Domestic LeisureAirport UK Foreign UK Foreign UK Foreign UK Foreign Total
000's % 000's % 000's % 000's % 000's % 000's % 000's % 000's % 000's %
Birmingham 630 8.5 650 8.8 3,569 48.3 1,347 18.2 533 7.2 17 0.2 613 8.3 28 0.4 7,388 100.0 Doncaster 8 2.6 8 2.5 198 61.6 97 30.2 3 0.9 1 0.2 7 2.0 0.0 322 100.0 East Midlands 70 1.9 42 1.2 2,716 74.9 402 11.1 183 5.1 4 0.1 202 5.6 10 0.3 3,628 100.0 Gatwick 1,812 5.8 1,956 6.3 17,179 55.4 7,172 23.1 1,066 3.4 58 0.2 1,626 5.2 138 0.4 31,007 100.0 Heathrow 6,646 14.1 6,758 14.3 16,893 35.7 14,586 30.8 1,346 2.8 95 0.2 838 1.8 124 0.3 47,286 100.0 Leeds Bradford 90 3.1 79 2.7 2,027 70.3 323 11.2 116 4.0 8 0.3 219 7.6 24 0.8 2,885 100.0 Liverpool 135 3.5 97 2.5 2,148 55.9 728 18.9 129 3.4 10 0.3 559 14.5 40 1.0 3,846 100.0 London City 473 13.3 918 25.8 775 21.8 653 18.3 464 13.0 7 0.2 261 7.3 12 0.3 3,563 100.0 Luton 812 8.2 499 5.1 5,839 59.2 1,820 18.5 370 3.8 5 0.1 475 4.8 39 0.4 9,860 100.0 Manchester 1,680 9.8 1,007 5.8 9,977 58.0 2,451 14.2 849 4.9 95 0.6 1,032 6.0 125 0.7 17,215 100.0 Stansted 1,224 6.6 1,193 6.4 8,701 46.9 6,400 34.5 443 2.4 18 0.1 507 2.7 70 0.4 18,556 100.0
Total 13,580 9.3 13,207 9.1 70,022 48.1 35,980 24.7 5,503 3.8 317 0.2 6,338 4.4 608 0.4 145,555 100.0
Note: Excludes interviews where passengers may not have answered all relevant core questions
8

Table 3.2Characteristics of charter terminating passengers at the 2014 survey airports.
International Business International Leisure Domestic Business Domestic LeisureAirport UK Foreign UK Foreign UK Foreign UK Foreign Total
000's % 000's % 000's % 000's % 000's % 000's % 000's % 000's % 000's %
Birmingham 1 0.1 8 0.5 1,591 96.8 43 2.6 0 0.0 0 0.0 0 0.0 0 0.0 1,643 100.0 Doncaster 0 0.1 0 0.0 398 99.6 2 0.4 0 0.0 0 0.0 0 0.0 0 0.0 400 100.0 East Midlands 1 0.1 0 0.0 808 99.4 4 0.5 0 0.0 0 0.0 0 0.0 0 0.0 813 100.0 Gatwick 33 0.8 9 0.2 4,153 97.9 45 1.1 0 0.0 0 0.0 0 0.0 0 0.0 4,240 100.0 Heathrow 1 1.2 2 2.1 85 96.2 0 0.5 0 0.0 0 0.0 0 0.0 0 0.0 88 100.0 Leeds Bradford 0 0.4 0 0.0 84 99.1 0 0.5 0 0.0 0 0.0 0 0.0 0 0.0 85 100.0 Liverpool 0 0.0 0 0.0 6 81.3 1 18.7 0 0.0 0 0.0 0 0.0 0 0.0 7 100.0 London City 0 0.0 0 0.0 0 0.0 0 0.0 0 0.0 0 0.0 0 0.0 0 0.0 0 100.0 Luton 1 0.2 2 0.4 372 98.3 4 1.2 0 0.0 0 0.0 0 0.0 0 0.0 379 100.0 Manchester 18 0.5 1 0.0 3,674 98.5 34 0.9 0 0.0 0 0.0 2 0.1 0 0.0 3,729 100.0 Stansted 5 0.9 0 0.1 550 98.1 5 0.9 0 0.0 0 0.0 0 0.0 0 0.0 560 100.0
Total 60 0.5 22 0.2 11,720 98.1 140 1.2 0 0.0 0 0.0 2 0.0 0 0.0 11,944 100.0
Note: Excludes interviews where passengers may not have answered all relevant core questions
9

Table 3.3Characteristics of all terminating passengers at the 2014 survey airports.
International Business International Leisure Domestic Business Domestic LeisureAirport UK Foreign UK Foreign UK Foreign UK Foreign Total
000's % 000's % 000's % 000's % 000's % 000's % 000's % 000's % 000's %
Birmingham 632 7.0 658 7.3 5,160 57.1 1,390 15.4 533 5.9 17 0.2 613 6.8 28 0.3 9,031 100.0 Doncaster 8 1.2 8 1.1 596 82.6 99 13.7 3 0.4 1 0.1 7 0.9 0.0 722 100.0 East Midlands 70 1.6 42 0.9 3,525 79.4 406 9.1 183 4.1 4 0.1 202 4.5 10 0.2 4,441 100.0 Gatwick 1,845 5.2 1,965 5.6 21,331 60.5 7,218 20.5 1,066 3.0 58 0.2 1,626 4.6 138 0.4 35,246 100.0 Heathrow 6,647 14.0 6,760 14.3 16,978 35.8 14,587 30.8 1,346 2.8 95 0.2 838 1.8 124 0.3 47,374 100.0 Leeds Bradford 90 3.0 79 2.7 2,111 71.1 323 10.9 116 3.9 8 0.3 219 7.4 24 0.8 2,970 100.0 Liverpool 135 3.5 97 2.5 2,154 55.9 730 18.9 129 3.4 10 0.3 559 14.5 40 1.0 3,853 100.0 London City 473 13.3 918 25.8 775 21.8 653 18.3 464 13.0 7 0.2 261 7.3 12 0.3 3,563 100.0 Luton 812 7.9 501 4.9 6,211 60.7 1,825 17.8 370 3.6 5 0.0 475 4.6 39 0.4 10,239 100.0 Manchester 1,698 8.1 1,008 4.8 13,651 65.2 2,485 11.9 849 4.1 95 0.5 1,034 4.9 125 0.6 20,944 100.0 Stansted 1,229 6.4 1,193 6.2 9,250 48.4 6,405 33.5 443 2.3 18 0.1 507 2.7 70 0.4 19,116 100.0
Total 13,640 8.7 13,229 8.4 81,742 51.9 36,119 22.9 5,503 3.5 317 0.2 6,340 4.0 608 0.4 157,498 100.0
Note: Excludes interviews where passengers may not have answered all relevant core questions
10

Table 3.4Characteristics of all terminating passengers at the 2014 survey airports.
Business LeisureAirport UK Foreign UK Foreign Total
000's % 000's % 000's % 000's % 000's %
Birmingham 1,164 12.9 675 7.5 5,772 63.9 1,418 15.7 9,031 100.0 Doncaster 11 1.6 9 1.2 603 83.5 99 13.7 722 100.0 East Midlands 254 5.7 45 1.0 3,727 83.9 415 9.4 4,441 100.0 Gatwick 2,911 8.3 2,023 5.7 22,957 65.1 7,356 20.9 35,246 100.0 Heathrow 7,993 16.9 6,855 14.5 17,816 37.6 14,710 31.1 47,374 100.0 Leeds Bradford 206 6.9 87 2.9 2,330 78.5 347 11.7 2,970 100.0 Liverpool 264 6.8 107 2.8 2,713 70.4 769 20.0 3,853 100.0 London City 938 26.3 925 26.0 1,036 29.1 664 18.6 3,563 100.0 Luton 1,182 11.5 506 4.9 6,686 65.3 1,864 18.2 10,239 100.0 Manchester 2,547 12.2 1,102 5.3 14,685 70.1 2,609 12.5 20,944 100.0 Stansted 1,673 8.8 1,211 6.3 9,758 51.0 6,474 33.9 19,116 100.0
Total 19,143 12.2 13,546 8.6 88,082 55.9 36,727 23.3 157,498 100.0 Note: Excludes interviews where passengers may not have answered all relevant core questions
11

Table 4.1aOrigin/destination of terminating scheduled passengers at the 2014 survey airports.
Region Gatwick Heathrow London City Luton Stansted000's % 000's % 000's % 000's % 000's %
East Midlands 534 1.7 1,266 2.7 12 0.3 808 8.2 590 3.2 East of England 2,272 7.3 3,808 8.1 235 6.6 2,903 29.5 5,286 28.5 North East 70 0.2 71 0.2 0 0.0 18 0.2 44 0.2 North West 151 0.5 340 0.7 8 0.2 71 0.7 118 0.6 Scotland 66 0.2 109 0.2 1 0.0 28 0.3 39 0.2 South East 25,294 81.6 35,914 76.0 3,270 91.8 5,160 52.3 11,498 62.0 South West 1,496 4.8 3,172 6.7 17 0.5 256 2.6 350 1.9 Wales 380 1.2 837 1.8 5 0.2 52 0.5 91 0.5 West Midlands 446 1.4 1,159 2.5 6 0.2 440 4.5 306 1.7 Yorkshire and the Humber 277 0.9 553 1.2 6 0.2 122 1.2 214 1.2
Ireland 0 0.0 0 0.0 0 0.0 0 0.0 0 0.0
Total 30,988 100.0 47,229 100.0 3,561 100.0 9,858 100.0 18,536 100.0
Note: Excludes interviews where passengers may not have answered all relevant core questions
Table 4.1bOrigin/destination of terminating scheduled passengers at the 2014 survey airports.
Region Birmingham Doncaster East Midlands Leeds Bradford Liverpool Manchester000's % 000's % 000's % 000's % 000's % 000's %
East Midlands 1,245 16.9 58 18.1 2,277 62.8 52 1.8 38 0.0 618 4.8 East of England 67 0.9 1 0.4 38 1.1 5 0.2 3 0.0 20 0.3 North East 8 0.1 19 5.8 9 0.2 222 7.7 32 0.0 347 3.1 North West 62 0.8 16 4.9 28 0.8 100 3.5 3,026 96.0 10,847 51.6 Scotland 7 0.1 4 1.2 6 0.2 10 0.4 42 0.0 235 3.5 South East 376 5.1 2 0.6 33 0.9 2 0.1 11 0.0 53 0.4 South West 344 4.7 0 0.0 29 0.8 0 0.0 4 0.0 46 0.6 Wales 227 3.1 0 0.0 11 0.3 1 0.0 227 0.0 652 5.3 West Midlands 4,928 66.7 4 1.1 642 17.7 5 0.2 151 4.0 905 9.3 Yorkshire and the Humber 121 1.6 218 67.8 555 15.3 2,487 86.2 269 0.0 3,486 21.1
Ireland 0 0.0 0 0.0 0 0.0 0 0.0 31 0.8 0 0.0
Total 7,386 100.0 322 100.0 3,628 100.0 2,885 100.0 3,833 100.0 17,209 100.0
Note: Excludes interviews where passengers may not have answered all relevant core questions
12

Table 4.2aOrigin/destination of terminating charter passengers at the 2014 survey airports.
Region Gatwick Heathrow London City Luton Stansted000's % 000's % 000's % 000's % 000's %
East Midlands 119 2.8 4 4.0 - - 37 9.7 25 4.4 East of England 753 17.8 4 4.6 - - 195 51.4 396 70.6 North East 6 0.1 1 1.6 - - 0 0.0 0 0.0 North West 19 0.4 1 0.7 - - 4 0.9 2 0.3 Scotland 14 0.3 0 0.0 - - 0 0.0 0 0.0 South East 2,784 65.7 57 64.5 - - 120 31.6 126 22.5 South West 356 8.4 15 17.2 - - 12 3.2 4 0.7 Wales 101 2.4 0 0.4 - - 1 0.2 2 0.4 West Midlands 65 1.5 2 2.7 - - 11 2.9 3 0.5 Yorkshire and the Humber 24 0.6 4 4.3 - - 0 0.0 3 0.5
Ireland 0.0 0.0 - - 0 0.0 0 0.0
Total 4,240 100.0 88 100.0 - - 379 100.0 560 100.0
Note: Excludes interviews where passengers may not have answered all relevant core questions
Table 4.2bOrigin/destination of terminating charter passengers at the 2014 survey airports.
Region Birmingham Doncaster East Midlands Leeds Bradford Liverpool Manchester000's % 000's % 000's % 000's % 000's % 000's %
East Midlands 264 16.1 74 18.6 499 61.4 1 1.4 0 0.0 180 4.8 East of England 25 1.5 2 0.5 21 2.6 0 0.0 0 0.0 11 0.3 North East 4 0.3 7 1.8 4 0.5 7 8.5 0 0.0 114 3.1 North West 8 0.5 1 0.3 5 0.7 4 5.1 7 94.3 1,926 51.7 Scotland 1 0.0 1 0.2 2 0.2 0 0.0 0 0.0 129 3.5 South East 66 4.0 0 0.0 10 1.2 0 0.0 0 0.0 16 0.4 South West 120 7.3 0 0.1 2 0.3 2 2.1 0 0.0 22 0.6 Wales 80 4.9 0 0.0 2 0.2 0 0.3 0 0.0 197 5.3 West Midlands 1,039 63.2 2 0.4 141 17.3 0 0.0 0 4.0 345 9.3 Yorkshire and the Humber 36 2.2 312 78.1 126 15.5 70 82.7 0 0.0 788 21.1
Ireland 0 0.0 0 0.0 0 0.0 0 0.0 0 0.0 0 0.0
Total 1,643 100.0 400 100.0 813 100.0 85 100.0 7 100.0 3,728 100.0
Note: Excludes interviews where passengers may not have answered all relevant core questions
13

Table 4.3aOrigin/destination of terminating passengers at the 2014 survey airports.
Region Gatwick Heathrow London City Luton Stansted000's % 000's % 000's % 000's % 000's %
East Midlands 653 1.9 1,270 2.7 12 0.0 845 8.3 615 3.2 East of England 3,025 8.6 3,812 8.1 235 0.5 3,098 30.3 5,681 29.8 North East 76 0.2 73 0.2 0 0.0 18 0.2 44 0.2 North West 170 0.5 341 0.7 8 0.0 74 0.7 120 0.6 Scotland 80 0.2 109 0.2 1 0.0 28 0.3 39 0.2 South East 28,078 79.7 35,970 76.0 3,270 6.9 5,280 51.6 11,624 60.9 South West 1,852 5.3 3,187 6.7 17 0.0 269 2.6 354 1.9 Wales 481 1.4 837 1.8 5 0.0 53 0.5 93 0.5 West Midlands 511 1.5 1,162 2.5 6 0.0 451 4.4 310 1.6 Yorkshire and the Humber 301 0.9 557 1.2 6 0.0 122 1.2 216 1.1
Ireland 0 0.0 0 0.0 0 0.0 0 0.0 0 0.0
Total 35,228 100.0 47,317 100.0 3,561 100.0 10,237 100.0 19,096 100.0
Note: Excludes interviews where passengers may not have answered all relevant core questions
Table 4.3bOrigin/destination of terminating passengers at the 2014 survey airports.
Region Birmingham Doncaster East Midlands Leeds Bradford Liverpool Manchester000's % 000's % 000's % 000's % 000's % 000's %
East Midlands 1,509 16.7 133 18.4 2,776 62.5 53 1.8 38 1.0 797 3.8 East of England 93 1.0 3 0.4 59 1.3 5 0.2 3 0.1 31 0.1 North East 13 0.1 26 3.6 13 0.3 229 7.7 32 0.8 461 2.2 North West 70 0.8 17 2.4 34 0.8 105 3.5 3,033 79.0 12,773 61.0 Scotland 8 0.1 5 0.6 8 0.2 10 0.4 42 1.1 364 1.7 South East 442 4.9 2 0.3 43 1.0 2 0.1 11 0.3 70 0.3 South West 464 5.1 0 0.1 31 0.7 2 0.1 4 0.1 69 0.3 Wales 307 3.4 0.0 13 0.3 1 0.0 227 5.9 849 4.1 West Midlands 5,967 66.1 5 0.7 783 17.6 5 0.2 151 3.9 1,250 6.0 Yorkshire and the Humber 157 1.7 531 73.5 681 15.3 2,557 86.1 269 7.0 4,274 20.4
Ireland 0 0.0 0 0.0 0 0.0 0 0.0 31 0.8 0 0.0
Total 9,029 100.0 722 100.0 4,441 100.0 2,970 100.0 3,840 100.0 20,938 100.0
Note: Excludes interviews where passengers may not have answered all relevant core questions
14

Table 5.1Origin/destination patterns of terminating passengers at Birmingham Airport in 2014 within the West Midlands Planning Region.
Region County Scheduled Charter Total000's % 000's % 000's %
West Midlands County of Herefordshire 139 2.8 21 2.0 159 2.7 Shropshire County 260 5.3 59 5.7 319 5.3 Staffordshire County 420 8.5 125 12.1 545 9.1 Warwickshire County 615 12.5 114 11.0 729 12.2 West Midlands 2,967 60.2 551 53.1 3,518 59.0 Worcestershire County 527 10.7 169 16.2 696 11.7
Total 4,928 100.0 1,039 100.0 5,967 100.0
15

Table 5.2Origin/destination patterns of terminating passengers at Doncaster Airport in 2014 within the Yorkshire and the Humber Planning Region.
Region County Scheduled Charter Total000's % 000's % 000's %
Yorkshire and the Humber East Riding of Yorkshire 39 18.0 59 18.8 98 18.5 Lincolnshire County 25 11.4 50 16.2 75 14.2 North Yorkshire County 28 12.9 22 7.2 51 9.5 South Yorkshire 72 33.1 147 47.1 220 41.4 West Yorkshire 54 24.5 33 10.7 87 16.4
Total 218 100.0 312 100.0 531 100.0
16

Table 5.3Origin/destination patterns of terminating passengers at East Midlands Airport in 2014 within the East Midlands Planning Region.
Region County Scheduled Charter Total000's % 000's % 000's %
East Midlands Derbyshire County 608 26.7 129 25.9 737 26.6 Leicestershire County 596 26.2 102 20.5 698 25.1 Lincolnshire County 183 8.0 52 10.3 234 8.4 Northamptonshire County 115 5.1 30 6.0 145 5.2 Nottinghamshire County 760 33.4 185 37.2 945 34.1 Rutland 14 0.6 1 0.2 16 0.6
Total 2,277 100.0 499 100.0 2,776 100.0
17

Table 5.4Origin/destination patterns of terminating passengers at Gatwick Airport in 2014 within the South East Planning Region.
Region County Scheduled Charter Total000's % 000's % 000's %
South East Berkshire County 724 2.9 153 5.5 877 3.1 Buckinghamshire County 350 1.4 103 3.7 453 1.6 East Sussex County 1,986 7.9 175 6.3 2,162 7.7 Greater London 14,058 55.6 907 32.6 14,965 53.3 Hampshire County 1,522 6.0 326 11.7 1,848 6.6 Isle of Wight 81 0.3 21 0.7 101 0.4 Kent County 2,043 8.1 462 16.6 2,505 8.9 Oxfordshire County 538 2.1 86 3.1 625 2.2 Surrey County 2,119 8.4 324 11.6 2,443 8.7 West Sussex County 1,873 7.4 227 8.1 2,100 7.5
Total 25,294 100.0 2,784 100.0 28,078 100.0
18

Table 5.5Origin/destination patterns of terminating passengers at Heathrow Airport in 2014 within the South East Planning Region.
Region County Scheduled Charter Total000's % 000's % 000's %
South East Berkshire County 2,316 6.4 2 4.2 2,319 6.4 Buckinghamshire County 1,021 2.8 5 8.3 1,026 2.9 East Sussex County 528 1.5 4 6.5 531 1.5 Greater London 24,899 69.3 27 48.0 24,926 69.3 Hampshire County 1,771 4.9 6 11.0 1,777 4.9 Isle of Wight 57 0.2 0 0.0 57 0.2 Kent County 944 2.6 3 5.7 948 2.6 Oxfordshire County 1,395 3.9 2 2.7 1,396 3.9 Surrey County 2,069 5.8 6 11.2 2,076 5.8 West Sussex County 914 2.5 1 2.5 915 2.5
Total 35,914 100.0 57 100.0 35,970 100.0
19

Table 5.6Origin/destination patterns of terminating passengers at Leeds Bradford Airport in 2014 within the Yorkshire and the Humber Planning Region
Region County Scheduled Charter Total000's % 000's % 000's %
Yorkshire and the Humber East Riding of Yorkshire 191 7.7 5 7.3 196 7.7 Lincolnshire County 27 1.1 2 3.4 30 1.2 North Yorkshire County 585 23.5 14 19.5 599 23.4 South Yorkshire 157 6.3 7 10.5 165 6.4 West Yorkshire 1,526 61.4 42 59.2 1,568 61.3
Total 2,487 100.0 70 100.0 2,557 100.0
20

Table 5.7Origin/destination patterns of terminating passengers at Liverpool Airport in 2014 within the North West Planning Region.
Region County Scheduled Charter Total000's % 000's % 000's %
North West Cheshire County 491 16.2 0 0.0 491 16.2 Cumbria County 76 2.5 0 0.0 76 2.5 Greater Manchester 481 15.9 0 4.2 481 15.9 Lancashire County 367 12.1 0 0.0 367 12.1 Merseyside 1,611 53.2 6 95.8 1,617 53.3
Total 3,026 100.0 7 100.0 3,033 100.0
21

Table 5.8Origin/destination patterns of terminating passengers at London City Airport in 2014 within the South East Planning Region.
Region County Scheduled Charter Total000's % 000's % 000's %
South East Berkshire County 9 0.3 0 0.0 9 0.3 Buckinghamshire County 23 0.7 0 0.0 23 0.7 East Sussex County 20 0.6 0 0.0 20 0.6 Greater London 3,057 93.5 0 0.0 3,057 93.5 Hampshire County 10 0.3 0 0.0 10 0.3 Isle of Wight 0 0.0 0 0.0 0 0.0 Kent County 100 3.1 0 0.0 100 3.1 Oxfordshire County 8 0.3 0 0.0 8 0.3 Surrey County 30 0.9 0 0.0 30 0.9 West Sussex County 11 0.3 0 0.0 11 0.3
Total 3,270 100.0 0 0.0 3,270 100.0
22

Table 5.9Origin/destination patterns of terminating passengers at Luton Airport in 2014 within the South East Planning Region.
Region County Scheduled Charter Total000's % 000's % 000's %
South East Berkshire County 202 3.9 6 5.1 208 3.9 Buckinghamshire County 717 13.9 50 41.5 766 14.5 East Sussex County 26 0.5 0 0.0 26 0.5 Greater London 3,564 69.1 41 34.0 3,605 68.3 Hampshire County 134 2.6 3 2.8 138 2.6 Isle of Wight 1 0.0 0 0.0 1 0.0 Kent County 105 2.0 7 5.9 112 2.1 Oxfordshire County 222 4.3 9 7.9 231 4.4 Surrey County 121 2.3 3 2.7 124 2.4 West Sussex County 68 1.3 0 0.0 68 1.3
Total 5,160 100.0 120 100.0 5,280 100.0
23

Table 5.10Origin/destination patterns of terminating passengers at Manchester Airport in 2014 within the North West Planning Region.
Region County Scheduled Charter Total000's % 000's % 000's %
North West Cheshire County 1,709 15.8 299 15.5 2,009 15.7 Cumbria County 394 3.6 110 5.7 504 3.9 Greater Manchester 5,746 53.0 777 40.3 6,522 51.1 Lancashire County 1,555 14.3 379 19.7 1,933 15.1 Merseyside 1,444 13.3 361 18.7 1,804 14.1
Total 10,847 100.0 1,926 100.0 12,773 100.0
24

Table 5.11Origin/destination patterns of terminating passengers at Stansted Airport in 2014 within the South East Planning Region.
Region County Scheduled Charter Total000's % 000's % 000's %
South East Berkshire County 188 1.6 4 3.3 192 1.7 Buckinghamshire County 190 1.7 7 5.5 197 1.7 East Sussex County 116 1.0 0 0.0 116 1.0 Greater London 10,008 87.0 96 76.2 10,104 86.9 Hampshire County 178 1.5 6 4.7 184 1.6 Isle of Wight 4 0.0 0 0.0 4 0.0 Kent County 402 3.5 6 5.1 408 3.5 Oxfordshire County 184 1.6 1 0.8 185 1.6 Surrey County 155 1.4 5 4.1 161 1.4 West Sussex County 74 0.6 0 0.2 74 0.6
Total 11,498 100.0 126 100.0 11,624 100.0
25

Table 6.1Origin/destination patterns of terminating passengers at Birmingham Airport in 2014 within the West Midlands Planning Region.
Region County UK Foreign TotalBusiness Leisure Business Leisure
% % % % 000's %West Midlands County of Herefordshire 21.5 64.0 1.2 13.3 159 100.0
Shropshire County 10.6 69.7 6.2 13.4 319 100.0 Staffordshire County 11.4 67.9 6.9 13.7 545 100.0 Warwickshire County 14.1 58.5 12.3 15.1 729 100.0 West Midlands 12.2 60.1 8.7 19.0 3,518 100.0 Worcestershire County 11.2 73.4 3.1 12.3 696 100.0
Total 12.4 62.8 8.0 16.8 5,967 100.0
26

Table 6.2Origin/destination patterns of terminating passengers at Doncaster Airport in 2014 within the Yorkshire and the Humber Planning Region.
Region County UK Foreign TotalBusiness Leisure Business Leisure
% % % % 000's %Yorkshire and the Humber East Riding of Yorkshire 0.4 85.4 0.4 13.8 98 100.0
Lincolnshire County 0.7 91.7 1.2 6.3 75 100.0 North Yorkshire County 3.2 80.2 0.8 15.9 51 100.0 South Yorkshire 1.6 82.9 2.3 13.2 220 100.0 West Yorkshire 2.6 81.1 0.3 16.0 87 100.0
Total 1.6 84.1 1.3 13.0 531 100.0
27

Table 6.3Origin/destination patterns of terminating passengers at East Midlands Airport in 2014 within the East Midlands Planning Region.
Region County UK Foreign TotalBusiness Leisure Business Leisure
% % % % 000's %East Midlands Derbyshire County 10.3 81.8 0.5 7.4 737 100.0
Leicestershire County 10.7 75.3 2.2 11.8 698 100.0 Lincolnshire County 4.7 87.5 0.9 6.9 234 100.0 Northamptonshire County 5.3 88.3 1.2 5.3 145 100.0 Nottinghamshire County 4.5 83.0 1.0 11.5 945 100.0 Rutland 2.0 98.0 0.0 0.0 16 100.0
Total 7.7 81.5 1.1 9.7 2,776 100.0
28

Table 6.4Origin/destination patterns of terminating passengers at Gatwick Airport in 2014 within the South East Planning Region.
Region County UK Foreign TotalBusiness Leisure Business Leisure
% % % % 000's %South East Berkshire County 7.3 82.8 1.2 8.7 877 100.0
Buckinghamshire County 3.5 87.4 1.9 7.2 453 100.0 East Sussex County 8.8 63.2 2.6 25.4 2,162 100.0 Greater London 8.7 49.2 10.1 32.0 14,965 100.0 Hampshire County 7.0 80.1 2.5 10.4 1,848 100.0 Isle of Wight 1.7 81.6 5.9 10.8 101 100.0 Kent County 8.8 78.8 1.2 11.3 2,505 100.0 Oxfordshire County 8.9 68.7 3.6 18.8 625 100.0 Surrey County 9.6 73.0 2.8 14.5 2,443 100.0 West Sussex County 11.6 69.2 5.8 13.4 2,100 100.0
Total 8.8 60.7 6.7 23.8 28,078 100.0
29

Table 6.5Origin/destination patterns of terminating passengers at Heathrow Airport in 2014 within the South East Planning Region.
Region County UK Foreign TotalBusiness Leisure Business Leisure
% % % % 000's %South East Berkshire County 26.0 37.4 18.0 18.6 2,319 100.0
Buckinghamshire County 29.1 37.4 11.4 22.1 1,026 100.0 East Sussex County 17.6 47.7 7.7 26.9 531 100.0 Greater London 13.4 30.0 17.7 38.9 24,926 100.0 Hampshire County 22.8 40.7 12.3 24.1 1,777 100.0 Isle of Wight 13.4 53.0 13.7 19.9 57 100.0 Kent County 19.2 44.3 7.4 29.1 948 100.0 Oxfordshire County 20.8 37.9 15.6 25.8 1,396 100.0 Surrey County 27.4 44.9 13.0 14.7 2,076 100.0 West Sussex County 14.7 33.0 13.3 39.0 915 100.0
Total 16.5 33.2 16.4 34.0 35,970 100.0
30

Table 6.6Origin/destination patterns of terminating passengers at Leeds Bradford Airport in 2014 within the Yorkshire and the Humber Planning Region.
Region County UK Foreign TotalBusiness Leisure Business Leisure
% % % % 000's %Yorkshire and the Humber East Riding of Yorkshire 3.9 87.9 1.5 6.7 196 100.0
Lincolnshire County 2.4 83.9 10.1 3.6 30 100.0 North Yorkshire County 7.7 74.8 3.3 14.2 599 100.0 South Yorkshire 8.7 80.7 1.7 8.9 165 100.0 West Yorkshire 7.9 75.5 3.4 13.2 1,568 100.0
Total 7.5 76.7 3.2 12.6 2,557 100.0
31

Table 6.7Origin/destination patterns of terminating passengers at Liverpool Airport in 2014 within the North West Planning Region.
Region County UK Foreign TotalBusiness Leisure Business Leisure
% % % % 000's %North West Cheshire County 6.3 74.4 3.0 16.3 491 100.0
Cumbria County 3.4 87.8 2.2 6.5 76 100.0 Greater Manchester 7.2 68.8 3.2 20.8 481 100.0 Lancashire County 7.6 76.3 1.5 14.6 367 100.0 Merseyside 6.4 65.0 3.1 25.5 1,617 100.0
Total 6.6 69.0 2.9 21.5 3,033 100.0
32

Table 6.8Origin/destination patterns of terminating passengers at London City Airport in 2014 within the South East Planning Region.
Region County UK Foreign TotalBusiness Leisure Business Leisure
% % % % 000's %South East Berkshire County 18.5 73.1 2.8 5.6 9 100.0
Buckinghamshire County 43.3 29.0 15.9 11.8 23 100.0 East Sussex County 20.4 37.5 29.3 12.8 20 100.0 Greater London 24.1 27.5 28.7 19.6 3,057 100.0 Hampshire County 40.4 49.3 2.4 7.8 10 100.0 Isle of Wight 0.0 100.0 0.0 0.0 0 100.0 Kent County 43.1 36.9 7.4 12.6 100 100.0 Oxfordshire County 15.1 35.3 13.8 35.9 8 100.0 Surrey County 38.6 44.2 6.2 10.9 30 100.0 West Sussex County 30.6 34.0 10.3 25.1 11 100.0
Total 25.0 28.3 27.5 19.2 3,270 100.0
33

Table 6.9Origin/destination patterns of terminating passengers at Luton Airport in 2014 within the South East Planning Region.
Region County UK Foreign TotalBusiness Leisure Business Leisure
% % % % 000's %South East Berkshire County 13.0 67.4 5.4 14.1 208 100.0
Buckinghamshire County 15.0 70.4 3.7 10.9 766 100.0 East Sussex County 0.0 63.8 0.0 36.2 26 100.0 Greater London 8.1 58.9 5.5 27.5 3,605 100.0 Hampshire County 4.2 70.8 8.0 17.0 138 100.0 Isle of Wight 63.7 36.3 0.0 0.0 1 100.0 Kent County 11.0 64.4 7.6 17.1 112 100.0 Oxfordshire County 8.8 70.6 4.6 16.0 231 100.0 Surrey County 21.8 52.1 1.3 24.7 124 100.0 West Sussex County 11.8 59.9 4.8 23.4 68 100.0
Total 9.6 61.7 5.1 23.5 5,280 100.0
34

Table 6.10Origin/destination patterns of terminating passengers at Manchester Airport in 2014 within the North West Planning Region.
Region County UK Foreign TotalBusiness Leisure Business Leisure
% % % % 000's %North West Cheshire County 18.0 65.8 6.9 9.2 2,009 100.0
Cumbria County 8.2 77.4 3.2 11.2 504 100.0 Greater Manchester 13.8 63.4 6.8 16.0 6,522 100.0 Lancashire County 12.1 73.5 3.5 11.0 1,933 100.0 Merseyside 9.7 69.5 5.6 15.2 1,804 100.0
Total 13.4 66.7 6.0 13.9 12,773 100.0
35

Table 6.11Origin/destination patterns of terminating passengers at Stansted Airport in 2014 within the South East Planning Region.
Region County UK Foreign TotalBusiness Leisure Business Leisure
% % % % 000's %South East Berkshire County 6.3 59.7 7.2 26.8 192 100.0
Buckinghamshire County 17.2 52.7 7.4 22.7 197 100.0 East Sussex County 2.9 53.5 2.6 41.0 116 100.0 Greater London 5.3 42.0 7.0 45.6 10,104 100.0 Hampshire County 8.2 62.5 9.7 19.6 184 100.0 Isle of Wight 7.2 72.2 20.6 0.0 4 100.0 Kent County 9.5 58.1 6.4 25.9 408 100.0 Oxfordshire County 3.5 59.9 7.3 29.3 185 100.0 Surrey County 8.9 69.8 9.1 12.2 161 100.0 West Sussex County 14.9 40.7 5.2 39.2 74 100.0
Total 5.8 44.2 7.0 43.0 11,624 100.0
36

l 100 0 100 0 100 0 100 0 100 0 100 0
Table 7.1Modes of transport used at the 2014 survey airports. *
Gatwick Heathrow London City Luton Stansted% % % % %
Private 58.3 58.6 52.9 70.9 48.5Public 41.4 41.0 46.3 28.8 49.6 Other 0.2 0.3 0.8 0.3 1.9
Total 100.0 100.0 100.0 100.0 100.0Terminating passengers (000's) 34,994 46,991 3,533 10,186 18,855
Table 7.2Modes of transport used at the 2014 survey airports.*
Birmingham Doncaster East Midlands Leeds Bradford Liverpool Manchester% % % % % %
Private 76.5 90.8 92.4 88.5 79.3 83.5Public 22.7 9.0 7.4 11.3 20.4 16.2 Other 0.9 0.2 0.3 0.1 0.3 0.2
TotalTota 100.0 100 0. 100 0. 100 0. 100 0 100 0. .Terminating passengers (000's) 8,976 714 4,374 2,879 3,752 20,830
* These results are based on a departure survey only. The assumption, for weighting purposes, is that arriving and departing passengers share the same modal characteristics.** Detailed modal splits are available to purchase by emailing [email protected]
37

Table 8.1Modes of transport by passenger type used at Birmingham Airport in 2014.
Passenger Type Private Public Other Grand Total% % % %
UK Business 13.1 12.2 15.3 12.9UK Leisure 67.2 54.8 36.0 64.1
Foreign Business 6.7 9.0 23.1 7.3Foreign Leisure 13.0 24.0 25.7 15.6
Total 100.0 100.0 100.0 100.0Total terminating passengers (000's) 6,863 2,034 79 8,976
* These results are based on a departure survey only. The assumption, for weighting purposes, is that arriving and departing passengers share the same modal characteristics.** Detailed modal splits are available to purchase by emailing [email protected]: Excludes interviews where passengers may not have answered all relevant core questions
38

Table 8.2Modes of transport by passenger type used at Doncaster Airport in 2014.
Passenger Type Private Public Other Grand Total% % % %
UK Business 1.6 0.6 0.0 1.6UK Leisure 85.3 65.2 100.0 83.5
Foreign Business 0.8 5.5 0.0 1.2Foreign Leisure 12.3 28.7 0.0 13.7
Total 100.0 100.0 100.0 100.0Total terminating passengers (000's) 649 64 1 714
* These results are based on a departure survey only. The assumption, for weighting purposes, is that arriving and departing passengers share the same modal characteristics.** Detailed modal splits are available to purchase by emailing [email protected]: Excludes interviews where passengers may not have answered all relevant core questions
39

Table 8.3Modes of transport by passenger type used at East Midlands Airport in 2014.
Passenger Type Private Public Other Grand Total% % % %
UK Business 5.4 8.5 14.3 5.6UK Leisure 85.6 72.4 75.2 84.6
Foreign Business 0.9 1.4 9.0 0.9Foreign Leisure 8.2 17.6 1.5 8.9
Total 100.0 100.0 100.0 100.0Total terminating passengers (000's) 4,040 322 12 4,374
* These results are based on a departure survey only. The assumption, for weighting purposes, is that arriving and departing passengers share the same modal characteristics.** Detailed modal splits are available to purchase by emailing [email protected]: Excludes interviews where passengers may not have answered all relevant core questions
40

Table 8.4Modes of transport by passenger type used at Gatwick Airport in 2014.
Passenger Type Private Public Other Grand Total% % % %
UK Business 7.1 9.7 20.1 8.2UK Leisure 79.5 45.7 24.2 65.3
Foreign Business 2.3 10.3 33.8 5.7Foreign Leisure 11.1 34.3 21.9 20.7
Total 100.0 100.0 100.0 100.0Total terminating passengers (000's) 20,410 14,504 80 34,994
* These results are based on a departure survey only. The assumption, for weighting purposes, is that arriving and departing passengers share the same modal characteristics.** Detailed modal splits are available to purchase by emailing [email protected]: Excludes interviews where passengers may not have answered all relevant core questions
41

Table 8.5Modes of transport by passenger type used at Heathrow Airport in 2014.
Passenger Type Private Public Other Grand Total% % % %
UK Business 20.0 12.5 18.7 16.9UK Leisure 41.2 32.8 30.5 37.7
Foreign Business 13.1 16.2 32.2 14.4Foreign Leisure 25.7 38.5 18.6 30.9
Total 100.0 100.0 100.0 100.0Total terminating passengers (000's) 27,549 19,282 160 46,991
* These results are based on a departure survey only. The assumption, for weighting purposes, is that arriving and departing passengers share the same modal characteristics.** Detailed modal splits are available to purchase by emailing [email protected]: Excludes interviews where passengers may not have answered all relevant core questions
42

Table 8.6Modes of transport by passenger type used at Leeds Bradford Airport in 2014.
Passenger Type Private Public Other Grand Total% % % %
UK Business 7.0 3.9 41.3 6.7UK Leisure 82.2 61.5 44.8 79.8
Foreign Business 2.1 6.4 13.9 2.6Foreign Leisure 8.6 28.2 0.0 10.8
Total 100.0 100.0 100.0 100.0Total terminating passengers (000's) 2,548 326 4 2,879
* These results are based on a departure survey only. The assumption, for weighting purposes, is that arriving and departing passengers share the same modal characteristics.** Detailed modal splits are available to purchase by emailing [email protected]: Excludes interviews where passengers may not have answered all relevant core questions
43

Table 8.7Modes of transport by passenger type used at Liverpool Airport in 2014.
Passenger Type Private Public Other Grand Total% % % %
UK Business 7.3 4.3 2.5 6.7UK Leisure 74.3 60.5 38.2 71.4
Foreign Business 2.2 3.1 4.5 2.4Foreign Leisure 16.1 32.2 54.9 19.5
Total 100.0 100.0 100.0 100.0Total terminating passengers (000's) 2,975 765 13 3,752
* These results are based on a departure survey only. The assumption, for weighting purposes, is that arriving and departing passengers share the same modal characteristics.** Detailed modal splits are available to purchase by emailing [email protected]: Excludes interviews where passengers may not have answered all relevant core questions
44

Table 8.8Modes of transport by passenger type used at Londy City Airport in 2014.
Passenger Type Private Public Other Grand Total% % % %
UK Business 25.8 26.7 23.9 26.2UK Leisure 26.9 31.7 20.4 29.1
Foreign Business 30.5 20.5 46.5 26.0Foreign Leisure 16.8 21.1 9.3 18.7
Total 100.0 100.0 100.0 100.0Total terminating passengers (000's) 1,867 1,637 29 3,533
* These results are based on a departure survey only. The assumption, for weighting purposes, is that arriving and departing passengers share the same modal characteristics.** Detailed modal splits are available to purchase by emailing [email protected]: Excludes interviews where passengers may not have answered all relevant core questions
45

Table 8.9Modes of transport by passenger type used at Luton Airport in 2014.
Passenger Type Private Public Other Grand Total% % % %
UK Business 13.1 7.7 19.6 11.5UK Leisure 69.7 55.3 28.7 65.5
Foreign Business 3.9 6.9 34.8 4.9Foreign Leisure 13.3 30.1 16.9 18.1
Total 100.0 100.0 100.0 100.0Total terminating passengers (000's) 7,218 2,938 30 10,186
* These results are based on a departure survey only. The assumption, for weighting purposes, is that arriving and departing passengers share the same modal characteristics.** Detailed modal splits are available to purchase by emailing [email protected]: Excludes interviews where passengers may not have answered all relevant core questions
46

Table 8.10Modes of transport by passenger type used at Manchester Airport in 2014.
Passenger Type Private Public Other Grand Total% % % %
UK Business 12.4 10.5 62.8 12.2UK Leisure 72.3 60.2 4.3 70.2
Foreign Business 4.9 6.8 31.8 5.3Foreign Leisure 10.4 22.5 1.1 12.3
Total 100.0 100.0 100.0 100.0Total terminating passengers (000's) 17,400 3,384 46 20,830
* These results are based on a departure survey only. The assumption, for weighting purposes, is that arriving and departing passengers share the same modal characteristics.** Detailed modal splits are available to purchase by emailing [email protected]: Excludes interviews where passengers may not have answered all relevant core questions
47

Table 8.11Modes of transport by passenger type used at Stansted Airport in 2014.
Passenger Type Private Public Other Grand Total% % % %
UK Business 12.0 5.8 4.1 8.7UK Leisure 62.3 41.9 22.7 51.4
Foreign Business 4.2 8.1 8.2 6.2Foreign Leisure 21.6 44.3 65.0 33.7
Total 100.0 100.0 100.0 100.0Total terminating passengers (000's) 9,144 9,358 354 18,855
* These results are based on a departure survey only. The assumption, for weighting purposes, is that arriving and departing passengers share the same modal characteristics.** Detailed modal splits are available to purchase by emailing [email protected]: Excludes interviews where passengers may not have answered all relevant core questions
48
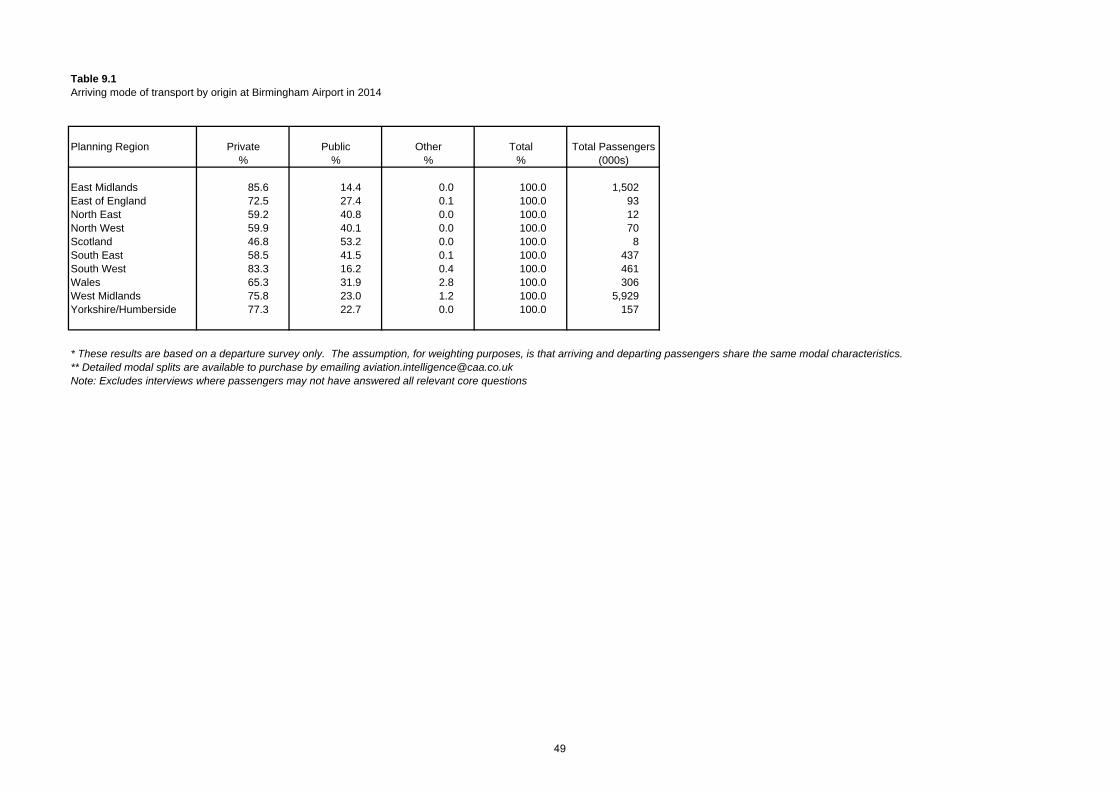
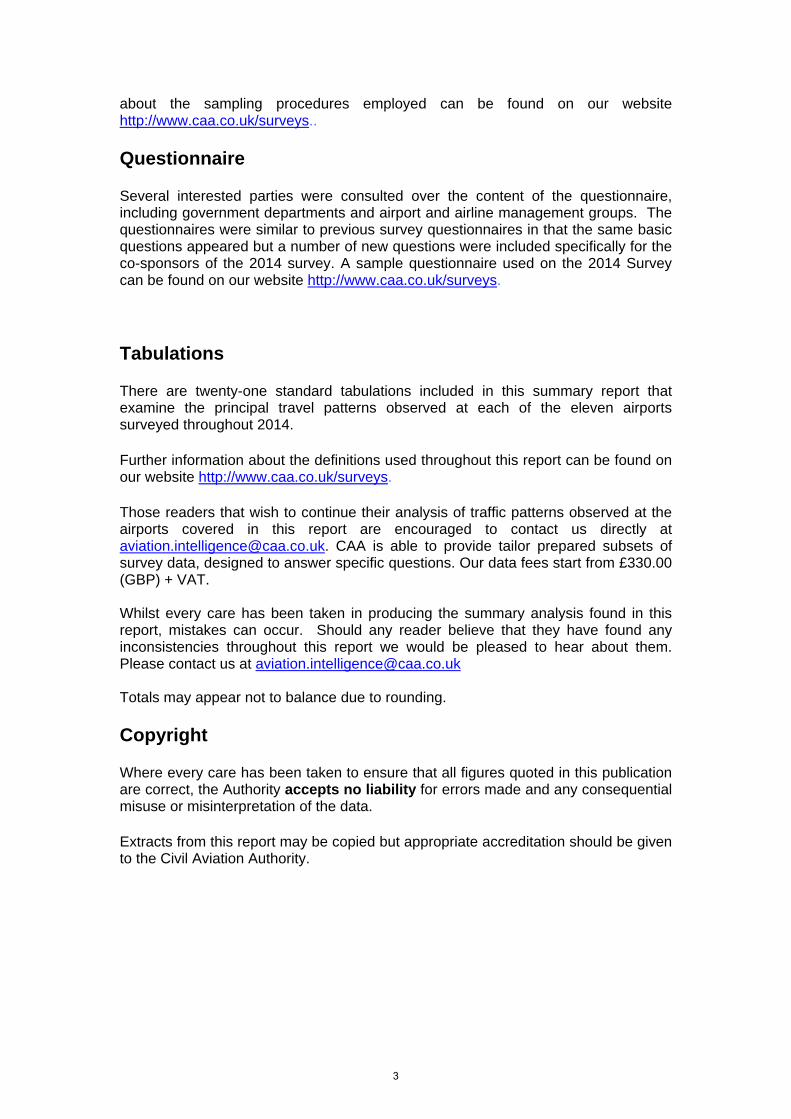
Table 9.1Arriving mode of transport by origin at Birmingham Airport in 2014
Planning Region Private Public Other Total Total Passengers% % % % (000s)
East Midlands 85.6 14.4 0.0 100.0 1,502East of England 72.5 27.4 0.1 100.0 93North East 59.2 40.8 0.0 100.0 12North West 59.9 40.1 0.0 100.0 70Scotland 46.8 53.2 0.0 100.0 8South East 58.5 41.5 0.1 100.0 437South West 83.3 16.2 0.4 100.0 461Wales 65.3 31.9 2.8 100.0 306West Midlands 75.8 23.0 1.2 100.0 5,929Yorkshire/Humberside 77.3 22.7 0.0 100.0 157
* These results are based on a departure survey only. The assumption, for weighting purposes, is that arriving and departing passengers share the same modal characteristics.** Detailed modal splits are available to purchase by emailing [email protected]: Excludes interviews where passengers may not have answered all relevant core questions
49

Table 9.2Arriving mode of transport by origin at Doncaster Airport in 2014
Planning Region Private Public Other Total Total Passengers% % % % (000s)
East Midlands 99.0 1.0 0.0 100.0 131East of England 100.0 0.0 0.0 100.0 3North East 79.4 20.6 0.0 100.0 26North West 83.2 16.8 0.0 100.0 17Scotland 76.0 24.0 0.0 100.0 5South East 67.6 32.4 0.0 100.0 2South West 100.0 0.0 0.0 100.0 0Wales 0.0 0.0 0.0 0.0 0West Midlands 85.0 15.0 0.0 100.0 5Yorkshire/Humberside 89.8 9.9 0.3 100.0 525
* These results are based on a departure survey only. The assumption, for weighting purposes, is that arriving and departing passengers share the same modal characteristics.** Detailed modal splits are available to purchase by emailing [email protected]: Excludes interviews where passengers may not have answered all relevant core questions
50

Table 9.3Arriving mode of transport by origin at East Midlands Airport in 2014
Planning Region Private Public Other Total Total Passengers% % % % (000s)
East Midlands 90.4 9.4 0.2 100.0 2,736East of England 100.0 0.0 0.0 100.0 58North East 89.1 10.9 0.0 100.0 13North West 97.9 2.1 0.0 100.0 32Scotland 100.0 0.0 0.0 100.0 7South East 80.9 17.6 1.5 100.0 43South West 97.6 2.4 0.0 100.0 31Wales 98.4 1.6 0.0 100.0 13West Midlands 97.1 2.5 0.4 100.0 769Yorkshire/Humberside 94.2 5.2 0.6 100.0 671
* These results are based on a departure survey only. The assumption, for weighting purposes, is that arriving and departing passengers share the same modal characteristics.** Detailed modal splits are available to purchase by emailing [email protected]: Excludes interviews where passengers may not have answered all relevant core questions
51

Table 9.4Arriving mode of transport by origin at Gatwick Airport in 2014
Planning Region Private Public Other Total Total Passengers% % % % (000s)
East Midlands 68.5 31.5 0.0 100.0 646East of England 79.1 20.9 0.0 100.0 3,015North East 31.1 68.9 0.0 100.0 76North West 47.3 52.7 0.0 100.0 169Scotland 39.0 61.0 0.0 100.0 68South East 54.8 44.9 0.3 100.0 27,891South West 74.5 25.5 0.0 100.0 1,841Wales 61.7 38.3 0.0 100.0 479West Midlands 66.1 33.9 0.0 100.0 507Yorkshire/Humberside 51.4 48.6 0.0 100.0 297
* These results are based on a departure survey only. The assumption, for weighting purposes, is that arriving and departing passengers share the same modal characteristics.** Detailed modal splits are available to purchase by emailing [email protected]: Excludes interviews where passengers may not have answered all relevant core questions
52

Table 9.5Arriving mode of transport by origin at Heathrow Airport in 2014
Planning Region Private Public Other Total Total Passengers% % % % (000s)
East Midlands 68.8 30.7 0.4 100.0 1,254East of England 71.9 28.1 0.0 100.0 3,782North East 35.7 64.3 0.0 100.0 69North West 46.7 53.2 0.1 100.0 340Scotland 17.0 83.0 0.0 100.0 109South East 57.2 42.5 0.3 100.0 35,737South West 60.5 39.0 0.5 100.0 3,161Wales 49.7 48.9 1.4 100.0 829West Midlands 68.3 31.5 0.2 100.0 1,153Yorkshire/Humberside 38.2 61.8 0.0 100.0 552
* These results are based on a departure survey only. The assumption, for weighting purposes, is that arriving and departing passengers share the same modal characteristics.** Detailed modal splits are available to purchase by emailing [email protected]: Excludes interviews where passengers may not have answered all relevant core questions
53

Table 9.6Arriving mode of transport by origin at Leeds Bradford Airport in 2014
Planning Region Private Public Other Total Total Passengers% % % % (000s)
East Midlands 92.1 7.9 0.0 100.0 51East of England 100.0 0.0 0.0 100.0 5North East 95.7 4.2 0.1 100.0 226North West 84.3 15.7 0.0 100.0 102Scotland 75.3 24.7 0.0 100.0 10South East 63.9 36.1 0.0 100.0 1South West 100.0 0.0 0.0 100.0 2Wales 100.0 0.0 0.0 100.0 1West Midlands 84.0 16.0 0.0 100.0 5Yorkshire/Humberside 88.0 11.8 0.2 100.0 2,475
* These results are based on a departure survey only. The assumption, for weighting purposes, is that arriving and departing passengers share the same modal characteristics.** Detailed modal splits are available to purchase by emailing [email protected]: Excludes interviews where passengers may not have answered all relevant core questions
54

Table 9.7Arriving mode of transport by origin at Liverpool Airport in 2014
Planning Region Private Public Other Total Total Passengers% % % % (000s)
East Midlands 68.8 31.2 0.0 100.0 36East of England 84.1 15.9 0.0 100.0 3North East 85.9 14.1 0.0 100.0 31North West 78.8 20.8 0.4 100.0 2,962Scotland 82.8 17.2 0.0 100.0 41South East 72.6 25.5 1.9 100.0 9South West 41.3 58.7 0.0 100.0 4Wales 88.3 11.7 0.0 100.0 219West Midlands 87.1 12.9 0.0 100.0 146Yorkshire/Humberside 76.9 23.1 0.0 100.0 262
* These results are based on a departure survey only. The assumption, for weighting purposes, is that arriving and departing passengers share the same modal characteristics.** Detailed modal splits are available to purchase by emailing [email protected]: Excludes interviews where passengers may not have answered all relevant core questions
55

Table 9.8Arriving mode of transport by origin at London City Airport in 2014
Planning Region Private Public Other Total Total Passengers% % % % (000s)
East Midlands 36.3 63.7 0.0 100.0 12East of England 69.6 30.4 0.0 100.0 234North East 52.0 48.0 0.0 100.0 0North West 1.3 98.7 0.0 100.0 8Scotland 0.0 100.0 0.0 100.0 1South East 51.9 47.2 0.9 100.0 3,241South West 48.2 51.8 0.0 100.0 17Wales 22.2 77.8 0.0 100.0 5West Midlands 64.4 31.7 3.9 100.0 6Yorkshire/Humberside 31.5 68.5 0.0 100.0 6
* These results are based on a departure survey only. The assumption, for weighting purposes, is that arriving and departing passengers share the same modal characteristics.** Detailed modal splits are available to purchase by emailing [email protected]: Excludes interviews where passengers may not have answered all relevant core questions
56

Table 9.9Arriving mode of transport by origin at Luton Airport in 2014
Planning Region Private Public Other Total Total Passengers% % % % (000s)
East Midlands 82.1 17.9 0.1 100.0 842East of England 87.5 11.8 0.7 100.0 3,083North East 76.0 24.0 0.0 100.0 18North West 60.6 39.4 0.0 100.0 74Scotland 62.4 37.6 0.0 100.0 27South East 59.4 40.4 0.1 100.0 5,250South West 61.8 38.2 0.0 100.0 269Wales 67.0 33.0 0.0 100.0 53West Midlands 76.0 24.0 0.0 100.0 449Yorkshire/Humberside 74.4 25.6 0.0 100.0 121
* These results are based on a departure survey only. The assumption, for weighting purposes, is that arriving and departing passengers share the same modal characteristics.** Detailed modal splits are available to purchase by emailing [email protected]: Excludes interviews where passengers may not have answered all relevant core questions
57

Table 9.10Arriving mode of transport by origin at Manchester Airport in 2014
Planning Region Private Public Other Total Total Passengers% % % % (000s)
East Midlands 84.3 15.7 0.0 100.0 797East of England 63.7 36.3 0.0 100.0 31North East 64.3 35.7 0.0 100.0 461North West 86.9 12.7 0.4 100.0 12,698Scotland 64.5 35.5 0.0 100.0 361South East 59.2 40.8 0.0 100.0 68South West 85.0 15.0 0.0 100.0 60Wales 92.4 7.6 0.0 100.0 849West Midlands 91.6 8.4 0.0 100.0 1,249Yorkshire/Humberside 73.4 26.6 0.0 100.0 4,254
* These results are based on a departure survey only. The assumption, for weighting purposes, is that arriving and departing passengers share the same modal characteristics.** Detailed modal splits are available to purchase by emailing [email protected]: Excludes interviews where passengers may not have answered all relevant core questions
58

Table 9.11Arriving mode of transport by origin at Stansted Airport in 2014
Planning Region Private Public Other Total Total Passengers% % % % (000s)
East Midlands 76.3 23.2 0.5 100.0 610East of England 76.3 22.9 0.7 100.0 5,607North East 62.3 36.9 0.9 100.0 43North West 45.5 53.3 1.2 100.0 117Scotland 20.3 77.1 2.5 100.0 34South East 33.2 64.3 2.5 100.0 11,483South West 55.6 42.7 1.7 100.0 347Wales 30.9 67.1 2.0 100.0 93West Midlands 53.3 45.6 1.1 100.0 305Yorkshire/Humberside 53.2 45.2 1.6 100.0 213
* These results are based on a departure survey only. The assumption, for weighting purposes, is that arriving and departing passengers share the same modal characteristics.** Detailed modal splits are available to purchase by emailing [email protected]: Excludes interviews where passengers may not have answered all relevant core questions
59

Table 10Number of separate modes of transport used by terminating passengers 2014.
Airport 1 Mode 2 Modes 3+ Modes Total Passengers% % % % (000's)
Birmingham 80.0 9.5 10.5 100.0 9,031Doncaster 92.6 4.8 2.6 100.0 722East Midlands 97.4 2.3 0.3 100.0 4,441Gatwick 76.0 22.3 1.7 100.0 35,246Heathrow 83.1 13.6 3.4 100.0 47,374Leeds Bradford 95.0 4.5 0.5 100.0 2,970Liverpool 89.4 8.8 1.8 100.0 3,853London City 65.6 27.8 6.6 100.0 3,563Luton 80.1 12.3 7.6 100.0 10,239Manchester 90.9 8.7 0.3 100.0 20,944Stansted 70.3 25.8 3.8 100.0 19,116
* These results are based on a departure survey only. The assumption, for weighting purposes, is that arriving and departing passengers share the same modal characteristics.** Detailed modal splits are available to purchase by emailing [email protected]
60

Table 11.1Group size of terminating air travellers at Birmingham Airport in 2014.
Group size UK Business UK Leisure Foreign Business Foreign Leisure All Passengers
% % % % %
Travelling alone 84.2 26.4 79.2 50.5 41.6Travelling with one other 12.2 51.5 12.7 35.4 41.0Travelling with two others 1.1 8.0 3.0 6.5 6.5Travelling with three others 0.6 8.5 2.9 4.7 6.5Travelling with four others 0.4 2.6 0.6 1.7 2.0Travelling with five or more 1.5 3.1 1.5 1.3 2.5
Total 100.0 100.0 100.0 100.0 100.0Total Passengers (000s) 1,164 5,772 675 1,418 9,031
61

Table 11.2Group size of terminating air travellers at Doncaster Airport in 2014.
Group size UK Business UK Leisure Foreign Business Foreign Leisure All Passengers
% % % % %
Travelling alone 81.4 17.8 46.5 48.6 21.8Travelling with one other 6.2 49.0 46.4 33.8 47.0Travelling with two others 2.9 11.3 0.0 10.1 11.0Travelling with three others 1.3 13.2 1.7 3.7 12.0Travelling with four others 8.3 4.0 0.0 2.2 3.9Travelling with five or more 0.0 4.7 5.4 1.7 4.3
Total 100.0 100.0 100.0 100.0 100.0Total Passengers (000s) 11 603 9 99 722
62

Table 11.3Group size of terminating air travellers at East Midlands Airport in 2014.
Group size UK Business UK Leisure Foreign Business Foreign Leisure All Passengers
% % % % %
Travelling alone 88.0 16.7 86.6 53.8 24.7Travelling with one other 10.0 53.3 7.9 36.4 48.8Travelling with two others 0.4 9.0 5.0 5.4 8.1Travelling with three others 0.3 12.5 0.5 3.1 10.9Travelling with four others 0.5 3.1 0.0 1.2 2.7Travelling with five or more 0.7 5.5 0.0 0.2 4.7
Total 100.0 100.0 100.0 100.0 100.0Total Passengers (000s) 254 3,727 45 415 4,441
63

Table 11.4Group size of terminating air travellers at Gatwick Airport in 2014.
Group size UK Business UK Leisure Foreign Business Foreign Leisure All Passengers
% % % % %
Travelling alone 85.4 27.5 87.5 45.7 39.2Travelling with one other 9.3 44.7 8.1 32.5 37.4Travelling with two others 1.3 4.8 0.6 6.0 4.6Travelling with three others 0.9 14.1 0.6 8.9 11.2Travelling with four others 0.4 4.0 0.1 1.9 3.1Travelling with five or more 2.7 4.8 3.1 5.1 4.6
Total 100.0 100.0 100.0 100.0 100.0Total Passengers (000s) 2,911 22,957 2,023 7,356 35,246
64

Table 11.5Group size of terminating air travellers at Heathrow Airport in 2014.
Group size UK Business UK Leisure Foreign Business Foreign Leisure All Passengers
% % % % %
Travelling alone 88.8 53.8 82.9 49.4 62.4Travelling with one other 6.9 32.1 10.4 31.9 24.8Travelling with two others 1.6 5.8 2.4 6.3 4.8Travelling with three others 1.0 4.8 1.5 6.3 4.2Travelling with four others 0.2 1.4 0.6 1.8 1.2Travelling with five or more 1.5 2.0 2.2 4.4 2.7
Total 100.0 100.0 100.0 100.0 100.0Total Passengers (000s) 7,993 17,816 6,855 14,710 47,374
65
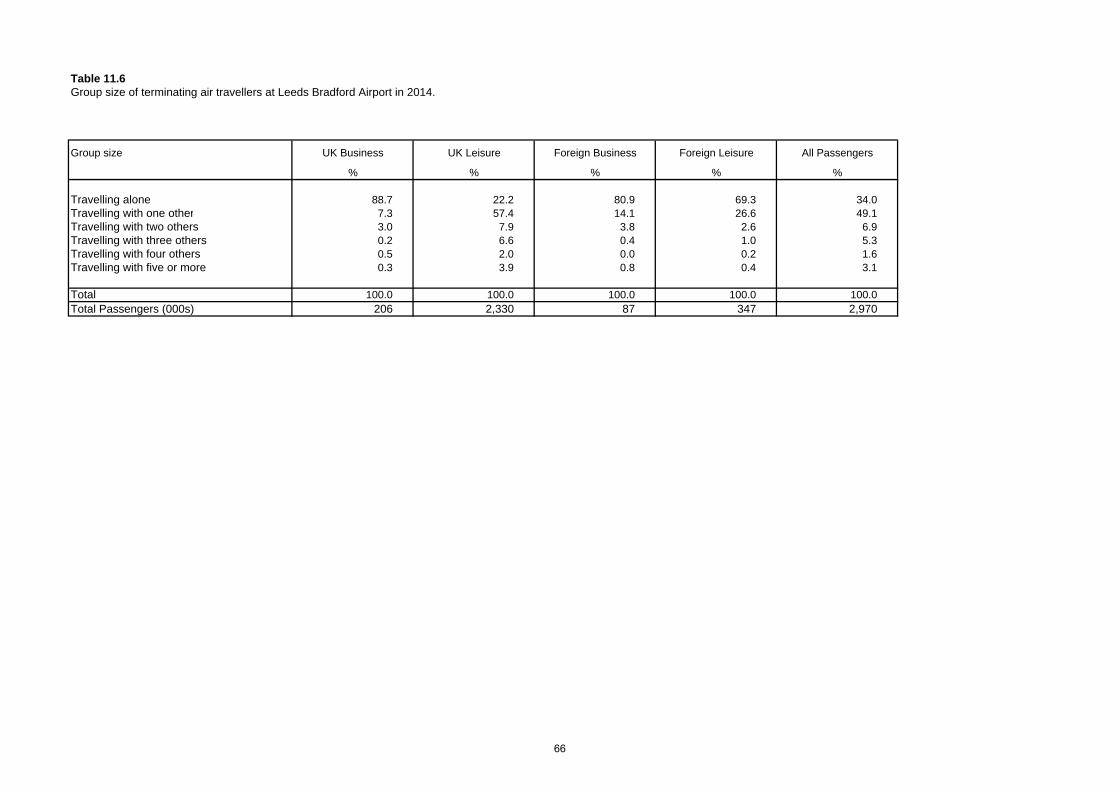
Table 11.6Group size of terminating air travellers at Leeds Bradford Airport in 2014.
Group size UK Business UK Leisure Foreign Business Foreign Leisure All Passengers
% % % % %
Travelling alone 88.7 22.2 80.9 69.3 34.0Travelling with one other 7.3 57.4 14.1 26.6 49.1Travelling with two others 3.0 7.9 3.8 2.6 6.9Travelling with three others 0.2 6.6 0.4 1.0 5.3Travelling with four others 0.5 2.0 0.0 0.2 1.6Travelling with five or more 0.3 3.9 0.8 0.4 3.1
Total 100.0 100.0 100.0 100.0 100.0Total Passengers (000s) 206 2,330 87 347 2,970
66

Table 11.7Group size of terminating air travellers at Liverpool Airport in 2014.
Group size UK Business UK Leisure Foreign Business Foreign Leisure All Passengers
% % % % %
Travelling alone 82.8 32.8 80.8 49.0 40.6Travelling with one other 11.5 45.1 15.1 35.2 40.1Travelling with two others 1.9 9.1 1.9 7.1 8.1Travelling with three others 1.2 7.5 1.8 5.3 6.5Travelling with four others 1.0 2.6 0.0 1.4 2.2Travelling with five or more 1.5 2.9 0.4 2.1 2.6
Total 100.0 100.0 100.0 100.0 100.0Total Passengers (000s) 264 2,713 107 769 3,853
67

Table 11.8Group size of terminating air travellers at London City Airport in 2014.
Group size UK Business UK Leisure Foreign Business Foreign Leisure All Passengers
% % % % %
Travelling alone 86.0 65.2 64.8 53.7 67.9Travelling with one other 13.0 27.3 30.2 36.2 26.2Travelling with two others 0.7 4.0 4.2 4.9 3.4Travelling with three others 0.2 2.6 0.4 2.8 1.5Travelling with four others 0.0 0.5 0.0 0.9 0.3Travelling with five or more 0.1 0.5 0.4 1.4 0.6
Total 100.0 100.0 100.0 100.0 100.0Total Passengers (000s) 938 1,036 925 664 3,563
68

Table 11.9Group size of terminating air travellers at Luton Airport in 2014.
Group size UK Business UK Leisure Foreign Business Foreign Leisure All Passengers
% % % % %
Travelling alone 85.8 44.2 80.4 56.5 52.9Travelling with one other 9.9 38.3 13.5 28.3 32.1Travelling with two others 2.5 7.2 2.5 5.5 6.2Travelling with three others 0.4 6.9 0.2 5.1 5.5Travelling with four others 0.2 1.7 0.0 2.1 1.5Travelling with five or more 1.2 1.6 3.4 2.5 1.8
Total 100.0 100.0 100.0 100.0 100.0Total Passengers (000s) 1,182 6,686 506 1,864 10,239
69

Table 11.10Group size of terminating air travellers at Manchester Airport in 2014.
Group size UK Business UK Leisure Foreign Business Foreign Leisure All Passengers
% % % % %
Travelling alone 86.5 21.6 76.5 54.0 35.9Travelling with one other 9.2 52.8 15.7 31.2 43.2Travelling with two others 2.9 9.5 2.8 6.8 8.1Travelling with three others 0.5 9.8 1.6 4.8 7.7Travelling with four others 0.2 2.7 0.9 1.2 2.1Travelling with five or more 0.6 3.5 2.5 2.1 2.9
Total 100.0 100.0 100.0 100.0 100.0Total Passengers (000s) 2,547 14,685 1,102 2,609 20,944
70

Table 11.11Group size of terminating air travellers at Stansted Airport in 2014.
Group size UK Business UK Leisure Foreign Business Foreign Leisure All Passengers
% % % % %
Travelling alone 89.3 49.8 85.3 51.8 56.6Travelling with one other 7.5 33.4 10.3 31.3 28.7Travelling with two others 1.5 6.6 2.5 7.2 6.0Travelling with three others 0.4 7.1 0.9 7.1 6.0Travelling with four others 0.0 1.6 0.2 1.0 1.2Travelling with five or more 1.4 1.5 0.7 1.6 1.5
Total 100.0 100.0 100.0 100.0 100.0Total Passengers (000s) 1,673 9,758 1,211 6,474 19,116
71

Table 12.1Number of people waving off terminating air travellers at Birmingham Airport in 2014.
People waving off UK Business UK Leisure Foreign Business Foreign Leisure All Passengers% % % % %
None 98.0 92.4 96.9 80.5 91.6One 1.4 5.9 2.3 11.7 5.9Two 0.6 1.4 0.8 5.5 1.9Three 0.1 0.3 0.0 1.7 0.4Four 0.0 0.0 0.0 0.3 0.1Five or more 0.0 0.0 0.0 0.3 0.1
Total 100.0 100.0 100.0 100.0 100.0Total Passengers (000s) 1,164 5,772 675 1,418 9,031
72

Table 12.2Number of people waving off terminating air travellers at Doncaster Airport in 2014.
This question was not asked at Doncaster Airport in 2014.
73

Table 12.3Number of people waving off terminating air travellers at East Midlands Airport in 2014.
People waving off UK Business UK Leisure Foreign Business Foreign Leisure All Passengers% % % % %
None 98.8 98.2 100.0 95.1 98.0One 1.1 1.3 0.0 3.0 1.4Two 0.1 0.3 0.0 1.9 0.5Three 0.0 0.1 0.0 0.0 0.1Four 0.0 0.0 0.0 0.0 0.0Five or more 0.0 0.0 0.0 0.0 0.0
Total 100.0 100.0 100.0 100.0 100.0Total Passengers (000s) 254 3,727 45 415 4,441
74

Table 12.4Number of people waving off terminating air travellers at Gatwick Airport in 2014.
People waving off UK Business UK Leisure Foreign Business Foreign Leisure All Passengers% % % % %
None 99.4 98.7 99.3 95.9 98.2One 0.5 0.8 0.4 1.1 0.8Two 0.1 0.3 0.2 2.8 0.8Three 0.1 0.1 0.0 0.1 0.1Four 0.0 0.0 0.0 0.0 0.0Five or more 0.0 0.0 0.0 0.0 0.0
Total 100.0 100.0 100.0 100.0 100.0Total Passengers (000s) 2,911 22,957 2,023 7,356 35,246
75

Table 12.5Number of people waving off terminating air travellers at Heathrow Airport in 2014.
People waving off UK Business UK Leisure Foreign Business Foreign Leisure All Passengers% % % % %
None 98.4 92.5 98.9 92.2 94.3One 1.1 4.6 0.9 4.2 3.4Two 0.3 1.8 0.1 2.3 1.5Three 0.1 0.8 0.0 1.2 0.7Four 0.1 0.1 0.0 0.1 0.1Five or more 0.0 0.2 0.1 0.1 0.1
Total 100.0 100.0 100.0 100.0 100.0Total Passengers (000s) 7,993 17,816 6,855 14,710 47,374
76

Table 12.6Number of people waving off terminating air travellers at Leeds Bradford Airport in 2014.
This question was not asked at Leeds Bradford Airport in 2014.
77

Table 12.7Number of people waving off terminating air travellers at Liverpool Airport in 2014.
This question was not asked at Liverpool Airport in 2014.
78

Table 12.8Number of people waving off terminating air travellers at London City Airport in 2014.
This question was not asked at London City Airport in 2014.
79

Table 12.9Number of people waving off terminating air travellers at Luton Airport in 2014.
People waving off UK Business UK Leisure Foreign Business Foreign Leisure All Passengers% % % % %
None 98.7 98.6 99.9 96.5 98.3One 1.2 1.1 0.1 2.4 1.3Two 0.1 0.2 0.0 1.0 0.3Three 0.0 0.0 0.0 0.2 0.0Four 0.0 0.0 0.0 0.0 0.0Five or more 0.0 0.0 0.0 0.0 0.0
Total 100.0 100.0 100.0 100.0 100.0Total Passengers (000s) 1,182 6,686 506 1,864 10,239
80

Table 12.10Number of people waving off terminating air travellers at Manchester Airport in 2014.
People waving off UK Business UK Leisure Foreign Business Foreign Leisure All Passengers% % % % %
None 99.0 98.3 99.3 93.8 97.9One 0.6 0.8 0.4 2.4 1.0Two 0.3 0.5 0.3 2.9 0.8Three 0.0 0.1 0.0 0.4 0.1Four 0.1 0.1 0.0 0.3 0.1Five or more 0.0 0.1 0.0 0.2 0.1
Total 100.0 100.0 100.0 100.0 100.0Total Passengers (000s) 2,547 14,685 1,102 2,609 20,944
81

Table 12.11Number of people waving off terminating air travellers at Stansted Airport in 2014.
People waving off UK Business UK Leisure Foreign Business Foreign Leisure All Passengers% % % % %
None 97.0 98.4 99.5 94.6 97.2One 0.7 1.2 0.5 4.4 2.1Two 2.1 0.3 0.0 0.9 0.6Three 0.2 0.0 0.0 0.1 0.1Four 0.0 0.0 0.0 0.0 0.0Five or more 0.0 0.0 0.0 0.1 0.0
Total 100.0 100.0 100.0 100.0 100.0Total Passengers (000s) 1,673 9,758 1,211 6,474 19,116
82

t tions
Table 13.1Trip length of terminating passengers at Birmingham Airport in 2014.
International Scheduled International Charter Domestic ALLUK UK Foreign Foreign UK UK Foreign Foreign UK UK Foreign Foreign
Business Leisure Business Leisure Business Leisure Business Leisure Business Leisure Business Leisure% % % % % % % % % % % % %
Up to 12 hrs 1.3 0.1 15.2 2.4 0.0 0.0 0.0 0.0 25.1 2.6 10.8 0.0 3.3Over 12 hrs to 1 day 5.6 0.1 6.6 1.9 0.0 0.0 0.0 0.0 7.3 4.0 8.7 0.7 1.9Over 1 day to 2 days 33.6 2.3 32.2 9.7 0.0 0.0 0.0 13.9 33.6 17.7 36.7 18.9 10.3Over 2 days to 3 days 23.4 6.6 18.2 8.5 0.0 0.4 0.0 1.3 15.4 17.7 30.4 22.7 9.1Over 3 days to 4 days 12.1 6.6 9.4 13.4 29.5 0.3 84.6 7.3 5.8 17.7 2.1 25.7 7.8Over 4 days to 5 days 7.4 7.1 5.7 15.4 0.0 1.0 15.4 12.4 3.4 10.1 11.3 14.3 7.1Over 5 days to 6 days 2.4 3.3 1.1 5.0 0.0 0.4 0.0 0.9 3.8 5.7 0.0 2.5 2.9Over 6 days to 1 week 4.7 27.4 2.3 11.0 0.0 54.0 0.0 22.8 3.6 13.3 0.0 9.3 24.2Over 1 week to 2 weeks 6.1 27.0 5.7 18.0 70.5 39.8 0.0 20.6 1.5 7.9 0.0 4.9 22.2Over 2 weeks to 3 weeks 0.9 8.9 1.0 7.6 0.0 2.8 0.0 6.6 0.4 2.2 0.0 1.2 5.5Over 3 weeks to 4 weeks 1.0 4.9 0.4 3.0 0.0 0.7 0.0 2.0 0.2 1.0 0.0 0.0 2.7Over 4 weeks 1.5 5.6 2.3 4.3 0.0 0.5 0.0 12.3 0.0 0.2 0.0 0.0 3.2
Total 100.0 100.0 100.0 100.0 100.0 100.0 100.0 100.0 100.0 100.0 100.0 100.0 100.0Total Terminating Passengers (000s) 630 3,569 650 1,347 1 1,591 8 43 533 613 17 28 9,031Mean Trip Length (days) 3.8 9.9 3.4 7.7 8.5 8.6 3.7 9.9 2.1 4.5 2.0 3.9 6.1
Note: Excludes interviews where passengers have not answered all relevent core questionsNote: Excludes interviews where passengers have no answered all relevent core ques
83

t tions
Table 13.2Trip length of terminating passengers at Doncaster Airport in 2014.
International Scheduled International Charter Domestic ALLUK UK Foreign Foreign UK UK Foreign Foreign UK UK Foreign Foreign
Business Leisure Business Leisure Business Leisure Business Leisure Business Leisure Business Leisure% % % % % % % % % % % % %
Up to 12 hrs 0.0 0.0 0.0 0.0 0.0 0.0 0.0 0.0 5.6 0.0 0.0 0.0 0.0Over 12 hrs to 1 day 0.0 0.0 0.0 0.0 0.0 0.1 0.0 0.0 22.5 0.0 0.0 0.0 0.1Over 1 day to 2 days 3.8 4.8 11.5 2.1 0.0 0.0 0.0 0.0 5.8 0.0 100.0 0.0 1.5Over 2 days to 3 days 0.0 6.5 3.0 13.1 0.0 0.2 0.0 0.0 8.5 2.7 0.0 0.0 2.7Over 3 days to 4 days 18.2 4.9 58.5 8.8 18.8 0.2 0.0 0.0 11.1 9.8 0.0 0.0 2.6Over 4 days to 5 days 12.0 4.0 13.9 10.8 0.0 0.1 0.0 0.0 5.6 11.9 0.0 0.0 2.1Over 5 days to 6 days 0.0 1.3 0.0 2.4 0.0 0.0 0.0 0.0 0.0 0.0 0.0 0.0 0.5Over 6 days to 1 week 33.8 28.0 0.0 26.9 0.0 52.1 0.0 25.5 41.0 55.8 0.0 0.0 44.0Over 1 week to 2 weeks 32.2 32.0 13.1 26.2 45.6 46.1 0.0 52.9 0.0 0.0 0.0 0.0 40.3Over 2 weeks to 3 weeks 0.0 12.7 0.0 6.3 0.0 0.8 0.0 0.0 0.0 19.8 0.0 0.0 4.1Over 3 weeks to 4 weeks 0.0 3.8 0.0 2.9 35.6 0.4 0.0 8.9 0.0 0.0 0.0 0.0 1.4Over 4 weeks 0.0 2.0 0.0 0.3 0.0 0.1 0.0 12.7 0.0 0.0 0.0 0.0 0.6
Total 100.0 100.0 100.0 100.0 100.0 100.0 0.0 100.0 100.0 100.0 100.0 0.0 100.0Total Terminating Passengers (000s) 8 198 8 97 0 398 0 2 3 7 1 0 722Mean Trip Length (days) 6.8 9.6 4.3 7.7 14.2 8.5 0.0 13.0 3.8 8.1 1.5 0.0 8.6
Note: Excludes interviews where passengers have not answered all relevent core questionsNote: Excludes interviews where passengers have no answered all relevent core ques
84

t tions
Table 13.3Trip length of terminating passengers at East Midlands Airport in 2014.
International Scheduled International Charter Domestic ALLUK UK Foreign Foreign UK UK Foreign Foreign UK UK Foreign Foreign
Business Leisure Business Leisure Business Leisure Business Leisure Business Leisure Business Leisure% % % % % % % % % % % % %
Up to 12 hrs 1.9 0.0 0.6 0.2 0.0 0.0 0.0 0.0 27.4 1.2 12.8 0.0 1.3Over 12 hrs to 1 day 8.7 0.1 3.9 1.5 0.0 0.0 0.0 0.0 12.6 2.0 2.8 0.0 1.0Over 1 day to 2 days 11.6 0.9 32.8 4.9 0.0 0.1 0.0 0.0 21.2 11.0 30.1 20.6 2.9Over 2 days to 3 days 18.7 4.0 18.4 9.7 0.0 0.6 0.0 0.0 12.8 23.5 10.8 16.0 5.4Over 3 days to 4 days 12.1 7.8 17.9 11.7 0.0 0.4 0.0 46.1 7.5 21.1 0.0 14.0 7.5Over 4 days to 5 days 18.7 6.8 6.8 9.7 0.0 0.1 0.0 0.0 12.4 14.3 4.9 18.0 6.5Over 5 days to 6 days 0.5 3.1 0.0 3.1 0.0 0.2 0.0 0.0 0.0 3.5 0.0 26.5 2.4Over 6 days to 1 week 11.4 37.4 4.2 20.5 100.0 54.6 0.0 4.1 3.5 14.6 38.6 3.2 36.1Over 1 week to 2 weeks 5.9 30.1 8.1 25.8 0.0 42.8 0.0 27.1 2.4 6.3 0.0 1.8 29.3Over 2 weeks to 3 weeks 5.6 4.9 3.5 4.2 0.0 0.5 0.0 13.4 0.1 1.1 0.0 0.0 3.6Over 3 weeks to 4 weeks 0.9 2.5 3.0 3.9 0.0 0.3 0.0 2.5 0.0 0.8 0.0 0.0 2.0Over 4 weeks 4.0 2.3 1.0 4.7 0.0 0.5 0.0 6.8 0.0 0.7 0.0 0.0 2.0
Total 100.0 100.0 100.0 100.0 100.0 100.0 0.0 100.0 100.0 100.0 100.0 100.0 100.0Total Terminating Passengers (000s) 70 2,716 42 402 1 808 0 4 183 202 4 10 4,441Mean Trip Length (days) 5.7 8.6 4.7 8.4 6.5 8.4 0.0 9.6 2.1 4.5 3.5 3.9 8.0
Note: Excludes interviews where passengers have not answered all relevent core questionsNote: Excludes interviews where passengers have no answered all relevent core ques
85

t tions
Table 13.4Trip length of terminating passengers at Gatwick Airport in 2014.
International Scheduled International Charter Domestic ALLUK UK Foreign Foreign UK UK Foreign Foreign UK UK Foreign Foreign
Business Leisure Business Leisure Business Leisure Business Leisure Business Leisure Business Leisure% % % % % % % % % % % % %
Up to 12 hrs 4.3 0.1 1.9 0.4 0.0 0.0 0.0 0.0 25.4 3.4 21.8 0.0 1.3Over 12 hrs to 1 day 6.8 0.3 2.5 0.7 0.0 0.2 0.0 2.0 16.0 2.3 0.0 0.0 1.3Over 1 day to 2 days 21.8 0.9 20.3 3.8 24.4 0.0 58.0 0.0 28.2 10.3 6.9 0.0 4.5Over 2 days to 3 days 13.7 5.2 19.1 8.6 0.0 0.1 0.0 0.0 10.5 14.5 6.8 3.5 6.8Over 3 days to 4 days 21.9 14.5 26.5 28.9 11.8 0.7 3.1 13.9 9.9 26.0 29.0 38.2 16.7Over 4 days to 5 days 8.9 9.6 10.9 14.0 0.0 0.4 0.0 3.4 5.1 12.9 5.1 11.8 9.2Over 5 days to 6 days 3.7 3.0 3.9 4.8 5.7 0.3 2.0 3.4 0.7 1.9 0.0 0.0 2.9Over 6 days to 1 week 6.9 29.1 6.6 11.5 31.3 53.2 34.7 44.5 1.8 16.8 9.2 46.5 25.6Over 1 week to 2 weeks 7.1 28.3 5.7 15.0 4.9 42.6 1.8 28.3 0.8 9.2 21.3 0.0 23.9Over 2 weeks to 3 weeks 1.6 5.2 0.6 5.2 0.0 1.6 0.0 2.7 0.3 1.5 0.0 0.0 4.0Over 3 weeks to 4 weeks 0.9 2.1 0.5 3.2 0.0 0.2 0.4 0.0 0.8 0.3 0.0 0.0 1.8Over 4 weeks 2.4 1.7 1.6 3.8 22.0 0.8 0.0 1.8 0.6 1.0 0.0 0.0 1.9
Total 100.0 100.0 100.0 100.0 100.0 100.0 100.0 100.0 100.0 100.0 100.0 100.0 100.0Total Terminating Passengers (000s) 1,812 17,179 1,956 7,172 33 4,153 9 45 1,066 1,626 58 138 35,246Mean Trip Length (days) 4.5 8.0 4.2 7.3 9.8 8.6 3.6 7.7 2.1 4.8 4.4 5.0 7.3
Note: Excludes interviews where passengers have not answered all relevent core questionsNote: Excludes interviews where passengers have no answered all relevent core ques
86

t tions
Table 13.5Trip length of terminating passengers at Heathrow Airport in 2014.
International Scheduled International Charter Domestic ALLUK UK Foreign Foreign UK UK Foreign Foreign UK UK Foreign Foreign
Business Leisure Business Leisure Business Leisure Business Leisure Business Leisure Business Leisure% % % % % % % % % % % % %
Up to 12 hrs 2.7 0.3 8.4 0.6 0.0 0.0 0.0 0.0 22.1 3.3 14.9 0.0 2.5Over 12 hrs to 1 day 4.1 0.2 4.9 0.4 0.0 0.0 0.0 0.0 11.0 2.7 1.4 2.1 1.9Over 1 day to 2 days 15.3 1.2 16.3 2.1 0.0 0.0 0.0 0.0 26.5 11.7 18.4 0.0 6.5Over 2 days to 3 days 14.0 3.1 9.6 3.5 0.0 0.0 0.0 0.0 13.4 22.7 14.1 19.9 6.4Over 3 days to 4 days 18.2 10.6 16.8 13.8 0.0 0.0 0.0 0.0 14.4 28.5 17.3 24.0 14.0Over 4 days to 5 days 9.5 7.5 10.6 9.2 0.0 0.0 0.0 0.0 5.0 12.7 0.0 8.8 8.7Over 5 days to 6 days 5.0 3.3 6.9 3.1 0.0 0.0 0.0 0.0 1.6 2.7 2.9 3.9 3.9Over 6 days to 1 week 10.3 12.6 9.8 15.4 0.0 81.1 100.0 100.0 2.3 5.7 23.0 14.3 12.5Over 1 week to 2 weeks 10.3 29.6 9.9 26.3 0.0 18.9 0.0 0.0 2.6 4.7 4.7 19.8 21.8Over 2 weeks to 3 weeks 4.1 14.0 2.7 9.8 0.0 0.0 0.0 0.0 1.0 3.6 3.4 7.2 9.1Over 3 weeks to 4 weeks 1.7 7.4 1.2 6.5 0.0 0.0 0.0 0.0 0.1 0.6 0.0 0.0 5.1Over 4 weeks 4.6 10.0 3.1 9.3 0.0 0.0 0.0 0.0 0.1 1.0 0.0 0.0 7.6
Total 100.0 100.0 100.0 100.0 0.0 100.0 100.0 100.0 100.0 100.0 100.0 100.0 100.0Total Terminating Passengers (000s) 6,646 16,893 6,758 14,586 1 85 2 0 1,346 838 95 124 47,374Mean Trip Length (days) 6.2 12.0 5.3 10.9 0.0 7.3 6.5 6.5 2.4 4.4 4.0 6.3 9.5
Note: Excludes interviews where passengers have not answered all relevent core questionsNote: Excludes interviews where passengers have no answered all relevent core ques
87

t tions
Table 13.6Trip length of terminating passengers at Leeds Bradford Airport in 2014.
International Scheduled International Charter Domestic ALLUK UK Foreign Foreign UK UK Foreign Foreign UK UK Foreign Foreign
Business Leisure Business Leisure Business Leisure Business Leisure Business Leisure Business Leisure% % % % % % % % % % % % %
Up to 12 hrs 7.9 0.0 14.1 1.5 0.0 0.0 0.0 0.0 29.3 2.2 0.0 3.7 2.2Over 12 hrs to 1 day 19.3 0.1 7.0 3.3 66.6 0.3 0.0 0.0 18.4 3.8 10.7 1.2 2.2Over 1 day to 2 days 18.2 1.3 37.1 9.4 0.0 0.6 0.0 0.0 22.7 5.4 9.3 0.0 4.8Over 2 days to 3 days 16.1 4.3 22.3 21.3 0.0 0.9 0.0 0.0 11.3 13.9 15.7 5.0 7.8Over 3 days to 4 days 8.8 8.3 6.2 13.8 0.0 0.2 0.0 0.0 3.1 11.5 20.0 3.9 8.6Over 4 days to 5 days 12.0 6.2 1.3 5.1 0.0 0.0 0.0 0.0 7.5 11.3 6.7 7.5 6.4Over 5 days to 6 days 2.0 1.4 0.7 1.6 33.4 0.3 0.0 0.0 0.1 2.3 5.1 2.9 1.4Over 6 days to 1 week 4.4 34.4 4.3 13.9 0.0 54.0 0.0 0.0 1.7 16.5 20.5 14.2 28.4Over 1 week to 2 weeks 7.0 33.3 4.1 20.7 0.0 38.7 0.0 100.0 5.0 16.7 8.4 33.2 28.1Over 2 weeks to 3 weeks 0.0 4.7 0.8 5.1 0.0 2.0 0.0 0.0 0.5 8.0 3.7 7.1 4.5Over 3 weeks to 4 weeks 3.2 3.3 0.2 0.6 0.0 0.0 0.0 0.0 0.0 2.2 0.0 6.4 2.6Over 4 weeks 1.1 2.8 1.8 3.6 0.0 3.1 0.0 0.0 0.4 6.3 0.0 14.8 3.0
Total 100.0 100.0 100.0 100.0 100.0 100.0 0.0 100.0 100.0 100.0 100.0 100.0 100.0Total Terminating Passengers (000s) 90 2,027 79 323 0 84 0 0 116 219 8 24 2,970Mean Trip Length (days) 3.9 8.9 2.9 6.7 2.4 8.9 0.0 10.5 2.1 8.0 4.8 12.2 8.1
Note: Excludes interviews where passengers have not answered all relevent core questionsNote: Excludes interviews where passengers have no answered all relevent core ques
88

t tions
Table 13.7Trip length of terminating passengers at Liverpool Airport in 2014.
International Scheduled International Charter Domestic ALLUK UK Foreign Foreign UK UK Foreign Foreign UK UK Foreign Foreign
Business Leisure Business Leisure Business Leisure Business Leisure Business Leisure Business Leisure% % % % % % % % % % % % %
Up to 12 hrs 4.8 0.2 12.2 1.5 0.0 0.0 0.0 0.0 31.6 5.0 8.9 1.7 2.7Over 12 hrs to 1 day 15.6 0.7 14.8 4.7 0.0 68.7 0.0 0.0 16.7 6.4 4.1 7.1 3.7Over 1 day to 2 days 18.3 4.0 20.1 11.6 0.0 11.5 0.0 100.0 16.3 17.4 4.7 20.6 8.8Over 2 days to 3 days 18.7 9.7 13.4 18.4 0.0 0.0 0.0 0.0 10.3 21.6 0.0 28.4 13.6Over 3 days to 4 days 17.0 13.0 5.8 13.9 0.0 0.0 0.0 0.0 7.3 15.8 11.4 22.3 13.4Over 4 days to 5 days 10.2 9.3 10.1 10.1 0.0 0.0 0.0 0.0 6.8 8.9 30.1 8.7 9.4Over 5 days to 6 days 1.4 2.8 0.0 2.4 0.0 19.8 0.0 0.0 1.1 3.4 5.5 4.2 2.7Over 6 days to 1 week 7.0 31.6 12.1 15.5 0.0 0.0 0.0 0.0 3.1 9.9 16.1 7.1 23.0Over 1 week to 2 weeks 4.4 21.3 6.5 13.7 0.0 0.0 0.0 0.0 5.7 6.8 13.6 0.0 16.1Over 2 weeks to 3 weeks 0.5 4.5 1.6 5.1 0.0 0.0 0.0 0.0 0.8 3.5 0.0 0.0 4.0Over 3 weeks to 4 weeks 2.0 1.6 0.8 1.0 0.0 0.0 0.0 0.0 0.0 0.7 5.5 0.0 1.3Over 4 weeks 0.3 1.3 2.6 2.2 0.0 0.0 0.0 0.0 0.4 0.6 0.0 0.0 1.3
Total 100.0 100.0 100.0 100.0 0.0 100.0 0.0 100.0 100.0 100.0 100.0 100.0 100.0Total Terminating Passengers (000s) 135 2,148 97 728 0 6 0 1 129 559 10 40 3,853Mean Trip Length (days) 3.6 7.2 4.1 6.0 0.0 1.8 0.0 1.5 2.4 4.3 6.0 3.0 6.1
Note: Excludes interviews where passengers have not answered all relevent core questionsNote: Excludes interviews where passengers have no answered all relevent core ques
89

t tions
Table 13.8Trip length of terminating passengers at London City Airport in 2014.
International Scheduled International Charter Domestic ALLUK UK Foreign Foreign UK UK Foreign Foreign UK UK Foreign Foreign
Business Leisure Business Leisure Business Leisure Business Leisure Business Leisure Business Leisure% % % % % % % % % % % % %
Up to 12 hrs 14.4 0.2 18.5 0.1 0.0 0.0 0.0 0.0 25.8 0.2 19.5 0.0 9.8Over 12 hrs to 1 day 15.9 2.1 12.5 1.9 0.0 0.0 0.0 0.0 22.7 7.4 24.8 0.0 9.5Over 1 day to 2 days 25.4 7.6 38.7 5.4 0.0 0.0 0.0 0.0 29.0 22.4 0.0 30.1 21.5Over 2 days to 3 days 19.9 10.2 10.2 24.3 0.0 0.0 0.0 0.0 9.5 18.1 12.4 0.0 14.6Over 3 days to 4 days 9.4 22.0 10.7 23.2 0.0 0.0 0.0 0.0 6.0 28.2 12.5 2.5 16.1Over 4 days to 5 days 4.8 13.4 2.1 16.7 0.0 0.0 0.0 0.0 3.2 6.3 0.0 4.1 8.0Over 5 days to 6 days 2.0 5.0 0.6 2.9 0.0 0.0 0.0 0.0 0.7 3.2 0.0 0.0 2.4Over 6 days to 1 week 2.5 17.7 3.5 8.6 0.0 0.0 0.0 0.0 1.4 5.3 18.4 63.4 7.5Over 1 week to 2 weeks 4.3 14.9 2.3 9.9 0.0 0.0 0.0 0.0 0.9 6.4 12.4 0.0 7.0Over 2 weeks to 3 weeks 0.6 4.1 0.3 4.8 0.0 0.0 0.0 0.0 0.3 1.3 0.0 0.0 2.0Over 3 weeks to 4 weeks 0.4 1.8 0.3 1.0 0.0 0.0 0.0 0.0 0.2 0.1 0.0 0.0 0.8Over 4 weeks 0.4 1.1 0.3 1.4 0.0 0.0 0.0 0.0 0.3 1.2 0.0 0.0 0.8
Total 100.0 100.0 100.0 100.0 0.0 0.0 0.0 0.0 100.0 100.0 100.0 100.0 100.0Total Terminating Passengers (000s) 473 775 918 653 0 0 0 0 464 261 7 12 3,563Mean Trip Length (days) 2.6 6.2 2.2 5.5 0.0 0.0 0.0 0.0 1.7 3.9 3.5 4.9 3.8
Note: Excludes interviews where passengers have not answered all relevent core questionsNote: Excludes interviews where passengers have no answered all relevent core ques
90
t tions
Table 13.9Trip length of terminating passengers at Luton Airport in 2014.
International Scheduled International Charter Domestic ALLUK UK Foreign Foreign UK UK Foreign Foreign UK UK Foreign Foreign
Business Leisure Business Leisure Business Leisure Business Leisure Business Leisure Business Leisure% % % % % % % % % % % % %
Up to 12 hrs 8.3 0.3 13.1 2.0 0.0 0.0 0.0 0.0 27.6 1.9 22.0 0.0 2.8Over 12 hrs to 1 day 2.5 0.3 10.3 0.8 0.0 0.0 0.0 0.0 13.3 2.6 0.0 2.9 1.6Over 1 day to 2 days 20.5 2.1 13.8 4.1 0.0 0.0 0.0 0.0 25.2 9.4 14.8 5.6 5.5Over 2 days to 3 days 24.4 8.4 13.7 8.6 0.0 0.1 0.0 0.0 12.8 24.2 16.9 33.4 10.5Over 3 days to 4 days 19.9 16.0 17.0 25.6 100.0 0.5 39.4 0.0 8.9 30.2 12.5 34.4 17.7Over 4 days to 5 days 9.0 9.0 10.4 12.9 0.0 0.5 0.0 0.0 6.7 9.3 0.0 6.2 9.2Over 5 days to 6 days 5.2 3.9 3.6 3.8 0.0 0.7 60.6 0.0 0.7 2.9 33.8 2.6 3.7Over 6 days to 1 week 5.5 22.5 8.6 16.3 0.0 53.8 0.0 0.0 2.0 9.7 0.0 8.2 19.6Over 1 week to 2 weeks 3.2 27.3 4.6 15.0 0.0 43.6 0.0 84.9 2.7 6.8 0.0 6.8 21.3Over 2 weeks to 3 weeks 0.4 6.8 1.1 4.8 0.0 0.3 0.0 15.1 0.2 2.3 0.0 0.0 5.0Over 3 weeks to 4 weeks 0.4 2.2 1.4 2.7 0.0 0.5 0.0 0.0 0.0 0.7 0.0 0.0 1.9Over 4 weeks 0.7 1.1 2.3 3.4 0.0 0.0 0.0 0.0 0.0 0.2 0.0 0.0 1.3
Total 100.0 100.0 100.0 100.0 100.0 100.0 100.0 100.0 100.0 100.0 100.0 100.0 100.0Total Terminating Passengers (000s) 812 5,839 499 1,820 1 372 2 4 370 475 5 39 10,239Mean Trip Length (days) 3.4 7.8 4.2 7.1 3.5 8.3 4.7 11.6 2.0 4.4 3.0 3.8 6.8
Note: Excludes interviews where passengers have not answered all relevent core questionsNote: Excludes interviews where passengers have no answered all relevent core ques
91

t tions
Table 13.10Trip length of terminating passengers at Manchester Airport in 2014.
International Scheduled International Charter Domestic ALLUK UK Foreign Foreign UK UK Foreign Foreign UK UK Foreign Foreign
Business Leisure Business Leisure Business Leisure Business Leisure Business Leisure Business Leisure% % % % % % % % % % % % %
Up to 12 hrs 4.6 0.1 11.4 0.9 0.0 0.0 0.0 0.0 25.0 5.8 6.6 1.1 2.2Over 12 hrs to 1 day 8.5 0.1 10.5 0.9 0.0 0.0 0.0 0.0 10.7 4.4 3.8 0.3 1.9Over 1 day to 2 days 17.6 1.6 19.1 5.0 16.5 0.0 100.0 0.0 17.7 10.7 7.9 2.1 4.7Over 2 days to 3 days 20.6 5.4 16.7 11.3 59.8 0.0 0.0 2.2 14.2 12.5 6.5 9.6 7.4Over 3 days to 4 days 11.7 7.9 9.0 11.3 0.0 0.6 0.0 0.0 8.8 9.1 5.0 7.3 7.2Over 4 days to 5 days 9.0 6.9 8.1 9.9 0.0 0.3 0.0 1.1 4.7 9.0 6.8 3.2 6.1Over 5 days to 6 days 4.7 3.1 1.9 2.7 4.3 0.1 0.0 0.0 2.1 4.8 0.0 3.3 2.6Over 6 days to 1 week 7.2 26.8 5.1 14.6 16.7 50.4 0.0 53.2 8.0 8.8 17.9 23.7 26.1Over 1 week to 2 weeks 7.5 31.2 9.5 21.4 2.7 45.8 0.0 23.5 3.7 10.3 33.3 27.9 28.2Over 2 weeks to 3 weeks 2.1 7.9 2.5 9.5 0.0 2.2 0.0 19.1 1.6 12.5 10.4 6.0 6.3Over 3 weeks to 4 weeks 2.6 4.1 1.6 5.4 0.0 0.2 0.0 0.0 1.7 2.2 0.8 6.7 3.1Over 4 weeks 3.9 4.9 4.6 7.1 0.0 0.2 0.0 1.0 1.9 9.9 1.0 8.7 4.3
Total 100.0 100.0 100.0 100.0 100.0 100.0 100.0 100.0 100.0 100.0 100.0 100.0 100.0Total Terminating Passengers (000s) 1,680 9,977 1,007 2,451 18 3,674 1 34 849 1,034 95 125 20,944Mean Trip Length (days) 5.3 9.7 5.1 9.5 3.4 8.7 1.5 9.7 3.6 8.7 7.8 10.5 8.7
Note: Excludes interviews where passengers have not answered all relevent core questionsNote: Excludes interviews where passengers have no answered all relevent core ques
92

t tions
Table 13.11Trip length of terminating passengers at Stansted Airport in 2014.
International Scheduled International Charter Domestic ALLUK UK Foreign Foreign UK UK Foreign Foreign UK UK Foreign Foreign
Business Leisure Business Leisure Business Leisure Business Leisure Business Leisure Business Leisure% % % % % % % % % % % % %
Up to 12 hrs 4.3 0.1 7.7 1.1 34.9 0.0 0.0 0.0 22.2 1.4 14.6 0.0 1.8Over 12 hrs to 1 day 7.2 0.6 7.0 1.0 0.0 0.1 0.0 0.0 18.8 2.8 0.0 6.4 2.1Over 1 day to 2 days 21.6 3.2 24.4 7.1 0.0 0.0 0.0 0.0 24.3 10.8 5.9 15.3 7.6Over 2 days to 3 days 17.7 6.0 9.1 10.1 0.0 0.0 0.0 0.0 9.3 21.2 4.6 26.7 8.5Over 3 days to 4 days 24.5 21.5 20.2 31.7 0.0 0.6 0.0 8.9 11.7 29.2 16.7 13.4 23.7Over 4 days to 5 days 8.7 11.6 8.3 17.3 0.0 0.7 0.0 0.0 7.6 10.7 3.9 4.6 12.3Over 5 days to 6 days 3.5 5.0 1.2 3.5 0.0 0.0 0.0 0.0 1.5 2.5 0.0 3.6 3.8Over 6 days to 1 week 7.0 23.2 8.1 12.3 15.3 61.8 0.0 10.8 1.3 8.0 46.1 24.9 18.5Over 1 week to 2 weeks 3.9 21.9 8.7 10.5 26.3 34.2 0.0 80.3 2.2 12.3 0.0 5.2 16.2Over 2 weeks to 3 weeks 0.3 3.9 1.1 2.0 0.0 1.5 0.0 0.0 0.8 0.6 8.2 0.0 2.7Over 3 weeks to 4 weeks 0.5 1.8 1.0 1.8 23.4 0.6 0.0 0.0 0.1 0.0 0.0 0.0 1.5Over 4 weeks 0.7 1.2 2.9 1.4 0.0 0.5 0.0 0.0 0.1 0.5 0.0 0.0 1.3
Total 100.0 100.0 100.0 100.0 100.0 100.0 0.0 100.0 100.0 100.0 100.0 100.0 100.0Total Terminating Passengers (000s) 1,224 8,701 1,193 6,400 5 550 0 5 443 507 18 70 19,116Mean Trip Length (days) 3.5 7.1 4.5 5.6 9.6 8.2 0.0 9.5 2.2 4.4 5.5 4.0 6.1
Note: Excludes interviews where passengers have not answered all relevent core questionsNote: Excludes interviews where passengers have no answered all relevent core ques
93

ALL
l (000 632 533 5 160 613 658 17 1 390 28 1 840 7 191
Table 14.1Income of UK and foreign passengers at Birmingham Airport in 2014. *
UK Passengers Foreign PassengersIncome Business Leisure Business Leisure Business Leisure
International Domestic International Domestic International Domestic International Domestic Total Total% % % % % % % % % %
Under £5,750 0.4 0.2 0.3 0.0 0.3 0.0 0.1 13.7 0.3 0.3£5,750-£8,624 0.4 0.3 4.2 4.2 0.9 0.0 2.2 0.0 0.5 3.7£8,625-£11,499 1.1 0.4 1.7 3.0 0.6 1.3 3.7 7.3 0.7 2.4£11,500-£14,374 1.1 1.2 9.7 9.0 2.3 0.0 8.9 11.3 1.5 9.4£14,375-£17,249 0.7 1.9 8.3 6.3 2.6 0.0 9.5 9.6 1.7 8.3£17,250-£22,999 3.6 8.4 10.8 10.4 4.3 0.0 8.2 9.1 5.3 10.2£23,000-£28,749 4.1 8.2 13.7 9.4 19.4 30.7 19.4 26.0 11.0 14.6£28,750-£34,499 6.2 9.7 9.5 7.8 19.5 24.3 12.0 5.5 12.2 9.9£34,500-£40,249 9.6 14.3 8.4 7.9 8.9 3.8 7.0 2.2 10.8 7.9£40,250-£45,999 11.7 7.6 7.1 10.2 8.1 5.6 5.9 1.6 9.1 7.1£46,000-£57,499 16.9 12.8 7.1 6.6 11.7 14.5 6.0 0.8 13.8 6.7£57,500-£80,499 19.6 20.5 9.2 12.7 9.5 13.0 4.8 5.7 16.2 8.6£80,500-£114,999 13.6 9.7 6.4 6.7 6.3 6.7 7.1 2.1 9.7 6.6£115,000-£172,999 7.8 2.5 2.4 3.2 3.6 0.0 3.4 0.6 4.6 2.7£173,000-£229,999 2.3 0.6 0.6 1.7 0.7 0.0 0.5 0.0 1.2 0.7Over £230,000 1.1 1.6 0.5 1.0 1.2 0.0 1.3 4.5 1.3 0.8
Total 100.0 100.0 100.0 100.0 100.0 100.0 100.0 100.0 100.0 100.0Total terminating passengersTota terminating passengers (000s)s) 632 533 5,160 613 658 17 1,390 28 1 840 7 191, ,Mean income £67,388 £56,022 £40,566 £46,788 £48,675 £42,636 £41,967 £36,728 £57,045 £41,570
Note: Excludes interviews where passengers have not answered all relevent core questions* Business passengers are asked for their personal income and leisure passengers are asked for their household income.
94

ALL
l (000 8 3 7 8 1 99 0 20 702
Table 14.2Income of UK and foreign passengers at Doncaster Airport in 2014. *
UK Passengers Foreign PassengersIncome Business Leisure Business Leisure Business Leisure
International Domestic International Domestic International Domestic International Domestic Total Total% % % % % % % % % %
Under £5,750 2.0 0.0 2.8 0.0 9.5 0.0 20.5 0.0 3.5 4.5£5,750-£8,624 0.0 0.0 6.2 0.0 5.9 0.0 26.3 0.0 1.6 8.0£8,625-£11,499 9.0 0.0 4.6 0.0 12.5 0.0 9.7 0.0 7.6 5.0£11,500-£14,374 0.7 0.0 6.7 0.0 24.0 0.0 3.5 0.0 6.8 6.3£14,375-£17,249 7.3 0.0 10.0 0.0 0.0 0.0 10.6 0.0 3.4 10.0£17,250-£22,999 9.9 0.0 9.3 13.0 11.5 0.0 8.4 0.0 7.7 9.3£23,000-£28,749 9.0 5.6 11.7 13.0 12.0 0.0 6.2 0.0 8.7 11.1£28,750-£34,499 19.6 9.8 10.2 17.8 0.0 0.0 1.7 0.0 11.3 9.5£34,500-£40,249 11.1 5.8 7.8 7.7 0.0 100.0 5.5 0.0 10.8 7.6£40,250-£45,999 0.0 0.0 8.4 7.9 0.0 0.0 0.7 0.0 0.0 7.6£46,000-£57,499 0.0 36.7 9.8 4.1 4.7 0.0 0.4 0.0 9.4 8.9£57,500-£80,499 18.3 14.0 7.2 13.9 0.0 0.0 2.1 0.0 11.6 6.8£80,500-£114,999 7.8 19.6 3.5 7.7 4.5 0.0 4.0 0.0 9.2 3.6£115,000-£172,999 2.0 8.5 1.4 14.8 10.7 0.0 0.0 0.0 5.7 1.3£173,000-£229,999 0.0 0.0 0.1 0.0 4.7 0.0 0.0 0.0 1.3 0.1Over £230,000 3.4 0.0 0.3 0.0 0.0 0.0 0.3 0.0 1.6 0.3
Total 100.0 100.0 100.0 100.0 100.0 100.0 100.0 0.0 100.0 100.0Total terminating passengersTota terminating passengers (000s)s) 8 3 596596 7 8 1 99 0 20 702Mean income £50,199 £66,736 £34,661 £58,466 £42,291 £37,375 £18,311 £0 £51,160 £33,237
Note: Excludes interviews where passengers have not answered all relevent core questions* Business passengers are asked for their personal income and leisure passengers are asked for their household income.
95

ALL
l (000 70 183 3 525 202 42 4 10 299 4 142
Table 14.3Income of UK and foreign passengers at East Midlands Airport in 2014. *
UK Passengers Foreign PassengersIncome Business Leisure Business Leisure Business Leisure
International Domestic International Domestic International Domestic International Domestic Total Total% % % % % % % % % %
Under £5,750 1.3 0.1 3.0 3.1 1.0 0.0 14.9 22.5 0.5 4.1£5,750-£8,624 1.0 0.5 3.6 8.5 0.0 0.0 5.2 0.0 0.6 4.1£8,625-£11,499 0.0 0.2 3.5 1.7 0.8 0.0 2.2 0.0 0.2 3.2£11,500-£14,374 0.0 0.3 5.9 5.7 0.8 0.0 4.9 0.0 0.3 5.8£14,375-£17,249 1.7 2.8 7.9 2.3 7.9 0.0 13.2 0.0 3.1 8.0£17,250-£22,999 4.3 2.4 10.4 8.2 0.0 0.0 15.3 13.8 2.6 10.7£23,000-£28,749 2.5 5.4 11.9 14.5 4.1 0.0 11.5 0.0 4.5 12.1£28,750-£34,499 2.0 21.6 10.4 13.7 5.5 0.0 10.7 0.0 14.7 10.6£34,500-£40,249 14.1 18.8 8.9 6.6 29.1 0.0 4.0 0.0 18.7 8.3£40,250-£45,999 13.3 13.4 9.4 6.2 11.6 0.0 2.2 42.4 13.0 8.5£46,000-£57,499 11.4 8.8 7.3 5.7 12.1 0.0 8.0 0.0 9.8 7.2£57,500-£80,499 8.0 12.6 10.9 8.5 7.8 0.0 1.7 0.0 10.8 9.8£80,500-£114,999 31.2 5.7 4.1 8.3 12.0 77.3 2.3 0.0 13.3 4.2£115,000-£172,999 7.3 5.8 2.2 5.4 5.8 22.7 3.0 21.3 6.3 2.6£173,000-£229,999 1.5 0.6 0.2 1.7 1.6 0.0 0.1 0.0 0.9 0.3Over £230,000 0.5 1.0 0.4 0.0 0.0 0.0 0.7 0.0 0.7 0.4
Total 100.0 100.0 100.0 100.0 100.0 100.0 100.0 100.0 100.0 100.0Total terminating passengersTota terminating passengers (000s)s) 70 183 3,525 202 42 4 406 10 299 4 142406 ,Mean income £70,458 £53,370 £38,629 £44,981 £55,006 £108,240 £29,807 £52,324 £58,213 £38,250
Note: Excludes interviews where passengers have not answered all relevent core questions* Business passengers are asked for their personal income and leisure passengers are asked for their household income.
96

ALL
l (000 1 845 1 066 21 331 1 626 1 965 58 7 218 138 4 934 30 313
Table 14.4Income of UK and foreign passengers at Gatwick Airport in 2014. *
UK Passengers Foreign PassengersIncome Business Leisure Business Leisure Business Leisure
International Domestic International Domestic International Domestic International Domestic Total Total% % % % % % % % % %
Under £5,750 3.6 0.0 3.7 3.0 0.9 0.0 5.0 4.8 1.8 4.0£5,750-£8,624 0.7 0.0 0.7 0.6 0.6 0.0 1.3 0.0 0.5 0.8£8,625-£11,499 0.8 0.4 1.5 2.9 1.1 0.0 4.2 1.3 0.8 2.2£11,500-£14,374 1.7 0.0 2.3 2.2 0.7 0.0 4.6 1.1 0.9 2.9£14,375-£17,249 1.3 1.3 3.7 5.0 2.8 0.0 6.5 8.2 1.8 4.5£17,250-£22,999 1.7 2.2 6.6 8.8 4.2 0.0 7.2 0.0 2.8 6.8£23,000-£28,749 7.7 4.7 7.6 8.2 5.5 0.0 6.0 0.0 6.2 7.2£28,750-£34,499 9.7 8.7 9.4 9.5 6.5 3.9 7.8 0.0 8.3 9.0£34,500-£40,249 9.5 8.2 9.7 10.2 14.5 8.1 7.6 45.9 11.1 9.4£40,250-£45,999 10.7 10.1 9.6 8.0 15.8 44.4 8.2 1.4 12.7 9.2£46,000-£57,499 12.5 16.2 10.3 7.9 12.6 0.0 8.9 1.0 13.3 9.8£57,500-£80,499 15.5 24.8 15.4 13.4 15.3 0.0 13.9 16.4 17.3 15.0£80,500-£114,999 10.3 12.3 9.7 8.8 9.9 18.1 10.4 12.4 10.6 9.9£115,000-£172,999 9.0 8.0 5.7 5.4 6.3 10.4 5.5 0.7 7.8 5.6£173,000-£229,999 1.4 0.8 1.5 3.2 1.1 7.6 1.6 5.3 1.2 1.6Over £230,000 3.8 2.3 2.4 2.9 2.2 7.5 1.4 1.7 2.9 2.2
Total 100.0 100.0 100.0 100.0 100.0 100.0 100.0 100.0 100.0 100.0Total terminating passengersTota terminating passengers (000s)s) 1 845, 1 066, 21,331 1 626, 1 965, 58 7,218 138 4 934 30 313, ,Mean income £68,822 £69,501 £59,195 £60,651 £62,069 £93,924 £53,733 £60,071 £66,647 £57,970
Note: Excludes interviews where passengers have not answered all relevent core questions* Business passengers are asked for their personal income and leisure passengers are asked for their household income.
97

ALL
l (000 6 647 1 346 16 978 838 6 760 95 14 587 124 14 848 32 527
Table 14.5Income of UK and foreign passengers at Heathrow Airport in 2014. *
UK Passengers Foreign PassengersIncome Business Leisure Business Leisure Business Leisure
International Domestic International Domestic International Domestic International Domestic Total Total% % % % % % % % % %
Under £5,750 0.4 0.1 11.2 3.2 1.1 0.0 3.8 0.0 0.7 7.5£5,750-£8,624 0.3 0.1 3.3 6.3 1.5 4.9 2.6 6.1 0.9 3.1£8,625-£11,499 0.6 0.5 2.8 2.7 1.1 2.4 2.1 1.0 0.8 2.5£11,500-£14,374 0.8 0.2 3.0 1.4 1.2 0.0 3.4 3.5 0.9 3.1£14,375-£17,249 0.4 1.0 3.5 2.4 1.4 1.0 2.1 10.1 0.9 2.9£17,250-£22,999 1.8 2.3 4.6 4.3 2.2 4.9 4.5 6.9 2.1 4.6£23,000-£28,749 4.7 4.7 7.8 6.2 5.6 3.6 8.3 1.6 5.1 8.0£28,750-£34,499 7.2 10.7 7.4 6.5 7.6 9.1 10.6 4.9 7.7 8.8£34,500-£40,249 11.6 11.9 8.4 10.2 8.2 7.3 8.0 8.7 10.1 8.3£40,250-£45,999 9.7 9.1 6.3 7.3 8.9 0.0 8.3 6.0 9.2 7.3£46,000-£57,499 14.1 15.7 9.6 9.6 10.8 21.7 9.8 7.8 12.8 9.6£57,500-£80,499 17.5 21.8 11.8 15.6 19.5 19.9 12.4 7.0 18.8 12.2£80,500-£114,999 13.9 10.0 7.6 10.1 12.6 14.7 10.6 19.9 13.0 9.1£115,000-£172,999 10.9 8.2 6.6 8.6 10.0 7.8 7.1 1.2 10.2 6.9£173,000-£229,999 2.1 2.1 3.6 2.0 3.7 0.0 2.8 0.0 2.8 3.2Over £230,000 4.0 1.6 2.6 3.7 4.8 2.8 3.6 15.1 4.1 3.1
Total 100.0 100.0 100.0 100.0 100.0 100.0 100.0 100.0 100.0 100.0Total terminating passengersTota terminating passengers (000s)s) 6 647, 1 346, 16,978 838 6 760, 95 14,587 124 14 848 32 527, ,Mean income £77,433 £67,479 £57,950 £65,981 £79,189 £67,070 £64,815 £87,035 £77,285 £61,466
Note: Excludes interviews where passengers have not answered all relevent core questions* Business passengers are asked for their personal income and leisure passengers are asked for their household income.
98

ALL
l (000 90 116 2 111 219 79 8 24 293 2 677
Table 14.6Income of UK and foreign passengers at Leeds Bradford Airport in 2014. *
UK Passengers Foreign PassengersIncome Business Leisure Business Leisure Business Leisure
International Domestic International Domestic International Domestic International Domestic Total Total% % % % % % % % % %
Under £5,750 0.0 0.3 15.2 16.7 4.4 15.9 10.1 23.3 1.5 14.6£5,750-£8,624 0.0 0.0 1.2 5.2 1.7 0.0 1.2 0.0 0.4 1.7£8,625-£11,499 2.6 0.4 3.6 5.1 0.0 0.0 5.0 0.0 0.9 4.0£11,500-£14,374 2.3 1.7 3.9 3.0 8.8 0.0 2.0 0.0 3.5 3.4£14,375-£17,249 0.7 0.7 11.1 7.8 0.3 0.0 2.4 23.1 0.6 9.4£17,250-£22,999 0.7 2.9 10.6 6.8 0.0 0.0 10.9 0.0 1.5 10.1£23,000-£28,749 12.1 8.8 10.5 6.1 6.3 4.5 4.6 0.0 9.1 8.9£28,750-£34,499 14.4 10.2 8.6 6.0 6.7 4.4 6.9 12.6 10.5 8.0£34,500-£40,249 9.5 12.9 11.3 10.2 12.6 10.7 8.1 20.4 11.7 10.7£40,250-£45,999 9.0 9.7 6.4 6.8 10.8 0.0 7.8 10.4 9.5 6.7£46,000-£57,499 5.8 16.5 6.2 9.1 14.0 29.3 3.0 0.0 13.0 6.0£57,500-£80,499 16.6 18.3 5.7 10.2 21.2 4.5 18.4 2.7 18.2 8.3£80,500-£114,999 17.0 10.9 3.7 3.7 11.6 16.1 9.6 0.0 13.0 4.7£115,000-£172,999 8.9 6.4 1.6 1.6 1.7 14.7 9.2 7.4 6.2 2.9£173,000-£229,999 0.4 0.4 0.2 1.4 0.0 0.0 0.8 0.0 0.3 0.4Over £230,000 0.0 0.0 0.2 0.2 0.0 0.0 0.0 0.0 0.0 0.2
Total 100.0 100.0 100.0 100.0 100.0 100.0 100.0 100.0 100.0 100.0Total terminating passengersTota terminating passengers (000s)s) 90 116 2,111 219 79 8 323 24 293 2 677323 ,Mean income £60,598 £57,241 £31,731 £35,797 £50,235 £62,117 £52,003 £32,997 £56,686 £35,555
Note: Excludes interviews where passengers have not answered all relevent core questions* Business passengers are asked for their personal income and leisure passengers are asked for their household income.
99

ALL
l (000 135 129 2 154 559 97 10 40 371 3 482
Table 14.7Income of UK and foreign passengers at Liverpool Airport in 2014. *
UK Passengers Foreign PassengersIncome Business Leisure Business Leisure Business Leisure
International Domestic International Domestic International Domestic International Domestic Total Total% % % % % % % % % %
Under £5,750 2.7 0.2 2.6 6.4 0.5 0.0 3.6 0.0 1.2 3.5£5,750-£8,624 0.8 0.0 1.5 3.2 0.6 0.0 5.1 5.1 0.4 2.6£8,625-£11,499 0.6 0.0 2.4 3.4 0.6 0.0 2.3 0.0 0.4 2.6£11,500-£14,374 2.9 1.1 4.0 3.2 2.9 0.0 4.3 4.3 2.1 3.9£14,375-£17,249 4.7 1.1 5.3 6.0 9.1 0.0 8.2 2.1 4.4 6.0£17,250-£22,999 3.4 2.4 8.8 7.3 2.2 4.5 9.3 5.0 2.8 8.6£23,000-£28,749 5.4 11.6 12.0 11.9 9.0 16.0 12.1 11.1 8.9 12.0£28,750-£34,499 15.5 16.4 11.9 9.1 6.7 10.0 8.4 14.6 13.5 10.7£34,500-£40,249 13.2 15.9 10.6 10.9 11.0 5.4 8.4 8.4 13.4 10.2£40,250-£45,999 18.0 16.1 11.7 7.4 20.6 11.9 8.7 19.8 17.8 10.4£46,000-£57,499 4.5 11.7 9.7 10.2 12.9 16.5 8.5 5.5 9.5 9.5£57,500-£80,499 12.1 12.8 9.9 10.9 12.6 10.0 8.8 6.3 12.4 9.8£80,500-£114,999 6.0 6.2 5.2 5.3 8.2 22.4 6.4 5.1 7.1 5.5£115,000-£172,999 6.3 3.0 2.6 3.3 1.7 3.3 3.5 6.0 3.9 2.9£173,000-£229,999 1.2 0.5 0.9 0.2 0.7 0.0 0.8 2.8 0.8 0.7Over £230,000 2.7 1.0 0.7 1.2 0.6 0.0 1.7 4.0 1.5 1.0
Total 100.0 100.0 100.0 100.0 100.0 100.0 100.0 100.0 100.0 100.0Total terminating passengersTota terminating passengers (000s)s) 135 129 2,154 559 97 10 730 40 371 3 482730 ,Mean income £57,264 £51,031 £44,033 £43,687 £49,058 £57,492 £45,471 £59,976 £52,947 £44,413
Note: Excludes interviews where passengers have not answered all relevent core questions* Business passengers are asked for their personal income and leisure passengers are asked for their household income.
100

ALL
l (000 473 464 261 918 7 12 1 863 1 700
Table 14.8Income of UK and foreign passengers at London City Airport in 2014. *
UK Passengers Foreign PassengersIncome Business Leisure Business Leisure Business Leisure
International Domestic International Domestic International Domestic International Domestic Total Total% % % % % % % % % %
Under £5,750 0.4 0.0 1.4 0.4 0.1 0.0 1.7 4.5 0.2 1.3£5,750-£8,624 0.8 0.0 0.7 0.0 0.1 0.0 0.6 1.2 0.3 0.5£8,625-£11,499 0.1 0.0 1.3 2.0 0.3 0.0 0.5 0.0 0.2 1.1£11,500-£14,374 0.1 0.7 1.1 1.5 0.3 0.0 1.1 0.0 0.3 1.1£14,375-£17,249 0.4 1.1 2.8 1.1 0.9 0.0 2.2 0.0 0.8 2.3£17,250-£22,999 2.0 5.6 3.4 2.7 3.8 0.0 1.8 6.8 3.7 2.7£23,000-£28,749 3.2 6.6 5.5 7.7 1.6 0.0 7.0 4.5 3.2 6.5£28,750-£34,499 5.8 8.7 6.6 16.1 5.9 0.0 7.8 0.0 6.5 8.7£34,500-£40,249 5.8 9.5 11.6 12.0 6.7 15.3 7.8 36.1 7.1 10.4£40,250-£45,999 7.8 7.5 9.0 7.5 6.5 12.5 9.5 12.4 7.1 8.9£46,000-£57,499 15.4 15.4 10.4 7.0 11.1 0.0 10.8 0.0 13.3 9.9£57,500-£80,499 27.4 19.9 17.1 12.4 12.0 12.5 19.7 4.8 18.2 17.2£80,500-£114,999 15.3 16.3 11.8 12.2 15.8 0.0 11.6 14.2 15.7 11.8£115,000-£172,999 9.4 6.3 12.4 12.2 18.4 29.7 8.5 15.5 13.2 10.9£173,000-£229,999 5.5 2.1 4.4 5.4 16.0 30.0 9.3 0.0 10.0 6.5Over £230,000 0.8 0.2 0.5 0.0 0.4 0.0 0.1 0.0 0.5 0.3
Total 100.0 100.0 100.0 100.0 100.0 100.0 100.0 100.0 100.0 100.0Total terminating passengersTota terminating passengers (000s)s) 473 464 775775 261 918 7 653 12 1 863 1 700653 , ,Mean income £77,422 £64,185 £70,187 £68,364 £98,149 £122,986 £74,220 £61,041 £84,785 £71,351
Note: Excludes interviews where passengers have not answered all relevent core questions* Business passengers are asked for their personal income and leisure passengers are asked for their household income.
101

ALL
l (000 812 370 6 211 475 501 5 1 825 39 1 689 8 550
Table 14.9Income of UK and foreign passengers at Luton Airport in 2014. *
UK Passengers Foreign PassengersIncome Business Leisure Business Leisure Business Leisure
International Domestic International Domestic International Domestic International Domestic Total Total% % % % % % % % % %
Under £5,750 1.0 0.2 6.6 8.0 0.8 0.0 15.2 16.5 0.7 8.0£5,750-£8,624 0.6 1.5 3.0 2.6 0.3 0.0 8.8 0.0 0.7 3.8£8,625-£11,499 0.4 0.0 2.6 5.9 2.2 0.0 3.1 8.4 0.7 2.9£11,500-£14,374 0.8 0.5 4.5 3.0 2.2 0.0 8.1 0.0 1.1 4.8£14,375-£17,249 0.3 1.1 5.5 2.3 3.5 25.6 5.9 3.7 1.4 5.3£17,250-£22,999 4.0 1.5 9.6 6.0 3.0 0.0 7.5 0.0 3.2 9.0£23,000-£28,749 3.5 5.0 9.5 11.8 11.9 33.2 8.0 3.7 6.0 9.4£28,750-£34,499 6.4 8.3 10.6 8.6 9.6 41.2 8.4 3.7 7.8 10.1£34,500-£40,249 8.3 13.3 8.9 9.1 6.5 0.0 5.7 11.2 9.0 8.5£40,250-£45,999 11.9 7.3 7.2 6.3 10.2 0.0 5.7 7.9 10.3 6.9£46,000-£57,499 14.5 11.0 7.7 8.9 7.6 0.0 8.0 11.2 11.9 7.8£57,500-£80,499 18.5 23.0 11.1 12.8 9.0 0.0 7.1 3.0 17.2 10.6£80,500-£114,999 14.7 12.0 7.0 6.9 15.8 0.0 3.1 13.6 14.3 6.5£115,000-£172,999 9.0 10.1 3.2 4.9 6.3 0.0 4.0 17.3 8.6 3.5£173,000-£229,999 2.4 1.9 1.5 2.2 4.7 0.0 0.7 0.0 2.9 1.4Over £230,000 3.6 3.4 1.6 0.8 6.4 0.0 0.5 0.0 4.2 1.4
Total 100.0 100.0 100.0 100.0 100.0 100.0 100.0 100.0 100.0 100.0Total terminating passengersTota terminating passengers (000s)s) 812 370 6,211 475 501 5 1,825 39 1 689 8 550, ,Mean income £75,569 £74,479 £47,257 £48,884 £77,845 £25,667 £35,071 £57,660 £75,752 £45,708
Note: Excludes interviews where passengers have not answered all relevent core questions* Business passengers are asked for their personal income and leisure passengers are asked for their household income.
102

ALL
l (000 1 698 849 13 651 1 034 1 008 95 2 485 125 3 650 17 294
Table 14.10Income of UK and foreign passengers at Manchester Airport in 2014. *
UK Passengers Foreign PassengersIncome Business Leisure Business Leisure Business Leisure
International Domestic International Domestic International Domestic International Domestic Total Total% % % % % % % % % %
Under £5,750 0.5 0.1 4.0 9.3 2.8 0.0 5.5 0.4 0.9 4.5£5,750-£8,624 0.6 0.3 1.9 3.7 0.7 0.0 1.9 0.0 0.5 2.0£8,625-£11,499 0.3 0.0 2.6 8.7 0.4 0.0 2.3 0.0 0.2 3.0£11,500-£14,374 0.8 0.6 3.5 5.7 1.0 3.7 3.6 1.4 0.9 3.6£14,375-£17,249 1.7 1.2 5.6 3.4 1.5 0.0 6.3 8.8 1.5 5.5£17,250-£22,999 2.0 4.8 8.3 8.2 2.3 0.0 8.6 2.0 2.8 8.2£23,000-£28,749 3.7 4.6 12.1 12.8 6.1 1.8 9.5 17.5 4.4 11.9£28,750-£34,499 9.2 8.0 12.1 10.3 7.8 7.5 9.3 15.1 8.5 11.7£34,500-£40,249 11.1 7.0 10.9 4.6 9.7 31.5 8.7 30.6 10.1 10.3£40,250-£45,999 11.3 11.5 11.1 5.3 12.8 2.3 11.2 8.5 11.6 10.7£46,000-£57,499 12.4 10.1 8.3 4.1 16.4 13.5 5.7 0.3 12.8 7.7£57,500-£80,499 21.9 20.2 10.2 10.7 19.7 13.9 11.8 10.4 20.8 10.4£80,500-£114,999 12.6 16.8 5.5 4.6 10.4 16.6 6.7 1.9 13.2 5.5£115,000-£172,999 8.9 8.2 3.2 6.3 5.6 4.7 6.5 2.7 7.9 3.8£173,000-£229,999 1.0 3.6 0.3 2.2 1.2 0.3 1.6 0.0 1.7 0.6Over £230,000 2.0 2.9 0.4 0.2 1.6 4.2 1.0 0.4 2.2 0.4
Total 100.0 100.0 100.0 100.0 100.0 100.0 100.0 100.0 100.0 100.0Total terminating passengersTota terminating passengers (000s)s) 1 698, 849 13,651 1 034, 1 008, 95 2,485 125 3 650 17 294, ,Mean income £68,313 £75,903 £42,499 £43,069 £61,811 £68,826 £50,395 £40,724 £68,683 £43,451
Note: Excludes interviews where passengers have not answered all relevent core questions* Business passengers are asked for their personal income and leisure passengers are asked for their household income.
103

ALL
l (000 1 229 443 9 250 507 1 193 18 6 405 70 2 884 16 232
Table 14.11Income of UK and foreign passengers at Stansted Airport in 2014. *
UK Passengers Foreign PassengersIncome Business Leisure Business Leisure Business Leisure
International Domestic International Domestic International Domestic International Domestic Total Total% % % % % % % % % %
Under £5,750 1.5 0.2 5.9 4.6 1.3 0.0 9.8 6.7 1.2 7.1£5,750-£8,624 0.5 0.0 2.1 2.9 2.7 0.0 4.3 4.5 1.4 2.9£8,625-£11,499 0.7 0.5 2.5 8.1 2.2 0.0 4.0 3.8 1.2 3.2£11,500-£14,374 1.8 0.4 5.3 1.1 2.4 0.0 3.1 1.6 1.8 4.4£14,375-£17,249 1.7 0.8 5.7 2.4 1.3 3.8 5.7 1.6 1.4 5.5£17,250-£22,999 4.4 1.4 8.2 2.9 6.9 8.0 10.5 0.0 5.0 8.7£23,000-£28,749 6.6 6.0 9.0 5.0 4.3 8.6 8.9 6.8 5.5 8.8£28,750-£34,499 8.5 6.1 9.8 9.9 7.7 11.2 10.3 14.2 7.8 10.0£34,500-£40,249 8.4 8.7 9.8 9.3 4.6 44.6 8.4 2.9 7.1 9.3£40,250-£45,999 7.4 4.7 7.1 6.0 7.7 6.1 8.0 6.3 7.1 7.4£46,000-£57,499 13.9 7.4 8.5 9.7 14.8 4.1 6.4 17.5 13.1 7.9£57,500-£80,499 23.7 27.1 11.4 14.7 18.9 0.0 8.6 14.8 22.0 10.6£80,500-£114,999 10.7 19.7 7.8 13.5 18.2 8.0 6.6 0.0 15.3 7.5£115,000-£172,999 7.0 10.5 3.7 5.6 5.0 0.0 3.8 19.3 6.7 3.9£173,000-£229,999 1.2 3.8 1.6 3.0 0.9 0.0 0.9 0.0 1.5 1.4Over £230,000 2.0 2.7 1.6 1.3 1.1 5.7 0.6 0.0 1.8 1.2
Total 100.0 100.0 100.0 100.0 100.0 100.0 100.0 100.0 100.0 100.0Total terminating passengersTota terminating passengers (000s)s) 1 229, 443 9,250 507 1 193, 18 6,405 70 2 884 16 232, ,Mean income £64,795 £81,994 £49,310 £59,107 £61,788 £54,283 £41,360 £58,466 £66,241 £47,018
Note: Excludes interviews where passengers have not answered all relevent core questions* Business passengers are asked for their personal income and leisure passengers are asked for their household income.
104

Table 15.1Socio-economic group of UK business passengers in 2014.
BusinessSocio-economic Group Gatwick Heathrow London City Luton Stansted
A/B 50.9 49.4 45.3 67.2 49.3C1 42.8 44.7 45.7 26.9 44.0C2 4.7 5.6 8.4 5.3 5.8D/E 1.7 0.2 0.6 0.6 0.8
Total 100.0 100.0 100.0 100.0 100.0Terminating Passengers (000's) 2,911 7,993 938 1,182 1,673
BusinessSocio-economic Group Birmingham Doncaster East Midlands Leeds Bradford Liverpool Manchester
A/B 45.1 16.7 53.4 65.1 47.0 53.5C1 45.5 49.0 33.7 27.9 38.0 37.6C2 8.8 27.3 12.1 6.8 13.8 7.9D/E 0.6 7.0 0.7 0.2 1.2 1.1
Total 100.0 100.0 100.0 100.0 100.0 100.0Terminating Passengers (000's) 1,164 11 254 206 264 2,547
Excludes interviews where passengers have not answered all relevant questions
105

Table 15.2Socio-economic group of UK leisure passengers in 2014.
LeisureSocio-economic Group Gatwick Heathrow London City Luton Stansted
A/B 34.6 33.3 35.6 29.0 30.9C1 39.1 46.0 47.5 37.1 41.2C2 16.9 12.5 13.8 20.4 15.5D/E 9.5 8.2 3.2 13.5 12.4
Total 100.0 100.0 100.0 100.0 100.0Terminating Passengers (000's) 22,957 17,816 1,036 6,686 9,758
LeisureSocio-economic Group Birmingham Doncaster East Midlands Leeds Bradford Liverpool Manchester
A/B 24.3 10.6 23.7 30.1 26.2 26.0C1 32.6 26.9 26.4 30.4 33.0 38.2C2 16.8 34.7 25.5 16.9 18.8 21.8D/E 26.2 27.8 24.3 22.5 22.0 14.1
Total 100.0 100.0 100.0 100.0 100.0 100.0Terminating Passengers (000's) 5,772 603 3,727 2,330 2,713 14,685
Excludes interviews where passengers have not answered all relevant questions
106

Table 16.1Top passenger residence by journey purpose at Birmingham Airport in 2014.
Residence Business Visit Friends & Family Leisure Terminal Passengers% % % 000's
United Kingdom 16.7 30.2 53.1 7,067Ireland 32.2 42.8 25.0 526Germany 46.2 37.1 16.7 320Spain & Canary Islands 9.9 77.4 12.7 197France 37.2 45.3 17.5 166Netherlands 45.5 37.1 17.4 140United States of America 18.1 59.8 22.0 81Italy 42.8 40.2 17.0 78Poland 7.1 84.9 8.0 67Switzerland 58.4 31.3 10.3 49
107

Table 16.2Top passenger residence by journey purpose at Doncaster Airport in 2014.
Residence Business Visit Friends & Family Leisure Terminal Passengers% % % 000's
United Kingdom 1.8 29.4 68.8 614Poland 7.3 88.8 3.9 88Lithuania 5.6 94.4 0.0 7Romania 30.4 69.6 0.0 5Latvia 0.0 91.9 8.1 4Spain & Canary Islands 0.0 100.0 0.0 1Ireland 65.5 0.0 34.5 1Japan 0.0 100.0 0.0 1Belgium 0.0 100.0 0.0 0Cyprus 0.0 50.0 50.0 0
108

Table 16.3Top passenger residence by journey purpose at East Midlands Airport in 2014.
Residence Business Visit Friends & Family Leisure Terminal Passengers% % % 000's
United Kingdom 6.4 21.5 72.1 3,992Spain & Canary Islands 6.6 76.4 16.9 137Poland 3.3 91.8 4.9 114Ireland 15.0 72.3 12.8 75France 15.1 76.2 8.7 41Italy 9.5 76.4 14.1 28Latvia 0.0 90.9 9.1 13Netherlands 37.0 61.9 1.0 12Portugal & Madeira 5.3 82.4 12.3 11United States of America 1.7 68.7 29.6 8
109

Table 16.4Top passenger residence by journey purpose at Gatwick Airport in 2014.
Residence Business Visit Friends & Family Leisure Terminal Passengers% % % 000's
United Kingdom 11.1 22.9 66.0 27,342Spain & Canary Islands 24.8 49.0 26.2 1,207Italy 23.9 43.0 33.1 1,061Ireland 18.7 45.5 35.8 837France 30.1 40.1 29.8 818Norway 15.9 26.4 57.7 616Germany 34.2 45.2 20.5 610United States of America 9.8 39.3 50.9 570Sweden 17.2 28.3 54.4 505Australia 3.7 51.6 44.7 450
110

Table 16.5Top passenger residence by journey purpose at Heathrow Airport in 2014.
Residence Business Visit Friends & Family Leisure Terminal Passengers% % % 000's
United Kingdom 30.4 31.6 38.0 29,523United States of America 24.3 34.5 41.2 10,868Germany 37.4 20.7 41.9 2,889Canada 14.6 49.3 36.2 2,853Australia 8.2 46.3 45.4 2,042India 42.6 35.3 22.1 1,959France 27.6 24.5 47.8 1,619Ireland 40.3 29.7 30.0 1,458Sweden 31.5 21.4 47.0 1,230Switzerland 33.5 30.1 36.4 1,191
111

Table 16.6Top passenger residence by journey purpose at Leeds Bradford Airport in 2014.
Residence Business Visit Friends & Family Leisure Terminal Passengers% % % 000's
United Kingdom 8.1 20.1 71.8 2,540Ireland 24.2 37.8 38.0 144Spain & Canary Islands 14.9 71.9 13.2 102Netherlands 24.7 67.8 7.5 43Germany 20.6 52.9 26.6 20France 17.1 72.5 10.4 18United States of America 24.9 60.2 14.9 11Italy 26.3 70.6 3.1 10Poland 6.9 56.0 37.1 10United Arab Emirates 4.5 7.9 87.5 8
112

Table 16.7Top passenger residence by journey purpose at Liverpool Airport in 2014.
Residence Business Visit Friends & Family Leisure Terminal Passengers% % % 000's
United Kingdom 8.7 37.4 53.9 3,067Ireland 13.3 45.7 41.0 288Spain & Canary Islands 12.7 65.7 21.6 163Poland 8.0 79.4 12.6 108France 9.3 76.7 14.0 75Netherlands 21.1 55.1 23.9 61Germany 20.6 64.4 15.0 22Portugal & Madeira 15.8 64.8 19.3 20Norway 4.0 40.5 55.5 18Switzerland 12.3 52.6 35.0 18
113
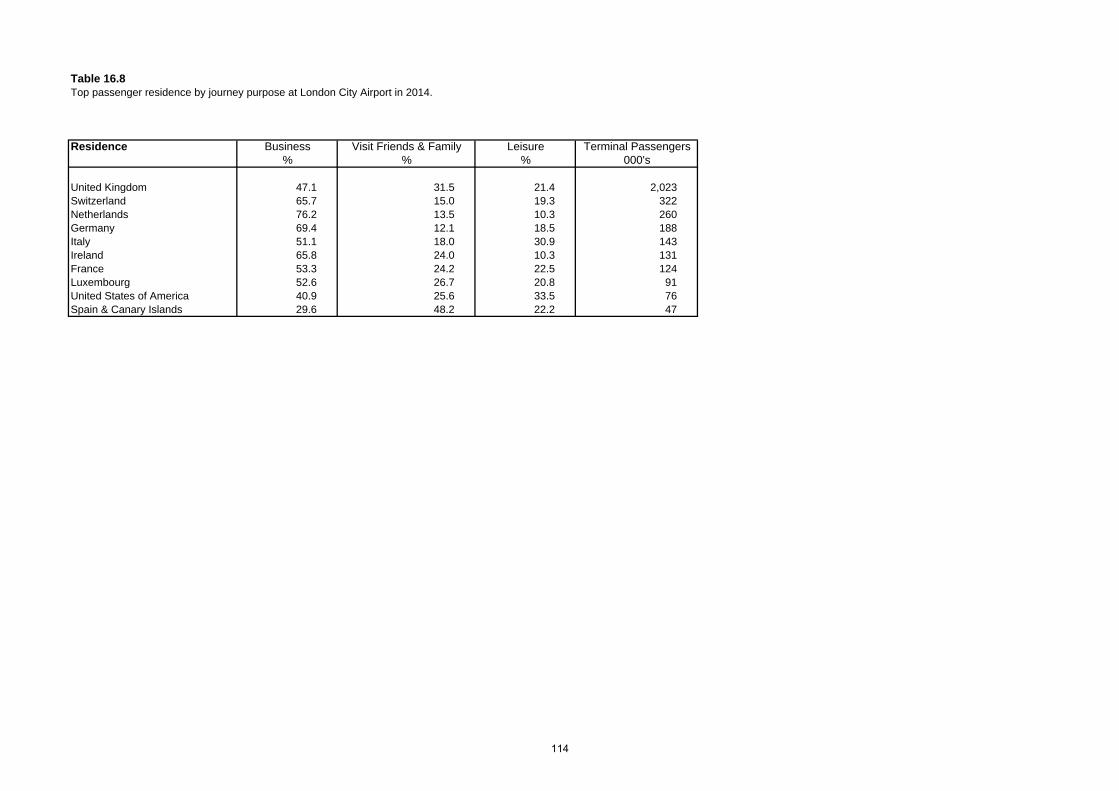
Table 16.8Top passenger residence by journey purpose at London City Airport in 2014.
Residence Business Visit Friends & Family Leisure Terminal Passengers% % % 000's
United Kingdom 47.1 31.5 21.4 2,023Switzerland 65.7 15.0 19.3 322Netherlands 76.2 13.5 10.3 260Germany 69.4 12.1 18.5 188Italy 51.1 18.0 30.9 143Ireland 65.8 24.0 10.3 131France 53.3 24.2 22.5 124Luxembourg 52.6 26.7 20.8 91United States of America 40.9 25.6 33.5 76Spain & Canary Islands 29.6 48.2 22.2 47
114

Table 16.9Top passenger residence by journey purpose at Luton Airport in 2014.
Residence Business Visit Friends & Family Leisure Terminal Passengers% % % 000's
United Kingdom 15.0 40.5 44.5 7,931Poland 22.2 68.4 9.4 286Ireland 17.8 66.9 15.3 276Romania 29.6 52.9 17.5 252France 26.9 48.0 25.1 177Spain & Canary Islands 11.8 58.9 29.3 174Germany 27.1 50.0 22.9 125Hungary 33.4 44.8 21.8 114Netherlands 33.5 50.0 16.6 111Switzerland 22.5 61.9 15.6 99
115

Table 16.10Top passenger residence by journey purpose at Manchester Airport in 2014.
Residence Business Visit Friends & Family Leisure Terminal Passengers% % % 000's
United Kingdom 15.2 18.5 66.2 17,628Ireland 29.8 39.8 30.4 505United States of America 32.4 40.7 26.8 417Germany 50.7 35.0 14.3 368Spain & Canary Islands 16.7 63.2 20.1 258Australia 1.5 77.9 20.6 254France 44.7 46.7 8.6 231Netherlands 38.2 38.2 23.6 181Norway 19.0 27.6 53.4 144Sweden 27.7 21.7 50.7 127
116

Table 16.11Top passenger residence by journey purpose at Stansted Airport in 2014.
Residence Business Visit Friends & Family Leisure Terminal Passengers% % % 000's
United Kingdom 14.5 39.3 46.2 11,664Italy 12.5 41.3 46.2 1,168Spain & Canary Islands 10.9 48.8 40.3 1,007Ireland 26.7 43.8 29.5 866Germany 20.7 33.4 46.0 848Poland 15.7 57.3 27.1 630France 12.7 50.5 36.8 473Sweden 11.0 39.6 49.4 383Denmark 12.1 36.7 51.2 310Netherlands 25.5 32.1 42.3 273
117

Table 17.1Family Make-Up of UK leisure residents at the 2014 survey airports
Family One Two Three Four Five + Terminating% % % % % (000's)
Birmingham 14.4 43.3 18.1 13.8 10.4 5,884Doncaster 12.5 47.3 18.4 16.4 5.3 603East Midlands 11.5 50.9 16.6 14.5 6.4 3,737Gatwick 21.2 40.9 13.3 16.5 8.2 24,305Heathrow 34.9 33.2 12.2 12.6 7.1 20,557Leeds Bradford 20.3 50.5 14.1 10.9 4.1 2,334Liverpool 17.7 40.0 18.0 16.1 8.3 2,800London City 17.5 40.2 13.9 18.0 10.4 1,070Luton 29.4 38.7 14.2 12.2 5.4 6,742Manchester 17.3 44.5 16.3 14.6 7.2 14,946Stansted 32.4 34.7 12.7 12.7 7.4 9,968
Note: Excludes interviews where passengers have not answered all relevent questions
118

Table 17.2Family Make-Up of foreign leisure residents at the 2014 survey airports
Family One Two Three Four Five + Terminating% % % % % (000's)
Birmingham 17.8 38.8 13.0 14.8 15.5 1,518Doncaster 11.8 35.6 22.5 18.4 11.7 99East Midlands 17.0 54.6 11.7 10.3 6.3 426Gatwick 27.3 34.8 12.5 16.0 9.3 8,302Heathrow 24.3 34.9 15.2 14.5 11.2 31,002Leeds Bradford 21.0 39.5 17.1 13.3 9.2 355Liverpool 17.6 34.2 18.1 15.9 14.2 794London City 20.1 40.0 13.7 17.1 9.1 685Luton 27.3 33.5 14.4 14.1 10.6 1,939Manchester 21.4 38.5 15.1 13.8 11.2 2,851Stansted 29.4 30.5 12.2 17.2 10.7 6,908
Note: Excludes interviews where passengers have not answered all relevent questions
119

d
Table 18.1Journey purpose by route and country of residence at Birmingham Airport in 2014.
Journey Purpose Domestic International ALL UK Foreign UK Foreign % % % % %
Business Business 1.6 2.2 0.6 1.6 1.0Business (Commuting) 0.2 0.7 0.0 0.1 0.1Attending Internal Company Business 16.4 8.3 4.1 9.3 7.0Meetings with Customers 14.2 5.2 3.1 11.3 6.5Conference/Congress 5.4 2.1 1.2 3.3 2.3Trade Fair/Exhibition 2.8 1.4 0.6 2.4 1.3Armed Services 0.5 0.0 0.1 0.9 0.3Airline Staff (Positioning) 0.5 0.0 0.0 0.1 0.1Contract Home Leave 0.2 2.0 0.0 0.7 0.2Overseas Employment < 12 months 0.3 1.6 0.6 0.4 0.5Overseas Employment >= 12 months 0.0 0.0 0.1 0.2 0.1Studies - formal 0.8 5.5 0.0 0.6 0.3Studies paid by employer - other 1.4 1.9 0.2 0.6 0.5Au pair 0.1 1.0 0.0 0.0 0.0
Total business 44.5 32.0 10.9 31.6 20.3
Leisure Cultural/sports 3.0 0.9 0.5 2.0 1.2Connect To/From IT Holiday 0.1 0.0 0.0 0.0 0.0Holiday fare paid separately 10.4 18.5 19.8 9.3 16.2Holiday fare paid separately - Ski 0.0 0.0 0.3 0.0 0.2Holiday IT/Package - Cruise 0.0 0.0 1.6 0.0 1.0Holiday IT/Package - Hotel 1.8 1.8 32.7 0.5 20.9Holiday IT/Package - Hotel - Ski 0.0 0.0 0.4 0.0 0.2Holiday IT/Package - Self Catering 0.0 0.0 3.7 0.4 2.4Holiday IT/Package - Self Catering - Ski 0.0 0.0 0.4 0.0 0.2Migration 0.0 0.0 0.1 0.0 0.1Studies private/grants - formal 0.3 0.0 0.3 1.0 0.4Studies private/grants - other 0.0 0.0 0.0 0.3 0.1Unaccompanied school childrenUnaccompanie school children 0 00.0 0 00.0 0 00.0 0 00.0 0 00.0Visiting friends and relatives 37.0 42.5 28.8 50.7 35.0Other 2.9 4.4 0.5 4.2 1.7
Total leisure 55.5 68.0 89.1 68.4 79.7Total 100.0 100.0 100.0 100.0 100.0Total terminal passengers (000s) 1,226 84 5,841 2,135 9,286
120

d
Table 18.2Journey purpose by route and country of residence at Doncaster Airport in 2014.
Journey Purpose Domestic International ALL UK Foreign UK Foreign % % % % %
Business Business 11.7 0.0 0.2 0.2 0.3Business (Commuting) 0.0 0.0 0.0 0.1 0.0Attending Internal Company Business 7.1 100.0 0.8 3.4 1.3Meetings with Customers 9.9 0.0 0.2 0.8 0.4Conference/Congress 0.0 0.0 0.0 0.3 0.0Trade Fair/Exhibition 0.0 0.0 0.0 0.2 0.0Armed Services 1.6 0.0 0.0 0.2 0.0Airline Staff (Positioning) 0.0 0.0 0.0 0.0 0.0Contract Home Leave 0.0 0.0 0.0 0.5 0.1Overseas Employment < 12 months 0.0 0.0 0.2 1.9 0.4Overseas Employment >= 12 months 0.0 0.0 0.0 0.0 0.0Studies - formal 0.0 0.0 0.0 0.0 0.0Studies paid by employer - other 0.0 0.0 0.0 0.0 0.0Au pair 0.0 0.0 0.0 0.0 0.0
Total business 30.4 100.0 1.4 7.7 2.8
Leisure Cultural/sports 0.0 0.0 0.0 0.0 0.0Connect To/From IT Holiday 0.0 0.0 0.0 0.0 0.0Holiday fare paid separately 8.1 0.0 3.9 1.4 3.6Holiday fare paid separately - Ski 0.0 0.0 0.0 0.0 0.0Holiday IT/Package - Cruise 0.0 0.0 3.7 0.1 3.1Holiday IT/Package - Hotel 27.4 0.0 50.3 0.5 42.6Holiday IT/Package - Hotel - Ski 0.0 0.0 0.4 0.0 0.3Holiday IT/Package - Self Catering 1.6 0.0 7.3 0.1 6.1Holiday IT/Package - Self Catering - Ski 0.0 0.0 0.1 0.2 0.1Migration 0.0 0.0 2.0 0.6 1.8Studies private/grants - formal 0.0 0.0 0.2 1.1 0.3Studies private/grants - other 0.0 0.0 0.0 0.0 0.0Unaccompanied school childrenUnaccompanie school children 5 85.8 0 00.0 0 00.0 0 00.0 0 10.1Visiting friends and relatives 26.7 0.0 29.4 87.9 38.0Other 0.0 0.0 1.1 0.6 1.0
Total leisure 69.6 0.0 98.6 92.3 97.2Total 100.0 100.0 100.0 100.0 100.0Total terminal passengers (000s) 9 1 605 107 722
121

d
Table 18.3Journey purpose by route and country of residence at East Midlands Airport in 2014.
Journey Purpose Domestic International ALL UK Foreign UK Foreign % % % % %
Business Business 2.9 7.0 0.2 1.4 0.6Business (Commuting) 0.8 1.9 0.0 0.3 0.1Attending Internal Company Business 26.0 8.9 0.7 3.2 3.2Meetings with Customers 11.0 6.1 0.7 2.8 1.8Conference/Congress 2.0 1.1 0.1 0.8 0.3Trade Fair/Exhibition 0.6 0.0 0.0 0.1 0.1Armed Services 0.4 0.0 0.0 0.0 0.0Airline Staff (Positioning) 0.1 0.0 0.0 0.0 0.0Contract Home Leave 0.1 0.0 0.0 0.0 0.0Overseas Employment < 12 months 0.0 0.0 0.1 0.1 0.1Overseas Employment >= 12 months 0.0 0.0 0.0 0.2 0.0Studies - formal 2.3 0.0 0.0 0.0 0.2Studies paid by employer - other 0.8 0.0 0.2 0.2 0.2Au pair 0.0 0.0 0.0 0.1 0.0
Total business 47.0 25.1 2.0 9.3 6.7
Leisure Cultural/sports 0.8 0.0 0.2 0.6 0.3Connect To/From IT Holiday 0.1 0.0 0.0 0.0 0.0Holiday fare paid separately 10.2 5.1 31.0 10.0 26.9Holiday fare paid separately - Ski 0.0 0.0 0.3 0.0 0.2Holiday IT/Package - Cruise 0.0 0.0 0.6 0.1 0.5Holiday IT/Package - Hotel 4.1 0.0 40.0 0.6 32.7Holiday IT/Package - Hotel - Ski 0.0 0.0 0.3 0.0 0.3Holiday IT/Package - Self Catering 0.4 0.0 5.0 0.0 4.0Holiday IT/Package - Self Catering - Ski 0.0 0.0 0.1 0.1 0.1Migration 0.0 0.0 0.1 0.1 0.1Studies private/grants - formal 1.0 0.0 0.1 1.0 0.2Studies private/grants - other 0.0 0.0 0.0 0.0 0.0Unaccompanied school childrenUnaccompanie school children 0 00.0 0 00.0 0 00.0 0 00.0 0 00.0Visiting friends and relatives 35.8 62.8 19.9 78.0 27.4Other 0.7 7.0 0.4 0.3 0.4
Total leisure 53.0 74.9 98.0 90.7 93.3Total 100.0 100.0 100.0 100.0 100.0Total terminal passengers (000s) 391 14 3,600 458 4,464
122

d
Table 18.4Journey purpose by route and country of residence at Gatwick Airport in 2014.
Journey Purpose Domestic International ALL UK Foreign UK Foreign % % % % %
Business Business 2.6 0.9 0.6 1.5 1.0Business (Commuting) 1.2 2.1 0.1 0.3 0.3Attending Internal Company Business 13.5 8.9 2.6 5.6 4.4Meetings with Customers 12.6 7.2 2.6 8.3 5.1Conference/Congress 1.8 3.4 0.9 2.5 1.5Trade Fair/Exhibition 0.3 0.0 0.2 0.5 0.3Armed Services 0.2 0.0 0.1 0.2 0.1Airline Staff (Positioning) 0.3 0.0 0.1 0.3 0.1Contract Home Leave 0.5 1.8 0.1 0.3 0.2Overseas Employment < 12 months 0.1 3.7 0.6 0.8 0.6Overseas Employment >= 12 months 0.0 2.6 0.1 0.2 0.1Studies - formal 0.0 0.0 0.0 0.2 0.1Studies paid by employer - other 0.4 0.2 0.0 0.3 0.1Au pair 0.0 0.3 0.0 0.1 0.0
Total business 33.6 31.1 8.0 20.9 13.9
Leisure Cultural/sports 0.4 0.0 0.7 0.9 0.8Connect To/From IT Holiday 5.5 0.0 0.0 0.5 0.7Holiday fare paid separately 18.6 19.1 30.7 27.6 28.7Holiday fare paid separately - Ski 0.2 0.0 1.0 0.1 0.7Holiday IT/Package - Cruise 0.0 0.0 1.5 0.2 1.0Holiday IT/Package - Hotel 3.5 0.7 31.6 4.0 21.4Holiday IT/Package - Hotel - Ski 0.0 0.0 1.3 0.0 0.8Holiday IT/Package - Self Catering 0.0 0.0 2.6 0.2 1.7Holiday IT/Package - Self Catering - Ski 0.0 0.0 0.3 0.0 0.2Migration 0.0 0.0 0.2 0.0 0.2Studies private/grants - formal 0.7 1.4 0.8 2.1 1.1Studies private/grants - other 0.1 0.0 0.2 1.5 0.6Unaccompanied school childrenUnaccompanie school children 0 00.0 0 00.0 0 00.0 0 10.1 0 00.0Visiting friends and relatives 37.1 47.2 20.9 41.6 28.1Other 0.3 0.6 0.1 0.2 0.2
Total leisure 66.4 68.9 92.0 79.1 86.1Total 100.0 100.0 100.0 100.0 100.0Total terminal passengers (000s) 3,322 327 24,020 10,216 37,886
123

d
Table 18.5Journey purpose by route and country of residence at Heathrow Airport in 2014.
Journey Purpose Domestic International ALL UK Foreign UK Foreign % % % % %
Business Business 10.9 7.3 6.1 6.2 6.4Business (Commuting) 1.3 0.1 0.3 0.1 0.2Attending Internal Company Business 16.4 8.6 8.5 8.7 9.1Meetings with Customers 10.4 6.8 7.0 6.0 6.6Conference/Congress 3.4 2.1 2.9 3.5 3.3Trade Fair/Exhibition 0.4 0.5 0.9 0.7 0.7Armed Services 0.3 0.3 0.4 0.3 0.3Airline Staff (Positioning) 0.5 0.0 0.3 0.2 0.2Contract Home Leave 1.1 2.1 0.3 0.9 0.7Overseas Employment < 12 months 0.7 1.6 0.8 1.5 1.2Overseas Employment >= 12 months 0.2 1.0 0.5 0.4 0.4Studies - formal 0.3 0.1 0.1 0.3 0.2Studies paid by employer - other 0.2 0.3 0.1 0.2 0.2Au pair 0.0 0.0 0.0 0.1 0.0
Total business 46.2 30.6 28.0 28.9 29.5
Leisure Cultural/sports 0.3 0.7 0.2 0.3 0.3Connect To/From IT Holiday 0.2 0.0 0.0 0.2 0.1Holiday fare paid separately 22.6 22.8 25.8 28.6 27.2Holiday fare paid separately - Ski 0.1 0.0 0.3 0.0 0.1Holiday IT/Package - Cruise 1.2 0.0 0.8 0.7 0.8Holiday IT/Package - Hotel 5.6 3.2 8.0 5.4 6.3Holiday IT/Package - Hotel - Ski 0.1 0.1 0.1 0.1 0.1Holiday IT/Package - Self Catering 0.1 0.1 0.1 0.1 0.1Holiday IT/Package - Self Catering - Ski 0.0 0.0 0.0 0.0 0.0Migration 0.0 0.8 0.4 0.2 0.3Studies private/grants - formal 0.9 7.9 2.5 1.9 2.1Studies private/grants - other 0.1 0.4 0.1 0.9 0.6Unaccompanied school childrenUnaccompanie school children 0 00.0 0 00.0 0 20.2 0 00.0 0 10.1Visiting friends and relatives 22.4 33.4 33.0 32.2 32.0Other 0.2 0.2 0.4 0.5 0.5
Total leisure 53.8 69.4 72.0 71.1 70.5Total 100.0 100.0 100.0 100.0 100.0Total terminal passengers (000s) 3,906 1,376 25,617 42,265 73,164
* Any unspecified leisure responses have been included in the Holiday Fare Paid Separately category
124
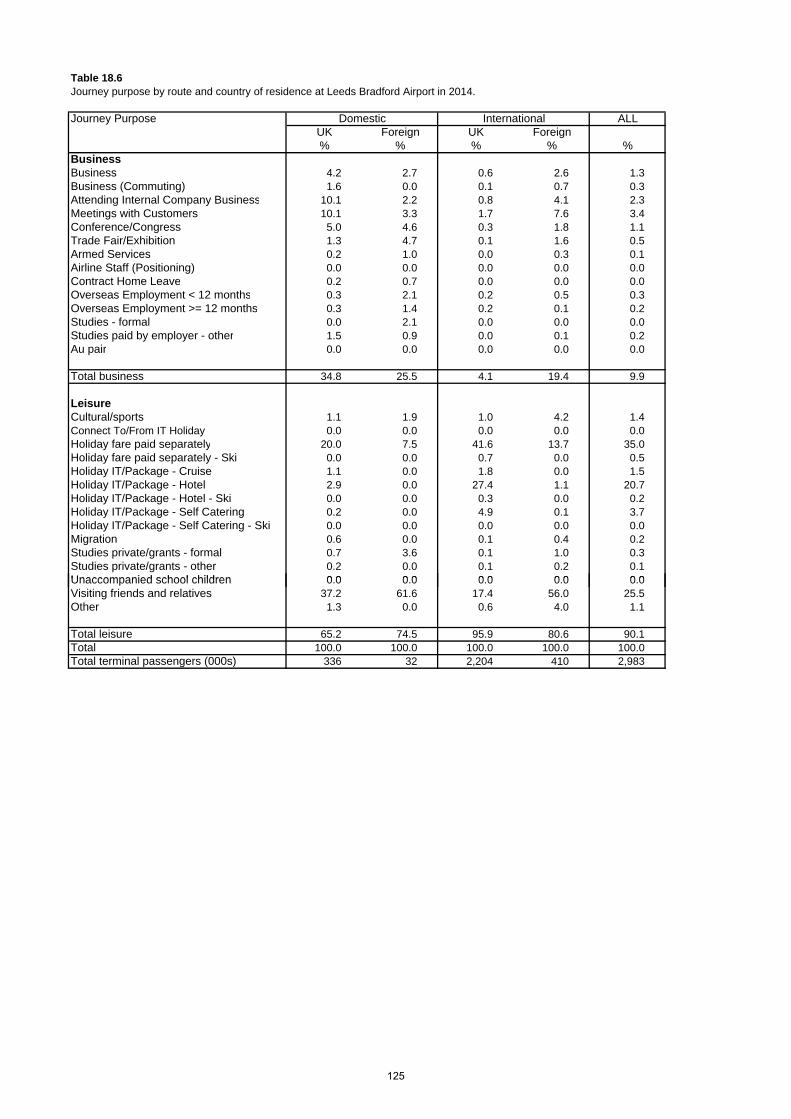
d
Table 18.6Journey purpose by route and country of residence at Leeds Bradford Airport in 2014.
Journey Purpose Domestic International ALL UK Foreign UK Foreign % % % % %
Business Business 4.2 2.7 0.6 2.6 1.3Business (Commuting) 1.6 0.0 0.1 0.7 0.3Attending Internal Company Business 10.1 2.2 0.8 4.1 2.3Meetings with Customers 10.1 3.3 1.7 7.6 3.4Conference/Congress 5.0 4.6 0.3 1.8 1.1Trade Fair/Exhibition 1.3 4.7 0.1 1.6 0.5Armed Services 0.2 1.0 0.0 0.3 0.1Airline Staff (Positioning) 0.0 0.0 0.0 0.0 0.0Contract Home Leave 0.2 0.7 0.0 0.0 0.0Overseas Employment < 12 months 0.3 2.1 0.2 0.5 0.3Overseas Employment >= 12 months 0.3 1.4 0.2 0.1 0.2Studies - formal 0.0 2.1 0.0 0.0 0.0Studies paid by employer - other 1.5 0.9 0.0 0.1 0.2Au pair 0.0 0.0 0.0 0.0 0.0
Total business 34.8 25.5 4.1 19.4 9.9
Leisure Cultural/sports 1.1 1.9 1.0 4.2 1.4Connect To/From IT Holiday 0.0 0.0 0.0 0.0 0.0Holiday fare paid separately 20.0 7.5 41.6 13.7 35.0Holiday fare paid separately - Ski 0.0 0.0 0.7 0.0 0.5Holiday IT/Package - Cruise 1.1 0.0 1.8 0.0 1.5Holiday IT/Package - Hotel 2.9 0.0 27.4 1.1 20.7Holiday IT/Package - Hotel - Ski 0.0 0.0 0.3 0.0 0.2Holiday IT/Package - Self Catering 0.2 0.0 4.9 0.1 3.7Holiday IT/Package - Self Catering - Ski 0.0 0.0 0.0 0.0 0.0Migration 0.6 0.0 0.1 0.4 0.2Studies private/grants - formal 0.7 3.6 0.1 1.0 0.3Studies private/grants - other 0.2 0.0 0.1 0.2 0.1Unaccompanied school childrenUnaccompanie school children 0 00.0 0 00.0 0 00.0 0 00.0 0 00.0Visiting friends and relatives 37.2 61.6 17.4 56.0 25.5Other 1.3 0.0 0.6 4.0 1.1
Total leisure 65.2 74.5 95.9 80.6 90.1Total 100.0 100.0 100.0 100.0 100.0Total terminal passengers (000s) 336 32 2,204 410 2,983
125

d
Table 18.7Journey purpose by route and country of residence at Liverpool Airport in 2014.
Journey Purpose Domestic International ALL UK Foreign UK Foreign % % % % %
Business Business 2.2 0.3 0.8 1.8 1.2Business (Commuting) 0.1 1.9 0.1 0.2 0.2Attending Internal Company Business 7.9 6.8 2.1 4.2 3.7Meetings with Customers 4.2 4.3 1.5 2.9 2.4Conference/Congress 1.0 0.0 0.7 1.1 0.8Trade Fair/Exhibition 0.1 0.8 0.1 0.2 0.2Armed Services 0.3 0.5 0.0 0.1 0.1Airline Staff (Positioning) 0.0 0.0 0.0 0.0 0.0Contract Home Leave 0.2 0.0 0.0 0.2 0.1Overseas Employment < 12 months 0.9 4.1 0.4 0.6 0.6Overseas Employment >= 12 months 0.5 0.0 0.0 0.2 0.2Studies - formal 0.3 0.4 0.0 0.2 0.1Studies paid by employer - other 0.1 1.2 0.0 0.1 0.1Au pair 0.0 0.0 0.0 0.1 0.0
Total business 17.8 20.3 5.8 11.7 9.5
Leisure Cultural/sports 0.7 0.8 0.2 0.6 0.4Connect To/From IT Holiday 0.4 0.0 0.1 0.0 0.1Holiday fare paid separately 20.9 21.6 44.6 26.6 36.1Holiday fare paid separately - Ski 0.0 0.0 1.6 0.0 0.9Holiday IT/Package - Cruise 0.0 0.0 0.1 0.0 0.1Holiday IT/Package - Hotel 1.3 0.0 13.3 1.0 8.3Holiday IT/Package - Hotel - Ski 0.0 0.0 0.2 0.0 0.1Holiday IT/Package - Self Catering 0.0 0.0 0.5 0.0 0.3Holiday IT/Package - Self Catering - Ski 0.0 0.0 0.0 0.0 0.0Migration 0.0 0.8 0.2 0.0 0.2Studies private/grants - formal 0.6 0.0 0.5 0.8 0.6Studies private/grants - other 0.1 0.0 0.2 0.5 0.3Unaccompanied school childrenUnaccompanie school children 0 00.0 0 00.0 0 00.0 0 00.0 0 00.0Visiting friends and relatives 54.1 54.4 32.1 58.1 42.1Other 4.1 2.0 0.4 0.5 1.1
Total leisure 82.2 79.7 94.2 88.3 90.5Total 100.0 100.0 100.0 100.0 100.0Total terminal passengers (000s) 735 54 2,332 850 3,971
126

d
Table 18.8Journey purpose by route and country of residence at London City Airport in 2014.
Journey Purpose Domestic International ALL UK Foreign UK Foreign % % % % %
Business Business 12.6 7.9 6.2 14.5 11.1Business (Commuting) 1.9 0.0 0.2 0.2 0.5Attending Internal Company Business 19.0 7.6 10.4 13.7 13.6Meetings with Customers 21.6 13.1 15.2 23.4 20.1Conference/Congress 2.6 4.1 3.4 2.9 3.0Trade Fair/Exhibition 1.5 1.4 1.0 1.1 1.2Armed Services 0.0 0.0 0.0 0.0 0.0Airline Staff (Positioning) 0.2 0.0 0.0 0.5 0.3Contract Home Leave 0.6 0.0 0.0 0.2 0.2Overseas Employment < 12 months 0.3 0.6 0.8 0.5 0.6Overseas Employment >= 12 months 0.0 1.0 0.1 0.5 0.3Studies - formal 0.6 0.0 0.4 0.2 0.4Studies paid by employer - other 1.8 0.0 0.1 0.3 0.6Au pair 0.0 0.0 0.0 0.1 0.1
Total business 62.8 35.7 37.9 58.2 51.9
Leisure Cultural/sports 2.0 6.7 1.7 2.0 2.0Connect To/From IT Holiday 0.0 0.0 0.0 0.0 0.0Holiday fare paid separately 6.6 15.4 16.9 14.2 13.6Holiday fare paid separately - Ski 0.1 0.0 2.4 0.1 0.9Holiday IT/Package - Cruise 0.0 1.7 0.1 0.1 0.1Holiday IT/Package - Hotel 1.0 4.6 3.5 2.4 2.5Holiday IT/Package - Hotel - Ski 0.0 0.0 0.1 0.0 0.0Holiday IT/Package - Self Catering 0.1 0.0 0.5 0.3 0.4Holiday IT/Package - Self Catering - Ski 0.0 0.0 0.0 0.0 0.0Migration 0.2 0.0 0.3 0.1 0.2Studies private/grants - formal 0.3 2.5 0.1 0.3 0.3Studies private/grants - other 0.0 0.5 0.1 0.8 0.4Unaccompanied school childrenUnaccompanie school children 0 00.0 0 00.0 0 00.0 0 60.6 0 30.3Visiting friends and relatives 25.3 29.7 35.2 20.2 26.6Other 1.5 3.2 1.0 0.6 1.0
Total leisure 37.2 64.3 62.1 41.8 48.1Total 100.0 100.0 100.0 100.0 100.0Total terminal passengers (000s) 749 25 1,274 1,600 3,648
127

d
Table 18.9Journey purpose by route and country of residence at Luton Airport in 2014.
Journey Purpose Domestic International ALL UK Foreign UK Foreign % % % % %
Business Business 1.6 1.5 0.5 2.5 1.1Business (Commuting) 3.8 2.5 0.5 0.9 0.9Attending Internal Company Business 18.4 4.8 3.7 7.1 5.7Meetings with Customers 14.5 3.0 4.5 5.2 5.5Conference/Congress 2.8 3.8 1.5 2.4 1.8Trade Fair/Exhibition 0.3 0.0 0.2 0.6 0.3Armed Services 0.7 0.8 0.1 0.2 0.2Airline Staff (Positioning) 0.3 0.0 0.1 0.2 0.1Contract Home Leave 0.1 0.0 0.0 0.0 0.0Overseas Employment < 12 months 0.1 0.0 0.2 2.0 0.6Overseas Employment >= 12 months 0.0 0.0 0.1 0.1 0.1Studies - formal 0.0 0.0 0.0 0.2 0.1Studies paid by employer - other 0.3 0.0 0.1 0.3 0.1Au pair 0.0 0.0 0.0 0.0 0.0
Total business 42.8 16.6 11.5 21.6 16.5
Leisure Cultural/sports 0.5 0.0 0.7 0.5 0.6Connect To/From IT Holiday 0.1 0.0 0.0 0.0 0.0Holiday fare paid separately 11.9 24.6 29.8 19.3 25.8Holiday fare paid separately - Ski 0.1 0.0 1.2 0.0 0.8Holiday IT/Package - Cruise 0.0 0.0 0.3 0.0 0.2Holiday IT/Package - Hotel 1.1 0.0 13.1 1.2 9.3Holiday IT/Package - Hotel - Ski 0.0 0.0 0.1 0.0 0.1Holiday IT/Package - Self Catering 0.0 0.0 1.3 0.1 0.9Holiday IT/Package - Self Catering - Ski 0.0 0.0 0.1 0.0 0.1Migration 0.0 2.0 0.5 0.1 0.4Studies private/grants - formal 0.3 4.5 0.5 0.9 0.6Studies private/grants - other 0.1 0.0 0.2 0.4 0.2Unaccompanied school childrenUnaccompanie school children 0 00.0 0 00.0 0 00.0 0 00.0 0 00.0Visiting friends and relatives 42.6 51.9 40.3 55.7 44.1Other 0.5 0.5 0.5 0.2 0.4
Total leisure 57.2 83.4 88.5 78.4 83.5Total 100.0 100.0 100.0 100.0 100.0Total terminal passengers (000s) 879 56 7,053 2,413 10,400
128

d
Table 18.10Journey purpose by route and country of residence at Manchester Airport in 2014.
Journey Purpose Domestic International ALL UK Foreign UK Foreign % % % % %
Business Business 3.3 2.1 1.1 2.3 1.5Business (Commuting) 1.5 3.0 0.1 0.2 0.3Attending Internal Company Business 26.8 24.7 5.1 13.3 8.9Meetings with Customers 9.3 6.4 3.1 8.3 4.7Conference/Congress 2.3 0.5 0.7 2.3 1.1Trade Fair/Exhibition 0.2 0.1 0.2 0.3 0.2Armed Services 0.0 0.0 0.0 0.2 0.0Airline Staff (Positioning) 0.5 0.1 0.0 0.2 0.1Contract Home Leave 0.4 1.4 0.1 0.6 0.2Overseas Employment < 12 months 0.3 0.1 0.4 0.3 0.4Overseas Employment >= 12 months 0.2 0.0 0.2 0.2 0.2Studies - formal 0.1 0.0 0.1 0.2 0.1Studies paid by employer - other 0.1 0.0 0.0 0.0 0.0Au pair 0.0 0.0 0.0 0.0 0.0
Total business 45.0 38.5 11.1 28.5 17.8
Leisure Cultural/sports 0.4 0.0 0.2 0.2 0.2Connect To/From IT Holiday 1.4 0.0 0.1 0.3 0.3Holiday fare paid separately 15.6 17.2 27.5 19.1 24.7Holiday fare paid separately - Ski 0.0 0.0 0.2 0.0 0.2Holiday IT/Package - Cruise 0.7 0.3 2.0 0.0 1.5Holiday IT/Package - Hotel 3.9 0.3 38.5 2.3 28.3Holiday IT/Package - Hotel - Ski 0.0 0.0 1.0 0.0 0.7Holiday IT/Package - Self Catering 0.1 0.0 2.0 0.1 1.5Holiday IT/Package - Self Catering - Ski 0.0 0.0 0.1 0.0 0.0Migration 0.2 0.1 0.2 0.0 0.2Studies private/grants - formal 0.3 6.1 0.4 0.8 0.5Studies private/grants - other 0.0 0.1 0.0 0.4 0.1Unaccompanied school childrenUnaccompanie school children 0 00.0 0 00.0 0 00.0 0 00.0 0 00.0Visiting friends and relatives 32.2 37.3 16.6 48.1 23.9Other 0.2 0.2 0.0 0.1 0.1
Total leisure 55.0 61.5 88.9 71.5 82.2Total 100.0 100.0 100.0 100.0 100.0Total terminal passengers (000s) 2,148 317 15,479 3,715 21,660
129

d
Table 18.11Journey purpose by route and country of residence at Stansted Airport in 2014.
Journey Purpose Domestic International ALL UK Foreign UK Foreign % % % % %
Business Business 10.8 5.5 2.5 4.3 3.7Business (Commuting) 3.2 0.9 0.4 0.9 0.7Attending Internal Company Business 11.6 4.6 3.0 3.2 3.5Meetings with Customers 12.5 4.3 3.7 3.4 4.1Conference/Congress 3.4 4.8 0.9 1.6 1.4Trade Fair/Exhibition 0.2 0.8 0.4 0.7 0.5Armed Services 0.7 0.0 0.1 0.1 0.2Airline Staff (Positioning) 0.0 0.0 0.0 0.3 0.1Contract Home Leave 0.3 1.4 0.1 0.2 0.1Overseas Employment < 12 months 0.1 0.0 0.4 0.8 0.5Overseas Employment >= 12 months 0.0 0.0 0.1 0.1 0.1Studies - formal 0.8 0.0 0.0 0.2 0.1Studies paid by employer - other 0.2 0.3 0.0 0.2 0.1Au pair 0.0 0.0 0.0 0.1 0.0
Total business 43.7 22.6 11.7 16.0 15.2
Leisure Cultural/sports 0.2 0.0 0.6 0.2 0.4Connect To/From IT Holiday 0.1 0.0 0.0 0.1 0.1Holiday fare paid separately 21.8 33.5 36.1 38.4 36.3Holiday fare paid separately - Ski 0.0 0.0 0.6 0.0 0.4Holiday IT/Package - Cruise 0.0 0.0 0.1 0.0 0.1Holiday IT/Package - Hotel 1.0 0.0 8.1 1.6 5.0Holiday IT/Package - Hotel - Ski 0.0 0.0 0.3 0.0 0.2Holiday IT/Package - Self Catering 0.0 0.0 0.9 0.1 0.5Holiday IT/Package - Self Catering - Ski 0.0 0.0 0.1 0.0 0.0Migration 0.0 0.0 0.4 0.0 0.2Studies private/grants - formal 0.2 0.3 0.5 1.0 0.7Studies private/grants - other 0.3 0.0 0.0 0.5 0.2Unaccompanied school childrenUnaccompanie school children 0 10.1 0 00.0 0 00.0 0 00.0 0 00.0Visiting friends and relatives 32.6 43.6 39.9 41.7 40.3Other 0.2 0.0 0.5 0.2 0.4
Total leisure 56.3 77.4 88.3 83.9 84.8Total 100.0 100.0 100.0 99.9 100.0Total terminal passengers (000s) 1,033 116 10,631 8,120 19,899
* Any unspecified leisure responses have been included in the Holiday Fare Paid Separately category
130

d
Table 19.1Journey purpose by flight type and country of residence at Birmingham Airport in 2014.
Journey Purpose Charter Scheduled ALL UK Foreign UK Foreign % % % % %
Business Business 0.0 1.3 1.0 1.7 1.0Business (Commuting) 0.0 0.0 0.1 0.1 0.1Attending Internal Company Business 0.0 0.0 8.1 9.5 7.0Meetings with Customers 0.0 6.9 6.5 11.2 6.5Conference/Congress 0.0 0.0 2.5 3.4 2.3Trade Fair/Exhibition 0.0 1.6 1.3 2.4 1.3Armed Services 0.0 5.8 0.2 0.7 0.3Airline Staff (Positioning) 0.0 0.0 0.2 0.1 0.1Contract Home Leave 0.0 0.0 0.1 0.8 0.2Overseas Employment < 12 months 0.0 0.0 0.7 0.5 0.5Overseas Employment >= 12 months 0.0 0.0 0.2 0.1 0.1Studies - formal 0.0 0.0 0.2 0.8 0.3Studies paid by employer - other 0.0 0.0 0.5 0.6 0.5Au pair 0.0 0.0 0.0 0.1 0.0
Total business 0.1 15.6 21.6 32.0 20.3
Leisure Cultural/sports 0.0 0.0 1.2 2.0 1.2Connect To/From IT Holiday 0.0 0.0 0.0 0.0 0.0Holiday fare paid separately 9.8 8.1 20.6 9.7 16.2Holiday fare paid separately - Ski 0.0 0.0 0.3 0.0 0.2Holiday IT/Package - Cruise 4.3 0.0 0.5 0.0 1.0Holiday IT/Package - Hotel 71.0 5.5 14.6 0.4 20.9Holiday IT/Package - Hotel - Ski 1.1 0.0 0.1 0.0 0.2Holiday IT/Package - Self Catering 7.7 0.0 1.7 0.4 2.4Holiday IT/Package - Self Catering - Ski 0.8 0.0 0.2 0.0 0.2Migration 0.0 0.0 0.1 0.0 0.1Studies private/grants - formal 0.0 0.0 0.3 1.0 0.4Studies private/grants - other 0.0 0.0 0.0 0.3 0.1Unaccompanied school childrenUnaccompanie school children 0 00.0 0 00.0 0 00.0 0 00.0 0 00.0Visiting friends and relatives 5.1 69.2 37.5 49.9 35.0Other 0.1 1.7 1.2 4.2 1.7
Total leisure 99.9 84.4 78.4 68.0 79.7Total 100.0 100.0 100.0 100.0 100.0Total terminal passengers (000s) 1,593 51 5,474 2,168 9,286
131

d
Table 19.2Journey purpose by flight type and country of residence at Doncaster Airport in 2014.
Journey Purpose Charter Scheduled ALL UK Foreign UK Foreign % % % % %
Business Business 0.0 0.0 1.0 0.2 0.3Business (Commuting) 0.0 0.0 0.0 0.1 0.0Attending Internal Company Business 0.0 0.0 2.4 4.0 1.3Meetings with Customers 0.0 0.0 1.0 0.8 0.4Conference/Congress 0.0 0.0 0.0 0.3 0.0Trade Fair/Exhibition 0.0 0.0 0.0 0.2 0.0Armed Services 0.0 0.0 0.1 0.2 0.0Airline Staff (Positioning) 0.0 0.0 0.1 0.0 0.0Contract Home Leave 0.0 0.0 0.1 0.5 0.1Overseas Employment < 12 months 0.0 0.0 0.5 1.9 0.4Overseas Employment >= 12 months 0.0 0.0 0.0 0.0 0.0Studies - formal 0.0 0.0 0.0 0.0 0.0Studies paid by employer - other 0.0 0.0 0.0 0.0 0.0Au pair 0.0 0.0 0.0 0.0 0.0
Total business 0.1 0.0 5.1 8.3 2.8
Leisure Cultural/sports 0.0 0.0 0.0 0.0 0.0Connect To/From IT Holiday 0.0 0.0 0.0 0.0 0.0Holiday fare paid separately 4.5 0.0 3.1 1.4 3.6Holiday fare paid separately - Ski 0.0 0.0 0.0 0.0 0.0Holiday IT/Package - Cruise 5.7 8.1 0.0 0.0 3.1Holiday IT/Package - Hotel 76.1 35.1 1.8 0.0 42.6Holiday IT/Package - Hotel - Ski 0.6 0.0 0.0 0.0 0.3Holiday IT/Package - Self Catering 10.9 7.0 0.3 0.0 6.1Holiday IT/Package - Self Catering - Ski 0.2 0.0 0.0 0.2 0.1Migration 0.0 0.0 5.7 0.6 1.8Studies private/grants - formal 0.0 0.0 0.6 1.1 0.3Studies private/grants - other 0.0 0.0 0.0 0.0 0.0Unaccompanied school childrenUnaccompanie school children 0 00.0 0 00.0 0 30.3 0 00.0 0 10.1Visiting friends and relatives 1.7 49.9 80.5 87.9 38.0Other 0.3 0.0 2.5 0.6 1.0
Total leisure 99.9 100.0 94.9 91.7 97.2Total 100.0 100.0 100.0 100.0 100.0Total terminal passengers (000s) 398 2 216 106 722
132

d
Table 19.3Journey purpose by flight type and country of residence at East Midlands Airport in 2014.
Journey Purpose Charter Scheduled ALL UK Foreign UK Foreign % % % % %
Business Business 0.1 0.0 0.5 1.6 0.6Business (Commuting) 0.0 0.0 0.1 0.4 0.1Attending Internal Company Business 0.0 0.0 4.0 3.4 3.2Meetings with Customers 0.0 0.0 2.1 2.9 1.8Conference/Congress 0.0 0.0 0.4 0.8 0.3Trade Fair/Exhibition 0.0 0.0 0.1 0.1 0.1Armed Services 0.0 0.0 0.1 0.0 0.0Airline Staff (Positioning) 0.0 0.0 0.0 0.0 0.0Contract Home Leave 0.0 0.0 0.0 0.0 0.0Overseas Employment < 12 months 0.0 0.0 0.1 0.1 0.1Overseas Employment >= 12 months 0.0 0.0 0.0 0.2 0.0Studies - formal 0.0 0.0 0.3 0.0 0.2Studies paid by employer - other 0.0 0.0 0.3 0.2 0.2Au pair 0.0 0.0 0.0 0.1 0.0
Total business 0.1 0.0 8.0 9.9 6.7
Leisure Cultural/sports 0.0 0.0 0.4 0.6 0.3Connect To/From IT Holiday 0.0 0.0 0.0 0.0 0.0Holiday fare paid separately 5.6 0.0 34.9 9.9 26.9Holiday fare paid separately - Ski 0.0 0.0 0.3 0.0 0.2Holiday IT/Package - Cruise 2.4 6.4 0.0 0.0 0.5Holiday IT/Package - Hotel 81.2 20.7 25.1 0.4 32.7Holiday IT/Package - Hotel - Ski 1.2 0.0 0.1 0.0 0.3Holiday IT/Package - Self Catering 6.6 0.0 4.0 0.0 4.0Holiday IT/Package - Self Catering - Ski 0.4 0.0 0.0 0.1 0.1Migration 0.0 0.0 0.1 0.1 0.1Studies private/grants - formal 0.0 0.0 0.2 1.0 0.2Studies private/grants - other 0.0 0.0 0.0 0.0 0.0Unaccompanied school childrenUnaccompanie school children 0 00.0 0 00.0 0 00.0 0 00.0 0 00.0Visiting friends and relatives 1.9 72.9 26.5 77.6 27.4Other 0.5 0.0 0.4 0.5 0.4
Total leisure 99.9 100.0 92.0 90.1 93.3Total 100.0 100.0 100.0 100.0 100.0Total terminal passengers (000s) 809 4 3,183 468 4,464
133

d
Table 19.4Journey purpose by flight type and country of residence at Gatwick Airport in 2014.
Journey Purpose Charter Scheduled ALL UK Foreign UK Foreign % % % % %
Business Business 0.0 4.9 1.0 1.4 1.0Business (Commuting) 0.0 0.0 0.2 0.4 0.3Attending Internal Company Business 0.2 5.5 4.6 5.7 4.4Meetings with Customers 0.1 0.0 4.5 8.3 5.1Conference/Congress 0.1 0.0 1.2 2.6 1.5Trade Fair/Exhibition 0.0 0.1 0.3 0.5 0.3Armed Services 0.0 0.0 0.2 0.2 0.1Airline Staff (Positioning) 0.0 0.0 0.1 0.3 0.1Contract Home Leave 0.0 1.5 0.1 0.3 0.2Overseas Employment < 12 months 0.3 0.7 0.6 0.9 0.6Overseas Employment >= 12 months 0.1 0.0 0.1 0.2 0.1Studies - formal 0.0 0.0 0.0 0.2 0.1Studies paid by employer - other 0.0 0.0 0.1 0.3 0.1Au pair 0.0 0.0 0.0 0.1 0.0
Total business 0.8 12.7 13.0 21.3 13.9
Leisure Cultural/sports 0.1 0.0 0.8 0.9 0.8Connect To/From IT Holiday 0.1 1.8 0.8 0.5 0.7Holiday fare paid separately 5.7 15.2 33.6 27.5 28.7Holiday fare paid separately - Ski 0.0 0.0 1.1 0.1 0.7Holiday IT/Package - Cruise 2.8 3.5 1.0 0.1 1.0Holiday IT/Package - Hotel 73.6 28.6 19.7 3.7 21.4Holiday IT/Package - Hotel - Ski 6.5 3.0 0.2 0.0 0.8Holiday IT/Package - Self Catering 7.0 4.1 1.4 0.2 1.7Holiday IT/Package - Self Catering - Ski 1.1 0.0 0.1 0.0 0.2Migration 0.0 0.0 0.2 0.0 0.2Studies private/grants - formal 0.0 0.0 0.9 2.1 1.1Studies private/grants - other 0.0 0.1 0.3 1.5 0.6Unaccompanied school childrenUnaccompanie school children 0 00.0 0 00.0 0 00.0 0 10.1 0 00.0Visiting friends and relatives 2.2 31.0 26.7 41.8 28.1Other 0.0 0.0 0.1 0.2 0.2
Total leisure 99.2 87.3 87.0 78.7 86.1Total 100.0 100.0 100.0 100.0 100.0Total terminal passengers (000s) 4,285 79 23,057 10,465 37,886
134

d
Table 19.5Journey purpose by flight type and country of residence at Heathrow Airport in 2014.
Journey Purpose Charter Scheduled ALL UK Foreign UK Foreign % % % % %
Business Business 0.0 0.0 6.7 6.2 6.4Business (Commuting) 0.0 0.0 0.4 0.1 0.2Attending Internal Company Business 0.0 0.0 9.6 8.7 9.1Meetings with Customers 0.0 64.2 7.4 6.0 6.6Conference/Congress 0.0 0.0 3.0 3.5 3.3Trade Fair/Exhibition 0.0 0.0 0.8 0.7 0.7Armed Services 0.0 0.0 0.3 0.3 0.3Airline Staff (Positioning) 0.0 0.0 0.3 0.2 0.2Contract Home Leave 0.0 0.0 0.4 0.9 0.7Overseas Employment < 12 months 1.7 0.0 0.8 1.5 1.2Overseas Employment >= 12 months 0.0 0.0 0.4 0.4 0.4Studies - formal 0.0 0.0 0.1 0.2 0.2Studies paid by employer - other 0.0 0.0 0.1 0.2 0.2Au pair 0.0 0.0 0.0 0.1 0.0
Total business 1.7 64.2 30.5 29.0 29.5
Leisure Cultural/sports 0.0 0.0 0.2 0.3 0.3Connect To/From IT Holiday 0.0 0.0 0.1 0.2 0.1Holiday fare paid separately 1.9 10.1 25.4 28.4 27.2Holiday fare paid separately - Ski 0.0 0.0 0.3 0.0 0.1Holiday IT/Package - Cruise 0.5 0.0 0.9 0.7 0.8Holiday IT/Package - Hotel 91.8 25.7 7.4 5.3 6.3Holiday IT/Package - Hotel - Ski 0.0 0.0 0.1 0.1 0.1Holiday IT/Package - Self Catering 1.3 0.0 0.1 0.1 0.1Holiday IT/Package - Self Catering - Ski 0.0 0.0 0.0 0.0 0.0Migration 0.0 0.0 0.4 0.2 0.3Studies private/grants - formal 0.0 0.0 2.3 2.1 2.1Studies private/grants - other 0.0 0.0 0.1 0.9 0.6Unaccompanied school childrenUnaccompanie school children 0 00.0 0 00.0 0 20.2 0 00.0 0 10.1Visiting friends and relatives 2.9 0.0 31.7 32.2 32.0Other 0.0 0.0 0.4 0.5 0.5
Total leisure 98.3 35.8 69.5 71.0 70.5Total 100.0 100.0 100.0 100.0 100.0Total terminal passengers (000s) 87 3 29,435 43,639 73,164
* Any unspecified leisure responses have been included in the Holiday Fare Paid Separately category
135

d
Table 19.6Journey purpose by flight type and country of residence at Leeds Bradford Airport in 2014.
Journey Purpose Charter Scheduled ALL UK Foreign UK Foreign % % % % %
Business Business 0.4 0.0 1.1 2.6 1.3Business (Commuting) 0.0 0.0 0.3 0.7 0.3Attending Internal Company Business 0.0 0.0 2.1 3.9 2.3Meetings with Customers 0.0 0.0 2.9 7.3 3.4Conference/Congress 0.0 0.0 1.0 2.0 1.1Trade Fair/Exhibition 0.0 0.0 0.3 1.8 0.5Armed Services 0.0 0.0 0.1 0.3 0.1Airline Staff (Positioning) 0.0 0.0 0.0 0.0 0.0Contract Home Leave 0.0 0.0 0.0 0.0 0.0Overseas Employment < 12 months 0.0 0.0 0.2 0.7 0.3Overseas Employment >= 12 months 0.0 0.0 0.2 0.2 0.2Studies - formal 0.0 0.0 0.0 0.2 0.0Studies paid by employer - other 0.0 0.0 0.2 0.2 0.2Au pair 0.0 0.0 0.0 0.0 0.0
Total business 0.4 0.0 8.4 19.8 9.9
Leisure Cultural/sports 0.5 0.0 1.0 4.0 1.4Connect To/From IT Holiday 0.0 0.0 0.0 0.0 0.0Holiday fare paid separately 10.2 0.0 39.8 13.3 35.0Holiday fare paid separately - Ski 0.0 0.0 0.6 0.0 0.5Holiday IT/Package - Cruise 1.3 0.0 1.8 0.0 1.5Holiday IT/Package - Hotel 74.4 100.0 22.4 0.8 20.7Holiday IT/Package - Hotel - Ski 2.6 0.0 0.2 0.0 0.2Holiday IT/Package - Self Catering 7.9 0.0 4.2 0.1 3.7Holiday IT/Package - Self Catering - Ski 0.0 0.0 0.0 0.0 0.0Migration 0.0 0.0 0.1 0.3 0.2Studies private/grants - formal 0.0 0.0 0.2 1.2 0.3Studies private/grants - other 0.0 0.0 0.1 0.2 0.1Unaccompanied school childrenUnaccompanie school children 0 00.0 0 00.0 0 00.0 0 00.0 0 00.0Visiting friends and relatives 2.6 0.0 20.7 56.5 25.5Other 0.0 0.0 0.7 3.7 1.1
Total leisure 99.6 100.0 91.6 80.2 90.1Total 100.0 100.0 100.0 100.0 100.0Total terminal passengers (000s) 85 1 2,456 442 2,983
136

d
Table 19.7Journey purpose by flight type and country of residence at Liverpool Airport in 2014.
Journey Purpose Charter Scheduled ALL UK Foreign UK Foreign % % % % %
Business Business 0.0 0.0 1.1 1.7 1.2Business (Commuting) 0.0 0.0 0.1 0.3 0.2Attending Internal Company Business 0.0 0.0 3.5 4.4 3.7Meetings with Customers 0.0 0.0 2.2 3.0 2.4Conference/Congress 0.0 0.0 0.7 1.0 0.8Trade Fair/Exhibition 0.0 0.0 0.1 0.2 0.2Armed Services 0.0 0.0 0.1 0.1 0.1Airline Staff (Positioning) 0.0 0.0 0.0 0.0 0.0Contract Home Leave 0.0 0.0 0.1 0.2 0.1Overseas Employment < 12 months 0.0 0.0 0.5 0.8 0.6Overseas Employment >= 12 months 0.0 0.0 0.1 0.2 0.2Studies - formal 0.0 0.0 0.1 0.2 0.1Studies paid by employer - other 0.0 0.0 0.0 0.1 0.1Au pair 0.0 0.0 0.0 0.1 0.0
Total business 0.0 0.0 8.7 12.3 9.5
Leisure Cultural/sports 0.0 0.0 0.3 0.6 0.4Connect To/From IT Holiday 0.0 0.0 0.2 0.0 0.1Holiday fare paid separately 5.0 50.2 39.0 26.3 36.1Holiday fare paid separately - Ski 0.0 0.0 1.2 0.0 0.9Holiday IT/Package - Cruise 0.0 0.0 0.1 0.0 0.1Holiday IT/Package - Hotel 95.0 49.8 10.2 0.9 8.3Holiday IT/Package - Hotel - Ski 0.0 0.0 0.1 0.0 0.1Holiday IT/Package - Self Catering 0.0 0.0 0.4 0.0 0.3Holiday IT/Package - Self Catering - Ski 0.0 0.0 0.0 0.0 0.0Migration 0.0 0.0 0.2 0.1 0.2Studies private/grants - formal 0.0 0.0 0.5 0.7 0.6Studies private/grants - other 0.0 0.0 0.2 0.5 0.3Unaccompanied school childrenUnaccompanie school children 0 00.0 0 00.0 0 00.0 0 00.0 0 00.0Visiting friends and relatives 0.0 0.0 37.5 58.0 42.1Other 0.0 0.0 1.3 0.6 1.1
Total leisure 100.0 100.0 91.3 87.7 90.5Total 100.0 100.0 100.0 100.0 100.0Total terminal passengers (000s) 6 1 3,061 903 3,971
137

d
Table 19.8Journey purpose by flight type and country of residence at London City Airport in 2014.
Journey Purpose Charter Scheduled ALL UK Foreign UK Foreign % % % % %
Business Business - - 8.6 14.4 11.1Business (Commuting) - - 0.8 0.2 0.5Attending Internal Company Business - - 13.6 13.6 13.6Meetings with Customers - - 17.6 23.2 20.1Conference/Congress - - 3.1 3.0 3.0Trade Fair/Exhibition - - 1.2 1.1 1.2Armed Services - - 0.0 0.0 0.0Airline Staff (Positioning) - - 0.1 0.5 0.3Contract Home Leave - - 0.3 0.2 0.2Overseas Employment < 12 months - - 0.6 0.5 0.6Overseas Employment >= 12 months - - 0.0 0.5 0.3Studies - formal - - 0.5 0.2 0.4Studies paid by employer - other - - 0.7 0.3 0.6Au pair - - 0.0 0.1 0.1
Total business - - 47.1 57.8 51.9
Leisure Cultural/sports - - 1.8 2.1 2.0Connect To/From IT Holiday - - 0.0 0.0 0.0Holiday fare paid separately - - 13.1 14.2 13.6Holiday fare paid separately - Ski - - 1.5 0.1 0.9Holiday IT/Package - Cruise - - 0.1 0.1 0.1Holiday IT/Package - Hotel - - 2.6 2.4 2.5Holiday IT/Package - Hotel - Ski - - 0.0 0.0 0.0Holiday IT/Package - Self Catering - - 0.4 0.3 0.4Holiday IT/Package - Self Catering - Ski - - 0.0 0.0 0.0Migration - - 0.3 0.1 0.2Studies private/grants - formal - - 0.2 0.4 0.3Studies private/grants - other - - 0.1 0.8 0.4Unaccompanied school childrenUnaccompanie school children - - 0 00.0 0 60.6 0 30.3Visiting friends and relatives - - 31.5 20.3 26.6Other - - 1.2 0.7 1.0
Total leisure - - 52.9 42.2 48.1Total - - 100.0 100.0 100.0Total terminal passengers (000s) - - 2,023 1,625 3,648
138

d
Table 19.9Journey purpose by flight type and country of residence at Luton Airport in 2014.
Journey Purpose Charter Scheduled ALL UK Foreign UK Foreign % % % % %
Business Business 0.0 0.0 0.7 2.5 1.1Business (Commuting) 0.0 0.0 0.9 0.9 0.9Attending Internal Company Business 0.1 0.0 5.6 7.1 5.7Meetings with Customers 0.0 0.0 5.9 5.2 5.5Conference/Congress 0.0 18.8 1.7 2.4 1.8Trade Fair/Exhibition 0.0 0.0 0.2 0.6 0.3Armed Services 0.0 0.0 0.2 0.2 0.2Airline Staff (Positioning) 0.0 0.0 0.1 0.2 0.1Contract Home Leave 0.0 0.0 0.0 0.0 0.0Overseas Employment < 12 months 0.0 7.9 0.2 1.9 0.6Overseas Employment >= 12 months 0.0 0.0 0.0 0.1 0.1Studies - formal 0.0 0.0 0.0 0.2 0.1Studies paid by employer - other 0.0 0.0 0.1 0.3 0.1Au pair 0.0 0.0 0.0 0.0 0.0
Total business 0.2 26.7 15.7 21.5 16.5
Leisure Cultural/sports 0.3 0.0 0.7 0.5 0.6Connect To/From IT Holiday 0.0 0.0 0.0 0.0 0.0Holiday fare paid separately 12.5 15.1 28.6 19.4 25.8Holiday fare paid separately - Ski 0.0 0.0 1.1 0.0 0.8Holiday IT/Package - Cruise 4.1 0.0 0.1 0.0 0.2Holiday IT/Package - Hotel 71.5 31.0 8.8 1.1 9.3Holiday IT/Package - Hotel - Ski 0.0 0.0 0.1 0.0 0.1Holiday IT/Package - Self Catering 9.5 13.3 0.7 0.1 0.9Holiday IT/Package - Self Catering - Ski 0.0 0.0 0.1 0.0 0.1Migration 0.0 0.0 0.4 0.1 0.4Studies private/grants - formal 0.0 0.0 0.5 1.0 0.6Studies private/grants - other 0.0 0.0 0.2 0.4 0.2Unaccompanied school childrenUnaccompanie school children 0 00.0 0 00.0 0 00.0 0 00.0 0 00.0Visiting friends and relatives 2.0 13.8 42.5 55.7 44.1Other 0.0 0.0 0.5 0.2 0.4
Total leisure 99.8 73.3 84.3 78.5 83.5Total 100.0 100.0 100.0 100.0 100.0Total terminal passengers (000s) 375 6 7,556 2,463 10,400
139

d
Table 19.10Journey purpose by flight type and country of residence at Manchester Airport in 2014.
Journey Purpose Charter Scheduled ALL UK Foreign UK Foreign % % % % %
Business Business 0.0 0.0 1.7 2.3 1.5Business (Commuting) 0.0 0.0 0.4 0.4 0.3Attending Internal Company Business 0.3 2.1 9.7 14.3 8.9Meetings with Customers 0.0 0.0 4.9 8.2 4.7Conference/Congress 0.1 0.0 1.1 2.2 1.1Trade Fair/Exhibition 0.0 0.0 0.2 0.3 0.2Armed Services 0.0 0.0 0.0 0.1 0.0Airline Staff (Positioning) 0.0 0.0 0.1 0.2 0.1Contract Home Leave 0.0 0.0 0.1 0.7 0.2Overseas Employment < 12 months 0.0 0.0 0.5 0.3 0.4Overseas Employment >= 12 months 0.0 0.0 0.3 0.1 0.2Studies - formal 0.0 0.0 0.1 0.2 0.1Studies paid by employer - other 0.0 0.0 0.0 0.0 0.0Au pair 0.0 0.0 0.0 0.0 0.0
Total business 0.5 2.1 19.1 29.6 17.8
Leisure Cultural/sports 0.0 0.0 0.2 0.2 0.2Connect To/From IT Holiday 0.2 1.2 0.3 0.2 0.3Holiday fare paid separately 8.8 16.7 30.7 18.9 24.7Holiday fare paid separately - Ski 0.1 0.0 0.2 0.0 0.2Holiday IT/Package - Cruise 4.9 0.0 1.0 0.1 1.5Holiday IT/Package - Hotel 76.9 15.3 22.9 2.0 28.3Holiday IT/Package - Hotel - Ski 3.2 2.9 0.3 0.0 0.7Holiday IT/Package - Self Catering 3.8 3.2 1.2 0.0 1.5Holiday IT/Package - Self Catering - Ski 0.2 0.0 0.0 0.0 0.0Migration 0.0 0.0 0.2 0.0 0.2Studies private/grants - formal 0.0 2.1 0.5 1.2 0.5Studies private/grants - other 0.0 10.1 0.0 0.3 0.1Unaccompanied school childrenUnaccompanie school children 0 00.0 0 00.0 0 00.0 0 00.0 0 00.0Visiting friends and relatives 1.3 46.5 23.1 47.3 23.9Other 0.1 0.0 0.1 0.1 0.1
Total leisure 99.5 97.9 80.9 70.4 82.2Total 100.0 100.0 100.0 100.0 100.0Total terminal passengers (000s) 3,713 40 13,914 3,992 21,660
140

d
Table 19.11Journey purpose by flight type and country of residence at Stansted Airport in 2014.
Journey Purpose Charter Scheduled ALL UK Foreign UK Foreign % % % % %
Business Business 0.1 4.9 3.4 4.3 3.7Business (Commuting) 0.0 0.0 0.7 0.9 0.7Attending Internal Company Business 0.5 0.0 3.9 3.2 3.5Meetings with Customers 0.0 0.0 4.7 3.4 4.1Conference/Congress 0.1 0.0 1.2 1.7 1.4Trade Fair/Exhibition 0.0 0.0 0.4 0.7 0.5Armed Services 0.2 0.0 0.2 0.1 0.2Airline Staff (Positioning) 0.0 0.0 0.0 0.3 0.1Contract Home Leave 0.0 0.0 0.1 0.2 0.1Overseas Employment < 12 months 0.1 0.0 0.3 0.8 0.5Overseas Employment >= 12 months 0.1 0.0 0.1 0.1 0.1Studies - formal 0.0 0.0 0.1 0.2 0.1Studies paid by employer - other 0.0 0.0 0.1 0.2 0.1Au pair 0.0 0.0 0.0 0.1 0.0
Total business 1.1 4.9 15.2 16.1 15.2
Leisure Cultural/sports 0.0 0.0 0.6 0.2 0.4Connect To/From IT Holiday 0.0 0.0 0.0 0.1 0.1Holiday fare paid separately 7.4 23.6 36.2 38.3 36.3Holiday fare paid separately - Ski 0.2 0.0 0.6 0.0 0.4Holiday IT/Package - Cruise 1.9 0.0 0.0 0.0 0.1Holiday IT/Package - Hotel 73.8 47.9 4.2 1.5 5.0Holiday IT/Package - Hotel - Ski 6.1 0.0 0.0 0.0 0.2Holiday IT/Package - Self Catering 6.7 0.0 0.5 0.1 0.5Holiday IT/Package - Self Catering - Ski 0.0 0.0 0.1 0.0 0.0Migration 0.0 0.0 0.4 0.0 0.2Studies private/grants - formal 0.0 0.0 0.5 1.0 0.7Studies private/grants - other 0.0 0.0 0.1 0.4 0.2Unaccompanied school childrenUnaccompanie school children 0 00.0 0 00.0 0 00.0 0 00.0 0 00.0Visiting friends and relatives 2.8 23.6 41.1 41.8 40.3Other 0.0 0.0 0.5 0.2 0.4
Total leisure 98.9 95.1 84.8 83.8 84.8Total 100.0 100.0 100.0 99.9 100.0Total terminal passengers (000s) 556 6 11,108 8,230 19,899
* Any unspecified leisure responses have been included in the Holiday Fare Paid Separately category
141

Table 20.1Number of terminal passengers travelling for business by quarter during 2014
Survey Airport Jan - Mar Apr - Jun Jul - Sep Oct - Dec Passengers000's % 000's % 000's % 000's % 000's
Birmingham 445 24.2 469 25.5 443 24.1 483 26.2 1,840Doncaster 3 15.3 5 25.0 4 21.5 8 38.2 20East Midlands 81 27.2 77 25.7 67 22.3 74 24.8 299Gatwick 1,255 25.4 1,318 26.7 1,100 22.3 1,261 25.6 4,934Heathrow 3,602 24.3 4,142 27.9 3,389 22.8 3,716 25.0 14,848Leeds Bradford 71 24.2 64 21.9 82 28.1 75 25.8 293Liverpool 94 25.4 90 24.2 102 27.6 84 22.8 371London City 418 22.4 488 26.2 396 21.3 561 30.1 1,863Luton 378 22.4 509 30.2 353 20.9 448 26.5 1,689Manchester 920 25.2 1,048 28.7 809 22.2 873 23.9 3,650Stansted 653 22.6 792 27.5 703 24.4 736 25.5 2,884
Total 7,920 24.2 9,002 27.5 7,448 22.8 8,319 25.4 32,689
142

Table 20.2Number of terminal passengers travelling for leisure by quarter during 2014
Survey Airport Jan - Mar Apr - Jun Jul - Sep Oct - Dec Passengers000's % 000's % 000's % 000's % 000's
Birmingham 1,147 16.0 1,954 27.2 2,520 35.0 1,570 21.8 7,191Doncaster 98 14.0 181 25.8 274 39.0 148 21.1 702East Midlands 492 11.9 1,237 29.9 1,634 39.5 779 18.8 4,142Gatwick 5,429 17.9 8,217 27.1 10,375 34.2 6,292 20.8 30,313Heathrow 6,471 19.9 8,250 25.4 10,073 31.0 7,732 23.8 32,527Leeds Bradford 349 13.0 797 29.8 983 36.7 548 20.5 2,677Liverpool 692 19.9 950 27.3 1,069 30.7 771 22.1 3,482London City 339 20.0 402 23.6 551 32.4 408 24.0 1,700Luton 1,472 17.2 2,323 27.2 2,920 34.2 1,835 21.5 8,550Manchester 2,961 17.1 4,621 26.7 6,141 35.5 3,571 20.6 17,294Stansted 2,873 17.7 4,297 26.5 5,101 31.4 3,961 24.4 16,232
Total 22,325 17.9 33,230 26.6 41,640 33.4 27,614 22.1 124,809
143

Table 20.3Number of terminal passengers travelling by quarter during 2014
Survey Airport Jan - Mar Apr - Jun Jul - Sep Oct - Dec Passengers000's % 000's % 000's % 000's % 000's
Birmingham 1,592 17.6 2,424 26.8 2,963 32.8 2,053 22.7 9,031Doncaster 101 14.1 186 25.8 278 38.5 156 21.6 722East Midlands 574 12.9 1,313 29.6 1,701 38.3 853 19.2 4,441Gatwick 6,684 19.0 9,535 27.1 11,475 32.6 7,552 21.4 35,246Heathrow 10,073 21.3 12,392 26.2 13,461 28.4 11,448 24.2 47,374Leeds Bradford 420 14.1 861 29.0 1,066 35.9 623 21.0 2,970Liverpool 786 20.4 1,040 27.0 1,171 30.4 855 22.2 3,853London City 757 21.2 890 25.0 946 26.6 969 27.2 3,563Luton 1,850 18.1 2,833 27.7 3,273 32.0 2,283 22.3 10,239Manchester 3,881 18.5 5,669 27.1 6,950 33.2 4,444 21.2 20,944Stansted 3,526 18.4 5,089 26.6 5,804 30.4 4,696 24.6 19,116
Total 30,245 19.2 42,232 26.8 49,089 31.2 35,933 22.8 157,498
144
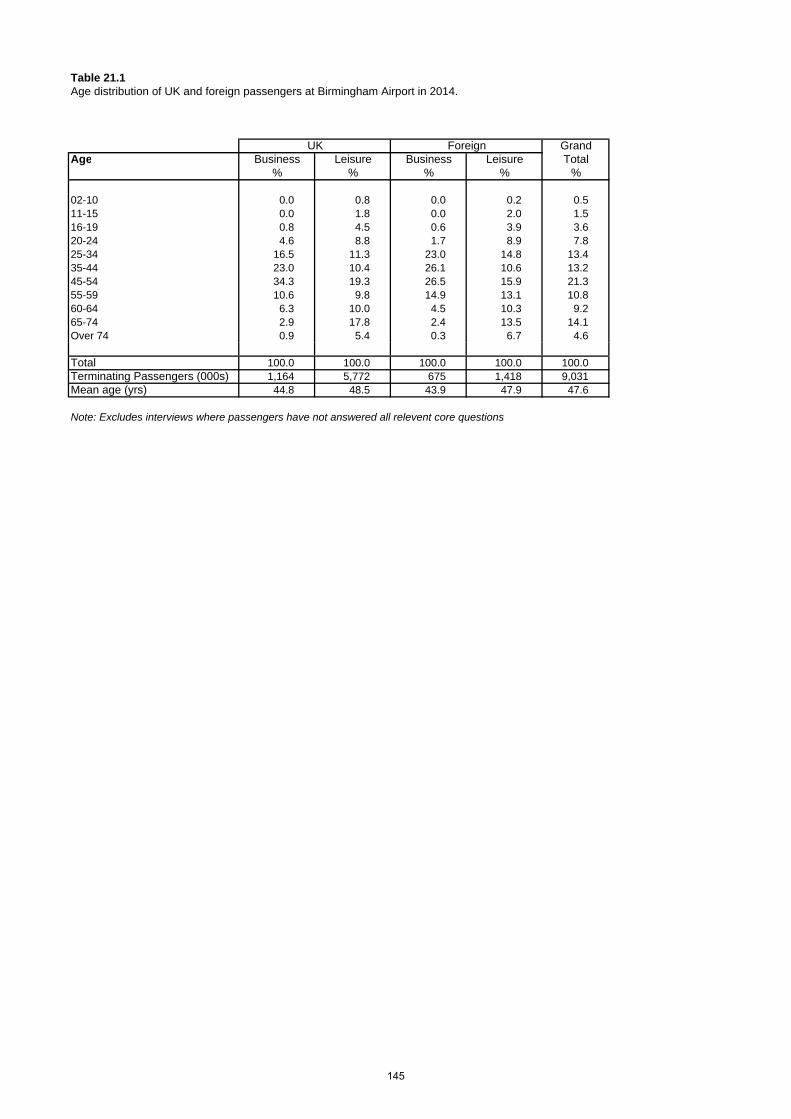
Table 21.1Age distribution of UK and foreign passengers at Birmingham Airport in 2014.
UK Foreign GrandAge Business Leisure Business Leisure Total
% % % % %
02-10 0.0 0.8 0.0 0.2 0.511-15 0.0 1.8 0.0 2.0 1.516-19 0.8 4.5 0.6 3.9 3.620-24 4.6 8.8 1.7 8.9 7.825-34 16.5 11.3 23.0 14.8 13.435-44 23.0 10.4 26.1 10.6 13.245-54 34.3 19.3 26.5 15.9 21.355-59 10.6 9.8 14.9 13.1 10.860-64 6.3 10.0 4.5 10.3 9.265-74 2.9 17.8 2.4 13.5 14.1Over 74 0.9 5.4 0.3 6.7 4.6
Total 100.0 100.0 100.0 100.0 100.0 Terminating Passengers (000s) 1,164 5,772 675 1,418 9,031Mean age (yrs) 44.8 48.5 43.9 47.9 47.6
Note: Excludes interviews where passengers have not answered all relevent core questions
145

Table 21.2Age distribution of UK and foreign passengers at Doncater Airport in 2014.
UK Foreign GrandAge Business Leisure Business Leisure Total
% % % % %
02-10 0.0 1.8 0.0 0.8 1.611-15 0.0 1.6 0.0 2.4 1.716-19 2.6 2.7 1.9 6.8 3.120-24 3.5 8.3 6.7 26.8 10.125-34 34.9 18.7 29.4 33.1 20.535-44 38.3 13.2 50.2 8.7 13.645-54 12.2 14.1 4.3 6.7 13.255-59 2.5 7.4 1.9 4.4 7.060-64 6.0 8.6 5.5 4.4 8.165-74 0.0 17.9 0.0 5.1 16.1Over 74 0.0 5.6 0.0 0.7 4.9
Total 100.0 100.0 100.0 100.0 100.0 Terminating Passengers (000s) 11 603 9 99 722Mean age (yrs) 37.8 46.8 36.9 33.3 45.2
Note: Excludes interviews where passengers have not answered all relevent core questions
146

Table 21.3Age distribution of UK and foreign passengers at East Midlands Airport in 2014.
UK Foreign GrandAge Business Leisure Business Leisure Total
% % % % %
02-10 0.5 3.0 0.0 0.1 2.511-15 0.0 1.4 0.0 0.6 1.216-19 1.5 3.2 0.0 3.4 3.120-24 4.7 7.4 0.6 11.1 7.525-34 14.0 11.8 16.5 16.2 12.435-44 26.3 11.8 18.3 11.0 12.745-54 33.6 16.8 43.5 14.0 17.855-59 15.1 11.4 15.9 14.5 12.060-64 3.5 12.8 3.6 12.7 12.265-74 0.8 16.6 1.7 14.8 15.4Over 74 0.0 3.7 0.0 1.6 3.3
Total 100.0 100.0 100.0 100.0 100.0 Terminating Passengers (000s) 254 3,727 45 415 4,441Mean age (yrs) 43.8 48.0 46.2 46.9 47.6
Note: Excludes interviews where passengers have not answered all relevent core questions
147

Table 21.4Age distribution of UK and foreign passengers at Gatwick Airport in 2014.
UK Foreign GrandAge Business Leisure Business Leisure Total
% % % % %
02-10 0.0 3.5 0.0 1.6 2.611-15 0.0 3.6 0.0 4.1 3.216-19 1.6 4.3 0.4 5.8 4.220-24 5.3 9.8 4.5 17.5 10.725-34 23.1 18.2 27.9 22.0 19.935-44 27.5 13.1 37.2 12.6 15.645-54 24.5 17.5 19.2 12.5 17.255-59 9.3 8.4 6.9 6.2 8.060-64 4.7 8.6 2.5 7.5 7.765-74 3.9 10.7 1.3 8.2 9.1Over 74 0.1 2.2 0.1 1.9 1.9
Total 100.0 100.0 100.0 100.0 100.0 Terminating Passengers (000s) 2,911 22,957 2,023 7,356 35,246Mean age (yrs) 42.2 42.1 40.0 38.6 41.3
Note: Excludes interviews where passengers have not answered all relevent core questions
148

Table 21.5Age distribution of UK and foreign passengers at Heathrow Airport in 2014.
UK Foreign GrandAge Business Leisure Business Leisure Total
% % % % %
02-10 0.1 1.2 0.0 1.3 0.911-15 0.1 2.1 0.1 3.1 1.816-19 0.4 5.5 0.5 5.5 3.920-24 4.3 14.4 3.2 11.3 10.125-34 27.5 24.2 25.9 23.1 24.635-44 30.8 14.5 34.2 16.1 20.645-54 24.4 14.1 26.3 15.4 18.055-59 6.6 7.5 5.7 8.0 7.260-64 3.5 6.4 2.2 7.1 5.565-74 2.3 7.9 1.5 7.4 5.9Over 74 0.1 2.2 0.2 1.9 1.5
Total 100.0 100.0 100.0 100.0 100.0 Terminating Passengers (000s) 7,993 17,816 6,855 14,710 47,374Mean age (yrs) 41.0 39.8 40.9 40.2 40.3
Note: Excludes interviews where passengers have not answered all relevent core questions
149

Table 21.6Age distribution of UK and foreign passengers at Leeds Bradford Airport in 2014.
UK Foreign GrandAge Business Leisure Business Leisure Total
% % % % %
02-10 0.0 1.0 0.0 0.2 0.811-15 0.0 1.4 0.0 1.6 1.316-19 2.2 2.3 3.1 2.7 2.420-24 4.6 7.1 2.3 8.2 6.925-34 19.3 9.0 35.1 14.5 11.135-44 21.7 10.1 16.1 9.6 11.045-54 30.0 16.5 23.1 13.2 17.255-59 12.1 10.2 3.5 19.5 11.260-64 4.7 15.1 5.7 9.8 13.565-74 5.5 20.0 6.7 14.6 17.9Over 74 0.0 7.5 4.5 6.2 6.7
Total 100.0 100.0 100.0 100.0 100.0 Terminating Passengers (000s) 206 2,330 87 347 2,970Mean age (yrs) 44.1 52.0 42.9 49.3 50.8
Note: Excludes interviews where passengers have not answered all relevent core questions
150

Table 21.7Age distribution of UK and foreign passengers at Liverpool Airport in 2014.
UK Foreign GrandAge Business Leisure Business Leisure Total
% % % % %
02-10 0.0 1.1 0.0 0.5 0.911-15 0.0 1.8 0.0 1.9 1.616-19 0.8 4.8 0.6 6.1 4.620-24 6.9 11.4 6.0 18.0 12.125-34 17.3 18.0 25.5 20.3 18.635-44 31.4 12.6 37.3 12.1 14.545-54 27.1 18.2 16.8 15.7 18.455-59 8.3 9.3 3.6 8.7 9.060-64 6.4 8.9 4.3 7.6 8.365-74 1.2 10.6 5.0 7.7 9.3Over 74 0.6 3.3 1.0 1.4 2.7
Total 100.0 100.0 100.0 100.0 100.0 Terminating Passengers (000s) 264 2,713 107 769 3,853Mean age (yrs) 42.6 43.8 41.0 40.0 42.9
Note: Excludes interviews where passengers have not answered all relevent core questions
151

Table 21.8Age distribution of UK and foreign passengers at London City Airport in 2014.
UK Foreign GrandAge Business Leisure Business Leisure Total
% % % % %
02-10 0.0 0.8 0.0 0.3 0.311-15 0.0 0.3 0.0 2.0 0.516-19 0.1 3.0 0.0 3.7 1.720-24 6.8 17.0 7.0 16.5 12.025-34 27.6 25.1 30.0 23.4 26.635-44 29.4 16.6 21.3 12.9 20.145-54 23.5 15.8 29.7 12.2 20.355-59 7.8 5.7 9.4 11.3 8.260-64 2.7 6.6 1.5 8.1 4.765-74 1.9 6.8 1.0 6.2 4.1Over 74 0.2 2.1 0.1 3.4 1.4
Total 100.0 100.0 100.0 100.0 100.0 Terminating Passengers (000s) 938 1,036 925 664 3,563Mean age (yrs) 40.5 39.9 40.6 41.1 40.5
Note: Excludes interviews where passengers have not answered all relevent core questions
152

Table 21.9Age distribution of UK and foreign passengers at Luton Airport in 2014.
UK Foreign GrandAge Business Leisure Business Leisure Total
% % % % %
02-10 0.2 5.9 0.0 2.5 4.411-15 0.0 2.9 0.1 2.5 2.416-19 0.2 2.2 0.2 5.1 2.420-24 2.7 6.9 5.4 13.0 7.525-34 18.0 21.2 30.1 23.6 21.735-44 31.7 15.9 28.1 12.5 17.745-54 29.0 15.5 25.8 13.1 17.255-59 10.5 8.4 4.5 8.0 8.460-64 4.6 7.4 3.2 8.5 7.165-74 2.3 11.3 2.2 9.2 9.4Over 74 0.8 2.2 0.3 1.9 1.9
Total 100.0 100.0 100.0 100.0 100.0 Terminating Passengers (000s) 1,182 6,686 506 1,864 10,239Mean age (yrs) 43.9 41.9 40.3 40.4 41.8
Note: Excludes interviews where passengers have not answered all relevent core questions
153

Table 21.10Age distribution of UK and foreign passengers at Manchester Airport in 2014.
UK Foreign GrandAge Business Leisure Business Leisure Total
% % % % %
02-10 0.0 1.3 0.2 0.5 1.011-15 0.0 1.1 0.0 1.0 0.916-19 0.4 2.8 1.0 4.3 2.620-24 3.2 9.4 4.1 12.9 8.825-34 16.3 15.0 19.6 20.9 16.135-44 28.2 14.3 30.7 14.7 16.945-54 34.7 21.5 31.1 20.6 23.555-59 10.4 11.5 8.0 9.4 10.960-64 4.9 9.6 3.5 7.5 8.565-74 1.9 10.7 1.6 7.0 8.7Over 74 0.1 2.9 0.1 1.2 2.2
Total 100.0 100.0 100.0 100.0 100.0 Terminating Passengers (000s) 2,547 14,685 1,102 2,609 20,944Mean age (yrs) 44.2 45.7 42.4 41.7 44.9
Note: Excludes interviews where passengers have not answered all relevent core questions
154

Table 21.11Age distribution of UK and foreign passengers at Stansted Airport in 2014.
UK Foreign GrandAge Business Leisure Business Leisure Total
% % % % %
02-10 0.0 1.3 0.0 1.3 1.111-15 0.0 1.4 0.0 1.7 1.316-19 0.8 3.7 1.2 4.3 3.520-24 4.8 15.1 7.9 19.1 15.025-34 24.4 30.3 29.2 31.0 29.935-44 25.2 15.1 26.5 15.2 16.745-54 29.7 12.7 26.1 10.4 14.455-59 8.1 6.0 6.0 4.8 5.960-64 4.3 5.5 1.3 5.0 5.065-74 2.2 7.0 1.6 6.1 5.9Over 74 0.3 1.9 0.1 1.0 1.4
Total 100.0 100.0 100.0 100.0 100.0 Terminating Passengers (000s) 1,673 9,758 1,211 6,474 19,116Mean age (yrs) 42.2 38.6 39.4 36.5 38.3
Note: Excludes interviews where passengers have not answered all relevent core questions
155