ca markov modeling of land use land cover dynamics …€¦ · ca markov modeling of land use land...
TRANSCRIPT

CA MARKOV MODELING OF LAND USE LAND COVER DYNAMICS AND SENSITIVITY ANALYSIS TO IDENTIFY SENSITIVE PARAMETER(S)
M. Surabuddin Mondal¹*, N. Sharma², M. Kappas¹, P. K. Garg³
¹Dept. of Cartography, GIS & Remote Sensing, Institute of Geography, Georg-August University, Gottingen, Germany – [email protected], [email protected]
²Dept. of W R D & M, Indian Institute of Technology, Roorkee – 247667, India - [email protected] ³Dept. of Civil (Geomatics) Engineering, Indian Institute of Technology, Roorkee – 247667, India - [email protected]
KEY WORDS: Cellular Automata Markov modeling, evidence likelihood map, land use land cover change prediction, validation, sensitivity analysis, sensitive parameter(s).
ABSTRACT: An attempt has been made to explore, evaluate and identify the sensitive parameter(s) of Cellular Automata Markov chain modeling to monitor and predict the future land use land cover pattern scenario in a part of Brahmaputra River Basin, India. For this purpose, land use land cover maps derived from satellite images of Landsat MSS image of 1987 and Landsat TM image of 1997 were used to predict future land use land cover of 2007 using Cellular Automata Markov model. Sensitivity analysis has been carried out to identify the land use land cover parameter(s), which have the highest, lowest or intermediate influence on predicted results. The validity of the Cellular Automata Markov process for projecting future land use and cover changes in the study area calculates various Kappa Indices of Agreement (Kstandard) which indicate how well the comparison map agrees and disagrees with the reference map (land use land cover map derived from IRS-P6 LISS III image of 2007). The results shows that the land with or without scrub appeared to be most sensitive parameter as it has highest influences on predicted results of land use land cover of 2007. The second most sensitive parameter was lakes / reservoirs / ponds to predict land use land cover of 2007, followed by river, agricultural crop land, plantation, open land, marshy / swampy, sandy area, aquatic vegetation, built up land, dense forest, degraded forest, waterlogged area and agricultural fallow land. The least sensitive parameter is agricultural fallow land, which has minimum influence on predicted results of land use land cover of 2007. The validation of CA Markov land use land cover prediction results shows Kstandard is 0.7928.
1. INTRODUCTION
Markov chain analysis is a convenient tool for modeling land use and land cover change (LULCC) when changes and processing in the land use land cover (LULC) are difficult to describe. A markovian process is simply one in which the future state of a system can be modeled purely on the basis of the immediately preceding state. Markov chain analysis will describe LULC from one period to another and will use this as the basis to project future changes. This is accomplished by developing a transition probability matrix of land use and land cover change from time one to time two, which will be the basis for projecting to a later time periods. The central mechanism of a Markov chain is a probability function which refers to the likelihood of transition from one cover to another cover. The probability function can be static over time or can be adjusted at specific intervals to account for changes in the stationary of the processes controlling the transition sequences. The probability function and transition sequences can be derived from direct observations using satellite data. The primary limitations of Markov transition probability-based models for land use and land cover change analysis are: (1) the assumption of stationary in the transition matrix i.e., that it is constant in time and space; (2) the assumption spatial independence of transitions; and (3) the difficulty of ascribing causality within the model, i.e. the transition probabilities are often derived empirically from multi-temporal maps with no description of the process (Baker, 1989). The third limitation assumes greater significance in the context of land cover change studies from remotely-sensed images, and when those changes are driven by economic and social processes. To address the above limitations 1 and 3, Baker
(1989) suggested setting state transition probabilities as a function of exogenous or endogenous variables, which vary in space and time. These models have been used in various case studies to account for changes in the rate of LULC conversion under constraints. Sensitivity analysis is the act of determining the changes in model behaviour due to a predetermined adjustment of model parameters. A sensitivity analysis can be carried out to find out which parameters had the largest influence on the model prediction results and vice-versa. Jetten et al., (1998) showed that the sensitivity to certain parameters might depend on the level of other parameters. Thus model sensitivity can be more completely evaluated by changing the combinations of parameters. Nonetheless, a simple sensitivity analysis in which only one parameter value is changed at a time is the easiest way to determine which individual parameter will be most important (Hessel, 2002). Therefore, simulations were carried out by uniformly excluding one parameter from all the parameters for this study. 2. CA MARKOV MODEL TO PREDICT LAND USE LAND COVER (LULC)
In this study, the spatio-temporal CA (Cellular Automata) Markov model of landscape change using multi-temporal LANDSAT TM and IRS LISS III imagery has been used which enabled us to predict spatial pattern of future land use land cover for the study area - Kamrup Metropolitan district of Assam state in India (Figure 1). For this purpose, land use land cover maps of the study area have been extracted from multi temporal satellite images of LANDSAT - 5 TM image acquired on December 26, 1987, IRS-1C LISS III image acquired on March 5, 1997, IRS-P6 LISS III image acquired on 14th
The International Archives of the Photogrammetry, Remote Sensing and Spatial Information Sciences, Volume XLII-2/W13, 2019 ISPRS Geospatial Week 2019, 10–14 June 2019, Enschede, The Netherlands
This contribution has been peer-reviewed. https://doi.org/10.5194/isprs-archives-XLII-2-W13-723-2019 | © Authors 2019. CC BY 4.0 License.
723

December of 2007 digitally classified for land use land cover mapping (Figure 2). Land use land cover (LULC) maps derived from satellite images of 1987 and 1997 were used to predict future land use land cover of 2007. The CA Markov model simulated for an especial study area which covered a large proportion by urban landscape with or surrounding by others 13 classes of LULC. The CA model, coupled with the Markov transition probability, has indicated the capability of trend projection for landscape change. This spatio-temporal model provided not only the quantitative description of change in the past but also the direction and magnitude of change in the future.
Figure 1: Location and satellite images of study area
Figure 2: Classified Land Use Land Cover Map of 1987, 1997
and 2007
2.1 Markov chain – transition probability matrix
The transition probability matrix has been calculated for the time period of 1987-1997 for the prediction LULC of 2007. The expected probability of transition of LULC category is displayed in Table 1. The transition probability matrix is the cross tabulation of the two images (1987 and 1997), that each LULC category will change to every other category. The transition probability areas matrix records the number of pixels that are expected to change over the specified of time. Here, the row represents the 1987 LULC categories and the columns represent the 1997 categories.
2.2 Preparation of suitability map (evidence likelihood map) and calibration of the CA Markov model
According to the underlying land use and land cover change dynamics between years 1987 and 1997, a series of suitability maps (evidence likelihood map) consisting of built up land suitability, agricultural crop land suitability, agricultural fallow land suitability, plantation suitability, dense forest land suitability, degraded forest land suitability, land with or without scrub suitability, marshy / swampy land suitability, waterlogged area suitability, sandy area suitability, river suitability, lakes/reservoirs/ponds suitability, open land suitability, aquatic vegetation land suitability were standardized between 0 and 255 (Figure 3). The production of these images although empirically derived, follows the same procedures of decision making exercise of multi-criteria evaluation (MCE). It was created by determining the relative frequency with which different LULC categories occurred within the areas from 1987 to 1997. The number thus expresses the likelihood of finding the LULC at the pixel in question, if this lies in transition area. These images (evidence likelihood maps) are calculated as projections from the later date image (1997) of two input LULC images (before image 1987 and later image 1997). The output images are the conditional probability images. This conditional probability images report the probability that each LULC type would be found at each pixel in future after the specified time. The procedure looks at the relative frequency of pixels belonging to the different categories of that variable within areas of change. In effect, it asks the question of each category of the variable, "How likely is it that you would have a value like this if you was an area that would experience change?” (Eastman et al., 2010). To project land use and land cover change for next 10 year using known LULC of 1987 and 1997, probability statistics for land use and land cover change for 2007 has been generated through cross tabulation of two LULC maps. Thus, CA Markov model combines both the concepts of Markov chain procedure and CA filters, after getting Markov transition probability, CA Markov used the transition probability matrix and probability images (here, suitability / evidence likelihood map) to predict the LULC over a 10 years period i.e., 2007 (Figure 4 ). The total numbers of iterations are based on the number of time steps, for 10 years model will choose to complete run in 10 iterations.
Figure 3: Suitability (evidence likelihood) map used to predict
future LULC
The International Archives of the Photogrammetry, Remote Sensing and Spatial Information Sciences, Volume XLII-2/W13, 2019 ISPRS Geospatial Week 2019, 10–14 June 2019, Enschede, The Netherlands
This contribution has been peer-reviewed. https://doi.org/10.5194/isprs-archives-XLII-2-W13-723-2019 | © Authors 2019. CC BY 4.0 License.
724

Figure 4: Predicted LULC of 2007 using 1987 & 1997 LULC image
3. CA MARKOV LULC PREDICTIONS AND
SENSITIVITY ANALYSIS
Sensitivity analysis can identify the parameter(s), which have most to least influences on land use and land cover prediction results. Sensitivity analysis was performed on the differences between the predicted LULC of 2007 (using 1987 & 1997 LULC image) and LULC derived from LISS III image of 2007, to identify the most sensitive parameters of the model. According to the underlying land use and land cover change dynamics between years 1987 and 1997, a series of maps (evidence likelihood map) consisting of built up land suitability, agricultural crop land suitability, agricultural fallow land suitability, plantation suitability, dense forest land suitability, degraded forest land suitability, land with or without scrub suitability, marshy / swampy land suitability, waterlogged area suitability, sandy area suitability, river suitability, lakes/reservoirs/ponds suitability, open land suitability, aquatic vegetation land suitability maps were used to predict 2007 land use and land cover. The output suitability maps actually are the conditional probability images that report the probability that each LULC type is found at each pixel in predicted map. The transition probability matrix of 1987-1997 and probability images (here, suitability / evidence likelihood map) were used in CA Markov model to predict the LULC over a 10 years period i.e., 2007 (Figure 3). This transition probability matrix will determine how much land is allocated to each LULC category over a 10 year period. To predict LULC of 2007, all 14 suitability / evidence likelihood maps (probability images) were used to calibrate the CA Markov model. But to identify the sensitivity of above parameters (those used in CA Markov model), the CA Markov model calibrated 14 times for 14 parameters, and in every calibration one parameter (one suitability / evidence likelihood map) has been excluded in CA Markov model calibration to identify the sensitivity of a particular parameter to predict the results. For example, the CA Markov model was calibrated without built up land sensitivity map to identify the sensitivity of built up land. Similarly, the CA Markov model was calibrated without agricultural crop land suitability map to identify the sensitivity of agricultural crop land. This procedure was followed for every other parameter (i.e., agricultural fallow land, plantation, dense forest land, degraded forest land, land with or without scrub, marshy / swampy land, waterlogged area, sandy area, river, lakes/reservoirs/ponds, open land, aquatic vegetation land) (Table 1). These predicted LULC of 2007 were correlated with redicted LULC of 2007 using all parameters / suitability or
evidence likelihood maps and the correlation coefficient (r) value arranged in descending order. The least and most ‘r’ values determine the most and least sensitive parameter(s), respectively. 3.1 Sensitivity of Different Parameter(s)
3.1.1. Sensitivity of different parameter(s) in predicting quantity The area statistics of predicted LULC results of 2007 using all parameters & area of predicted LULC of 2007 using all parameters except one parameter are shows in Table 1. When we look at the predicted LULC of 2007 area statistics derived by using all parameters and using all parameters except any one parameter, the predicted area statistics are more or less same because the same transition probability matrix of 1987-1997 is determined how much land is allocated to each LULC category over 10 year’s period in every calibration of CA Markov model for all parameters. Relative difference in predicted LULC of 2007 using all parameters and predicted LULC of 2007 using all parameters except any one parameter ranges between (+) 10.23 km² and (-) 0.07 km² only (Table 1). The correlation between predicted LULC of 2007 using all parameters except any one parameter and predicted LULC of 2007 using all parameters is strong, where r = 0.994 and R² = 0.988. As expected, that predicted LULC of 2007 using all parameters and predicted LULC of 2007 using all parameters except any one parameter are strongly correlated. 3.1.2. Sensitivity of different parameter(s) in predicting
locations
Predicting locations of LULC of 2007 using all parameters are shows in Figure 5 and predicted locations of LULC of 2007 using Scenario A, B, C, D, E, F, G, H, I, J, K, L, M, N are shows in Figure 6.II.a, Figure 7.b, Figure 6.II.c, Figure 6.II.d, Figure 6.II.e, Figure 6.II.f, Figure 6.II.g, Figure 6.II.h, Figure 6.II.i, Figure 6.II.j, Figure 6.II.k, Figure 6.II.l, Figure 6.II.m and Figure 6.II.n, respectively. Regression analysis of 14 pairs of images (Combination A, B, C, D, E, F, G, H, I, J, K, L, M, N) was carried out for the establishment of spatial relationship amongst them (Appendix 1). Correlation coefficient (r) and coefficient of determination (R²) between predicted LULC of 2007 using all parameters and predicted LULC of 2007 using all parameters except any one parameter are shows in Appendix 1. When we look at the area statistics of predicted LULC of 2007 simulated using all suitability maps and predicted LULC of 2007 simulated using all parameters except any one parameter (any one suitability map), these are more or less the same. But, spatially these are different. The correlation between predicted LULC of 2007 using all parameters and predicted location of LULC of 2007 using all parameters except any one parameter established that they are spatially different.
Figure 5: Predicted LULC of 2007 using all parameters / all
suitibility maps
The International Archives of the Photogrammetry, Remote Sensing and Spatial Information Sciences, Volume XLII-2/W13, 2019 ISPRS Geospatial Week 2019, 10–14 June 2019, Enschede, The Netherlands
This contribution has been peer-reviewed. https://doi.org/10.5194/isprs-archives-XLII-2-W13-723-2019 | © Authors 2019. CC BY 4.0 License.
725
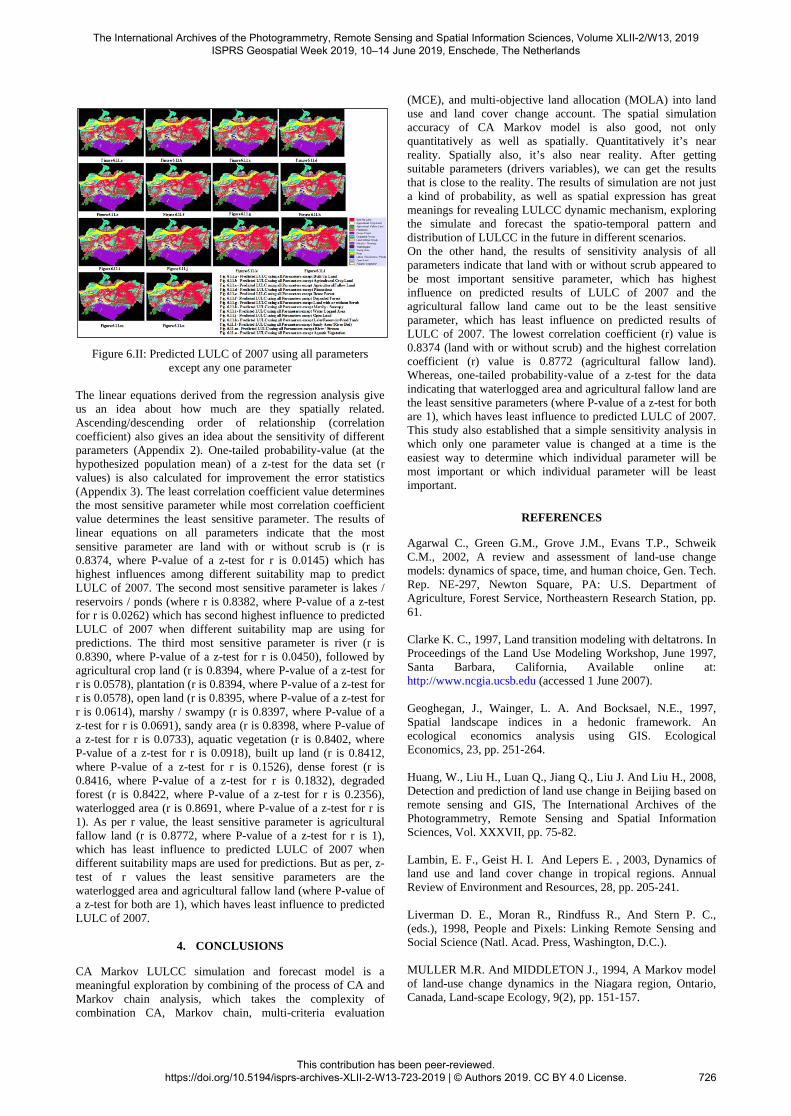
Figure 6.II: Predicted LULC of 2007 using all parameters
except any one parameter
The linear equations derived from the regression analysis give us an idea about how much are they spatially related. Ascending/descending order of relationship (correlation coefficient) also gives an idea about the sensitivity of different parameters (Appendix 2). One-tailed probability-value (at the hypothesized population mean) of a z-test for the data set (r values) is also calculated for improvement the error statistics (Appendix 3). The least correlation coefficient value determines the most sensitive parameter while most correlation coefficient value determines the least sensitive parameter. The results of linear equations on all parameters indicate that the most sensitive parameter are land with or without scrub is (r is 0.8374, where P-value of a z-test for r is 0.0145) which has highest influences among different suitability map to predict LULC of 2007. The second most sensitive parameter is lakes / reservoirs / ponds (where r is 0.8382, where P-value of a z-test for r is 0.0262) which has second highest influence to predicted LULC of 2007 when different suitability map are using for predictions. The third most sensitive parameter is river (r is 0.8390, where P-value of a z-test for r is 0.0450), followed by agricultural crop land (r is 0.8394, where P-value of a z-test for r is 0.0578), plantation (r is 0.8394, where P-value of a z-test for r is 0.0578), open land (r is 0.8395, where P-value of a z-test for r is 0.0614), marshy / swampy (r is 0.8397, where P-value of a z-test for r is 0.0691), sandy area (r is 0.8398, where P-value of a z-test for r is 0.0733), aquatic vegetation (r is 0.8402, where P-value of a z-test for r is 0.0918), built up land (r is 0.8412, where P-value of a z-test for r is 0.1526), dense forest (r is 0.8416, where P-value of a z-test for r is 0.1832), degraded forest (r is 0.8422, where P-value of a z-test for r is 0.2356), waterlogged area (r is 0.8691, where P-value of a z-test for r is 1). As per r value, the least sensitive parameter is agricultural fallow land (r is 0.8772, where P-value of a z-test for r is 1), which has least influence to predicted LULC of 2007 when different suitability maps are used for predictions. But as per, z-test of r values the least sensitive parameters are the waterlogged area and agricultural fallow land (where P-value of a z-test for both are 1), which haves least influence to predicted LULC of 2007.
4. CONCLUSIONS
CA Markov LULCC simulation and forecast model is a meaningful exploration by combining of the process of CA and Markov chain analysis, which takes the complexity of combination CA, Markov chain, multi-criteria evaluation
(MCE), and multi-objective land allocation (MOLA) into land use and land cover change account. The spatial simulation accuracy of CA Markov model is also good, not only quantitatively as well as spatially. Quantitatively it’s near reality. Spatially also, it’s also near reality. After getting suitable parameters (drivers variables), we can get the results that is close to the reality. The results of simulation are not just a kind of probability, as well as spatial expression has great meanings for revealing LULCC dynamic mechanism, exploring the simulate and forecast the spatio-temporal pattern and distribution of LULCC in the future in different scenarios. On the other hand, the results of sensitivity analysis of all parameters indicate that land with or without scrub appeared to be most important sensitive parameter, which has highest influence on predicted results of LULC of 2007 and the agricultural fallow land came out to be the least sensitive parameter, which has least influence on predicted results of LULC of 2007. The lowest correlation coefficient (r) value is 0.8374 (land with or without scrub) and the highest correlation coefficient (r) value is 0.8772 (agricultural fallow land). Whereas, one-tailed probability-value of a z-test for the data indicating that waterlogged area and agricultural fallow land are the least sensitive parameters (where P-value of a z-test for both are 1), which haves least influence to predicted LULC of 2007. This study also established that a simple sensitivity analysis in which only one parameter value is changed at a time is the easiest way to determine which individual parameter will be most important or which individual parameter will be least important.
REFERENCES
Agarwal C., Green G.M., Grove J.M., Evans T.P., Schweik C.M., 2002, A review and assessment of land-use change models: dynamics of space, time, and human choice, Gen. Tech. Rep. NE-297, Newton Square, PA: U.S. Department of Agriculture, Forest Service, Northeastern Research Station, pp. 61. Clarke K. C., 1997, Land transition modeling with deltatrons. In Proceedings of the Land Use Modeling Workshop, June 1997, Santa Barbara, California, Available online at: http://www.ncgia.ucsb.edu (accessed 1 June 2007). Geoghegan, J., Wainger, L. A. And Bocksael, N.E., 1997, Spatial landscape indices in a hedonic framework. An ecological economics analysis using GIS. Ecological Economics, 23, pp. 251-264. Huang, W., Liu H., Luan Q., Jiang Q., Liu J. And Liu H., 2008, Detection and prediction of land use change in Beijing based on remote sensing and GIS, The International Archives of the Photogrammetry, Remote Sensing and Spatial Information Sciences, Vol. XXXVII, pp. 75-82. Lambin, E. F., Geist H. I. And Lepers E. , 2003, Dynamics of land use and land cover change in tropical regions. Annual Review of Environment and Resources, 28, pp. 205-241. Liverman D. E., Moran R., Rindfuss R., And Stern P. C., (eds.), 1998, People and Pixels: Linking Remote Sensing and Social Science (Natl. Acad. Press, Washington, D.C.). MULLER M.R. And MIDDLETON J., 1994, A Markov model of land-use change dynamics in the Niagara region, Ontario, Canada, Land-scape Ecology, 9(2), pp. 151-157.
The International Archives of the Photogrammetry, Remote Sensing and Spatial Information Sciences, Volume XLII-2/W13, 2019 ISPRS Geospatial Week 2019, 10–14 June 2019, Enschede, The Netherlands
This contribution has been peer-reviewed. https://doi.org/10.5194/isprs-archives-XLII-2-W13-723-2019 | © Authors 2019. CC BY 4.0 License.
726

Appendix 1: Relationship between predicted LULC of 2007 using all parameters & predicted LULC of 2007 using all parameters
except any one parameter
Sl. no.
Combination Image Pairs r R²
1 A Predicted LULC of 2007 using all parameters and Predicted LULC of 2007 using all parameters except built up land 0.8412 0.7075
2 B Predicted LULC of 2007 using all parameters and Predicted LULC of 2007 using all parameters except agricultural crop land 0.8394 0.7046
3 C Predicted LULC of 2007 using all parameters and Predicted LULC of 2007 using all parameters except agricultural fallow land; 0.8772 0.7694
4 D Predicted LULC of 2007 using all parameters and predicted LULC of 2007 using all parameters except plantation 0.8394 0.7046
5 E Predicted LULC of 2007 using all parameters and Predicted LULC of 2007 using all parameters except dense forest land; 0.8416 0.7083
6 F Predicted LULC of 2007 using all parameters and Predicted LULC of 2007 using all parameters except degraded forest land; 0.8422 0.7092
7 G Predicted LULC of 2007 using all parameters and Predicted LULC of 2007 using all parameters except land with or without scrub; 0.8374 0.7012
8 H Predicted LULC of 2007 using all parameters and Predicted LULC of 2007 using all parameters except marshy / swampy land; 0.8397 0.7051
9 I Predicted LULC of 2007 using all parameters and Predicted LULC of 2007 using all parameters except waterlogged area 0.8691 0.7554
10 J Predicted LULC of 2007 using all parameters and Predicted LULC of 2007 using all parameters except sandy area 0.8398 0.7053
11 K Predicted LULC of 2007 using all parameters and Predicted LULC of 2007 using all parameters except river 0.8390 0.7040
12 L Predicted LULC of 2007 using all parameters and Predicted LULC of 2007 using all parameters except lakes/reservoirs/ponds 0.8382 0.7026
13 M Predicted LULC of 2007 using all parameters and Predicted LULC of 2007 using all parameters except open land; 0.8395 0.7048
14 N Predicted LULC of 2007 using all parameters and Predicted LULC of 2007 using all parameters except aquatic vegetation land 0.8402 0.7059
The International Archives of the Photogrammetry, Remote Sensing and Spatial Information Sciences, Volume XLII-2/W13, 2019 ISPRS Geospatial Week 2019, 10–14 June 2019, Enschede, The Netherlands
This contribution has been peer-reviewed. https://doi.org/10.5194/isprs-archives-XLII-2-W13-723-2019 | © Authors 2019. CC BY 4.0 License.
727

Appendix 2: Ranking (descending order) of relationship between predicted LULC of 2007 using all parameters and predicted LULC of 2007 using all parameters except any one parameter
Sl no. Image Pairs r One-tailed P-
value of a z-test
(for r value)
R² One-tailed P-value of
a z-test (for R² value)
1
Predicted LULC of 2007 using all parameters and Predicted LULC of 2007 using all parameters except land with or without scrub 0.8374 0.0145 0.7012 0.0149
2
Predicted LULC of 2007 using all parameters and Predicted LULC of 2007 using all parameters except lakes / reservoirs / ponds 0.8382 0.0262 0.7026 0.0271
3
Predicted LULC of 2007 using all parameters and predicted LULC of 2007 using all parameters except river 0.8390 0.0450 0.7040 0.0469
4
Predicted LULC of 2007 using all parameters and Predicted LULC of 2007 using all parameters except agricultural crop land 0.8394 0.0578 0.7046 0.0583
5
Predicted LULC of 2007 using all parameters and Predicted LULC of 2007 using all parameters except plantation 0.8394 0.0578 0.7046 0.0583
6
Predicted LULC of 2007 using all parameters and Predicted LULC of 2007 using all parameters except open land 0.8395 0.0614 0.7048 0.0626
7
Predicted LULC of 2007 using all parameters and Predicted LULC of 2007 using all parameters except marshy / swampy 0.8397 0.0691 0.7051 0.0694
8
Predicted LULC of 2007 using all parameters and Predicted LULC of 2007 using all parameters except sandy area 0.8398 0.0733 0.7053 0.0743
9
Predicted LULC of 2007 using all parameters and Predicted LULC of 2007 using all parameters except aquatic vegetation 0.8402 0.0918 0.7059 0.0905
10
Predicted LULC of 2007 using all parameters and Predicted LULC of 2007 using all parameters except built up land 0.8412 0.1526 0.7075 0.1461
11
Predicted LULC of 2007 using all parameters and Predicted LULC of 2007 using all parameters except dense forest 0.8416 0.1832 0.7083 0.1811
12
Predicted LULC of 2007 using all parameters and Predicted LULC of 2007 using all parameters except degraded forest 0.8422 0.2356 0.7092 0.2264
13
Predicted LULC of 2007 using all parameters and Predicted LULC of 2007 using all parameters except waterlogged area 0.8691 1 0.7554 1
14
Predicted LULC of 2007 using all parameters and Predicted LULC of 2007 using all parameters except agricultural fallow land 0.8772 1 0.7694 1
The International Archives of the Photogrammetry, Remote Sensing and Spatial Information Sciences, Volume XLII-2/W13, 2019 ISPRS Geospatial Week 2019, 10–14 June 2019, Enschede, The Netherlands
This contribution has been peer-reviewed. https://doi.org/10.5194/isprs-archives-XLII-2-W13-723-2019 | © Authors 2019. CC BY 4.0 License.
728

Appendix 3: Ranking (descending order) of relationship between predicted LULC of 2007 using all parameters and predicted LULC of 2007 using all parameters except any one parameter
Sl no. Image Pairs r One-tailed P-
value of a z-test
(for r value)
R² One-tailed P-value of
a z-test (for R² value)
1
Predicted LULC of 2007 using all parameters and Predicted LULC of 2007 using all parameters except land with or without scrub 0.8374 0.0145 0.7012 0.0149
2
Predicted LULC of 2007 using all parameters and Predicted LULC of 2007 using all parameters except lakes / reservoirs / ponds 0.8382 0.0262 0.7026 0.0271
3
Predicted LULC of 2007 using all parameters and predicted LULC of 2007 using all parameters except river 0.8390 0.0450 0.7040 0.0469
4
Predicted LULC of 2007 using all parameters and Predicted LULC of 2007 using all parameters except agricultural crop land 0.8394 0.0578 0.7046 0.0583
5
Predicted LULC of 2007 using all parameters and Predicted LULC of 2007 using all parameters except plantation 0.8394 0.0578 0.7046 0.0583
6
Predicted LULC of 2007 using all parameters and Predicted LULC of 2007 using all parameters except open land 0.8395 0.0614 0.7048 0.0626
7
Predicted LULC of 2007 using all parameters and Predicted LULC of 2007 using all parameters except marshy / swampy 0.8397 0.0691 0.7051 0.0694
8
Predicted LULC of 2007 using all parameters and Predicted LULC of 2007 using all parameters except sandy area 0.8398 0.0733 0.7053 0.0743
9
Predicted LULC of 2007 using all parameters and Predicted LULC of 2007 using all parameters except aquatic vegetation 0.8402 0.0918 0.7059 0.0905
10
Predicted LULC of 2007 using all parameters and Predicted LULC of 2007 using all parameters except built up land 0.8412 0.1526 0.7075 0.1461
11
Predicted LULC of 2007 using all parameters and Predicted LULC of 2007 using all parameters except dense forest 0.8416 0.1832 0.7083 0.1811
12
Predicted LULC of 2007 using all parameters and Predicted LULC of 2007 using all parameters except degraded forest 0.8422 0.2356 0.7092 0.2264
13
Predicted LULC of 2007 using all parameters and Predicted LULC of 2007 using all parameters except waterlogged area 0.8691 1 0.7554 1
14
Predicted LULC of 2007 using all parameters and Predicted LULC of 2007 using all parameters except agricultural fallow land 0.8772 1 0.7694 1
The International Archives of the Photogrammetry, Remote Sensing and Spatial Information Sciences, Volume XLII-2/W13, 2019 ISPRS Geospatial Week 2019, 10–14 June 2019, Enschede, The Netherlands
This contribution has been peer-reviewed. https://doi.org/10.5194/isprs-archives-XLII-2-W13-723-2019 | © Authors 2019. CC BY 4.0 License.
729