ca fy2016 state highway annual report
TRANSCRIPT


2016ANNUAL REPORT
Edmund G. Brown Jr.Governor
State of California
Brian P. KellySecretary
California State Transportation Agency
Rhonda L. CraftDirector
Office of Traffic Safety


ANNUAL REPORTFederal Fiscal Year 2016 (FFY 2016)
Prepared By
California Office of Traffic Safety
Rhonda L. Craft ...............................................................................................Director
Randy Weissman ...............................................................Chief Deputy, Operations
Karen Coyle .................................................................Assistant Director, Operations
David Doucette ...........................................................Assistant Director, Operations
Chris Cochran ...................................... Assistant Director, Marketing & Public Affairs
Robert Nelson .........................................................Assistant Director, Administration
Carolyn Vu ...........................................................................Senior Accounting Officer
Donna Black ................................................................................... Program Manager
Whitney Braziel ..........................................................................Program Coordinator
Marco Coelho .............................................................................Program Coordinator
Judy Dancy ................................................................................Program Coordinator
Matt DeMelo ...............................................................................Program Coordinator
Ron Miller ...................................................................................Program Coordinator
Jim Owens..................................................................................Program Coordinator
Meghan Pham ............................................................................Program Coordinator
Julie Schilling ............................................................................Program Coordinator
Adrienne Tackley .......................................................................Program Coordinator
Mark Talan ..................................................................................Program Coordinator
Mitch Zehnder ............................................................................Program Coordinator
William Ehart .......................................................................Law Enforcement Liaison
Wayne Ziese ........................................................................Law Enforcement Liaison

TABLE OF CONTENTS
California Office of Traffic Safety ...................................................1
• Vision • Mission • Funding • FFY 2016 Allocated Funds
California’s Fatality Report ..............................................................3
Areas of Concentration ....................................................................4
FFY 2016 Project Distribution .........................................................6
Traffic Safety Core Performance Measures ...................................9
Additional Traffic Safety Performance Measures ........................19
Statewide Traffic Safety Intercept Survey ....................................22
Evidence-Based Enforcement Program .......................................25
Projects Not Implemented .............................................................25
Program Goals, Results, and Activities .......................................26
Program Area Highlights ...............................................................37
Appendix – Grant Expenditures ....................................................48

1 California Office of Traffic Safety
CALIFORNIA OFFICE OF TRAFFIC SAFETY
VISION
SAVING LIVESTHROUGH TRAFFIC SAFETY EFFORTS
We believe that saving lives on California roadways calls for more than just a reduction in fatalities. Our vision is to eliminate traffic fatalities altogether. Every one fatality counts,
every one is one too many.
MISSIONTo effectively and efficiently administer traffic safety grants while fostering partnerships to
deliver innovative programs that reduce traffic deaths, injuries, and economic losses.
VALUES
• Trust
• Integrity
• Innovation
• Respect
• Excellence
• Service

22016 Annual Report
CALIFORNIA OFFICE OF TRAFFIC SAFETY
HOW CALIFORNIA RECEIVES FUNDING
The highway safety program is a partnership effort between the National Highway Traffic Safety Administration (NHTSA) and California. The partnership was created when Congress passed the Highway Safety Act of 1966. OTS is designated by the Governor to receive federal traffic safety funds for coordinating California’s highway safety programs. Each year OTS develops a Highway Safety Plan (HSP) identifying the key highway safety problems in the state and the most effective countermeasures to address them. OTS then solicits proposals statewide to address the identified problems. Finally, available funds are allocated to state and local governmental agencies to implement traffic safety programs and grants. The grants support planning to identify highway safety problems, provide start up “seed” money for new programs, and give new direction to existing safety programs. The funds are intended to create and help sustain innovative programs at the state and local level, and leverage commitments of state, local, and private resources.
This Annual Report (AR), required by NHTSA (23 CFR Part 1300), California Vehicle Code (Section 2905), and the Fixing America’s Surface Transportation (FAST) Act provides an update of traffic safety grants active throughout the State of California as approved in the 2016 California HSP.
FFY 2016 GRANTSBY PROGRAM AREA
$96,585,704
!
ALCOHOL-IMPAIRED DRIVING
$21,834,357
OCCUPANT PROTECTION $3,922,806
DISTRACTED DRIVING $1,225,000 PEDESTRIAN & BICYCLE
SAFETY $4,077,943
DRUG-IMPAIRED DRIVING $12,384,237
PLANNING & ADMINISTRATION
$8,999,476
EMERGENCY MEDICAL SERVICES $340,500
POLICE TRAFFIC SERVICES $37,541,045
MOTORCYCLE SAFETY $773,343
TRAFFIC RECORDS $5,486,997

3 California Office of Traffic Safety
FATALITY REPORT
NATIONALNationally, traffic fatalities increased 7.2 percent – from 32,744 fatalities in 2014 to 35,092 fatalities in 2015. For the first half of 2016, traffic fatalities are estimated at 17,775. This represents an increase of about 10.4 percent as compared to the 16,100 fatalities reported in the first half of 2015.
Some experts contribute the increase to an improvement in the economy and more people driving, as well as a decrease in law enforcement resources throughout the nation. Many of these traffic fatalities include pedestrians and motorcyclists, distracted and impaired drivers, as well as occupants of large trucks.
Traffic fatalities are a public health and safety concern. No matter the reason for the increase in fatalities, strategies must be identified to address these issues. Although California’s mileage death rate is below the national average, the California OTS will continue to work with federal, state, and local partners to change unsafe driving behaviors and to raise awareness around strategies that save lives. With the passage of the FAST Act, Highway Safety Offices around the country are optimistic about the increase of funding to the general safety fund. This will allow states greater funding flexibility to implement traffic safety initiatives that better address problem areas.
CALIFORNIATOTAL FATALITIESTraffic fatalities increased 2.4 percent from 3,102 in 2014 to 3,176 in 2015.
The 2014 mileage death rate (MDR) – fatalities per100 million miles traveled – is 0.93.*
ALCOHOL-IMPAIRED DRIVINGAlcohol-impaired driving fatalities (fatalities in crashes involving a driver or motorcycle rider (operator) with a blood alcohol concentration (BAC) of 0.08 grams per deciliter (g/dL) or higher) increased 4.3 percent from 876 in 2014 to 914 in 2015.
The alcohol-impaired driving fatality rate for 2014 is 0.26.* California’s rate is much better than the national average of 0.33. Of the five largest states in terms of total traffic fatalities, (CA, FL, TX, PA, and NC), California has the best rate.
As a percent of total fatalities, alcohol-impaired
driving fatalities increased from 28.2 percent in 2014 to 28.8 percent in 2015. This number has remained virtually unchanged in the past three years. California is better than the national average of 29.3 percent.
DRUG-IMPAIRED DRIVING In 2015, 19 percent of all drivers killed in motor vehicle crashes, who were tested, tested positive for legal and/ or illegal drugs.
OCCUPANT PROTECTIONThe percent of restrained passenger vehicle occupant fatalities (all seat positions) decreased from 67 percent in 2014 to 66 percent in 2015. California is much better than the national average of 52 percent. NHTSA estimates that 67 of the 544 known unrestrained fatalities in California would be alive today had they simply buckled up.
Passenger vehicle occupant fatalities (age 0-4) decreased 33.3 percent from 21 in 2014 to 14 in 2015.
MOTORCYCLE SAFETYMotorcycle fatalities decreased 11.5 percent from 522 in 2014 to 462 in 2015.
Motorcycle fatalities per 100,000 motorcycle registrations increased from 58 percent in 2013 to64 percent in 2014.*
The percentage of motorcycle operators killed with a BAC of 0.08 or greater decreased from 89 percent in 2014 to 56 percent in 2015.
The percentage of motorcycle operators killed that were improperly licensed remained the same at 32 percent in both 2014 and 2015.
TEEN SAFETYTeen motor vehicle fatalities (age 16-19) decreased5 percent from 222 in 2014 to 211 in 2015.
Teen driver fatalities (age 16-19) increased 2.2 percent from 92 in 2014 to 94 in 2015. Males make up 79 percent of teen driver fatalities.
PEDESTRIAN AND BICYCLE SAFETYPedestrian fatalities increased 4.7 percent from 709 in 2014 to 742 in 2015.
Pedestrian fatalities age 65 and older decreased6.5 percent from 185 in 2014 to 173 in 2015.
Bicycle fatalities remained the same at 129 in both 2014 and 2015.
*2015 Data not yet availableSource: Fatality Analysis Reporting System (FARS)

42016 Annual Report
AREAS OF CONCENTRATION
the-counter drugs that could cause driving impairment. More than 15 percent tested positive for illicit drugs, and more than 12 percent tested positive for THC (delta 9 tetrahydrocannabinol), which is afour percent increase from the 2007 survey. An additional 2009 NHTSA study tested fatally injured drivers and found that nationally 18 percent tested positive for at least one illicit, prescription, or over-the-counter drug. OTS grants have provided increased officer training in the NHTSA Advanced Roadside Impaired Driving Enforcement (ARIDE) and Drug Recognition Evaluator (DRE) programs, which has led to better detection of drug-impaired drivers. OTS grants also have funded vertical prosecution programs for drug-impaired driving cases, as well as crime laboratory equipment for improved and more efficient detection and confirmation of drugs in a driver’s system at the time of arrest.
EMERGENCY MEDICAL SERVICESTimely access to life-saving emergency medical services (EMS) is critical to the reduction of fatalities and serious injuries resulting from motor vehicle collisions. OTS provides grants for cost-effective programs that incorporate effective strategies for improving California’s EMS system’s ability to meet the needs of motor vehicle collision victims. OTS grants provide funding for life-saving equipment, training, reliable ambulance transportation, effective communications, public information, education, and access to data and evaluation tools.
MOTORCYCLE SAFETYMotorcycle safety stakeholders, including OTS, CHP, Department of Motor Vehicles (DMV), and other representatives of the SHSP Motorcycle Challenge Area, are moving forward with new actions in the effort to reduce motorcycle collisions, injuries, and fatalities. Activities include the offering of “refresher” riding courses to kick-off the “May is Motorcycle Safety Awareness Month” campaign, adding new information regarding DOT-compliant helmets and other personal protective equipment to the DMV Motorcycle Handbook, educating the public about the dangers of distracted driving and riding during the California Motorcyclist Safety Program (CMSP) rider training courses, and evaluating the effectiveness of California’s motorcycle rider training program. These and other efforts by California’s motorcycle safety stakeholders will continue to work toward improved safety for motorcyclists and other road users.
ALCOHOL-IMPAIRED DRIVINGAlcohol-related crashes represent a major threat to the safety and well being of the public. This is especially true among young people age 15 to 24, where impaired driving is the leading cause of death. This program is intended to prevent people from driving under the influence (DUI) of alcohol and remove impaired drivers from the road. Alcohol-Impaired Driving programs use a comprehensive approach that incorporates funding for education, prevention, and enforcement by focusing on high-risk groups. Grant programs include: interactive youth education; college campus programs; intensive public information campaigns; community organization involvement; equipment purchases including preliminary alcohol screening devices, portable evidential breath testing devices, and checkpoint trailers and enforcement operations including DUI warrant services, DUI probation revocation programs, sobriety checkpoints, and roving DUI enforcement patrols.
DISTRACTED DRIVINGIn 2014, 3,179 people were killed nationwide and an estimated 431,000 were injured in motor vehicle crashes involving a distracted driver. In July 2008, California passed SB 1613, prohibiting hand-held cell phone use while driving and in January 2009 a ban on texting while driving was passed. In September 2016, AB 1785 was signed into law prohibiting the use of hand-held devices by drivers for any purpose other than for emergency 911 calls. According to the 2016 OTS Statewide Intercept Opinion Survey, 77.6 percent of Californians stated that texting and talking on a cell phone are the most dangerous distractions for drivers on California roadways. The Strategic Highway Safety Plan (SHSP) Distracted Driving Challenge Area, co-led by OTS and California Highway Patrol (CHP), has developed action items to reduce this problem. Countermeasures include improved distracted driving data quality, increased and focused enforcement and adjudication, observational surveys, public awareness & education campaigns, and strengthening laws to include negligent operator points to change behavior.
DRUG-IMPAIRED DRIVINGAccording to the 2013-2014 NHTSA National Roadside Survey, 22.5 percent of weekend, nighttime drivers tested positive for illegal, prescription, or over-
States are encouraged to identify needs in each of the nationally designated program priority areas, but OTS has the flexibility to determine additional program areas, and the amount of funding allocated to each. The areas chosen for funding in FFY 2016 were as follows:

5 California Office of Traffic Safety
AREAS OF CONCENTRATION
OCCUPANT PROTECTIONIn spite of the great strides made, thousands of young people, from newborns through age 20, continue to die or experience serious injuries that could have been prevented had they been properly restrained in a child safety seat, booster seat, or safety belt. The most recent statewide seat belt survey, conducted in 2016, reports a 96.5 percent seat belt use rate. This represents 35.9 million persons wearing seat belts. However, the fact remains that 1,303,888 Californians are not utilizing restraint systems. Seat belt and child safety seat programs continue to focus on statewide and local public information campaigns, increased enforcement, and community education, outreach, and training. More specifically, the programs provide child safety seats to low-income families, conduct child safety seat check-ups, and educate teens about using seat belts.
PEDESTRIAN AND BICYCLE SAFETYThe goal of the Pedestrian and Bicycle Safety program is to reduce crash-related fatalities and injuries by promoting safe and effective conditions for those who travel by foot and bicycle. OTS provides funds for the development of programs to increase awareness of traffic rules, rights, and responsibilities for all age groups. At the elementary school level, parents and teachers are drawn into the programs as active role models and mentors in traffic safety. Activities include traffic safety rodeos and presentations in an effort to build students’ skills and demonstrate proper practical application of those skills. To boost compliance with the law and decrease injuries, safety helmets are properly fitted and distributed to children in need for use with bicycles, scooters, skateboards, and skates. There is a special emphasis on programs designed exclusively for the hard-to-reach population at the middle and high school levels. Additional outreach endeavors include programs targeting underserved populations, along with a multicultural approach to address safer driving and walking behaviors.
POLICE TRAFFIC SERVICESThe Police Traffic Services program focuses on a combination of education and enforcement activities. This program incorporates a comprehensive approach to traffic safety enforcement, with a focus on seatbelt use compliance, impaired driving reduction, speed enforcement, and other traffic safety laws. OTS grants in this area of concentration are highly effective in reducing traffic collisions by dedicating resources to selective enforcement and education. Under these programs, communities use available public and private assets to identify and combat significant traffic safety problems.
PUBLIC RELATIONS, ADVERTISINGAND MARKETINGThe driving forces behind OTS’s marketing and public relations programs are information, engagement and communication. First, OTS must engage the public’s interest, to bring them in and open them up to be receptive to communication. To OTS, “the public” can be school-aged children, young adults, adults and seniors of all demographic breakdowns. Public engagement is accomplished through multiple and continuous earned media, active outreach, paid media, and social media connections. After they are engaged, effectively communicating the importance of the life-saving benefits of traffic safety is paramount.
By first educating about traffic safety related issues, then raising public awareness of the real and serious dangers of problems, followed by social norming strategies, OTS is able to contribute a significant positive change in traffic safety behavior and culture over time. Through public awareness and social norming programs such as “Click It or Ticket,” “Drive Sober or Get Pulled Over,” “Buzzed Driving is Drunk Driving,” “DDVIP,” “Silence the Distraction,” and “Pedestrians Don’t Have Armor,” often conducted in conjunction with enhanced law enforcement at the local and state levels, this traffic safety mission was successfully accomplished.
OTS continues to be a primary resource for the public, researchers and the press for traffic safety information, best practices, statistics and linkage to other resources. The increase and expanding use of social media is allowing OTS to reach new members of targeted audiences. OTS currently has very successful and dynamic presences on Facebook and Twitter, with reaches into YouTube and Instagram. With the continued collaboration of and partnership with other agencies, private sector businesses, community organizations, and law enforcement agencies, the vision of OTS will continue in the successful extension of the message of traffic safety to the drivers, pedestrians, bicyclists and motorcyclists of California.
TRAFFIC RECORDS/ROADWAY SAFETYOTS supports efforts to automate traffic collision database systems, provide traffic safety stakeholders the ability to analyze and map high-collision locations and promotes data sharing and integration of traffic records data systems between all traffic records stakeholders in California. Grant-funded items include hardware, software, and expert services necessary to aid in the automation of manual processes, eliminate process duplication, and facilitate enhanced data gathering and data sharing. Roadway Safety programs concentrate on the vehicle operating environment and are strongly influenced by enforcement, engineering, and utilizing relevant data generated by those activities to improve traffic safety.

62016 Annual Report
FFY 2016 PROJECT DISTRIBUTION
1
Del Norte
Humboldt
(2)
Siskiyou (1) Modoc
Lassen
Shasta (4)
Trinity
Tehama (1) Plumas
Sierra
Butte (3)
Glenn (1)
Placer (3)
Colusa
Mendocino
Lake (2)
Sonoma (6) Napa
(3)
Yolo (4)
Sutter (2)
El Dorado (4) Alpine
Mono
Tuolumne
San Joaquin
(7)
Solano (6)
Contra Costa
(7) San Francisco (3)
San Mateo (9)
Santa Cruz (2)
Alameda (5)
Santa Clara
(7)
Stanislaus (6)
Merced (3)
Mariposa
Madera (1)
San Benito
(1)
Monterey (6)
Fresno (7)
Inyo
Kings
Tulare (5)
Kern (8)
San Luis Obispo (4)
Santa Barbara (6)
Ventura (8) Los Angeles
(39)
San Bernardino (10)
Riverside (13)
Orange (21)
San Diego (14)
Imperial (2)
Local Grants by County - 258
This map does not include regional or statewide local benefit grants.
LOCAL GRANTS BY COUNTY
258This map does not include regional
or statewide local benefit grants.

7 California Office of Traffic Safety
FFY 2016 PROJECT DISTRIBUTION
PROGRAM AREASAL ALCOHOL-IMPAIRED DRIVING
DD DISTRACTED DRIVING
DI DRUG-IMPAIRED DRIVING
EM EMERGENCY MEDICAL SERVICES
MC MOTORCYCLE SAFETY
OP OCCUPANT PROTECTION
PS PEDESTRIAN AND BICYCLE SAFETY
PT POLICE TRAFFIC SERVICES
TR TRAFFIC RECORDS AND ROADWAY SAFETY
Alameda County (5)1 - AL Avoid Grant 4 - PT Enforcement Grant
Butte County (3)1 - AL Enforcement Grant 1 - AL Probation Grant 1 - OP Education Grant
Calaveras County (2)1 - AL Enforcement Grant 1 - DI Vertical Prosecution Grant
Contra Costa County (7)1 - AL Avoid Grant 1 - AL Probation Grant 5 - PT Enforcement Grant
El Dorado County (4)1 - AL Avoid Grant 2 - AL Enforcement Grant 1 - DI Vertical Prosecution Grant
Fresno County (8)1 - AL Avoid Grant 1 - AL Probation Grant 1 - DI Vertical Prosecution Grant 1 - OP Evaluation / Feasibility Study Grant 1 - PS Education Grant 3 - PT Enforcement Grant
Glenn County (1)1 - DI Vertical Prosecution Grant
Humboldt County (2)2 - PT Enforcement Grant
Imperial County (2)1 - EM Rescue / Extrication Equipment Grant 1 - PT Enforcement Grant
Kern County (8)1 - AL Education Grant 1 - AL Probation Grant 1 - DI Vertical Prosecution Grant 1 - PS Education Grant 1 - PS Enforcement Grant 3 - PT Enforcement Grant
Lake County (2)1 - DI Vertical Prosecution Grant 1 - OP Education Grant
Los Angeles County (39)1 - DI Vertical Prosecution Grant 3 - OP Education Grant 3 - PS Education Grant 30 - PT Enforcement Grant 1 - PT Probation Grant 1 - TR Evaluation / Feasibility Study Grant
Madera County (1)1 - DI Vertical Prosecution Grant
Marin County (5)1 - AL Avoid Grant 1 - DI Vertical Prosecution Grant 3 - PT Enforcement Grant
Merced County (3)1 - AL Avoid Grant 2 - PT Enforcement Grant
Monterey County (6)1 - AL Avoid Grant 1 - AL DUI Courts Grant 1 - DI Vertical Prosecution Grant 1 - PS Education Grant 2 - PT Enforcement Grant
Napa County (3)1 - AL Avoid Grant 1 - DI Vertical Prosecution Grant 1 - PT Enforcement Grant
Orange County (21)1 - DI Vertical Prosecution Grant 1 - PS Education Grant 19 - PT Enforcement Grant
Placer County (3)1 - AL Avoid Grant 1 - AL Probation Grant 1 - DI Vertical Prosecution Grant
Riverside County (13)1 - AL Education Grant 2 - DI Vertical Prosecution Grant 1 - OP Education Grant 1 - PS Education Grant 7 - PT Enforcement Grant 1 - TR Geographic Information System Grant
Sacramento County (13)1 - AL Avoid Grant 2 - AL Enforcement Grant 1 - AL Equipment Grant 1 - AL Probation Grant 1 - AL Training Grant 1 - DI Vertical Prosecution Grant 1 - OP Education Grant 1 - OP Enforcement Grant 1 - PS Education Grant 3 - PT Enforcement Grant
San Benito County (1)1 - PT Enforcement Grant
San Bernardino County (10)1 - AL Enforcement Grant 1 - DI DUI Courts Grant 8 - PT Enforcement Grant
San Diego County (14)1 - AL Probation Grant 1 - DD Education Grant 2 - DI Vertical Prosecution Grant 1 - EM Rescue / Extrication Equipment Grant 2 - OP Education Grant 2 - PS Education Grant 5 - PT Enforcement Grant
San Francisco County (3)1 - DI Vertical Prosecution Grant 1 - PS Education Grant 1 - PT Enforcement Grant
San Joaquin County (7)1 - AL Avoid Grant 1 - AL DUI Courts Grant 1 - AL Enforcement Grant 1 - AL Probation Grant 1 - PS Enforcement Grant 2 - PT Enforcement Grant
San Luis Obispo County (4)1 - PS Education Grant 3 - PT Enforcement Grant
San Mateo County (9)1 - AL Avoid Grant 1 - PS Education Grant 7 - PT Enforcement Grant
Santa Barbara County (6)1 - AL Probation Grant 1 - PS Education Grant 4 - PT Enforcement Grant
Santa Clara County (7)1- AL Avoid Grant 1- PS Education Grant 5- PT Enforcement Grant
Santa Cruz County (2)1 - AL Avoid Grant 1 - PS Enforcement Grant
82016 Annual Report
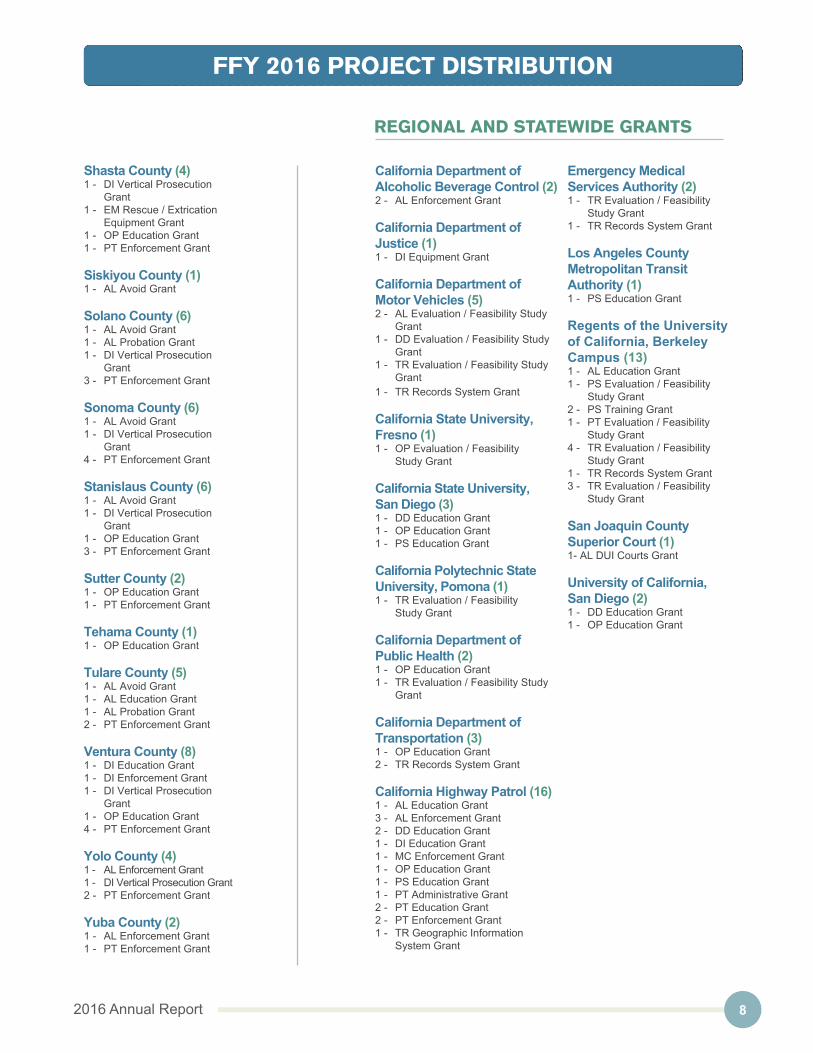
FFY 2016 PROJECT DISTRIBUTION
REGIONAL AND STATEWIDE GRANTS
Shasta County (4)1 - DI Vertical Prosecution Grant 1 - EM Rescue / Extrication Equipment Grant 1 - OP Education Grant 1 - PT Enforcement Grant
Siskiyou County (1)1 - AL Avoid Grant
Solano County (6)1 - AL Avoid Grant 1 - AL Probation Grant 1 - DI Vertical Prosecution Grant 3 - PT Enforcement Grant
Sonoma County (6)1 - AL Avoid Grant 1 - DI Vertical Prosecution Grant 4 - PT Enforcement Grant
Stanislaus County (6)1 - AL Avoid Grant 1 - DI Vertical Prosecution Grant 1 - OP Education Grant 3 - PT Enforcement Grant
Sutter County (2)1 - OP Education Grant 1 - PT Enforcement Grant
Tehama County (1)1 - OP Education Grant
Tulare County (5)1 - AL Avoid Grant 1 - AL Education Grant 1 - AL Probation Grant 2 - PT Enforcement Grant
Ventura County (8) 1 - DI Education Grant 1 - DI Enforcement Grant 1 - DI Vertical Prosecution Grant 1 - OP Education Grant 4 - PT Enforcement Grant
Yolo County (4)1 - AL Enforcement Grant 1 - DI Vertical Prosecution Grant2 - PT Enforcement Grant
Yuba County (2)1 - AL Enforcement Grant 1 - PT Enforcement Grant
California Department of Alcoholic Beverage Control (2)2 - AL Enforcement Grant
California Department of Justice (1)1 - DI Equipment Grant
California Department of Motor Vehicles (5) 2 - AL Evaluation / Feasibility Study Grant 1 - DD Evaluation / Feasibility Study Grant 1 - TR Evaluation / Feasibility Study Grant 1 - TR Records System Grant
California State University,Fresno (1)1 - OP Evaluation / Feasibility Study Grant
California State University,San Diego (3)1 - DD Education Grant 1 - OP Education Grant 1 - PS Education Grant
California Polytechnic State University, Pomona (1)1 - TR Evaluation / Feasibility Study Grant
California Department of Public Health (2)1 - OP Education Grant 1 - TR Evaluation / Feasibility Study Grant
California Department of Transportation (3)1 - OP Education Grant 2 - TR Records System Grant
California Highway Patrol (16)1 - AL Education Grant 3 - AL Enforcement Grant 2 - DD Education Grant 1 - DI Education Grant 1 - MC Enforcement Grant 1 - OP Education Grant 1 - PS Education Grant 1 - PT Administrative Grant 2 - PT Education Grant 2 - PT Enforcement Grant 1 - TR Geographic Information System Grant
Emergency Medical Services Authority (2)1 - TR Evaluation / Feasibility Study Grant 1 - TR Records System Grant
Los Angeles County Metropolitan Transit Authority (1)1 - PS Education Grant
Regents of the University of California, Berkeley Campus (13)1 - AL Education Grant 1 - PS Evaluation / Feasibility Study Grant 2 - PS Training Grant 1 - PT Evaluation / Feasibility Study Grant 4 - TR Evaluation / Feasibility Study Grant 1 - TR Records System Grant 3 - TR Evaluation / Feasibility Study Grant
San Joaquin County Superior Court (1)1- AL DUI Courts Grant
University of California,San Diego (2)1 - DD Education Grant 1 - OP Education Grant
9 California Office of Traffic Safety
TRAFFIC SAFETY CORE PERFORMANCE MEASURES
CORE PERFORMANCE MEASURESNHTSA and the Governors Highway Safety Association (GHSA) have agreed to a minimum set of performance measures to be used by state and federal agencies in the development and implementation of behavioral highway safety plans and programs. An expert panel from NHTSA, state highway safety offices, academic and research organizations, and other key groups assisted in developing the measures.
The initial minimum set contains 15 measures: eleven core outcome measures, one core behavior measure, and three activity measures. The measures cover the major areas common to highway safety plans and use existing data systems as indicated in the following tables.
All states are required to report progress on each of the core and behavior measures. In addition to the required initial minimum set of performance measures, California has defined and developed an additional 72 performance measures to better monitor traffic safety outcomes, behaviors, and activities. The Annual Report is reporting three activity measures that include grant-funded seat belt citations, impaired driving arrests, and speeding citations.
PROCESS FOR DEVELOPING TARGETSAs outlined in NHTSA’s “Traffic Safety Performance Measures for States and Federal Agencies” as well as NHTSA’s webinar “Tracking Core Outcome Measures and Performances Targets,” OTS used the templates, tools, and standardized language developed by NHTSA and GHSA for all core performance measures.
Deathszero TowardEvery 1 Counts
Selected targets were developed by using a five-year moving average as the baseline. Long-term and short-term data trends were analyzed and while long-term predictions indicate very aggressive targets, short-term predictions indicate either very conservative or unrealistic targets. For some of the core performance measures, OTS developed the target by using the average of the long-term and short-term prediction. While the ultimate goal is to reduce the upward trend for motorcycles, pedestrians, and bicycles, OTS decided to use an acceptable method of maintaining the baseline for these performance measures.
OVERALL PROGRAM GOALOTS collaborates with transportation partner agencies such as the CHP, California Department of Transportation (Caltrans), and the DMV, as well as law enforcement, state and federal agencies, community-based-organizations, and valued traffic safety advocates. Advances in vehicle safety technology, coupled with traffic safety legislation, expanded education and awareness, enforcement and engineering programs, as well as funding innovative programs focusing on high priority areas should bring us closer to our goal.
102016 Annual Report
TRAFFIC SAFETY CORE PERFORMANCE MEASURES
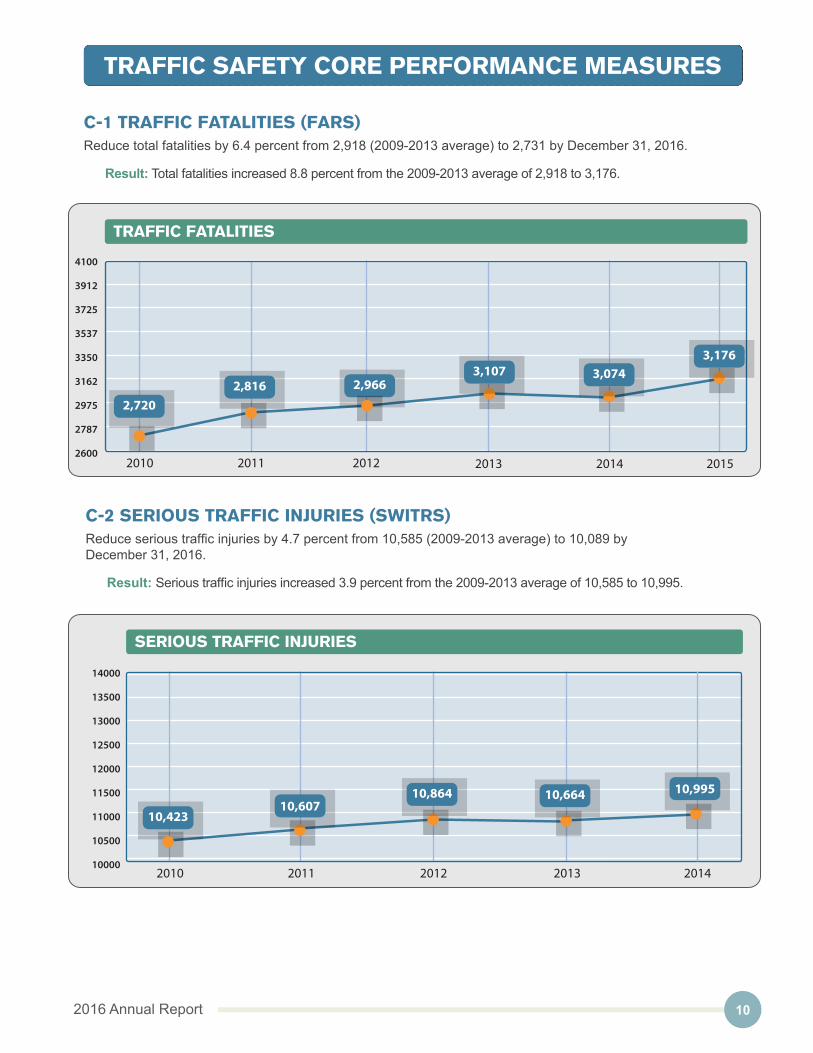
C-1 TRAFFIC FATALITIES (FARS)Reduce total fatalities by 6.4 percent from 2,918 (2009-2013 average) to 2,731 by December 31, 2016.
Result: Total fatalities increased 8.8 percent from the 2009-2013 average of 2,918 to 3,176.
2010 2011 2012 2013
TRAFFIC FATALITIES
2,7202,816 2,966
3,107
2014
4100
3912
3725
3537
3350
3162
2975
2787
2600
3,074
2015
3,176
C-2 SERIOUS TRAFFIC INJURIES (SWITRS)Reduce serious traffic injuries by 4.7 percent from 10,585 (2009-2013 average) to 10,089 byDecember 31, 2016.
Result: Serious traffic injuries increased 3.9 percent from the 2009-2013 average of 10,585 to 10,995.
2600
2787
2975
3162
3350
3537
3725
3912
4100
2010 2011 2012 2013
SERIOUS TRAFFIC INJURIES
10,423
14000
13500
13000
12500
12000
11500
11000
10500
10000
10,607
2014
10,864 10,664 10,995
10000
10500
11000
11500
12000
12500
13000
13500
14000

11 California Office of Traffic Safety
TRAFFIC SAFETY CORE PERFORMANCE MEASURES
C-3 FATALITIES/VEHICLE-MILES TRAVELED (VMT) (FARS/FEDERAL HIGHWAY ADMINISTRATION [FHWA])Reduce fatalities/VMT by 0.03 percentage points from 0.90 (2009-2013 average) to 0.87 by December 31, 2016.
Result: Traffic fatalities/VMT increased 0.03 points from the 2009-2013 average of 0.90 to 0.93.
FATALITIES/VMT
National California
2010 2011 20122009
.95.84
1.14 1.11 1.10
.88
2013
1.7
1.5
1.3
1.2
1.0
0.8
0.6
0.5
1.14
.91
1.10
.94
1.08
.93
2014
C-4 UNRESTRAINED PASSENGER VEHICLE OCCUPANT FATALITIES IN ALL SEATING POSITIONS (FARS)Reduce unrestrained passenger vehicle occupant fatalities, all seat positions by 10 percent from 529 (2009-2013 average) to 476 by December 31, 2016.
Result: Unrestrained passenger vehicle occupant fatalities in all seating positions increased 3 percent from the 2009-2013 average of 529 to 545.
2010 2011 2012 2013
UNRESTRAINED PASSENGER VEHICLE OCCUPANT FATALITIES IN ALL SEATING POSITIONS
483528
496516
2014
1000
900
800
700
600
500
400
476
2015
545
400
500
600
700
800
900
1000
0.5
0.6
0.8
1.0
1.2
1.3
1.5
1.7

122016 Annual Report
TRAFFIC SAFETY CORE PERFORMANCE MEASURES
C-5 ALCOHOL-IMPAIRED DRIVING FATALITIES (FARS)Reduce alcohol-impaired driving fatalities 5.6 percent from 834 (2009-2013 average) to 788 byDecember 31, 2016.
Result: Alcohol-impaired driving fatalities increased 9.6 percent from the 2009-2013 average of 834 to 914.
2010 2011 2012 2013
ALCOHOL-IMPAIRED DRIVING FATALITIES
774 774829
883
2014
1300
1200
1100
1000
900
800
700
600
882
2015
914
600
700
800
900
1000
1100
1200
1300
13 California Office of Traffic Safety
TRAFFIC SAFETY CORE PERFORMANCE MEASURES
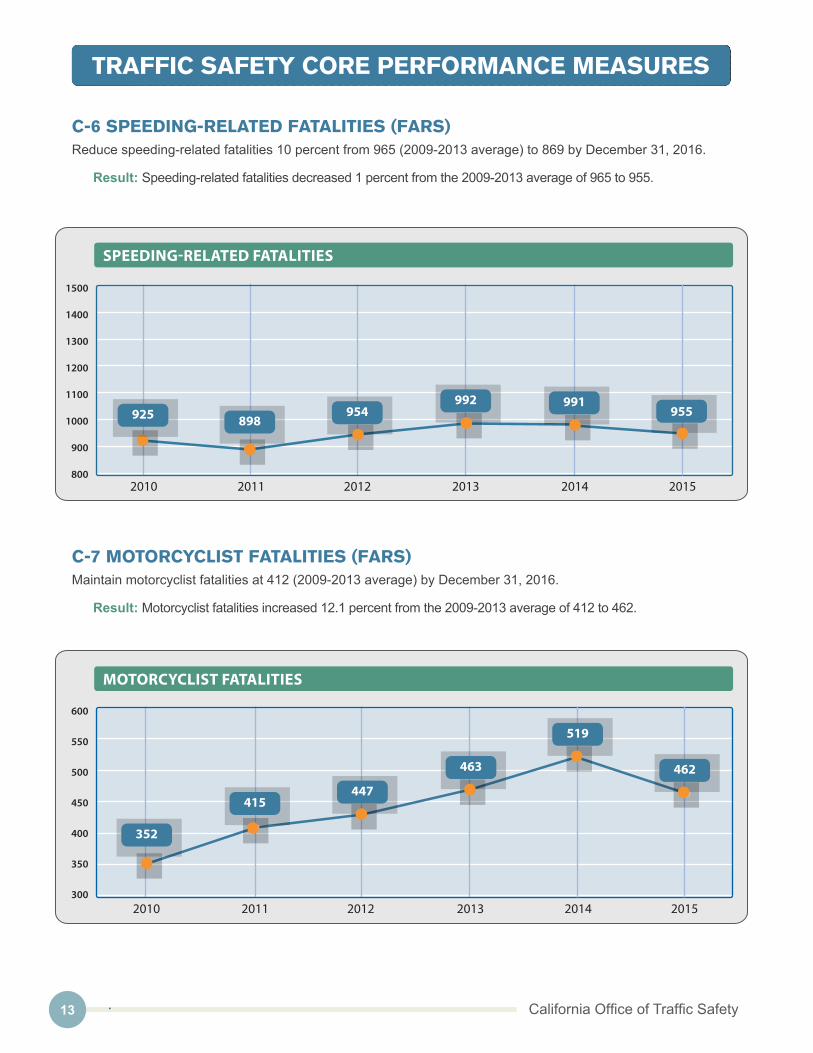
C-6 SPEEDING-RELATED FATALITIES (FARS)Reduce speeding-related fatalities 10 percent from 965 (2009-2013 average) to 869 by December 31, 2016.
Result: Speeding-related fatalities decreased 1 percent from the 2009-2013 average of 965 to 955.
2010 2011 2012 2013
SPEEDING-RELATED FATALITIES
898954
992
2014
1500
1400
1300
1200
1100
1000
900
800
925991
2015
955
800
900
1000
1100
1200
1300
1400
1500
C-7 MOTORCYCLIST FATALITIES (FARS)Maintain motorcyclist fatalities at 412 (2009-2013 average) by December 31, 2016.
Result: Motorcyclist fatalities increased 12.1 percent from the 2009-2013 average of 412 to 462.
2010 2011 2012 2013
MOTORCYCLIST FATALITIES
352
415447
463
2014
600
550
500
450
400
350
300
519
2015
462
300
350
400
450
500
550
600

142016 Annual Report
TRAFFIC SAFETY CORE PERFORMANCE MEASURES
C-8 UNHELMETED MOTORCYCLIST FATALITIES (FARS)Reduce unhelmeted motorcyclist fatalities 3 percent from 33 (2009-2013 average) to 32 byDecember 31, 2016.
Result: Unhelmeted motorcyclist fatalities decreased 33.3 percent from the 2009-2013 average of 33 to 22.
2010 2011 2012 2013
UNHELMETED MOTORCYCLIST FATALITIES
25 26
32
2014
35
70
60
50
40
30
20
24
2015
22
20
30
40
50
60
70
C-9 DRIVERS AGE 20 OR YOUNGER INVOLVED IN FATAL CRASHES (FARS) Reduce drivers age 20 or younger involved in fatal crashes by 10 percent from 355 (2009-2013 average) to 320 by December 31, 2016.
Result: Drivers age 20 or younger involved in fatal crashes increased 8.5 percent from the 2009-2013 average of 355 to 385.
2010 2011 2012
DRIVERS AGE 20 OR YOUNGER INVOLVED IN FATAL CRASHES
2013
336 327 330358
2014
700
600
500
400
300
200
380
2015
385
200
300
400
500
600
700

15 California Office of Traffic Safety
TRAFFIC SAFETY CORE PERFORMANCE MEASURES
C-10 PEDESTRIAN FATALITIES (FARS) Maintain pedestrian fatalities at 631 (2009-2013 average) by December 31, 2016.
Result: Pedestrian fatalities increased 17.6 percent from the 2009-2013 average of 631 to 742.
2010 2011 2012 2013
PEDESTRIAN FATALITIES
601633 653
734
2014
900
800
700
600
500
400
697
2015
742
C-11 BICYCLIST FATALITIES (FARS)Maintain bicyclist fatalities at 117 (2009-2013 average) by December 31, 2016.
Result: Bicyclist fatalities increased 10.3 percent from the 2009-2013 average of 117 to 129.
2010 2011 2012 2013
BICYCLIST FATALITIES
116 129147
2014
300
250
200
150
100
50
100128
2015
129
50
100
150
200
250
300
400
500
600
700
800
900
162016 Annual Report
TRAFFIC SAFETY CORE PERFORMANCE MEASURES
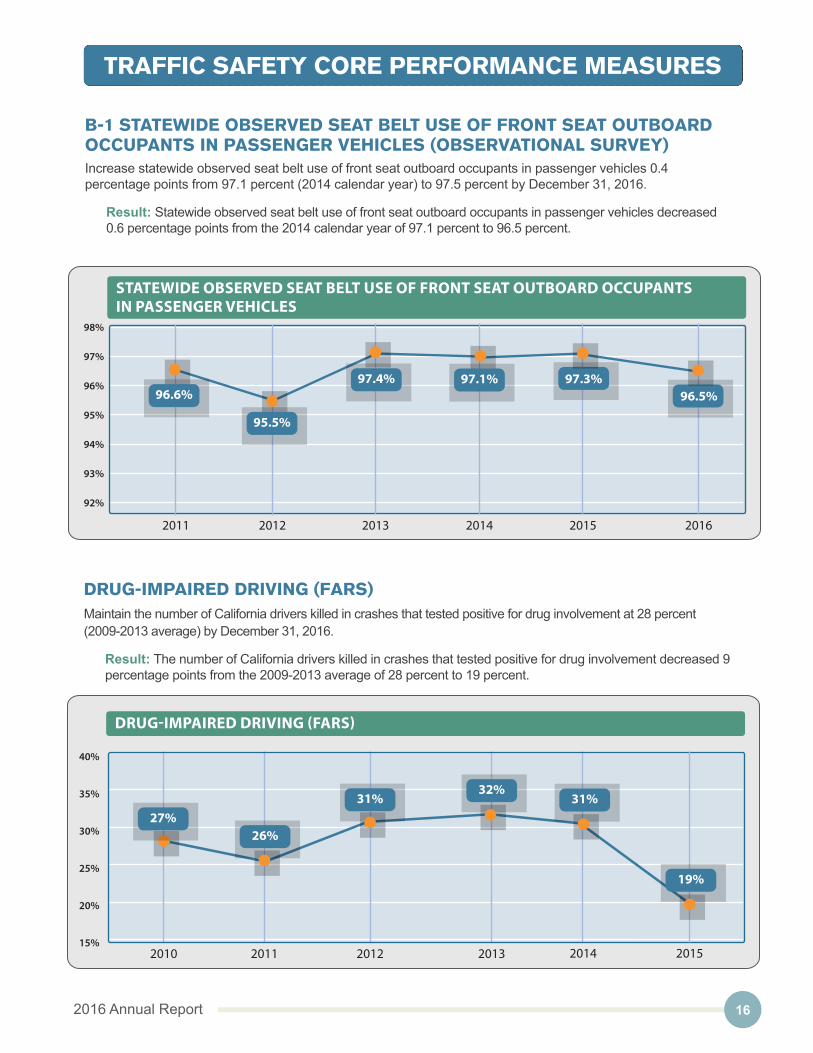
B-1 STATEWIDE OBSERVED SEAT BELT USE OF FRONT SEAT OUTBOARD OCCUPANTS IN PASSENGER VEHICLES (OBSERVATIONAL SURVEY)Increase statewide observed seat belt use of front seat outboard occupants in passenger vehicles 0.4 percentage points from 97.1 percent (2014 calendar year) to 97.5 percent by December 31, 2016.
Result: Statewide observed seat belt use of front seat outboard occupants in passenger vehicles decreased 0.6 percentage points from the 2014 calendar year of 97.1 percent to 96.5 percent.
STATEWIDE OBSERVED SEAT BELT USE OF FRONT SEAT OUTBOARD OCCUPANTS IN PASSENGER VEHICLES
2011 2013 2014 20152012
95.5%
96.6%
98%
97%
96%
95%
94%
93%
92%
97.3%97.4% 97.1%96.5%
2016
DRUG-IMPAIRED DRIVING (FARS)Maintain the number of California drivers killed in crashes that tested positive for drug involvement at 28 percent(2009-2013 average) by December 31, 2016.
Result: The number of California drivers killed in crashes that tested positive for drug involvement decreased 9 percentage points from the 2009-2013 average of 28 percent to 19 percent.
2010 2011 2012 2013
DRUG-IMPAIRED DRIVING (FARS)
26%
31%32%
2015
40%
35%
30%
25%
20%
15%
27%31%
19%
201415%
20%
25%
30%
35%
40%
91%
92%
93%
94%
95%
96%
97%
17 California Office of Traffic Safety
TRAFFIC SAFETY CORE PERFORMANCE MEASURES
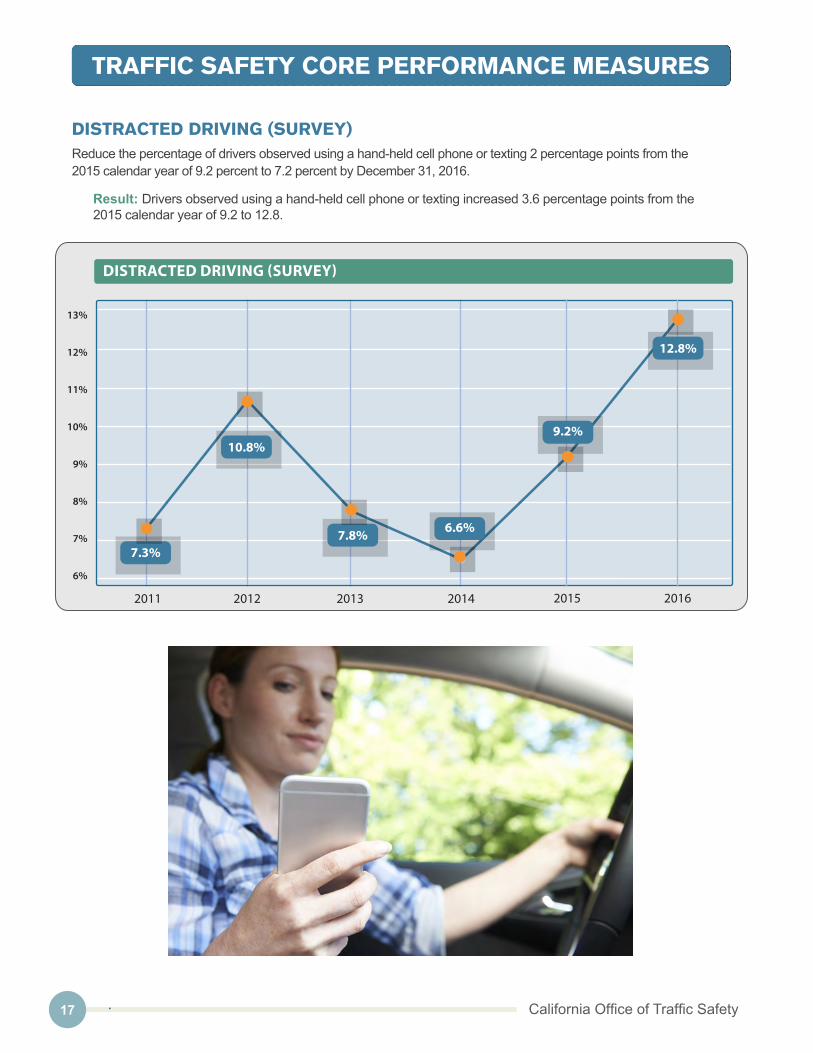
DISTRACTED DRIVING (SURVEY)Reduce the percentage of drivers observed using a hand-held cell phone or texting 2 percentage points from the 2015 calendar year of 9.2 percent to 7.2 percent by December 31, 2016.
Result: Drivers observed using a hand-held cell phone or texting increased 3.6 percentage points from the 2015 calendar year of 9.2 to 12.8.
2011 2012 2013 2014
DISTRACTED DRIVING (SURVEY)
7.3%
10.8%
7.8% 6.6%
9.2%
2015
13%
12%
11%
10%
9%
8%
7%
6%
12.8%
20166%
7%
8%
9%
10%
11%
12%
13%

182016 Annual Report
TRAFFIC SAFETY CORE PERFORMANCE MEASURES
Calendar Years
CORE OUTCOME MEASURES 2011 2012 2013 2014 2015
C-1: Traffic Fatalities (FARS) 2,816 2,966 3,107 3,102 3,176
C-2: Serious Traffic Injuries (SWITRS) 10,607 10,864 10,664 10,995 Not yet available
C-3: Fatalities/VMT (FARS/FHWA) 0.88 0.91 0.94 0.93 Not yet available
C-4: Unrestrained Passenger Vehicle Occupant Fatalities in all Seating Positions (FARS) 528 496 516 479 545
C-5: Alcohol-Impaired Driving Fatalities (all fatalities involving a driver or a motorcycle operator with a Blood Alcohol Content (BAC) of .08 or greater) (FARS)
774 829 880 876 914
C-6: Speeding-Related Fatalities (FARS) 898 954 992 995 955
C-7: Motorcyclist Fatalities (FARS) 415 447 463 522 462
C-8: Unhelmeted Motorcyclist Fatalities (FARS) 26 32 35 24 22
C-9: Drivers Age 20 or Younger Involved in Fatal Crashes (FARS) 327 330 358 383 385
C-10: Pedestrian Fatalities (FARS) 633 653 734 709 742
C-11: Bicyclist Fatalities (FARS) 116 129 147 129 129
Calendar Years
CORE BEHAVIOR MEASURE 2011 2012 2013 2014 2015 2016
B-1 Statewide Observed Seat Belt Use For Passenger Vehicles, Front Seat Outboard Occupants (CSU Fresno Observational Survey)
96.6% 95.5% 97.4% 97.1% 97.3% 96.5%
ACTIVITY MEASURES FFY 2016 (October 1, 2015 - September 30, 2016)
A-1: Seat Belt Citations Issued During Grant-Funded Enforcement Activities 3,880
A-2: Impaired Driving Arrests Made During Grant- Funded Enforcement Activities 11,831
A-3: Speeding Citations Issued During Grant-Funded Enforcement Activities 12,330

19 California Office of Traffic Safety
ADDITIONAL TRAFFIC SAFETY PERFORMANCE MEASURES
Calendar Years
ADDITIONAL ACTIVITY MEASURES 2011 2012 2013 2014 2015
Statewide DUI Arrests* 180,212 172,893 160,388 Not yet available Not yet available
Statewide DUI Conviction Rate* 73% 74% Available January 2017
Available January 2018
Available January 2019
Statewide Seat Belt Violation Convictions** 260,026 259,888 193,633 164,970 135,364
Statewide Child Restraint Violation Convictions** 11,791 9,555 27,813 24,400 21,781
Statewide Speeding Convictions** 1,613,877 1,477,208 1,365,955 1,282,881 1,217,790
Hand-held Cell Phone Convictions** 460,487 425,041 399,064 329,572 237,642
Texting Convictions** 14,886 21,059 27,207 29,633 31,492
Hand-held Device by Someone Under Age 18** 732 114 89 84 96
Calendar Years
ADDITIONAL OUTCOME MEASURES 2011 2012 2013 2014 2015
Rural Fatalities/VMT (FARS/FHWA) 2.11 2.09 2.32 2.23 Not yet available
Urban Fatalities/VMT (FARS/FHWA) 0.61 0.66 0.69 0.69 Not yet available
Mileage Death Rate (Fatalities Per 100 Million Vehicle Miles Traveled (SWITRS) 0.88 0.92 0.94 0.93 Not yet available
Motor Vehicle Fatalities, Age 16 -19 (FARS) 189 180 216 222 211
Male 125 130 141 160 141
Female 64 50 75 62 70
Motor Vehicle Driver Fatalities, Age 16-19 (FARS) 78 79 72 92 94
Male 55 65 57 71 74
Female 23 14 15 21 20
Fatality Rate Per 100,000 Population (FARS) 7.47 7.79 8.09 8 Not yet available
Total Motor Vehicle Injuries (SWITRS) 225,602 226,544 223,128 230,904 Not yet available
Motor Vehicle Injuries, Age 16 -19 (SWITRS) 18,697 19,871 19,146 19,132 Not yet available
Hit-and-Run Fatal Collisions (FARS) 238 226 282 285 273
Hit-and-Run Injury Collisions (SWITRS) 14,564 14,629 14,119 15,422 Not yet available
Hit-and-Run Fatalities (FARS) 246 229 296 298 281
Hit-and-Run Injuries (SWITRS) 18,801 18,824 18,351 20,042 Not yet available
Fatal Collisions between 2100-0300 (FARS) 723 717 750 806 799
Injury Collisions between 2100-0300 (SWITRS) 19,943 20,149 19,615 21,106 Not yet available
Motor Vehicle Fatalities between 2100-0300 (FARS) 801 795 846 871 899
Motor Vehicle Injuries between 2100-0300 (SWITRS) 29,039 29,149 28,316 30,417 Not yet available
* DMV DUI Management Information System Report ** DMV
202016 Annual Report
ADDITIONAL TRAFFIC SAFETY PERFORMANCE MEASURES
Calendar Years
ALCOHOL-IMPAIRED DRIVING 2011 2012 2013 2014 2015
Alcohol-Impaired Driving Fatality Rate -- Fatalities Per 100 Million Vehicle Miles Traveled (FARS) -- California 0.24 0.25 0.27 0.26 Not yet available
Alcohol-Impaired Driving Fatality Rate -- Fatalities Per 100 Million Vehicle Miles Traveled (FARS) -- National 0.33 0.35 0.34 0.33 Not yet available
Percent of Alcohol-Impaired Driving Fatalities 27% 28% 28% 28% Not yet available
Driver Fatalities Age 16 -19 with BAC=.08+ (FARS) 16 19 18 16 25
Male 12 17 14 11 19
Female 4 1 3 5 6
Alcohol-Related Fatalities (at least one driver or nonoccupant had a BAC of .01 or greater) (FARS) 1,121 1,198 1,277 1,268 1,325
Alcohol-Related Injuries (SWITRS) 23,853 23,905 23,178 23,993 Not yet available
Alcohol-Related Injuries Age 16 -19 (SWITRS) 2,232 2,111 1,893 1,688 Not yet available
Driver Fatalities Age 16-19 with BAC=.01+ (FARS) 19 21 23 25 31
Male 15 19 19 19 22
Female 4 1 3 6 10
Driver Fatalities Age 20-25 with BAC=.01+ (FARS) 143 134 160 150 142
Male 115 115 133 120 119
Female 27 20 27 30 23
Calendar Years
BICYCLES 2011 2012 2013 2014 2015
Bicyclist Fatalities (FARS) 116 129 147 129 129
Bicyclist Injuries (SWITRS) 13,605 13,920 13,283 13,042 Not yet available
Bicyclist Fatalities Under Age 15 (FARS) 12 4 4 5 5
Bicyclist Injuries Under Age 15 (SWITRS) 1,868 1,834 1,429 1,348 Not yet available
Unhelmeted Bicyclist Fatalities (FARS) 116 129 147 129 129
Calendar Years
DISTRACTED DRIVING 2012 2013 2014 2015 2016
Cell Phone and Texting Survey 10.8% 7.8% 6.6% 9.2% 12.8%
Calendar Years
DRUG-IMPAIRED DRIVING 2011 2012 2013 2014 2015
Drivers Killed, Tested Positive for Drugs (FARS) 26% 31% 32% 31% 19%

21 California Office of Traffic Safety
ADDITIONAL TRAFFIC SAFETY PERFORMANCE MEASURES
Calendar Years
MOTORCYCLES 2011 2012 2013 2014 2015
Total Motorcycle Registrations (DMV) 818,650 832,304 857,624 862,750 Not yet available
Motorcyclist Fatalities per 100,000 Motorcycle Registrations (FARS, DMV) 51 57 58 64 Not yet available
Motorcyclist Injuries (SWITRS) 12,028 12,617 13,143 13,744 Not yet available
Percent of Known Helmeted Motorcyclist Fatalities (FARS) 94% 93% 92% 95% 95%
Percent of Improperly Licensed Motorcycle Operator Fatalities (FARS) 36% 29% 33% 32% 32%
Motorcycle Rider (Operator) Fatalities with BAC =.08+ (FARS) 85 98 104 138 109
Motorcycle Rider (Operator) Fatalities (FARS) 387 426 445 504 449
Percent of Motorcycle Rider (Operator) Fatalities with BAC=.08+ (FARS) 22% 23% 23% 27% 24%
Percent of Motorcyclists At-Fault in Fatal Motorcycle Collisions (SWITRS) 66% 69% 65% 65% Not yet available
Percent of Motorcyclists At-Fault in Injury Motorcycle Collisions (SWITRS) 57% 56% 55% 55% Not yet available
Percent of Total Motorcycle Fatal Collisions where Motorcyclist was at Fault and Speed was Primary Collision Factor (SWITRS)
24% 20% 14% 29% Not yet available
Percent of Total Motorcycle Fatal Collisions where Motorcyclist was at Fault and DUI was Primary Collision Factor (SWITRS)
17% 25% 27% 15% Not yet available
Calendar Years
OCCUPANT PROTECTION 2012 2013 2014 2015 2016
Percent of Known Unrestrained Passenger Vehicle Occupant Fatalities (all seat positions) (FARS) 33% 34% 32% 34% Not yet available
Teen Driver Seat Belt Use Rate (Statewide Observational Survey) Not Conducted 96.9% 95.2% 96% 96.4%
Percent of Unrestrained Passenger Vehicle Occupant Fatalities Age 16 -19 (FARS) 42% 43% 38% 33% Not yet available
Child Safety Seat Use Rate (Statewide Observational Survey) 91.6% 88.5% 90.7% 94% 94.6%
Passenger Vehicle Occupant Fatalities Age 0-8 (FARS) 42 31 36 23 Not yet available
Vehicle Occupant Injuries Age 0-8 (SWITRS) 5,059 5,088 5,104 Not yet available Not yet available
Calendar Years
PEDESTRIANS 2011 2012 2013 2014 2015
Pedestrian Injuries (SWITRS) 13,427 14,117 13,094 13,918 Not yet available
Pedestrian Fatalities Under Age 15 (FARS) 28 22 28 24 24
Pedestrian Injuries Under Age 15 (SWITRS) 2,153 2,075 1,964 1,868 Not yet available
Pedestrian Fatalities Age 65 and Older (FARS) 153 159 179 185 173
Pedestrian Injuries Age 65 and Older (SWITRS) 1,305 1,430 1,376 1,546 Not yet available
Calendar Years
SPEEDING AND AGGRESSIVE DRIVING 2011 2012 2013 2014 2015
Speeding Related Injuries (SWITRS) 70,653 70,291 70,447 72,291 Not yet available

222016 Annual Report
STATEWIDE TRAFFIC SAFETY INTERCEPT SURVEY
2016 STATEWIDE TRAFFIC SAFETY SURVEY2016 marked the seventh year of the annual statewide traffic safety survey, intended to help continuously fine-tune traffic safety programs, enforcement efforts and public education campaigns to ensure they are effective and on target with individual populations.
California’s 2016 survey included 1,271 drivers aged 18 and over at gas stations in 15 counties throughout Central, Northern and Southern California. Participants were asked a range of traffic safety questions regarding impaired driving, seat belts, distracted driving and traffic safety laws and campaigns. The figures below are the top line totals for each question.
TRAFFIC SAFETY SURVEYRESULTS DATA:
In your opinion, what are the biggest safety problems on California roadways?
Reply 2016
Speeding/Aggressive Driving 19.2%
Texting on Cell Phone 18.2%
Talking on Cell Phone 13.8%
Bad Road Surfaces 12.2%
Other Driver Behavior 5.9%
Drunk Driving 5.6%
Congestion on Roadways 5.2%
All Other/Don’t Know 19.9%
In your opinion, what is the most serious distraction for drivers?
Reply 2016
Texting While Driving 44.1%
Cell Phone Talking (hand-held or hands-free) 33.5%
General Mobile Device Use (talk, text, GPS, etc.) 5.5%
Other Drivers’ Behavior 2.2%
Car Crashes/Issues w/ Other Vehicles 1.7%
GPS/Navigation Systems 1.7%
Roadside Billboards 1.5%
Construction on Roadways 1.1%
All Others 8.7%
How often in the past 30 days have you texted or emailed while driving?
Reply 2016
Regularly 11.4%
Sometimes 12.9%
Rarely 20.9%
Never 54.9%
How often in the past 30 days have you talked on a hand-held cell phone while driving?
Reply 2016
Regularly 35.9%
Sometimes 20.9%
Rarely 15.8%
Never 27.3%
Have you ever been hit or nearly hit by a driver who was talking or texting on a cell phone?
Reply 2016
Yes 54.6%
No 45.4%
Have you ever made a driving mistake while talking on a cell phone?
Reply 2016
Yes 43.9%
No 56.1%
What do you think is the likelihood of being ticketed for hand-held cell phone use or texting?
Reply 2016
Very Likely 21.5%
Somewhat Likely 21.0%
Neither Likely nor Unlikely 11.9%
Somewhat Unlikely 20.3%
Very Unlikely 25.3%
In the past 6 months, do you recall hearing or seeing: DDVIP Mobile App?
Reply 2016
Yes 2.5%
No 97.5%

23 California Office of Traffic Safety
STATEWIDE TRAFFIC SAFETY INTERCEPT SURVEY
TRAFFIC SAFETY SURVEY RESULTS DATA (CONTINUED)
In the past 6 months, do you recall hearing or seeing any of the following messages?
Reply Yes No
Report Drunk Drivers – Call 911 84.0% 16.0%
Drive Sober or Get Pulled Over 40.8% 59.2%
Silence the Distraction 10.4% 89.6%
Click It or Ticket 82.8% 17.2%
In the past 6 months, did you drive when you thought you had too much alcohol to drive safely?
Reply 2016
Yes 6.6%
No 64.5%
I Don’t Drink At All 29.0%
In the past 6 months, how often have you used a taxi or other ride service when drinking with others or alone?
Reply 2016
Always 20.8%
Sometimes 18.0%
Rarely 12.3%
Never 48.8%
In the past 6 months, how often have you had a designated sober driver, including you?
Reply 2016
Always 24.9%
Sometimes 20.6%
Rarely 15.6%
Never 38.9%
How likely is it for someone to get arrested if theydrive drunk?
Reply 2016
Very Likely 41.3%
Somewhat Likely 30.0%
Somewhat Unlikely 21.0%
Very Unlikely 7.7%
How serious of a problem is driving under the influence of drugs, including marijuana, prescription, and illegal?
Reply 2016
Very Big Problem 58.1%
Somewhat Of A Problem 30.9%
A Small Problem 9.1%
Not A Problem At All 1.9%
In the past 6 months, have you seen or heard anything about police setting up sobriety/DUI checkpoints to catch drunk drivers?
Reply 2016
Yes 57.9%
No 42.1%
Do you support the use of sobriety/DUI checkpoints?
Reply 2016
Yes 89.1%
No 10.9%
Do you think it’s safe to drive 10 miles over the speed limit on freeways?
Reply 2016
Yes 59.5%
No 21.7%
It Depends 18.8%
Do you think it’s safe to drive 20 miles over the speed limit on freeways?
Reply 2016
Yes 7.6%
No 74.4%
It Depends 17.9%
Do you think it’s safe to drive 5 miles over the speed limit on residential streets?
Reply 2016
Yes 36.6%
No 46.1%
It Depends 17.3%

242016 Annual Report
STATEWIDE TRAFFIC SAFETY INTERCEPT SURVEY
TRAFFIC SAFETY SURVEY RESULTS DATA (CONTINUED)
What do you think the chances are of getting a ticket if you drive over the speed limit?
Reply 2016
Very Likely 21.3%
Somewhat Likely 36.7%
Somewhat Unlikely 27.2%
Very Unlikely 14.8%
Do you think it is legal for bicyclists to ride on roadways when there is no bike lane?
Reply 2016
Yes 68.0%
No 32.0%
Think of the times you have BEEN a pedestrian in the last6 months. What safety problems did you experience?
Reply 2016
Cars Not Stopping 27.6%
Distracted Drivers (Cell Phones) 20.5%
Cars Going Too Fast 14.5%
None 13.5%
Almost Getting Hit By Car 4.7%
Lack of Sidewalks/Clear Crosswalks 4.0%
Bicyclists Not Stopping 2.5%
Driver’s Behavior (general) 1.9%
Drivers Turning Right Without Looking 1.1%

25 California Office of Traffic Safety
CALIFORNIA’S EVIDENCE-BASEDENFORCEMENT PROGRAM
California’s Evidence-Based Enforcement Program included many enforcement objectives conducted by CHP and local agencies through statewide, regional and local grants. Grant-funded enforcement activities targeted alcohol-impaired driving, drug-impaired driving, motorcycle safety, distracted driving, pedestrian and bicycle safety, occupant protection, and integrated traffic safety enforcement focusing on top primary collision factors.
Enforcement grantees conducted a total of 1,369 DUI/Drivers License checkpoints, 6,955 DUI saturation patrols, and 1,241 repeat DUI offender warrant service operations (additional activities and details are listed on page 27). Grantees also conducted 3,998 traffic enforcement operations, 684 motorcycle safety enforcement operations, and 2,225 distracted driving enforcement operations (additional activities and details are listed on page 31). In addition, OTS grantees participated in various NHTSA enforcement campaigns such as “Click It or Ticket,” “Winter and Summer Mobilizations,” “Distracted Driving Awareness,” and “Motorcycle Safety Month.”
OTS maintained constant communication with its enforcement grantees, having reviewed over 900 press releases, conducted 32 grant performance reviews, and evaluated over 200 performance reports on a quarterly basis. OTS’s law enforcement liaison assessed 55 DUI checkpoint operations and participated in 45 enforcement meetings. Beyond enforcement activities, many of the grantees participated in OTS funded training opportunities which included SFST, ARIDE, DRE, and Illegal Street Racing training. In FFY 2016, 1,252 officers were trained in SFST, 3,405 officers were trained in ARIDE, and 346 officers were trained in DRE.
PROJECTS NOTIMPLEMENTED
The California Highway Patrol (CHP) grant(# TR1612) for the “3-Dimensional Laser Scanning Systems” implementation was initially delayed by funding type and potential Buy America Act issues. The Buy America Act (Title 23, Section 313) prohibits the use of Federal highway safety grant funds to purchase manufactured products unless they are produced in the United States. During this delay,CHP secured funding to procure the desired equipment through other sources. Therefore this project was not implemented.

262016 Annual Report
PROGRAM GOALS, RESULTS, AND ACTIVITIES
ALCOHOL-IMPAIRED DRIVINGGoal: Reduce the number of persons killedin alcohol-involved collisions 5 percent bySeptember 30, 2016.
Result: Persons killed in alcohol-involved collisions decreased 0.4 percent from 261 to 260.
Goal: Reduce the number of persons injuredin alcohol-involved collisions 6 percent bySeptember 30, 2016.
Result: Persons injured in alcohol-involved collisions increased 5.8 percent from 8,895 to 9,411.
Goal: Reduce hit-and-run fatal collisions 5 percent by September 30, 2016.
Result: Hit-and-run fatal collisions increased37.4 percent from 131 to 180.
Goal: Reduce hit-and-run injury collisions5 percent by September 30, 2016.
Result: Hit-and-run injury collisions decreased6.1 percent from 14,524 to 13,635.
Goal: Reduce nighttime (2100 - 0259 hours) fatal collisions 5 percent by September 30, 2016.
Result: Nighttime (2100 - 0259 hours) fatal collisions increased 19.7 percent from 351 to 420.
Goal: Reduce nighttime (2100 - 0259 hours) injury collisions 5 percent by September 30, 2016.
Result: Nighttime (2100 - 0259 hours) injury collisions increased 17.3 percent from 12,789 to 15,000.
Goal: Reduce the number of motorcyclists killedin alcohol-involved collisions 5 percent bySeptember 30, 2016.
Result: Motorcyclists killed in alcohol-involved collisions decreased 23.1 percent from 39 to 30.
Goal: Reduce the number of motorcyclists injured in alcohol-involved collisions 5 percent by September 30, 2016.
Result: Motorcyclists injured in alcohol-involved collisions decreased 4.5 percent from 245 to 234.
All data is self-reported by grantees and not verified by OTS.

27 California Office of Traffic Safety
PROGRAM GOALS, RESULTS, AND ACTIVITIES
ALCOHOL-IMPAIRED DRIVING (CONTINUED)A summary of activities conducted by all OTS-funded grants with objectives related to alcohol and other drugs is provided in the following tables.
DUI ENFORCEMENT ACTIVITY TOTAL
DUI/Drivers License Checkpoints 1,370
Vehicles Through Checkpoints 1,425,735
Drivers Contacted 967,272
Field Sobriety Tests Administered 18,330
DUI Arrests (Alcohol Only) 3,153
DUI Drug Arrests (Drug Only) 508
DUI Arrests (Alcohol/Drug Combination Only) 92
Drug Arrests (Possession, Transportation, Sales) 155
Criminal Arrests (Felony in Custody) 314
Recovered Stolen Vehicles 70
Suspended/Revoked Driver's Licenses 5,952
DUI Saturation Patrols Conducted 6,966
Vehicle Stops 87,437
Field Sobriety Tests Administered 21,326
DUI Arrests (Alcohol Only) 5,948
DUI Drug Arrests (Drug Only) 708
DUI Arrests (Alcohol/Drug Combination Only) 225
Drug Arrests (Possession, Transportation, Sales) 482
Criminal Arrests (Felony in Custody) 797
Recovered Stolen Vehicles 184
Suspended/Revoked Driver's Licenses 3,700
Repeat DUI Offender Warrant Service Operations 1,241
Warrant Service Attempts 9,517
Warrants Served (Arrests/Citations) 1,846
Court Sting Operations 170
Arrests from Court Sting Operations 354
Stakeout Operations Conducted 133
Arrests from Stakeout Operations 200
Minor Decoy Operations Conducted 229
Citations Issued 430
Shoulder Tap Operations Conducted 150
Arrests from Shoulder Tap Operations 43
Citations Issued 351
Officers Trained in Standardized Field Sobriety Testing (SFST) 1,252

282016 Annual Report
PROGRAM GOALS, RESULTS, AND ACTIVITIES
ALCOHOL-IMPAIRED DRIVING (CONTINUED)
INTENSIVE SUPERVISION OF DUI PROBATIONERS TOTAL
Total Probationers on Intensive Supervision 7,534
Attempted Field Contacts (all 'door knocks" whether successful or not) 12,708
Announced Field Contacts Made 540
Unannounced Field Contacts Made Without Search 1,963
Unannounced Field Contacts Made With Search 8,162
Office Contacts Made 17,554
Alcohol/Drug Tests (Persons Tested) 20,862
Positive Alcohol/Drug Tests 860
DUI Warrant Service Operations Completed 776
Warrant Service Attempts 1,311
Warrants Successfully Served 301

29 California Office of Traffic Safety
PROGRAM GOALS, RESULTS, AND ACTIVITIES
DISTRACTED DRIVINGGoal: Reduce fatal collisions involving drivers using hand-held cell phones.
Result: Data not yet available.
Goal: Reduce injury collisions involving drivers using hand-held cell phones.
Result: Data not yet available.
DRUG-IMPAIRED DRIVINGGoal: Provide increased training to law enforcement on identifying drug-impaired drivers.
Result: A total of 346 officers were trained in DRE and 3,405 officers were trained in ARIDE.
SUPPORTING ACTIVITY TOTAL
Officers Trained in ARIDE 3,405
Officers Trained in DRE 346
Persons trained in Drug Impairment Training for Educational Professionals (DITEP) 280
EMERGENCY MEDICAL SERVICESGoal: Decrease the average response time (time of notification to hospital treatment or transport) in service areas.
Result: Average response time (time of notification to hospital treatment or transport) in service areas decreased 33 percent from 15 minutes to 10 minutes.
Goal: Increase seat belt compliance 5 percentage points by September 30, 2016.
Result: Seat belt compliance decreased 1 percentage point from 83 percent to 82 percent.
Goal: Increase child safety seat usage 6 percentage points by September 30, 2016.
Result: Child safety seat usage decreased 1 percentage point from 63 percent to 62 percent.
Goal: Reduce the number of vehicle occupants killed under the age of eight by 10 percent by September 30, 2016.
Result: Vehicle occupants killed under the age of eight decreased 64 percent from 11 to 4.
Goal: Reduce the number of vehicle occupants injured under the age of eight by 10 percent by September 30, 2016.
Result: Vehicle occupants injured under the age of eight decreased 42 percent from 1,526 to 895.
OCCUPANT PROTECTION
SUPPORTING ACTIVITY TOTAL
Child Passenger Safety Seat Certification Trainings 38
NHTSA-Certified Technicians Trained 663
NHTSA-Certified Instructors Trained 18
Child Passenger Safety Recertification Classes Completed 24
People Recertified (Current Techs) 345
People Recertified (Expired Techs) 76
Child Passenger Safety Seat Checkup Events 418
Child Safety Seats Properly Fit 10,193
New Child Safety Seats Distributed and Properly Fit 4,727
Special Needs Seats Distributed 7
New Fitting Stations Established 76
Child Safety Seats Distributed to People in Need 9,176
Child Safety Seats Inspected 20,797

302016 Annual Report
PROGRAM GOALS, RESULTS, AND ACTIVITIES
PEDESTRIAN AND BICYCLE SAFETYGoal: Reduce the total number of pedestrianskilled 8 percent by September 30, 2016.
Result: Pedestrians killed increased 23.1 percent from 476 to 586.
Goal: Reduce the total number of pedestrians injured 10 percent by September 30, 2016.
Result: Pedestrians injured increased 10.6 percent from 11,189 to 12,372.
Goal: Reduce the total number of bicyclists killed in traffic related collisions 10 percent by September 30, 2016.
Result: Bicyclists killed in traffic related collisions increased 11.8 percent from 93 to 104.
Goal: Reduce the total number of bicyclists injured in traffic related collisions 10 percent by September 30, 2016.
Result: Bicyclists injured in traffic related collisions decreased 9.8 percent from 9,457 to 8,530.
Goal: Increase bicycle helmet compliance for children aged 5 to 18 by 25 percentage points bySeptember 30, 2016.
Result: Bicycle helmet compliance for children aged 5 to 18 decreased 7 percentage points from 62 percent to 55 percent.
PUBLIC EDUCATION ACTIVITY TOTAL
School/Community Traffic Safety/Bicycle Rodeos 375
Students Participating 45,096
Bicycle Helmets Distributed 2,408
Bicycle Helmets Properly Fitted 3,457
Community Traffic Safety/Bicycle Rodeos 315
People Impacted 167,720
Bicycle Helmets Distributed 4,604
Bicycle Helmets Properly Fitted 5,151
Bicycle Helmets Distributed 1,546
Class Room/Parent Educational Workshops/Presentations 437
People Impacted 44,888

31 California Office of Traffic Safety
PROGRAM GOALS, RESULTS, AND ACTIVITIES
POLICE TRAFFIC SERVICESGoal: Reduce the total number of persons killed in traffic collisions 2 percent by September 30, 2016.
Result: Persons killed in traffic collisions increased 11.2 percent from 1,274 to 1,417.
Goal: Reduce the total number of persons injured in traffic collisions 2 percent by September 30, 2016.
Result: Persons injured in traffic collisions increased 12.1 percent from 117,749 to 131,958.
LAW ENFORCEMENT ACTIVITY TOTALTraffic Enforcement Operations Conducted 4,022
Vehicle Stops 65,471
Citations Issued 60,099
Distracted Driving Enforcement Operations Conducted 2,230
Vehicle Stops 33,979
Hand-Held Cell Phone Citations Issued 16,846
Texting Citations Issued 4,795
Individuals Under the Age of 18 That Received a Citation 106
Motorcycle Safety Enforcement Operations Conducted 684
Motorcycle Stops 2,591
Motorcycle Citations 1,663
Vehicle Stops 7,455
Vehicle Citations 6,895
Field Sobriety Tests Administered to Motorcyclists 114
Field Sobriety Tests Administered to Other Drivers 288
DUI Arrests of Motorcyclists (Alcohol Only) 22
DUI Arrests of Other Drivers (Alcohol Only) 56
DUI Drug-Impaired Arrests of Motorcyclists [VC-23152(e)] 5
DUI Drug-Impaired Arrests of Other Drivers [VC-23152(e)] 15
DUI Arrests (Alcohol/Drug Combination) of Other Drivers 8
Drug Arrests (Possession, Transportation, Sales) 11
Criminal Arrests (Felony in Custody) 47
Suspended/Revoked Driver's Licenses 275
Motorcycle License Endorsement [VC-12500(b)] 200
Recovered Stolen Vehicles 6
Nighttime (2100 - 0259 hours) "Click It or Ticket" Enforcement Operations Conducted 442
Vehicle Stops 5,260
Seatbelt Citations Issued 2,551
Child Safety Seat Citations Issued 384
Bicycle and Pedestrian Enforcement Operations Conducted 2,126
Bicycle Stops 8,179
Bicycle Citations Issued 6,131
Pedestrian Stops 9,446
Pedestrian Citations Issued 7,382
Vehicle Stops 18,617
Vehicle Citations Issued 16,082
Enforcement Operations Conducted Targeting Drivers Exhibiting Excessive Speed 473
Citations Issued 6,950
322016 Annual Report
PROGRAM GOALS, RESULTS, AND ACTIVITIES
TRAFFIC RECORDS/ROADWAY SAFETYGoal: Replace manual input databases or paper files, allowing traffic engineers access to extensive collision analysis tools, automated standard reports, and mapping of collision locations.
Result: One county was funded for a new Traffic Collision Data Analysis and Mapping system.
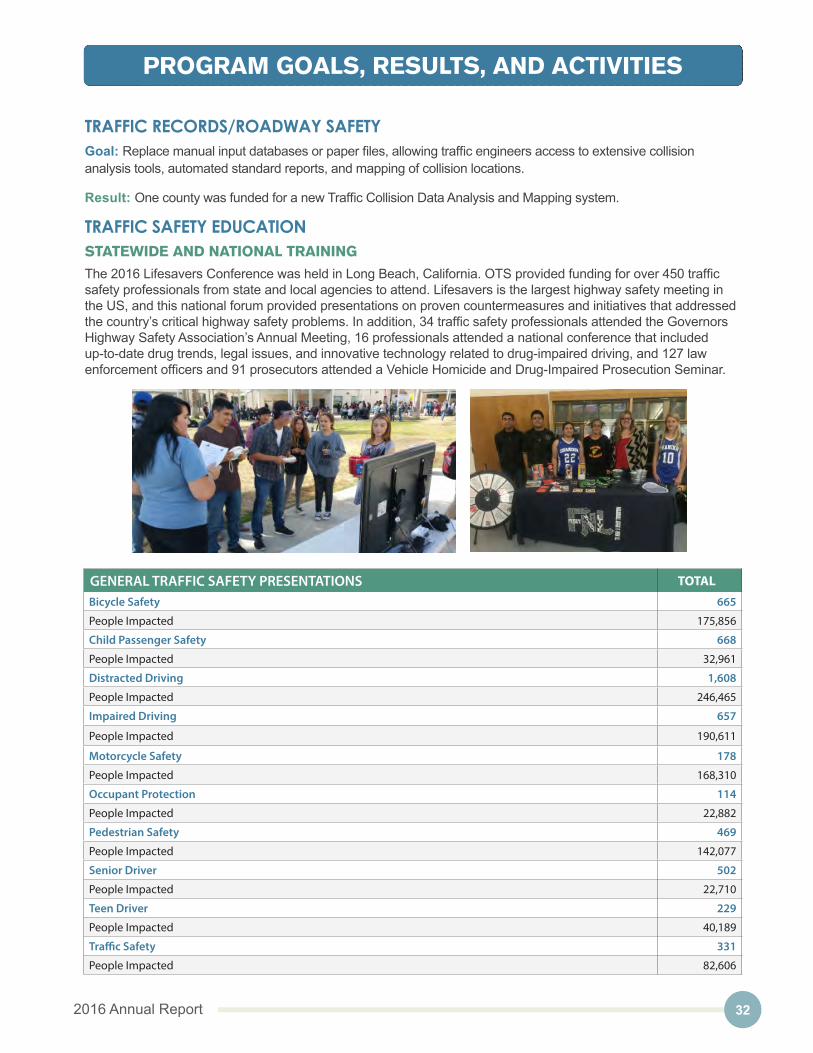
TRAFFIC SAFETY EDUCATIONSTATEWIDE AND NATIONAL TRAINING
The 2016 Lifesavers Conference was held in Long Beach, California. OTS provided funding for over 450 traffic safety professionals from state and local agencies to attend. Lifesavers is the largest highway safety meeting in the US, and this national forum provided presentations on proven countermeasures and initiatives that addressed the country’s critical highway safety problems. In addition, 34 traffic safety professionals attended the Governors Highway Safety Association’s Annual Meeting, 16 professionals attended a national conference that included up-to-date drug trends, legal issues, and innovative technology related to drug-impaired driving, and 127 law enforcement officers and 91 prosecutors attended a Vehicle Homicide and Drug-Impaired Prosecution Seminar.
GENERAL TRAFFIC SAFETY PRESENTATIONS TOTALBicycle Safety 665
People Impacted 175,856
Child Passenger Safety 668
People Impacted 32,961
Distracted Driving 1,608
People Impacted 246,465
Impaired Driving 657
People Impacted 190,611
Motorcycle Safety 178
People Impacted 168,310
Occupant Protection 114
People Impacted 22,882
Pedestrian Safety 469
People Impacted 142,077
Senior Driver 502
People Impacted 22,710
Teen Driver 229
People Impacted 40,189
Traffic Safety 331
People Impacted 82,606

33 California Office of Traffic Safety
PROGRAM GOALS, RESULTS, AND ACTIVITIES
SPECIAL TRAFFIC SAFETY PRESENTATIONS TOTAL
Every 15 Minutes 170
People Impacted 134,690
Multi-Media Presentations 37
People Impacted 14,657
Real DUI Trials and Sentencing's 24
People Impacted 14,153
Sober Graduation 86
People Impacted 20,185
Speeding 706
People Impacted 156,520
Start Smart 1,081
People Impacted 34,449
PUBLIC RELATIONS, ADVERTISING AND MARKETING
Goals OTS Marketing and Public Affairs supports the OTS mission of reducing deaths, injuries, and economic losses resulting from traffic crashes by creating and implementing comprehensive public awareness programs designed to improve and encourage safe driving practices statewide. In addition, OTS initiates contact with, responds to, and strives to be the primary source for the press and others, providing information and policy messaging relating to traffic safety issues. These efforts are intended to make safe driving the behavior of choice for all Californians, including at-risk and under-served communities. OTS recognizes the challenge of reaching a diverse and widespread population of over 38 million people, including 25 million licensed drivers, and creates its public awareness efforts to best and most effectively reach them.
Results In FFY 2016, OTS Marketing and Public Affairs was instrumental in the successful implementation of multiple statewide and regional campaigns and outreach efforts. More Californians and visitors are being reached with traffic safety messaging, in more ways, than ever before. OTS campaigns and campaign materials won 12 Gold or Silver awards from multiple professional organizations.
DECEMBER DUI CRACKDOWN CAMPAIGN In conjunction with the state’s local law enforcement agencies and county DUI Task Forces, OTS partnered with the CHP, Alcoholic Beverage Control (ABC), DMV and Caltrans, among others, to conduct the state’s annual December anti-DUI campaign. The campaign was kicked off with a press conference in San Francisco featuring NHTSA Administrator Dr. Mark Rosekind.
The campaign message centered on the OTS mobile app “DDVIP.” The message conveyed was that designated sober drivers are the heroes of any night out and encouraged people to download and use the DDVIP app as a way to garner free non-alcoholic drinks and other free considerations for designated drivers from participating bars. The OTS portion of the effort generated more than 70 million audience impressions from earned media placements, paid advertising and public service announcements. Collectively the campaign generated more than $2 million in added value.

342016 Annual Report
PROGRAM GOALS, RESULTS, AND ACTIVITIES
PUBLIC RELATIONS, ADVERTISING AND MARKETING (CONTINUED)
The campaign received a great deal of interaction and media coverage which exposed the message of safe and sober driving on a statewide level. The app obtained nearly 10,000 downloads during and immediately following the campaign events in December. The app garnered an additional 5,000 downloads for a total of 33,000 downloads by the end of FFY 2016.
Since the December holiday season is one when colleges and universities are out of session, the OTS DDVIP College Tour took place during mid-March. At six campuses across the state, the tour included concert ticket giveaways, free food trucks, engaging booth activities and messaged materials. Paid and earned media surrounding the tour garnered more than 26 million impressions.
DISTRACTED DRIVING
OTS kept the theme and messaging for its distracted driving campaign effort of “Silence the Distraction,” to get drivers to turn off, put out of reach or at least silence their cell phones while driving. The creative “hook” for the campaign switched to one based on the use of emojis to make the point. The April television, radio and internet paid media campaign generated more than 42 million impressions and nearly $117,000 in added value.
During and after the primary April campaign, OTS continued providing organizations with campaign materials for distribution to their members, customers and contacts as well as new and existing partners including auto collision centers, insurance agencies, county libraries, high schools, colleges, chambers of commerce and driving/traffic schools.
PEDESTRIAN SAFETY
Recognizing the growing problem of pedestrian fatalities and injuries in California, OTS made the decision to mount the first statewide campaign aimed at the issue. Since this was new territory, and anticipating that this would need to be as much basic educational as well as behavior changing, OTS decided to do extensive research and testing in early FFY 2016 for a statewide roll-out later in the year.
In October 2015, the OTS launched a new public education pilot Pedestrian Safety Awareness campaign, “Be Aware. Be Alert. Pedestrians Don’t Have Armor” in the Sacramento region. The campaign aimed to place equal responsibility on both drivers and pedestrians, highlighting the importance of pedestrian safety awareness regardless of whether one is on foot or behind the wheel. The creative direction for the campaign centered on “Pete Walker”, an everyday pedestrian clad in a full suit of car armor to illustrate that in real life, pedestrians don’t have armor. Along with social media promotion and strategic paid advertisement efforts throughout the Sacramento region, the primary elements of the month-long campaign included a 30-second television PSA and the development and distribution of several campaign-themed collateral items.
Overall, the paid campaign garnered more than 30 million impressions across all mediums, with campaign related posts on social media obtaining the highest level of engagements out of all OTS posted content during the month of the campaign. Earned media garnered approximately 3.5 million impressions for an added value of $71,400.

35 California Office of Traffic Safety
PROGRAM GOALS, RESULTS, AND ACTIVITIES
PUBLIC RELATIONS, ADVERTISING AND MARKETING (CONTINUED)
The campaign research survey showed that while just over a quarter of respondents (29 percent) said that they were aware of a pedestrian safety traffic message in advertising and publicity prior to the campaign, this number significantly increased to 46 percent in the post-campaign survey, indicating a successful attempt at reaching audiences throughout the Sacramento area.
The 2015 pilot effort paved the way for the 2016 statewide awareness campaign. Once again, the “Be Aware. Be Alert. Pedestrians Don’t Have Armor” campaign aimed to place equal responsibility on both drivers and pedestrians, highlighting the importance of pedestrian safety awareness regardless of whether one is on foot or behind the wheel. Both paid media and outreach efforts extended throughout the state, with focus in the Bakersfield, Chico, Fresno, Monterey-Salinas, Sacramento, San Diego and Santa Barbara media markets, resulting in 127 million impressions.
OTS executed a statewide tour of seven middle schools in the target media markets, with a goal of increasing awareness about pedestrian and motorist safety, particularly amongst the middle school age demographic – one that often walks to school each and every day. The “Pete Walker” character was on hand to help escort students across busy streets near the schools.
YEAR-ROUND EFFORTS
Public awareness activities in support of DUI, distracted driving, pedestrian safety and other traffic safety issues were not limited to the traditional, NHTSA designated time periods. OTS has expanded them to continue throughout the year so that the public has constant exposure to the messaging.
The anti-DUI effort was not confined to the holiday period or even DDVIP alone, but was planned and
executed to have year-round and lasting impact through a continuous and active designated sober driver effort partnering with 500 bars and restaurants, 17 regional winery associations encompassing 850 member wineries, 300 breweries, and 560 commercial transportation companies throughout the state.
OTS partnered with Ovations Food Services to incorporate a DDVIP message on more than 1.75 million cups distributed at fairgrounds and event facilities throughout California. In addition to the cups, posters, bar mats, coasters, and buttons were distributed at each of the 14 facilities. Combined with the cups, the partnership was able to reach more than 16 million people over the course of the year.
OTS continued its multi-year partnership with the Sacramento River Cats and Raley Field to promote anti-DUI and distracted driving messaging via the venue’s radio, website, scoreboard, concourse and bathroom advertising opportunities. This effort earned OTS nearly 1.2 million audience impressions throughout the course of the partnership.
During the year, OTS continued its newsletter story distribution program to support anti-DUI, distracted driving, and other traffic safety issues. The individual stories were offered in both long and short forms, and depending on the topic, distributed to those on a growing list of 750 organizations with institutional newsletters, including traffic schools, chambers of commerce, hospitals, law enforcement agencies, county governments, winery associations, universities, parent teacher associations and more. In addition to distracted driving and anti-DUI awareness, newsletter topics included driving and pedestrian safety tips, bicycle and motorcycle safety awareness, child safety seat and child hyperthermia awareness and prevention tips.

362016 Annual Report
PROGRAM GOALS, RESULTS, AND ACTIVITIES
PUBLIC RELATIONS, ADVERTISING AND MARKETING (CONTINUED)
While the primary pedestrian safety campaign effort took place throughout September and October of 2016, OTS is ensuring that ongoing community outreach continues to take place. OTS has produced a total of five “Pete Walker” suits, which have been distributed to host agencies in the chosen media markets throughout the state. The suits and accompanying materials are at the disposal of any qualified agency or group, to be utilized at various community events as a way to engage the public with the campaign on an ongoing basis.
SEAT BELT MOBILIZATIONS
Due to California’s seat belt usage rate of over 96 percent, there was no paid media or heavy outreach campaigns for “Click It or Ticket.” However, OTS and many of its grantees continued with earned media messaging; both on a statewide and local level, plus over 650 permanent road signs remain in place. All indications were that both the media and public were under the impression that “Click It or Ticket” special enforcement was continuing unabated.
GRANTEE MEDIA RELATIONS
OTS Public Affairs regularly provides technical assistance to local grantees in their communications and outreach efforts. In FFY 2016, Marketing and Public Affairs supported grantees in the development of press materials and the planning of media events. OTS assisted local grantees by developing press release templates to announce their grants and to publicize their operations year-round. The templates were made available on the OTS website for easy downloading and use. OTS aided grantees by participating in print and broadcast media interviews to underscore the key points regarding impaired driving, occupant protection, distracted driving, and police traffic services, among others. Nearly 250 grant kickoff press releases and over 900 operation/activity press releases from grantees were reviewed and edited as needed.
SOCIAL MEDIA
FFY 2016 saw a continuing expansion of OTS presence on social media. Due to a change in Facebook procedures for businesses last year, the OTS “like” count dropped 10 percent, to nearly 30,000. Over the last 18 months, the OTS Facebook count has rebounded by over 15 percent, now standing at 35,000. OTS Facebook is unique among state highway safety sites in that we stress engagement first and message second. A combination of eye-
catching graphics, photos, videos, and choreographed conversational interaction are all designed to immediately and constantly bring in visitors and keep them returning. As they stay, the traffic safety messaging is subtly, and sometimes directly, insinuated into the conversation. This same tactic is used on the OTS Twitter presence, which currently has 8,300 followers. The OTS YouTube Channel has been effectively used as a landing spot for “viral” videos. The OTS Instagram, although active and engaging, has not yet become a major source of followers.
INSTITUTIONAL PARTNERING
OTS continued to build on highly successful cooperative promotional activities with NHTSA, Mothers Against Drunk Driving (MADD) and other national institutions, and industry groups including iHeart Media, Ovation Food Services, Sacramento River Cats and Raley Field, multiple winery regional associations, trucking associations, and bar and restaurant chains. OTS partnerships with other state agencies have been particularly effective, including the DMV, CHP, ABC, Department of Public Health, and Caltrans. The use of Caltrans changeable message signs for traffic safety during the holiday “DUI Crackdown”, “Click It or Ticket” and distracted driving periods, have reached tens of millions of freeway drivers repeatedly with the traffic safety message.

37 California Office of Traffic Safety
PROGRAM AREA HIGHLIGHTS
ALCOHOL-IMPAIRED DRIVING
HIGH VISIBILITY ENFORCEMENT
Law enforcement agencies conducted high visibility enforcement during the NHTSA Summer and Winter mobilizations. During these campaigns, officers conducted DUI checkpoints, roving DUI patrols, and DUI warrant/probation operations for those who failed to comply with court orders and habitual offenders identified as the worst-of-the-worst. Agencies also conducted ‘Buzzed Driving is Drunk Driving’ media efforts and DUI enforcement during Super Bowl Sunday, St. Patrick’s Day, Cinco de Mayo, Halloween, and other local festivals and events with identified DUI problems. Local and regional media efforts were coordinated focusing on the awareness of impaired driving and the affects of illicit drug use and prescription medication when combined with alcohol, the tragedy caused by one’s choice to drive impaired, and the importance of designating sober drivers.
ALCOHOL AND DRUG-IMPAIRED DRIVER VERTICAL PROSECUTION PROGRAM
OTS funded 26 grants that specialized in the prosecution of DUI offenders in which each case was handled by a single, specially trained, dedicated prosecutor from start to finish. Prosecution of alcohol and drug-impaired driving cases was improved as a result of the elevated skill and reputation of the dedicated prosecutors, better communication with law enforcement, and enhanced training for both attorneys and officers. The dedicated attorneys developed expertise that was recognized by judges and the defense bar. Recipients reported that sentences have improved as a result of attorneys’ ability to educate judges about DUI laws. The increased skills and abilities of the grant-funded
prosecutors trickled down to other deputies through mentoring and shared training, thus improving the results of all alcohol and drug-impaired driving cases. Streamlined communication between arresting officers and the attorneys handling the cases was a commonly mentioned benefit of these grants. Officers learned that they have a single point-person for alcohol and drug-impaired driving cases in the event of unique circumstances. Attorneys were able to identify any deficiencies in investigations or reports and communicate their needs to the officers. The communication and relationships were bolstered by the attorneys’ participation in DUI patrol ride-a-longs and attendance at checkpoints.
PROBATION DEPARTMENTS – INTENSIVE SUPERVISION OF DUI PROBATIONERS
California’s high-risk DUI probationers continue to be intensively supervised to ensure compliance with court-ordered terms and held accountable when falling short of compliance. Throughout FFY 2016, grants to 13 county probation departments (Butte, Contra Costa, Fresno, Kern, Los Angeles, Placer, Santa Barbara, Sacramento, San Diego, San Joaquin, San Bernardino, Solano, and Tulare) facilitated the supervision of rotating caseloads numbering more than 1,590 probationers. Probationers were required to complete alcohol education programs, keep regularly scheduled office appointments, and were subjected to random after-hours home searches that included alcohol testing. Many of the probation departments participated in DUI warrant service operations with local enforcement agencies within their counties. Intensive supervision compels the vast majority to adhere to their terms of probation; however, when probationers failed to comply they were held accountable.
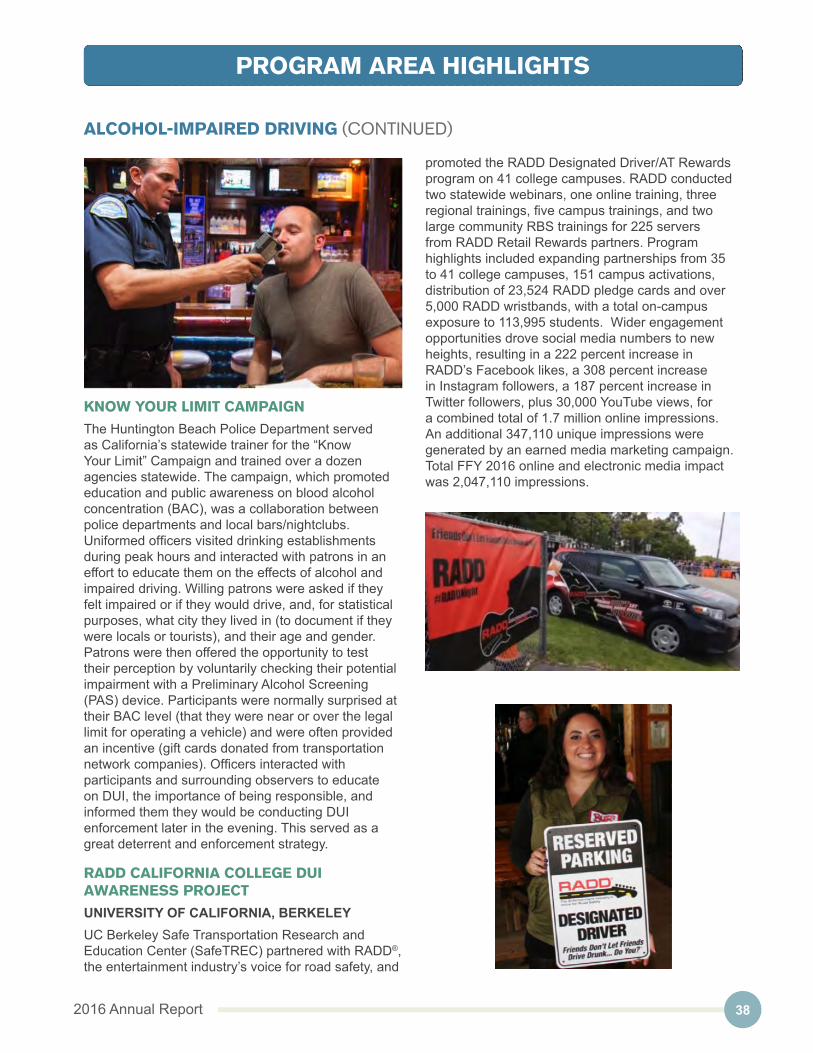
382016 Annual Report
PROGRAM AREA HIGHLIGHTS
ALCOHOL-IMPAIRED DRIVING (CONTINUED)
KNOW YOUR LIMIT CAMPAIGN
The Huntington Beach Police Department served as California’s statewide trainer for the “Know Your Limit” Campaign and trained over a dozen agencies statewide. The campaign, which promoted education and public awareness on blood alcohol concentration (BAC), was a collaboration between police departments and local bars/nightclubs. Uniformed officers visited drinking establishments during peak hours and interacted with patrons in an effort to educate them on the effects of alcohol and impaired driving. Willing patrons were asked if they felt impaired or if they would drive, and, for statistical purposes, what city they lived in (to document if they were locals or tourists), and their age and gender. Patrons were then offered the opportunity to test their perception by voluntarily checking their potential impairment with a Preliminary Alcohol Screening (PAS) device. Participants were normally surprised at their BAC level (that they were near or over the legal limit for operating a vehicle) and were often provided an incentive (gift cards donated from transportation network companies). Officers interacted with participants and surrounding observers to educate on DUI, the importance of being responsible, and informed them they would be conducting DUI enforcement later in the evening. This served as a great deterrent and enforcement strategy.
RADD CALIFORNIA COLLEGE DUI AWARENESS PROJECT
UNIVERSITY OF CALIFORNIA, BERKELEYUC Berkeley Safe Transportation Research and Education Center (SafeTREC) partnered with RADD®, the entertainment industry’s voice for road safety, and
promoted the RADD Designated Driver/AT Rewards program on 41 college campuses. RADD conducted two statewide webinars, one online training, three regional trainings, five campus trainings, and two large community RBS trainings for 225 servers from RADD Retail Rewards partners. Program highlights included expanding partnerships from 35 to 41 college campuses, 151 campus activations, distribution of 23,524 RADD pledge cards and over 5,000 RADD wristbands, with a total on-campus exposure to 113,995 students. Wider engagement opportunities drove social media numbers to new heights, resulting in a 222 percent increase in RADD’s Facebook likes, a 308 percent increase in Instagram followers, a 187 percent increase in Twitter followers, plus 30,000 YouTube views, for a combined total of 1.7 million online impressions. An additional 347,110 unique impressions were generated by an earned media marketing campaign. Total FFY 2016 online and electronic media impact was 2,047,110 impressions.

39 California Office of Traffic Safety
PROGRAM AREA HIGHLIGHTS
ALCOHOL-IMPAIRED DRIVING (CONTINUED)
TEEN CHOICES
CALIFORNIA HIGHWAY PATROLThe CHP provided the Every 15 Minutes (E15M) program, Sober Graduation events, and educational presentations to high schools, community based organizations, fire and health departments, and local law enforcement agencies throughout California. Statewide, uniformed CHP staff facilitated 165 E15M programs impacting over 133,000 students, 86 Sober Graduation events impacting over 20,000 students, and conducted 904 educational programs and presentations. In addition, educational materials emphasizing the consequences of drinking and driving were distributed.
MONTEREY COUNTY DUI COURT
MONTEREY COUNTY SUPERIOR COURTThe Monterey County Superior Court, in collaboration with its justice system and community partners, including Behavioral Health Probation and the District Attorney’s and Public Defender’s Offices, established a DUI Court that incorporated the ten key components of a drug court, as specified by the National Association of Drug Court Professionals Drug Court Standards Committee. Forty-five DUI offenders comprised of 31 males and 14 females, with a median age of 37, participated in the program. Sixty percent of the participants were second-time DUI offenders and 96 percent were gainfully employed. Of the 45 participants, all were completely compliant with program activities, several are headed to one year sobriety, and only two dropped from the program.
SAN JOAQUIN COUNTY DUI COURT PROGRAM
SAN JOAQUIN COUNTY SUPERIOR COURTThe San Joaquin County Superior Court continued an existing DUI Court Program designed to prohibit repeat DUI offenders from re-offending. The goal of the program was to reduce recidivism among impaired drivers thereby reducing alcohol and/or drug-involved collisions, injuries and fatalities. The DUI Court provided an intensive program utilizing judicial supervision, drug/alcohol testing, mandated treatment when needed, incentives and sanctions to make behavior changes, collaboration with local law enforcement, and conducted a multi-cultural awareness program. A total of 523 cases were active in the DUI Court program, and there have been 307 successful completions in 2016. Additionally, the San Joaquin County DUI Court was selected to serve as a model DUI Court for California’s Strategic Highway Safety Plan.
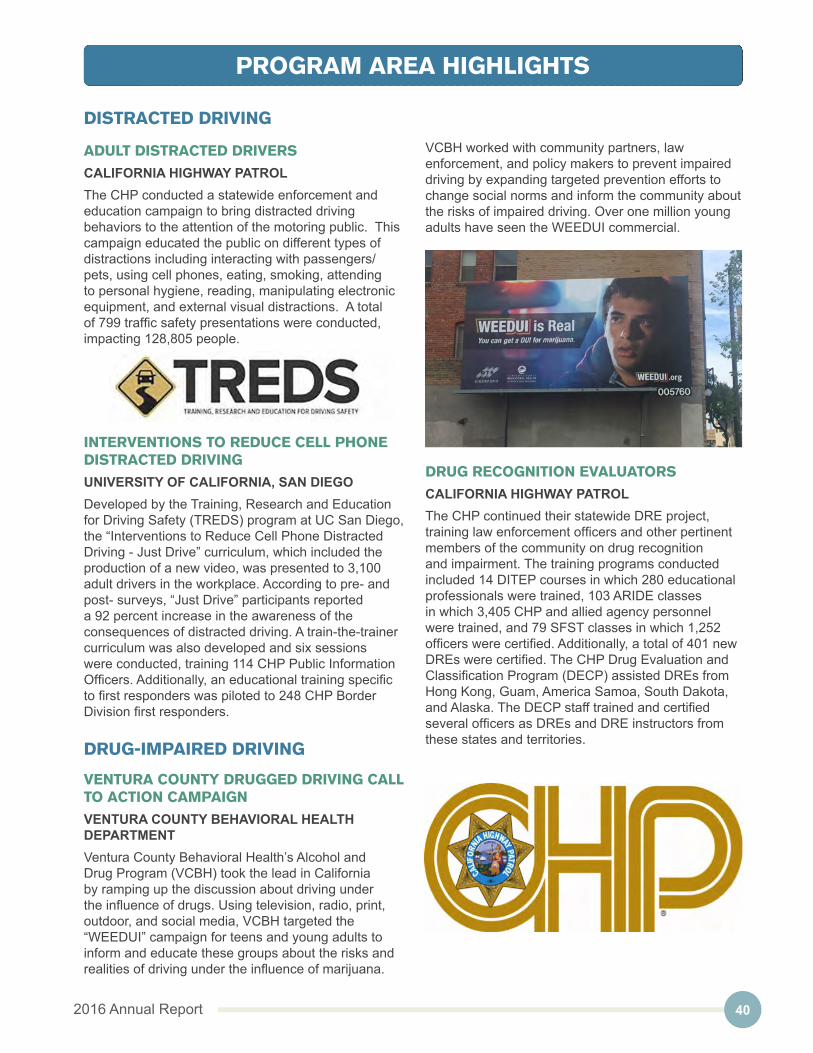
402016 Annual Report
PROGRAM AREA HIGHLIGHTS
ADULT DISTRACTED DRIVERS
CALIFORNIA HIGHWAY PATROLThe CHP conducted a statewide enforcement and education campaign to bring distracted driving behaviors to the attention of the motoring public. This campaign educated the public on different types of distractions including interacting with passengers/pets, using cell phones, eating, smoking, attending to personal hygiene, reading, manipulating electronic equipment, and external visual distractions. A total of 799 traffic safety presentations were conducted, impacting 128,805 people.
DISTRACTED DRIVING
INTERVENTIONS TO REDUCE CELL PHONE DISTRACTED DRIVING
UNIVERSITY OF CALIFORNIA, SAN DIEGODeveloped by the Training, Research and Education for Driving Safety (TREDS) program at UC San Diego, the “Interventions to Reduce Cell Phone Distracted Driving - Just Drive” curriculum, which included the production of a new video, was presented to 3,100 adult drivers in the workplace. According to pre- and post- surveys, “Just Drive” participants reported a 92 percent increase in the awareness of the consequences of distracted driving. A train-the-trainer curriculum was also developed and six sessions were conducted, training 114 CHP Public Information Officers. Additionally, an educational training specific to first responders was piloted to 248 CHP Border Division first responders.
DRUG-IMPAIRED DRIVING
VENTURA COUNTY DRUGGED DRIVING CALL TO ACTION CAMPAIGN
VENTURA COUNTY BEHAVIORAL HEALTH DEPARTMENTVentura County Behavioral Health’s Alcohol and Drug Program (VCBH) took the lead in California by ramping up the discussion about driving under the influence of drugs. Using television, radio, print, outdoor, and social media, VCBH targeted the “WEEDUI” campaign for teens and young adults to inform and educate these groups about the risks and realities of driving under the influence of marijuana.
VCBH worked with community partners, law enforcement, and policy makers to prevent impaired driving by expanding targeted prevention efforts to change social norms and inform the community about the risks of impaired driving. Over one million young adults have seen the WEEDUI commercial.
DRUG RECOGNITION EVALUATORS
CALIFORNIA HIGHWAY PATROLThe CHP continued their statewide DRE project, training law enforcement officers and other pertinent members of the community on drug recognition and impairment. The training programs conducted included 14 DITEP courses in which 280 educational professionals were trained, 103 ARIDE classes in which 3,405 CHP and allied agency personnel were trained, and 79 SFST classes in which 1,252 officers were certified. Additionally, a total of 401 new DREs were certified. The CHP Drug Evaluation and Classification Program (DECP) assisted DREs from Hong Kong, Guam, America Samoa, South Dakota, and Alaska. The DECP staff trained and certified several officers as DREs and DRE instructors from these states and territories.

41 California Office of Traffic Safety
PROGRAM AREA HIGHLIGHTS
EMERGENCY MEDICAL SERVICES
REGIONAL COLLISION RESPONSE AND EXTRICATION IMPROVEMENT PROGRAM
SHASTA COUNTY FIRE DEPARTMENTThe Shasta County Fire Department provided new extrication equipment for three fire stations in four communities. The department replaced 15 to 30 year-old extrication equipment in the communities of Montgomery Creek, Lakehead, and the unincorporated areas of Redding and Anderson. The outdated equipment was often unreliable or out-of-service due to its age and usage. The new extrication tools are lighter, stronger and faster, offer greater safety to emergency personnel, and are compatible with new vehicle technology. Ninety-six volunteer and paid firefighters were trained in the use of the new equipment and 185 volunteer and paid firefighters were trained in the treatment of trauma victims. Average extrication times decreased by eight minutes, largely due to the lighter weight and efficiency of the new tools. The decrease in extrication times allowed for more rapid treatment of victims, which in turn provided faster transport times to area hospitals.
MOTORCYCLE SAFETY
HAVE A GOOD RIDE
CALIFORNIA HIGHWAY PATROLThe CHP implemented a statewide project to reduce motorcycle-involved collisions and motorcyclist fatalities and injuries. To maximize enforcement efforts, each CHP division identified and concentrated on problematic routes within their respective areas where motorcycle-involved collisions were the highest. Strategies included 132 motorcycle safety presentations which impacted 163,933 people statewide, and during “Motorcycle Safety Awareness Month” field divisions conducted 15 highly publicized motorcycle safety enforcement operations. In addition, a statewide media campaign including radio, television, outdoor, and mall advertising was conducted.

422016 Annual Report
PROGRAM AREA HIGHLIGHTS
OCCUPANT PROTECTION
SafetyBeltSafe U.S.A.
PROTECTING CHILD PASSENGERS IN POMONA AND CALIFORNIA
POMONA POLICE DEPARTMENTThe Pomona Police Department partnered with SafteyBeltSafe U.S.A. to promote child passenger safety throughout Los Angeles County and statewide. Educational efforts included seven 5-Step Test events, one NHTSA-certified Child Passenger Safety Technician training, eight roll-call training sessions, and two educator workshops. The “Boosters Are For Big Kids” presentation was delivered to 283 children in 14 classes, and “Belt Fit Basics” was delivered to 248 children in eight classes. Also conducted were 22 community checkups, 26 CPS presentations, and 44 exhibits. The agency distributed 305 child restraints to low-income families and an additional 85 seats were properly fit. Outreach to pediatric nurses included establishing a new CPS Healthcare Listserv and webinar training courses designed specifically for nurses. The issue of children being injured and killed in DUI-related crashes, especially where the parents or care giver of the child was driving, continued to be highlighted through outreach to the media. Full services of the statewide toll-free Helpline in English and Spanish were available throughout the grant period.
TEEN DEFENSIVE DRIVING ANDPROACTIVE DRIVERS TRAINING
GLENDORA POLICE DEPARTMENTThe Glendora Police Department collaborated with BRAKES (Be Responsible and Keep Everyone Safe), Kia Motors, CHP, and local law enforcement to conduct 24 teen proactive driving courses in Orange, Los Angeles, San Bernardino, and San Diego counties to 753 teens and 810 parents. These behind-the-wheel courses conducted by professional driving instructors taught teens and their parents car control and recovery exercises in controlled environments. Doug Herbert, founder of BRAKES and a national drag racer who lost two sons in a tragic speed-involved crash, also made six educational presentations to 6,270 teens on the dangers of distracted driving, speed, and encouraged teens to be more conscientious and confident drivers.
VEHICLE OCCUPANT SAFETY PROGRAM
CALIFORNIA DEPARTMENT OF PUBLIC HEALTHCalifornia Governor Brown signed Assembly Bill 53 (Garcia, Statutes 292, Chaptered 2015) on September 21, 2015, requiring all children under two years old to ride rear facing in an appropriate child safety seat unless they are either 40 pounds or 40 inches tall, effective January 1, 2017. California is now one of four states in the country to address keeping children rear facing until at least two years old as recommended by the American Academy of Pediatrics. To help educate the public about the new rear facing law, the California Department of Public Health’s Vehicle Occupant Safety Program (VOSP) collaborated with OTS and other partners to develop, duplicate, and disseminate over 32,000 copies of

43 California Office of Traffic Safety
PROGRAM AREA HIGHLIGHTS
OCCUPANT PROTECTION (CONTINUED)
a “California Car Seat Law Changes” awareness poster. For CPS Week 2016, VOSP developed and distributed a CPS Parent Brochure which included all the details of the new law, described the optimal child restraint usage for all ages through age 16, and highlighted websites to provide parents and care givers with information on where to go to have child safety seats installed/inspected. In addition to educational materials, VOSP supported local CPS programs with sponsorship of National CPS Technician certification and recertification courses. As a result of VOSP support in FFY 2016, 14 CPS technician trainings were conducted resulting in 211 new certified technicians, and 10 continuing education opportunities were provided assisting 223 CPS technicians to keep or renew their certification. The result of this training is maintaining the pool of over 2,000 CPS technicians throughout the state.
PEDESTRIAN AND BICYCLE SAFETY
STATEWIDE OBSERVATIONAL RESTRAINT USAGE SURVEYS
CALIFORNIA STATE UNIVERSITY, FRESNOData was collected at 280 sites across the state and served as the official vehicle safety restraint survey for NHTSA and California. The safety restraint usage rate was 96.5 percent, meaning that only about 3.5 percent of drivers and front seat passengers were without safety restraints during the 2016 survey. This rate is slightly lower than the 2015 usage rate of 97.3 percent, but still remains one of the highest usage rates in the country. A Teen Safety Restraint Use Survey was also conducted which indicated a 96.4 percent usage rate, along with an Infant and Child Restraint Use Survey which revealed a 94.6 percent usage rate. The Teen and Infant and Child surveys were both up slightly from 2015 usage rates.
SAN FRANCISCO VISION ZERO PEDESTRIAN AND BICYCLE SAFETY PROJECT
SAN FRANCISCO DEPARTMENT OF PUBLIC HEALTHThe San Francisco Department of Public Health partnered with Vision Zero SF, an initiative to eliminate all traffic fatalities by 2024, and implemented the SF Vision Zero Pedestrian and Bicycle Safety Project. The department developed Vision Zero materials specific for seniors and conducted presentations at 16 senior centers, reaching 465 older adults. As part of the Safe Routes to School program, the department created and distributed back-to-school traffic safety materials to students and their families, reaching 35 schools and 16,700 families. Walk San Francisco and the SF Bicycle Coalition created a Vision Zero enforcement curriculum and trained 65 captains and lieutenants at all 10 SF Police Department stations. SF Municipal Transportation Agency (SFMTA) designed and displayed Vision Zero posters in four parking garages to highlight the issue of speeding in neighborhoods. These posters reminded drivers returning to their cars that as they leave the garage, they are driving through communities in which people live. SFMTA also revised their school traffic safety and traffic calming policies to prioritize capital projects near schools, senior centers, and other areas that serve vulnerable populations.

442016 Annual Report
PEDESTRIAN AND BICYCLE SAFETY
PROGRAM AREA HIGHLIGHTS
PEDESTRIAN AND BICYCLE SAFETY (CONTINUED)
BICYCLE SAFETY EDUCATION
LONG BEACH DEPARTMENT OF HEALTH AND HUMAN SERVICESThe Long Beach Department of Health and Human Services provided bicycle safety education to families in high bicycle collision neighborhoods. Thirteen workshops were held throughout city parks, libraries, and schools. A total of 391 people of all ages received up to four hours of bicycle safety education. During the workshops, 380 bicycle safety helmets were distributed and properly fitted and 321 sets of bike lights were distributed. Participant questionnaires demonstrated that 99 percent of respondents felt safer riding their bike as a result of the workshop, and 100 percent of participants learned how to properly fit a helmet.
PEDESTRIAN AND BICYCLE SAFETY PROGRAM
SACRAMENTO COUNTY OFFICE OF EDUCATIONThe Sacramento County Office of Education, Prevention & Student Services Department, in collaboration with the Safety Center Incorporated, UC Davis Health Programs, and local law enforcement agencies, joined together to implement a countywide project to increase pedestrian and bicyclist safety in selected Sacramento County middle schools. The project focused on safety awareness, school involvement, and parent and student education. Nineteen bicycle and pedestrian school safety events were held impacting 6,726 people; 585 handouts were distributed specifically to parents; 227 parents signed a pledge indicating they would encourage safe practices at home; three community traffic safety/bicycle rodeos were held impacting 7,104 people; and 515 bicycle helmets were distributed and properly fitted to youth in need of a helmet. Post survey results demonstrated changes in the safety
behaviors of students riding bicycles and increases in helmet usage were observed at several school sites. Substantial reductions in unsafe pedestrian behaviors were noted in the areas of not obeying traffic signs/signs, not walking on sidewalks, and unsafe drop-off practices.

45 California Office of Traffic Safety
PROGRAM AREA HIGHLIGHTS
PEDESTRIAN AND BICYCLE SAFETY (CONTINUED)
SAFETY ASSESSMENTS FOR CALIFORNIA COMMUNITIES
UNIVERSITY OF CALIFORNIA, BERKELEYThe Technology Transfer Program (Tech Transfer) of the Institute of Transportation Studies at UC Berkeley merged the Traffic Safety Assessment, Pedestrian Safety Assessment, and Bicycle Safety Assessment into one Complete Streets Safety Assessment (CSSA). Tech Transfer experts focused on pedestrian and bicycle safety by marketing the safety assessment services to more populated and urban communities with high pedestrian and bicycle collision rates and prioritized the incoming requests from communities based on their OTS pedestrian and bicycle collision rankings. Each study was performed by two experts in traffic engineering/planning/enforcement, and included field observations of high collision intersections and corridors and analysis of existing data including SWITRS. Tech Transfer experts conducted 12 CSSA studies (Berkeley, La Habra, La Mesa, Long Beach, Modesto, Sacramento, San Francisco, San Jose, Santa Cruz, South San Francisco, Stanton, and Turlock) and delivered a detailed technical report for each local agency documenting their findings and suggestions for citywide as well as corridor/intersection specific improvements.
COMMUNITY PEDESTRIAN AND BICYCLE SAFETY TRAINING PROJECT
UNIVERSITY OF CALIFORNIA, BERKELEYThe UC Berkeley SafeTREC Program and their traffic safety partners provided four Community Pedestrian Safety Training (CPST) programs (El Monte, Los Angeles [Chinatown], Modesto and Shasta Lake), a four-hour education and community-based workshop on pedestrian safety best practices, walkability, and community engagement. While all trainings broadly focused on communities, one training featured safety on roads near schools and another focused on seniors. Trainings were delivered in English, Spanish and Chinese, and reached 180 people.

462016 Annual Report
PROGRAM AREA HIGHLIGHTS
SELECTIVE TRAFFIC ENFORCEMENT PROGRAM (STEP) GRANTS
OTS awarded 150 STEP grants in FFY 2016. Law enforcement agencies throughout the state conducted enforcement activities that coincided with NHTSA mobilizations and campaigns. STEP activities focused on high visibility enforcement (HVE), increased traffic enforcement, and education. Training included SFST, ARIDE, and DRE. Agencies utilized the trainings to conduct DUI/Drivers License checkpoints and DUI saturation patrols. Increased traffic enforcement activities included operations focusing on distracted driving, nighttime Click-It-or-Ticket, motorcycle safety, and pedestrian and bicycle safety. Education activities included presentations to communities, organizations, and schools. Media efforts focusing on the awareness of the STEP activities were coordinated both regionally and locally.
KEEPING EVERYONE SAFE
CALIFORNIA HIGHWAY PATROLThe CHP implemented a statewide project to address the need for established safety and mobility programs for older drivers to prevent traffic injuries and fatalities. The project promoted the establishment of multidisciplinary community-based collaborative groups who assessed safety and mobility issues and made recommendations to address the needs of the senior driving community. The collaborative groups included members from public and private organizations including law enforcement personnel, health and aging professionals, transportation agency representatives, and other stakeholders. The CHP also partnered with the DMV to educate the motoring public with specific emphasis on older drivers. A total of 473 senior driver traffic safety presentations were conducted, impacting 21,666 people.
POLICE TRAFFIC SERVICESREDUCE AGGRESSIVE DRIVING
CALIFORNIA HIGHWAY PATROL The CHP conducted a statewide traffic safety project focusing on speed-caused collisions and those primary collision factors that have elements of “aggressive driving” such as unsafe turns, following too closely, unsafe passing, driving on the wrong side of the road, and unsafe lane changes. Operations consisted of enhanced enforcement in conjunction with radar trailers, scheduled statewide enforcement operations, and 706 traffic safety presentations which impacted 156,520 people. The CHP also continued to monitor sideshows and street racing locations statewide. CHP officers issued 6,950 citations and 2,335 verbal warnings, provided 1,555 motorist assists, and aided 690 disabled motorists during enforcement operations.

47 California Office of Traffic Safety
GIS-BASED COUNTYWIDE TRAFFIC COLLISION RECORDS SYSTEM
RIVERSIDE COUNTY TRANSPORTATION DEPARTMENTThe Riverside County Transportation Department developed MOUs with all 28 incorporated cities within the county and outlined a framework of conditions on which agencies collaborated to establish a countywide collision records database. Software, installation, and training were provided for the county Traffic Engineering Division and police and public works departments at each of the participating cities. The completed database now facilitates the sharing of data to direct decision-making and prioritization of resources for safety improvements to reduce fatalities, injuries and property damage. The system also allows the county and cities to compare regional trends to consider solutions that require coordination among agencies.
CRASH MEDICAL OUTCOMES DATA
CALIFORNIA DEPARTMENT OF PUBLIC HEALTHThe CDPH’s Crash Medical Outcomes Data (CMOD) Project built data linkage between crash (i.e., SWITRS) and medical (i.e., hospital and emergency department) data. The CMOD project leveraged its existing expertise and resources to improve data quality and access by sharing data and knowledge with partner agencies. Activities included conducting and disseminating an analysis of “serious injuries” using CMOD linked crash and hospital data, coordinating the EMS/Injury Surveillance section of the 2016 Traffic Records Assessment, conducting data linkages with EMS and trauma data and providing epidemiologic support, producing and disseminating a fact sheet on drug presence in fatal motor vehicle collisions, and creating and conducting a survey of local health department data needs for traffic-related crashes/injuries.
PROGRAM AREA HIGHLIGHTS
TRAFFIC RECORDS/ROADWAY SAFETYTRAFFIC SAFETY CULTURE SURVEY
UNIVERSITY OF CALIFORNIA, BERKELEY The UC Berkeley SafeTREC assisted OTS in developing a Traffic Safety Culture (TSC) pilot survey to test questions related to TSC that have not been asked in previous surveys, as well as to begin obtaining feedback. Both an intercept and online survey were administered to test a selected list of questions related to driving after consuming marijuana and prescription drugs, pedestrians, bicyclists, and Toward Zero Deaths concepts. The results from both surveys generated important insights that can be used to design broader survey instruments to better understand California’s TSC. Given the small sample size used for this pilot, further work is required in order to generalize findings about TSC in California.

482016 Annual Report
APPENDIX - GRANT EXPENDITURES
ALCOHOL-IMPAIRED DRIVINGEnforcement, Education, and Public Information - These grants funded the continued focus on traffic safety through enforcement, training for law enforcement personnel and alcohol retailers, and public education through outreach.
Grant # Agency Fund Awarded Expended
AL1612 California Highway Patrol 164AL $5,675,000 $5,143,257.61 AL1655 California Highway Patrol 405d AL $250,000 $225,454.68 AL1614 California Department of Alcoholic Beverage Control 164AL $2,000,000 $1,673,089.66 AL1615 California Department of Alcoholic Beverage Control 405d AL $577,821 $494,673.32
College and Younger Age Youth Programs - These grants funded alcohol education and awareness programs, which focused on middle school through college age students. DUI prevention programs for high schools and university campuses also addressed the use of seat belts, bicycle, and pedestrian safety.
Grant # Agency Fund Awarded Expended
AL1603 Shasta County Public Health 405b OP $146,043 $130,723.99
AL1604 Riverside County 405b OP $168,768 $162,579.89 AL1607 The Regents of the University of California, Berkeley Campus 405d AL $985,000 $667,035.36 AL1609 Tulare County 405d AL $464,000 $448,706.80 AL1610 California Highway Patrol 164AL $1,500,000 $1,339,821.27 AL1617 Bakersfield 405d AL $24,133 $9,063.22
Judicial Support and Legal Process - These DUI courts provided intensive judicial supervision, periodic alcohol/drug testing, mandated treatment where needed, and the use of incentives and sanctions to make behavior changes.
Grant # Agency Fund Awarded Expended
AL1602 Monterey County 164AL $350,000 $233,313.95
AL1606 Sacramento County 405d AL $950,000 $807,665.18
AL1618 San Joaquin County 405d AL $748,000 $648,708.08
Evaluation - These grants funded the enhancement of the DMV Hot List program and a process evaluation of the Vertical Prosecution program.
Grant # Agency Fund Awarded Expended
AL1608 California Department of Motor Vehicles 408TR $106,545 $93,081.23
AL1616 California Department of Motor Vehicles 410 $174,000 $137,724.86
Testing Equipment – This grant funded evidential breath alcohol analyzers in Sacramento County.
Grant # Agency Fund Awarded Expended
AL1605 Sacramento County 164AL $118,827 $118,617.11
Multiple DUI Warrant Services and Supervisory Probation Programs - These grants funded county probation departments to monitor the worst-of-the-worst, high-risk, felony, and repeat DUI offenders through intensive supervision.
Grant # Agency Fund Awarded Expended
AL1613 California Highway Patrol 405d AL $350,000 $312,343.88
AL1640 Fresno County 164AL $364,000 $322,356.16
AL1643 Santa Barbara County 164AL $142,000 $131,970.52
AL1644 Butte County 164AL $196,400 $172,354.00
AL1645 Contra Costa County 164AL $327,000 $310,341.27
AL1646 Placer County 164AL $85,500 $78,685.84
AL1647 San Diego County 405d AL $480,498 $407,310.55

49 California Office of Traffic Safety
APPENDIX - GRANT EXPENDITURES
AL1648 San Bernardino County 164AL $480,000 $433,115.74
AL1649 Sacramento County 164AL $410,000 $396,632.84
AL1650 Los Angeles County 405d AL $315,000 $313,896.59
AL1651 Tulare County 164AL $83,000 $77,142.53
AL1652 San Joaquin County 164AL $155,600 $149,932.43
AL1653 Kern County 164AL $154,000 $152,988.12
AL1654 Solano County 164AL $260,000 $250,339.14
Multi-Agency “Avoid DUI” Campaigns - These grants funded law enforcement agencies to conduct DUI enforcement activities during the NHTSA Winter and Summer Mobilizations and sustained enforcement during other holiday periods associated with identified DUI problems.
Grant # Agency Fund Awarded Expended
AL1619 Visalia 164AL $180,000 $90,054.34
AL1620 Hayward 164AL $240,000 $223,577.16
AL1621 Siskiyou County 164AL $50,000 $45,439.80
AL1622 Capitola 164AL $60,000 $18,784.86
AL1623 Paradise 164AL $60,000 $39,169.92
AL1624 West Sacramento 164AL $140,000 $86,219.92
AL1625 Napa 164AL $150,000 $103,846.13
AL1626 Marysville 164AL $85,000 $54,296.77
AL1627 Santa Rosa 164AL $165,000 $138,551.12
AL1628 San Rafael 164AL $235,000 $180,791.05
AL1629 Clovis 164AL $270,800 $228,181.87
AL1630 Santa Clara County 164AL $279,070 $233,134.19
AL1631 Auburn 164AL $78,000 $34,659.81
AL1632 Daly City 164AL $177,000 $150,679.62
AL1633 Vacaville 164AL $220,000 $182,291.99
AL1634 Merced 164AL $75,000 $44,130.88
AL1635 Stanislaus County 164AL $198,000 $29,239.33
AL1636 El Dorado County District Attorney 164AL $85,000 $40,936.17
AL1637 Sacramento 164AL $215,000 $146,003.71
AL1638 Salinas 164AL $257,000 $186,877.08
AL1639 Contra Costa County 164AL $150,000 $109,888.08
AL1642 Stockton 164AL $345,000 $212,782.58
Total $21,756,005 $18,422,462.20
Grant # Agency Fund Awarded Expended

502016 Annual Report
APPENDIX - GRANT EXPENDITURES
DISTRACTED DRIVINGEnforcement, Public Education, and Public Information - These grants funded statewide public information, education, and a media campaign focusing on the dangers of distracted driving, texting, and using a cell phone while driving, with an emphasis toward teens and adults. Education was also provided to employees in city/county government, private corporations, and educational institutions.
Grant # Agency Fund Awarded Expended
DD1601 California Highway Patrol 402DD $200,000 $160,921.80
DD1603 California Highway Patrol 402DD $750,000 $693,205.83
DD1604 University of California, San Diego 405bDD $200,000 $109,955.06
Evaluation - This grant funded an evaluation of driving records of drivers convicted of cell phone law violations.
Grant # Agency Fund Awarded Expended
DD1602 California Department of Motor Vehicles 402DD $75,000 $43,433.33
Total $1,225,000 $1,007,516.02
DRUG-IMPAIRED DRIVINGTraining - These grants funded basic and instructor SFST, ARIDE, and DRE training and cerification to law enforcement officers and DITEP training to educational professionals.
Grant # Agency Fund Awarded Expended
DI1628 California Highway Patrol 405d AL $1,500,000 $1,386,529.30
DI1629 Ventura County 405d AL $243,965 $45,904.21
Public Awareness - This grant funded a public awareness and education campaign on the dangers of drug-impaired driving, including illicit, prescription, and over-the-counter drugs, and in combination with alcohol.
Grant # Agency Fund Awarded Expended
DI1630 Ventura County 405d AL $299,677 $275,244.28
Equipment – This grant funded equipment directly related to drug-impaired training and detection to assist in bolstering the DRE program.
Grant # Agency Fund Awarded Expended
DI1627 California Department of Justice 405d AL $551,790 $483,080.62
DUID Vertical Prosecution - These grants funded statewide training for county prosecutors and law enforcement agencies, vertical prosecution grants, and a Vehicular Homicide & Drug-Impaired Prosecution Seminar.
Grant # Agency Fund Awarded Expended
DI1601 El Dorado County 405d AL $361,506 $360,669.26
DI1602 Shasta County 405d AL $260,582 $236,741.54
DI1603 Marin County 405d AL $388,726 $388,710.79
DI1604 Monterey County 405d AL $414,312 $396,962.37
DI1605 Calaveras County 405d AL $160,788 $158,712.92
DI1606 Kern County 405d AL $426,404 $426,404.00
DI1607 Sonoma County 405d AL $421,315 $391,362.58
DI1608 Stanislaus County 405d AL $333,069 $317,515.61
DI1609 Placer County 405d AL $332,469 $325,278.68
DI1610 Fresno County 405d AL $717,150 $705,303.94
DI1611 Yolo County 405d AL $186,012 $186,012.00
DI1612 Sacramento County164AL $250,000 $249,094.67
405d AL $705,695 $646,054.81
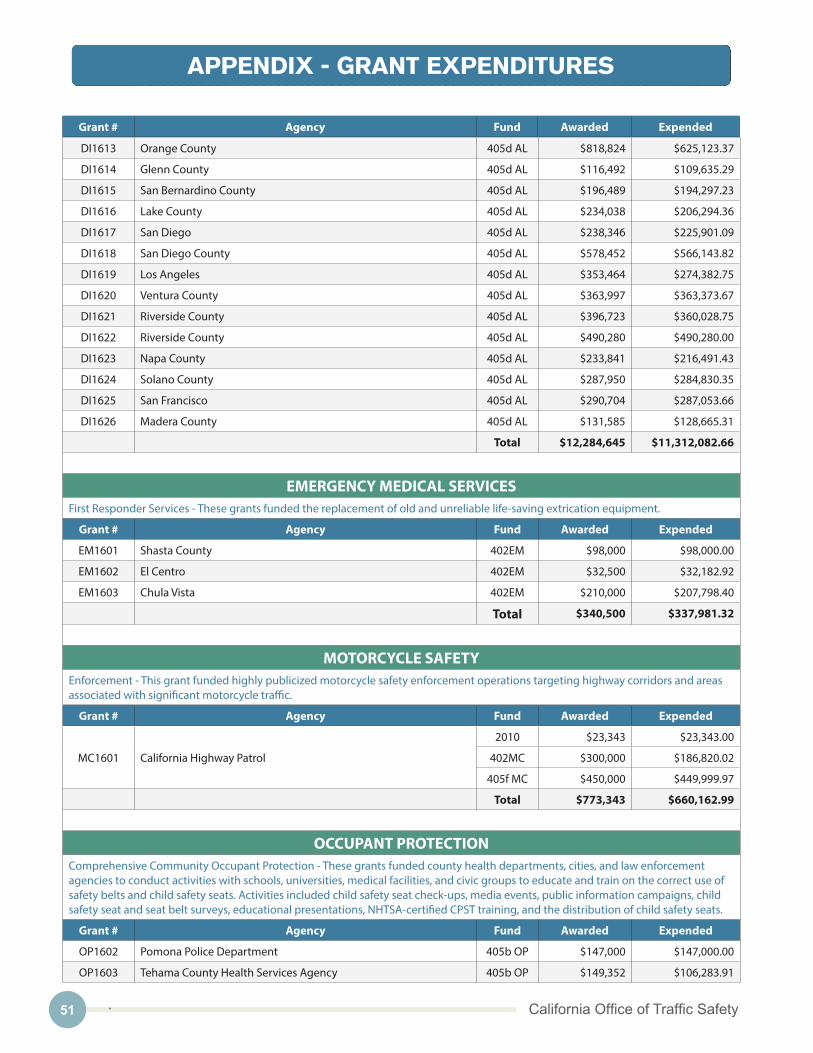
51 California Office of Traffic Safety
APPENDIX - GRANT EXPENDITURES
Grant # Agency Fund Awarded Expended
DI1613 Orange County 405d AL $818,824 $625,123.37
DI1614 Glenn County 405d AL $116,492 $109,635.29
DI1615 San Bernardino County 405d AL $196,489 $194,297.23
DI1616 Lake County 405d AL $234,038 $206,294.36
DI1617 San Diego 405d AL $238,346 $225,901.09
DI1618 San Diego County 405d AL $578,452 $566,143.82
DI1619 Los Angeles 405d AL $353,464 $274,382.75
DI1620 Ventura County 405d AL $363,997 $363,373.67
DI1621 Riverside County 405d AL $396,723 $360,028.75
DI1622 Riverside County 405d AL $490,280 $490,280.00
DI1623 Napa County 405d AL $233,841 $216,491.43
DI1624 Solano County 405d AL $287,950 $284,830.35
DI1625 San Francisco 405d AL $290,704 $287,053.66
DI1626 Madera County 405d AL $131,585 $128,665.31
Total $12,284,645 $11,312,082.66
EMERGENCY MEDICAL SERVICESFirst Responder Services - These grants funded the replacement of old and unreliable life-saving extrication equipment.
Grant # Agency Fund Awarded Expended
EM1601 Shasta County 402EM $98,000 $98,000.00
EM1602 El Centro 402EM $32,500 $32,182.92
EM1603 Chula Vista 402EM $210,000 $207,798.40
Total $340,500 $337,981.32
MOTORCYCLE SAFETYEnforcement - This grant funded highly publicized motorcycle safety enforcement operations targeting highway corridors and areas associated with significant motorcycle traffic.
Grant # Agency Fund Awarded Expended
MC1601 California Highway Patrol
2010 $23,343 $23,343.00
402MC $300,000 $186,820.02
405f MC $450,000 $449,999.97
Total $773,343 $660,162.99
OCCUPANT PROTECTIONComprehensive Community Occupant Protection - These grants funded county health departments, cities, and law enforcement agencies to conduct activities with schools, universities, medical facilities, and civic groups to educate and train on the correct use of safety belts and child safety seats. Activities included child safety seat check-ups, media events, public information campaigns, child safety seat and seat belt surveys, educational presentations, NHTSA-certified CPST training, and the distribution of child safety seats.
Grant # Agency Fund Awarded Expended
OP1602 Pomona Police Department 405b OP $147,000 $147,000.00
OP1603 Tehama County Health Services Agency 405b OP $149,352 $106,283.91

522016 Annual Report
APPENDIX - GRANT EXPENDITURES
Grant # Agency Fund Awarded Expended
OP1604 Yuba City Police Department 405b OP $154,775 $109,683.36
OP1605 Butte County Public Health 405b OP $128,881 $111,231.20
OP1606 San Diego County 402OP $250,000 $249,251.00
OP1608 Los Angeles Housing and Community Investment Department 402OP $472,000 $449,257.87
OP1609 Riverside County Department of Public Health 405b OP $250,000 $232,420.30
OP1611 Stanislaus County Department of Public Health 405b OP $84,000 $7,671.33
OP1613 Lake County Fire Protection District 405b OP $70,298 $49,245.96
OP1615 Oxnard Fire Department 405b OP $48,000 $38,115.08
OP1617 Rancho Cordova, Sacramento County Sheriff's Department 405b OP $190,775 $186,918.56
405d AL $44,225 $38,076.58
Statewide Enforcement and Education - These grants funded statewide activities including child safety seat check-ups, media events, public information campaigns, child safety seat and seat belt surveys, educational presentations, NHTSA-certified CPST training, and the distribution of child safety seats.
Grant # Agency Fund Awarded Expended
OP1607 California Highway Patrol 405b OP $800,000 $685,886.54
OP1610 California Department of Public Health 405b OP $357,954 $344,906.65
Statewide Usage Surveys - This grant funded the statewide observational seat belt and child safety seat usage rates.
Grant # Agency Fund Awarded Expended
OP1601 California State University, Fresno 405b OP $277,000 $265,013.49 Older Drivers - This grant funded training and public awareness to the community and stakeholders related to older drivers.
Grant # Agency Fund Awarded Expended
OP1616 University of California, San Diego 405b OP $350,000 $210,902.05 Public Awareness – This grant funded a work zone safety public awareness campaign and its impact.
Grant # Agency Fund Awarded Expended
OP1612 California Department of Transportation 402PM $750,000 $750,000.00
Teens – This grant funded teen proactive driving workshops for teens and parents in Los Angeles, San Bernardino, and Orange Counties.
Grant # Agency Fund Awarded Expended
OP1614 Glendora Police Department 405b OP $153,000 $151,958.00
Total $4,677,260 $4,133,821.88
PROGRAM ADMINISTRATIONProgram Administration - These grants funded activities and costs attributed to the overall management and operation of OTS, including traffic safety problem identification; prioritizing problems and distribution of funds; developing the HSP and AR; developing, monitoring, and evaluating grants; conducting audits; participating on traffic safety committees and task forces; and promoting traffic safety in California.
Grant # Agency Fund Awarded Expended
PA1601 California Office of Traffic Safety 402 $2,992,475 $1,991,874.54
PA1602 California Office of Traffic Safety 164AL $3,393,220 $1,120,161.20
PA1603 California Office of Traffic Safety 2010 $2,348 $1,460.09
PA1604 California Office of Traffic Safety 405b $565,797 165,749.29

53 California Office of Traffic Safety
APPENDIX - GRANT EXPENDITURES
Grant # Agency Fund Awarded Expended
PA1605 California Office of Traffic Safety 405c $324,764 $72,523.15
PA1606 California Office of Traffic Safety 405d $1,557,311 $400,228.73
PA1607 California Office of Traffic Safety 405f $39,911 $7,336.30
PA1608 California Office of Traffic Safety 408 $107,995 $70,302.19
PA1609 California Office of Traffic Safety 410 $15,651 $5,784.35
Total $8,999,472 $3,835,419.84
PEDESTRIAN AND BICYCLE SAFETYPedestrian and Bicycle Safety - These grants funded pedestrian and bicycle safety throughout the school system and local communities. Activities included traffic safety rodeos, workshops, helmet distribution, and increased enforcement around schools.
Grant # Agency Fund Awarded Expended
PS1601 Gilroy Police Department 405b OP $30,000 $18,368.69
PS1603 Santa Cruz County Health Services Agency 405b OP $284,344 $271,980.64
PS1604 City of Santa Maria 402PS $50,000 $36,872.96
PS1605 San Luis Obispo County Public Health Department
402PS $120,500 $113,519.90
405b OP $15,663 $13,040.22
405d AL $71,572 $69,652.75
PS1607 San Diego County Health and Human Services Agency 402PS $120,000 $116,181.82
PS1608 Sacramento Police Department 405b OP $179,900 $115,403.26
PS1609 California Highway Patrol 402PS $300,000 $285,649.35
PS1610 Riverside County Department of Public Health 402PS $204,498 $181,427.41
PS1611 Daly City Police Department 405b OP $77,600 $77,600.00
PS1613 Sacramento County Office of Education, Prevention & Student Services Department
405b OP $160,000 $136,813.88
PS1614 City of Monterey 405b OP $110,000 $101,470.17
PS1617 Santa Monica Police Department 402PS $57,000 $36,773.73
PS1618 Palo Alto Police Department 405b OP $67,660 $33,706.69
PS1619 Bakersfield Police Department 402PS $62,355 $50,654.43
PS1620 Standard School District 402PS $113,450 $72,832.89
PS1621 Santa Ana Public Works Agency 402PS $100,000 $99,934.33
PS1622 San Francisco Department of Public Health 405b OP $200,000 $154,148.00
PS1624 Los Angeles County Metropolitan Transportation Authority 402PS $550,000 $296,953.00
PS1625 University of California, San Diego 402PS $150,000 $81,840.92
PS1626 Long Beach Department of Health and Human Services 402PS $150,000 $148,632.71
PS1627 Lathrop Police Department
164AL $13,600 $12,492.30
402PT $13,400 $12,334.24
405b OP $3,000 $2,413.94
PS1628 Clovis Police Department 405b OP $90,840 $80,452.31

542016 Annual Report
Statewide Pedestrian and Bicycle Safety - These grants funded teams of transportation professionals to identify pedestrian problems and solutions to improve pedestrian environments. Activities included the development of pedestrian safety action plans, community training, coordinated safety planning, community pedestrian safety assessments, and educational presentations.
Grant # Agency Fund Awarded Expended
PS1615 The Regents of the University of California, Berkeley Campus 402PS $100,000 $69,406.69
PS1616 The Regents of the University of California, Berkeley Campus 402PS $150,000 $84,236.22
PS1623 The Regents of the University of California, Berkeley Campus 405b OP $280,000 $136,271.81
Total $3,825,382 $2,911,065.26
POLICE TRAFFIC SERVICESProgram Development and Administrative Coordination - This grant funded grant administration work for CHP projects.
Grant # Agency Fund Awarded Expended
PT16150 California Highway Patrol164AL $175,003.50 $158,303.41
402PT $175,003.50 $169,631.73
Selective Traffic Enforcement and Education Program - These grants funded overtime for increased enforcement and educational efforts. Activities included DUI checkpoints, DUI saturation patrols, warrant details, court stings, motorcycle safety operations, distracted driving operations, seat belt enforcement, and traffic enforcement operations targeting the primary collision factors.
Grant # Agency Fund Awarded Expended
PT1600 Alhambra164AL $76,000 $67,502.02
402PT $66,000 $55,770.67
PT1601 Irvine164AL $271,592 $181,788.47
402PT $150,000 $127,107.31
PT1602 Santa Barbara County164AL $81,500 $57,471.75
402PT $30,500 $27,465.31
PT1603 Glendora164AL $185,000 $162,447.45
402PT $35,000 $25,772.61
PT1604 San Francisco164AL $120,000 $108,846.59
405b OP $135,000 $103,249.41
PT1605 Arroyo Grande164AL $31,000 $12,916.42
402PT $19,000 $483.05
PT1606 Ontario164AL $400,000 $396,547.71
402PT $110,000 $105,812.40
PT1607 Claremont164AL $48,500 $43,639.26
402PT $49,700 $40,139.08
PT1608 Rohnert Park164AL $33,580 $20,845.04
402PT $91,420 $68,466.45
PT1609 Petaluma164AL $85,462 $53,637.21
402PT $104,538 $76,708.65
PT1610 Hayward164AL $41,000 $38,315.64
402PT $46,000 $42,817.24
PT1611 Palm Springs164AL $65,310 $53,253.30
402PT $86,112 $49,385.44
APPENDIX - GRANT EXPENDITURES

55 California Office of Traffic Safety
APPENDIX - GRANT EXPENDITURES
Grant # Agency Fund Awarded Expended
PT1612 Fairfield164AL $111,082 $110,372.44
402PT $140,918 $139,044.34
PT1613 Gilroy164AL $50,880 $30,053.96
402PT $49,120 $33,424.85
PT1614 Orange164AL $173,705 $162,703.50
402PT $51,295 $36,174.24
PT1615 Anaheim164AL $264,038 $147,479.75
402PT $121,142 $50,502.64
PT1616 Redondo Beach164AL $94,000 $55,753.49
402PT $56,000 $51,775.24
PT1617 Fortuna164AL $65,000 $16,371.61
402PT $25,000 $11,609.83
PT1618 Marina 405b OP $60,000 $56,110.39
PT1619 Marin County164AL $20,083 $20,081.00
402PT $149,917 $142,647.55
PT1620 Tustin164AL $49,840 $42,371.40
402PT $13,560 $10,041.98
PT1621 Pasadena164AL $190,000 $152,457.30
402PT $119,000 $113,541.90
PT1622 Sanger 402PT $25,000 $17,508.23
PT1623 Rialto164AL $115,702 $112,907.05
402PT $86,368 $85,406.15
PT1624 El Monte164AL $90,000 $89,491.87
402PT $81,000 $81,000.00
PT1625 Hollister164AL $17,740 $11,577.65
402PT $43,760 $18,266.24
PT1626 Chula Vista
164AL $300,000 $298,351.56
402PT $150,000 $145,150.45
405d AL $29,000 $0.00
PT1627 Turlock164AL $39,500 $20,287.90
402PT $29,500 $19,103.24
PT1628 Burbank164AL $30,000 $14,405.76
402PT $20,000 $15,867.33
PT1629 Redding164AL $92,418 $71,521.35
402PT $122,292 $108,308.04
PT1630 Upland164AL $43,808 $41,190.23
402PT $75,086 $42,183.79
PT1631 Newport Beach164AL $295,000 $265,655.89
402PT $68,740 $57,283.02

562016 Annual Report
APPENDIX - GRANT EXPENDITURES
Grant # Agency Fund Awarded Expended
PT1632 South Gate164AL $61,000 $52,831.30
402PT $66,000 $42,171.26
PT1633 San Bernardino164AL $162,977 $141,208.04
402PT $87,023 $79,893.39
PT1634 La Habra164AL $99,000 $86,999.98
402PT $55,000 $50,720.37
PT1635 Manteca164AL $48,408 $38,113.67
402PT $65,287 $65,284.84
PT1636 Concord164AL $67,478 $61,964.81
402PT $108,522 $85,589.33
PT1637 Marysville164AL $21,450 $20,085.98
402PT $57,000 $49,444.92
PT1638 Culver City164AL $60,000 $48,857.25
402PT $55,000 $44,048.36
PT1639 Lompoc164AL $70,500 $47,564.34
402PT $64,500 $61,318.02
PT1640 Murrieta164AL $70,351 $57,634.87
402PT $65,482 $58,214.30
PT1641 South Lake Tahoe164AL $20,228 $16,788.60
402PT $15,272 $4,054.49
PT1642 Hemet164AL $44,833 $29,927.62
402PT $90,000 $60,143.45
PT1643 Fresno164AL $550,000 $528,410.69
402PT $150,000 $148,359.55
PT1644 Lodi164AL $89,000 $75,253.98
402PT $32,400 $18,381.75
PT1645 El Cajon164AL $58,582 $45,519.52
402PT $57,783 $47,174.62
PT1646 Atwater164AL $48,500 $26,674.08
402PT $13,000 $9,368.96
PT1647 Visalia164AL $142,500 $126,007.03
402PT $66,000 $63,885.95
PT1648 Orange County164AL $334,141 $307,333.55
402PT $90,187 $81,353.49
PT1649 Huntington Beach164AL $380,711 $330,310.76
402PT $119,289 $118,391.60
PT1650 Downey164AL $78,000 $72,052.62
402PT $91,000 $89,304.00
PT1651 San Jose164AL $176,551 $87,665.39
402PT $83,449 $43,034.28
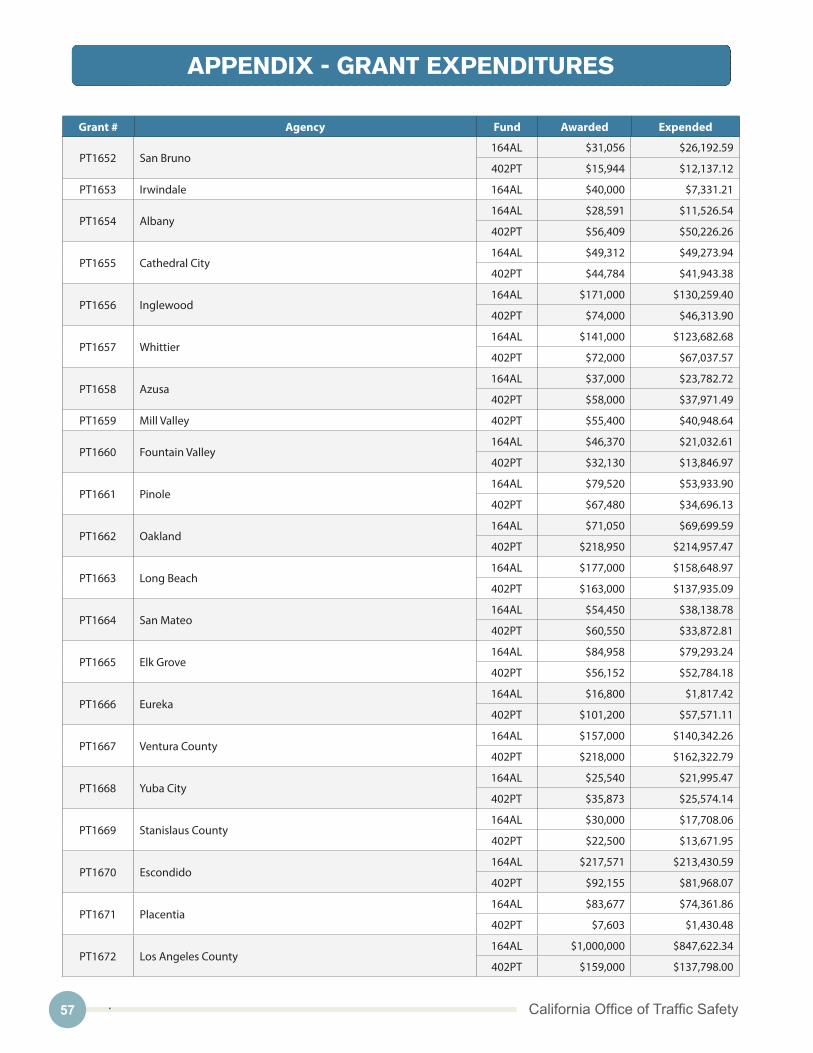
57 California Office of Traffic Safety
APPENDIX - GRANT EXPENDITURES
Grant # Agency Fund Awarded Expended
PT1652 San Bruno164AL $31,056 $26,192.59
402PT $15,944 $12,137.12
PT1653 Irwindale 164AL $40,000 $7,331.21
PT1654 Albany164AL $28,591 $11,526.54
402PT $56,409 $50,226.26
PT1655 Cathedral City164AL $49,312 $49,273.94
402PT $44,784 $41,943.38
PT1656 Inglewood164AL $171,000 $130,259.40
402PT $74,000 $46,313.90
PT1657 Whittier164AL $141,000 $123,682.68
402PT $72,000 $67,037.57
PT1658 Azusa164AL $37,000 $23,782.72
402PT $58,000 $37,971.49
PT1659 Mill Valley 402PT $55,400 $40,948.64
PT1660 Fountain Valley164AL $46,370 $21,032.61
402PT $32,130 $13,846.97
PT1661 Pinole164AL $79,520 $53,933.90
402PT $67,480 $34,696.13
PT1662 Oakland164AL $71,050 $69,699.59
402PT $218,950 $214,957.47
PT1663 Long Beach164AL $177,000 $158,648.97
402PT $163,000 $137,935.09
PT1664 San Mateo164AL $54,450 $38,138.78
402PT $60,550 $33,872.81
PT1665 Elk Grove164AL $84,958 $79,293.24
402PT $56,152 $52,784.18
PT1666 Eureka164AL $16,800 $1,817.42
402PT $101,200 $57,571.11
PT1667 Ventura County164AL $157,000 $140,342.26
402PT $218,000 $162,322.79
PT1668 Yuba City164AL $25,540 $21,995.47
402PT $35,873 $25,574.14
PT1669 Stanislaus County164AL $30,000 $17,708.06
402PT $22,500 $13,671.95
PT1670 Escondido164AL $217,571 $213,430.59
402PT $92,155 $81,968.07
PT1671 Placentia164AL $83,677 $74,361.86
402PT $7,603 $1,430.48
PT1672 Los Angeles County164AL $1,000,000 $847,622.34
402PT $159,000 $137,798.00
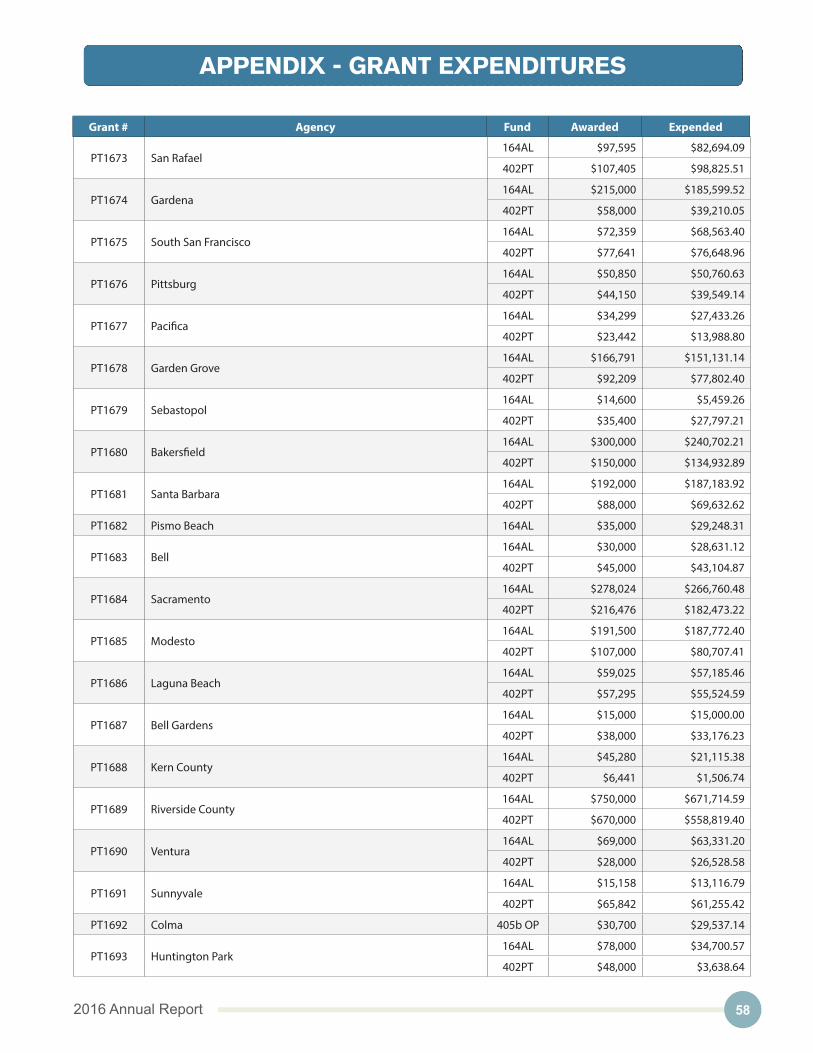
582016 Annual Report
PT1673 San Rafael164AL $97,595 $82,694.09
402PT $107,405 $98,825.51
PT1674 Gardena164AL $215,000 $185,599.52
402PT $58,000 $39,210.05
PT1675 South San Francisco164AL $72,359 $68,563.40
402PT $77,641 $76,648.96
PT1676 Pittsburg164AL $50,850 $50,760.63
402PT $44,150 $39,549.14
PT1677 Pacifica164AL $34,299 $27,433.26
402PT $23,442 $13,988.80
PT1678 Garden Grove164AL $166,791 $151,131.14
402PT $92,209 $77,802.40
PT1679 Sebastopol164AL $14,600 $5,459.26
402PT $35,400 $27,797.21
PT1680 Bakersfield164AL $300,000 $240,702.21
402PT $150,000 $134,932.89
PT1681 Santa Barbara164AL $192,000 $187,183.92
402PT $88,000 $69,632.62
PT1682 Pismo Beach 164AL $35,000 $29,248.31
PT1683 Bell164AL $30,000 $28,631.12
402PT $45,000 $43,104.87
PT1684 Sacramento164AL $278,024 $266,760.48
402PT $216,476 $182,473.22
PT1685 Modesto164AL $191,500 $187,772.40
402PT $107,000 $80,707.41
PT1686 Laguna Beach164AL $59,025 $57,185.46
402PT $57,295 $55,524.59
PT1687 Bell Gardens164AL $15,000 $15,000.00
402PT $38,000 $33,176.23
PT1688 Kern County164AL $45,280 $21,115.38
402PT $6,441 $1,506.74
PT1689 Riverside County164AL $750,000 $671,714.59
402PT $670,000 $558,819.40
PT1690 Ventura164AL $69,000 $63,331.20
402PT $28,000 $26,528.58
PT1691 Sunnyvale164AL $15,158 $13,116.79
402PT $65,842 $61,255.42
PT1692 Colma 405b OP $30,700 $29,537.14
PT1693 Huntington Park164AL $78,000 $34,700.57
402PT $48,000 $3,638.64
APPENDIX - GRANT EXPENDITURES
Grant # Agency Fund Awarded Expended

59 California Office of Traffic Safety
APPENDIX - GRANT EXPENDITURES
Grant # Agency Fund Awarded Expended
PT1694 Santa Maria164AL $257,000 $242,799.26
402PT $100,000 $72,975.61
PT1695 Vacaville164AL $28,836 $24,387.92
402PT $26,164 $20,443.24
PT1696 Salinas164AL $15,700 $14,121.43
402PT $96,700 $78,198.19
PT1697 Burlingame164AL $124,416 $100,915.69
402PT $134,284 $104,676.85
PT1698 San Bernardino County164AL $325,000 $300,633.12
402PT $225,000 $188,086.62
PT1699 San Gabriel164AL $69,000 $46,246.05
402PT $32,000 $23,933.17
PT16100 Oxnard
164AL $184,000 $167,685.29
402PT $87,775 $69,341.91
405d AL $3,225 $3,225.00
PT16102 Montebello164AL $63,500 $51,122.42
402PT $20,500 $16,347.65
PT16103 Berkeley164AL $105,561 $102,957.81
402PT $74,439 $71,086.33
PT16104 La Mesa164AL $38,564 $33,788.92
402PT $53,474 $50,768.34
PT16105 Vallejo164AL $41,500 $36,573.80
402PT $62,500 $55,075.19
PT16106 Seal Beach164AL $86,603 $52,168.67
402PT $53,397 $4,927.50
PT16107 Davis164AL $25,646 $11,834.54
402PT $88,849 $60,459.79
PT16108 Ridgecrest164AL $52,510 $51,307.88
402PT $30,463 $26,794.40
PT16109 San Luis Obispo164AL $171,000 $139,973.64
402PT $19,000 $13,787.23
PT16110 Fontana 164AL $150,000 $149,592.64
402PT $65,933 $65,688.30
PT16111 Monterey Park164AL $40,000 $39,999.72
402PT $146,000 $142,599.21
PT16112 Westminster164AL $65,375 $16,841.97
402PT $34,445 $7,419.00
PT16113 Palo Alto164AL $50,000 $19,711.90
402PT $22,000 $13,080.64

602016 Annual Report
APPENDIX - GRANT EXPENDITURES
Grant # Agency Fund Awarded Expended
PT16114 Selma164AL $3,000 $2,542.68
405b OP $22,000 $17,659.65
PT16115 San Ramon164AL $7,880 $5,087.92
402PT $82,120 $71,038.47
PT16116 Los Angeles
164AL $2,831,680 $2,824,531.53
402PT $500,000 $489,479.60
405d AL $44,160 $43,653.89
PT16117 Hawthorne164AL $158,988 $80,799.89
402PT $25,012 $11,030.01
PT16118 Merced164AL $48,000 $9,461.34
402PT $27,000 $7,603.09
PT16119 San Pablo164AL $43,888 $27,572.28
402PT $41,112 $33,822.11
PT16120 Placerville164AL $18,000 $13,094.88
402PT $27,000 $18,424.47
PT16121 Pomona164AL $265,000 $241,734.15
402PT $87,000 $73,769.21
PT16122 Fullerton
164AL $148,521 $138,091.47
402PT $32,432 $32,432.00
405d AL $115,577 $106,105.59
PT16123 Riverside164AL $272,733 $241,708.86
402PT $225,130 $184,138.84
PT16124 Santa Ana164AL $281,650 $249,633.80
402PT $61,830 $52,765.95
PT16125 Costa Mesa164AL $123,293 $90,743.32
402PT $26,707 $21,137.46
PT16126 West Sacramento164AL $56,500 $16,943.78
402PT $79,980 $61,883.10
PT16127 Arcadia164AL $98,000 $83,722.40
402PT $39,000 $29,055.86
PT16128 Brea164AL $87,031 $81,710.11
402PT $40,969 $37,491.31
PT16129 Simi Valley164AL $68,000 $65,651.94
402PT $17,000 $10,536.71
PT16130 San Diego County164AL $400,000 $339,868.84
402PT $150,000 $129,084.70
PT16131 Porterville164AL $35,500 $22,604.73
402PT $33,500 $20,312.33
PT16132 Chino164AL $121,604 $113,871.76
402PT $46,268 $40,626.91

61 California Office of Traffic Safety
APPENDIX - GRANT EXPENDITURES
Grant # Agency Fund Awarded Expended
PT16133 Los Gatos164AL $7,034 $612.68
402PT $18,066 $0.00
PT16134 San Diego164AL $600,000 $527,040.51
402PT $400,000 $364,268.27
PT16135 Santa Monica164AL $125,000 $111,350.03
402PT $175,000 $167,656.87
PT16136 Redlands164AL $58,086 $43,624.28
402PT $95,518 $71,488.04
PT16137 National City164AL $131,546 $86,347.25
402PT $60,794 $45,998.90
PT16138 Torrance164AL $200,000 $165,094.73
402PT $82,000 $79,810.14
PT16139 Stockton164AL $203,690 $176,683.31
402PT $191,730 $177,370.81
PT16140 Desert Hot Springs164AL $64,200 $21,840.49
402PT $47,505 $19,579.80
PT16141 Glendale
164AL $250,000 $245,569.87
402PT $150,000 $137,722.84
405d AL $40,000 $35,231.03
PT16142 Santa Rosa164AL $133,795 $128,984.84
402PT $83,205 $80,410.29
PT16143 Oceanside164AL $167,256 $128,152.97
402PT $59,859 $9,204.39
PT16144 Corona164AL $54,256 $46,881.91
402PT $21,662 $21,059.20
PT16145 Buena Park164AL $176,380 $117,110.71
402PT $82,015 $40,041.59
PT16149 Napa164AL $290,271 $272,613.59
402PT $74,519 $38,687.49
PT16157 El Centro164AL $42,000 $36,817.17
402PT $72,903 $70,344.20
PT16158 Citrus Heights164AL $148,190 $127,243.87
405b OP $88,000 $80,572.76
PT16160 Folsom164AL $126,490 $84,340.57
402PT $23,510 $14,564.92
PT16161 Angels Camp 164AL $81,000 $24,352.96
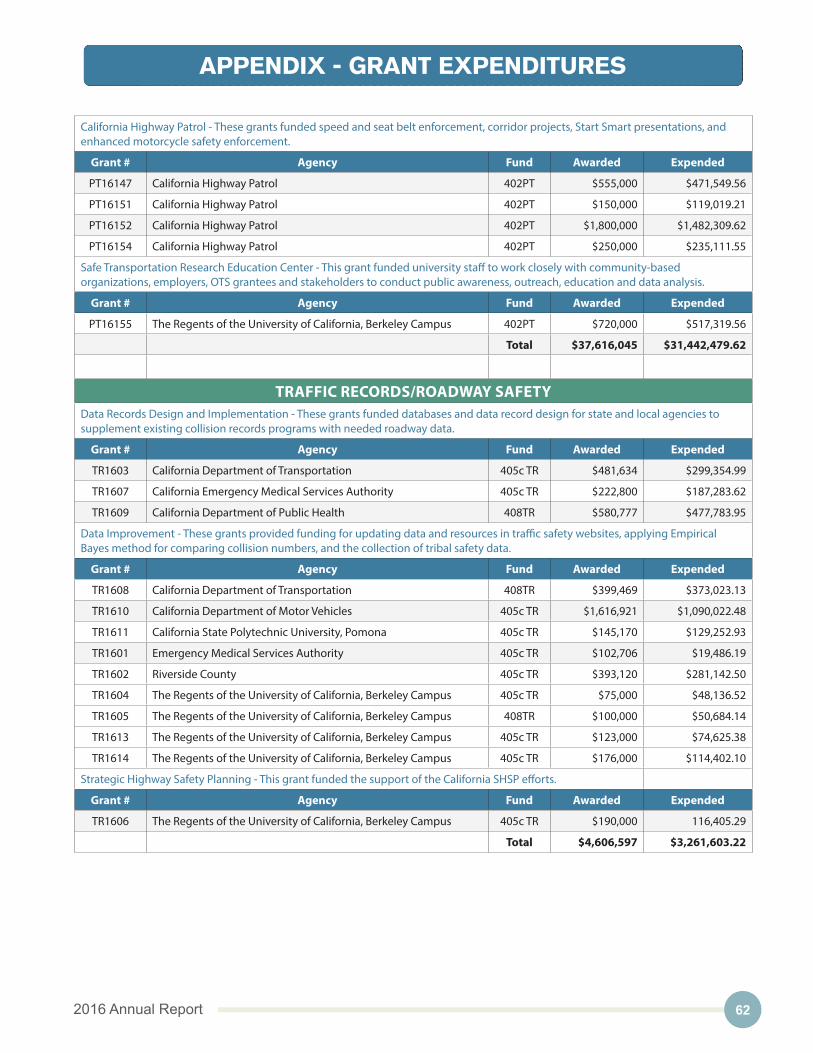
622016 Annual Report
California Highway Patrol - These grants funded speed and seat belt enforcement, corridor projects, Start Smart presentations, and enhanced motorcycle safety enforcement.
Grant # Agency Fund Awarded Expended
PT16147 California Highway Patrol 402PT $555,000 $471,549.56
PT16151 California Highway Patrol 402PT $150,000 $119,019.21
PT16152 California Highway Patrol 402PT $1,800,000 $1,482,309.62
PT16154 California Highway Patrol 402PT $250,000 $235,111.55
Safe Transportation Research Education Center - This grant funded university staff to work closely with community-based organizations, employers, OTS grantees and stakeholders to conduct public awareness, outreach, education and data analysis.
Grant # Agency Fund Awarded Expended
PT16155 The Regents of the University of California, Berkeley Campus 402PT $720,000 $517,319.56
Total $37,616,045 $31,442,479.62
TRAFFIC RECORDS/ROADWAY SAFETYData Records Design and Implementation - These grants funded databases and data record design for state and local agencies to supplement existing collision records programs with needed roadway data.
Grant # Agency Fund Awarded Expended
TR1603 California Department of Transportation 405c TR $481,634 $299,354.99
TR1607 California Emergency Medical Services Authority 405c TR $222,800 $187,283.62
TR1609 California Department of Public Health 408TR $580,777 $477,783.95
Data Improvement - These grants provided funding for updating data and resources in traffic safety websites, applying Empirical Bayes method for comparing collision numbers, and the collection of tribal safety data.
Grant # Agency Fund Awarded Expended
TR1608 California Department of Transportation 408TR $399,469 $373,023.13
TR1610 California Department of Motor Vehicles 405c TR $1,616,921 $1,090,022.48
TR1611 California State Polytechnic University, Pomona 405c TR $145,170 $129,252.93
TR1601 Emergency Medical Services Authority 405c TR $102,706 $19,486.19
TR1602 Riverside County 405c TR $393,120 $281,142.50
TR1604 The Regents of the University of California, Berkeley Campus 405c TR $75,000 $48,136.52
TR1605 The Regents of the University of California, Berkeley Campus 408TR $100,000 $50,684.14
TR1613 The Regents of the University of California, Berkeley Campus 405c TR $123,000 $74,625.38
TR1614 The Regents of the University of California, Berkeley Campus 405c TR $176,000 $114,402.10
Strategic Highway Safety Planning - This grant funded the support of the California SHSP efforts.
Grant # Agency Fund Awarded Expended
TR1606 The Regents of the University of California, Berkeley Campus 405c TR $190,000 116,405.29
Total $4,606,597 $3,261,603.22
APPENDIX - GRANT EXPENDITURES

63 California Office of Traffic Safety
CALIFORNIA OFFICE OF TRAFFIC SAFETY