c2fd: a gpu based 3d integrated complex-fluids toolkit for
TRANSCRIPT

C2FD: A GPU based 3D Integrated Complex-fluidsToolkit for Moldeling Cellular Dynamics
Jia Zhao 1,2 and Qi Wang 1
1Department of Mathematics,University of South Carolina at Columbia, SC, USA.
2Department of Mathematics,University of North Carolina at Chapel Hill, NC, USA.
Jia Zhao and Qi Wang (USC) C2FD Toolkit 0 / 25

Outline
1 A breif Introduction of C2FD
2 Applications on Cellular DynamicsMitotic Cell RoundingCortical Traveling WavesCell CytokinesisBleb-like ProtrusionsBiofilm Formation and Treatment
3 Conclusion
Jia Zhao and Qi Wang (USC) C2FD Toolkit 0 / 25

C2FD: Computational Complex-Fluids Dynamics
Jia Zhao and Qi Wang (USC) C2FD Toolkit 1 / 25

Why GPU?
Figure : The GPU Devotes More Transistors to Data Processing.
Jia Zhao and Qi Wang (USC) C2FD Toolkit 2 / 25

What are Complex-fluids?
Complex fluids are fluids that are homogeneous at macroscopic scales and disorderedat microscopic scales, but possess structure on a mesoscopic length scale. Mesoscopicscale dynamics or physics dominates the material’s properties. a
aGelbart and Ben-Shaul, JPC, 1996.
A fluid made up of a lot of different kinds of stuff;Fluid mixtures with (micro)structure;polymers (thermoplastics, elastomers, composites), gels, colloidal fluids,suspensions, emulsions, foams, micelar and liquid-crystal phases, moltenmaterials, etc.
Jia Zhao and Qi Wang (USC) C2FD Toolkit 3 / 25

Why model Cells as Complex Fluids?
‘ Everything flows! ’
Heraclitus 535BC - 475BC a
ahttp://necspenecmetu.tumblr.com/image/24706611579
Jia Zhao and Qi Wang (USC) C2FD Toolkit 4 / 25

Continuum Theory
What is a continuum theory?A theory that analyzes the kinematics and the mechanical behavior of materialsmodeled as a continuous mass rather than as discrete particles.
Navier-Stokes Equation
(ρv)t +∇ · (ρvv) = −∇p +∇ · σ + f,ρt +∇ · (ρv) = 0,
where ρ is the density, v is the velocity, p is the hydrostatic pressure, σ is theviscoelastic stress, and f is the external forces.
Jia Zhao and Qi Wang (USC) C2FD Toolkit 5 / 25

Contents
1 A breif Introduction of C2FD
2 Applications on Cellular DynamicsMitotic Cell RoundingCortical Traveling WavesCell CytokinesisBleb-like ProtrusionsBiofilm Formation and Treatment
3 Conclusion
Jia Zhao and Qi Wang (USC) C2FD Toolkit 5 / 25

Biological Background for Mitotic Cell Rounding
Figure : A Schematic Cartoon.
load video
Figure : Mitotic Cell rounding.
Jia Zhao and Qi Wang (USC) C2FD Toolkit 6 / 25

Homogeneous Mitotic Cell Rounding on Substrate
load video load video
Figure : Simulations of mitotic cell rounding on substrate.
Jia Zhao and Qi Wang (USC) C2FD Toolkit 7 / 25

Heterogeneous Mitotic Cell Rounding on Substrate
load video
(a)
load video
(b)
Figure : Mitotic Cell Rounding. (a) F-actin dynamics from Kapustina, UNC; (b) numericalsimulation.
Jia Zhao and Qi Wang (USC) C2FD Toolkit 8 / 25

Contents
1 A breif Introduction of C2FD
2 Applications on Cellular DynamicsMitotic Cell RoundingCortical Traveling WavesCell CytokinesisBleb-like ProtrusionsBiofilm Formation and Treatment
3 Conclusion
Jia Zhao and Qi Wang (USC) C2FD Toolkit 8 / 25

Cytoplasmic flows accompany the traveling wave
load video load video
Jia Zhao and Qi Wang (USC) C2FD Toolkit 9 / 25

The nucleus is pushed around during oscillation
load video load video
Jia Zhao and Qi Wang (USC) C2FD Toolkit 10 / 25

Cortical Traveling Waves
(e) F actin
(f) Myosin
load video
Jia Zhao and Qi Wang (USC) C2FD Toolkit 11 / 25

Contents
1 A breif Introduction of C2FD
2 Applications on Cellular DynamicsMitotic Cell RoundingCortical Traveling WavesCell CytokinesisBleb-like ProtrusionsBiofilm Formation and Treatment
3 Conclusion
Jia Zhao and Qi Wang (USC) C2FD Toolkit 11 / 25

Cell Mitosis
Jia Zhao and Qi Wang (USC) C2FD Toolkit 12 / 25

Biological Background for Cytokinesis
(g) Actomyosin Distribution during cytokinesis (h) Contractile Ring
Figure : Animal Cell Cytokinesis: (A) purple urchin zygotes during first mitosis, stained forDNA (green) and phosphorylated myosin II (magenta); (B) a cartoon of actomyosin contractilering and cleavage furrow.
1Ann L. Miller, Current Biology, 21(24), 2011.2http://php.med.unsw.edu.au/cellbiology/
Jia Zhao and Qi Wang (USC) C2FD Toolkit 13 / 25

Cell Cytokinesis
(a) Contractile Ring
load video
(b) 3D simulation of Cell Cytokinesis
Jia Zhao and Qi Wang (USC) C2FD Toolkit 14 / 25

3D Visualization of Contractile Ring Dynamics
Figure : Arrangement of F-actin on the contractile ring at different stages.
1Kamasaki, Osumi and Mabuchi, Journal of Cell Biology, 178(5),2010.Jia Zhao and Qi Wang (USC) C2FD Toolkit 15 / 25

Qualitative Comparison
(d) a melanoma cell beforeit divides completely
(e) a budding yeast (f) Cleavage furrow in thejellyfish Aequorea
Figure : Qualitative Comparisons of asymmetric cytokinesis.
1http://php.med.unsw.edu.au/cellbiology/index.php?title=File:Melanoma-Cytokinesis.eps2http://www.ppdictionary.com/fungi.htm3http://raven.zoology.washington.edu/embryos/aequorea.htmlJia Zhao and Qi Wang (USC) C2FD Toolkit 16 / 25

Contents
1 A breif Introduction of C2FD
2 Applications on Cellular DynamicsMitotic Cell RoundingCortical Traveling WavesCell CytokinesisBleb-like ProtrusionsBiofilm Formation and Treatment
3 Conclusion
Jia Zhao and Qi Wang (USC) C2FD Toolkit 16 / 25

The plasm membrane after rounding is highly convoluted.
Jia Zhao and Qi Wang (USC) C2FD Toolkit 17 / 25

The plasm membrane after rounding is highly convoluted.
Jia Zhao and Qi Wang (USC) C2FD Toolkit 18 / 25

Bleb-like Protrusions
load video
Jia Zhao and Qi Wang (USC) C2FD Toolkit 19 / 25

Bleb-like Protrusions
load video
Jia Zhao and Qi Wang (USC) C2FD Toolkit 20 / 25

Contents
1 A breif Introduction of C2FD
2 Applications on Cellular DynamicsMitotic Cell RoundingCortical Traveling WavesCell CytokinesisBleb-like ProtrusionsBiofilm Formation and Treatment
3 Conclusion
Jia Zhao and Qi Wang (USC) C2FD Toolkit 20 / 25

Biofilm Bacteria
(e) Dental Plaque (f) Biofouling
(g) Streambed in Yellowstone (h) Biofilm Infection
Figure : Biofilm Bacteria in Our Daily Life.
Jia Zhao and Qi Wang (USC) C2FD Toolkit 21 / 25

Biofilm Recovery After Antimicrobial Treatment
Figure : Biofilm recoveryafter 10-minute treatmentwith CHX-Plus.
load video
Figure : Numerical prediction of biofilm recovery.
Jia Zhao and Qi Wang (USC) C2FD Toolkit 22 / 25
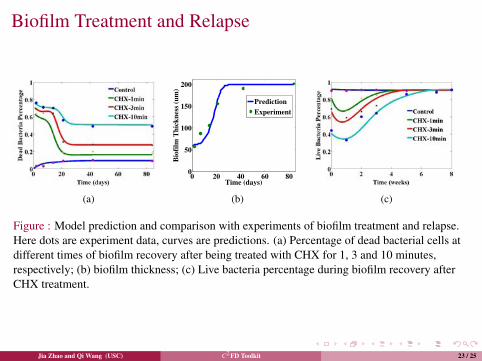
Biofilm Treatment and Relapse
(a)
0 20 40 60 800
50
100
150
200
Time (days)B
iofi
lm T
hic
kn
ess
(um
)
Prediction
Experiment
(b) (c)
Figure : Model prediction and comparison with experiments of biofilm treatment and relapse.Here dots are experiment data, curves are predictions. (a) Percentage of dead bacterial cells atdifferent times of biofilm recovery after being treated with CHX for 1, 3 and 10 minutes,respectively; (b) biofilm thickness; (c) Live bacteria percentage during biofilm recovery afterCHX treatment.
Jia Zhao and Qi Wang (USC) C2FD Toolkit 23 / 25

C2FD: Computational Complex-Fluids Dynamics
Jia Zhao and Qi Wang (USC) C2FD Toolkit 24 / 25

AcknowledgmentsSpecial thanks go to the Dean’s Dissertation Fellowship and SPARC GraduateResearch Grant from USC.
(a) Dr. Forest (b) Dr. Wang (c) Dr. Yang
(d) Dr. Jacobson (e) Dr. Kapastina (f) Dr. Shen
Jia Zhao and Qi Wang (USC) C2FD Toolkit 25 / 25