c1113835 geographic characteristics of pub closures in rural wales between 2007 to 2012
TRANSCRIPT

You MUST include your Student Name here: Alex Edge
Students MUST complete all details in Section 1 and include Student Name in the box above
School of Planning and Geography
ASSESSMENT COVER SHEET
Section 1
Student Number (s): c1113835
Module Code: CP0243
Title of Degree: City and Regional Planning
Section 2
(School use only)MARK AWARDED:
ASSESSOR’S COMMENTS (based on the following, dependent on the nature of the coursework)
(A) SUBSTANCE, (B) STRUCTURE, (C) STYLE AND PRESENTATION, (D) REFERENCING, (E) KEY AREAS FOR IMPROVEMENT
(Please contact the assessor should you wish to discuss this report, or refer to the Marking Guidelines in your student handbook)
Page | 1Cardiff University

Geographic Characteristics of Pub Closures in Rural Wales Between 2007 to 2012.
Developing Research Methods
Student Number: c1113835
School of Geopgraphy and PlanningCardiff University
27th March 2014
ContentsPage | 2
Cardiff University

1) Introduction 4
2) Background Analysis 4
3) Variations by Catchment Area 7
4) Discussion, Limitations and Conclusions 10
5) References 10
6) Appendix 11
1) Introduction
Geographic Information Systems are mapping packages that can identify spatial patterns (esri, 2014). This report shall describe geographic characteristics of pubs in Ceredigion, (‘rural Wales’) to investigate pub closure. Two datasets will be utilised; pub statistics from 2007 to 2012
Page | 3Cardiff University

and the 2001 Output Area Classifications (OACs). OACs are geodemographic classifications based on census data (OAC User Group, 2014).
2) Background Analysis
Page | 4Cardiff University
Data source: Orford, 2014.
Map 2: Average monthly turnover of pubs by equal intervals in rural Wales (2007).

Table 1: Basic statistics of all pubs in rural Wales (2007).
Turnover in 2007Mean (average) 4586.5
Page | 5Cardiff University

Standard Deviation 2746.358088Sum 183460Maximum 10780Minimum 1590Count (Number of pubs) 40CV 0.59879169Number of unique values 38Range 9190Median 2950
Table 2: Group statistics of all pubs in rural Wales (2007).
Open ClosedMean (average) 5574.14 1982.73Standard Deviation 2614.94 220.79Sum 161650 21810Maximum 10780 2280Minimum 1850 1590Count (number of pubs) 29 11Median 5600 2050Variance 6837920.81 48747.11
The minimum turnover of an open pub is £1850.00 (see table 2). However, pubs producing a higher turnover have closed; the maximum turnover of a closed pub is £2280. This is just 21.2% of maximum open pub turnover (£10780). The mean turnover of closed pubs is £3591.41 lower/35.6% of open pubs turnover. The standard deviation (S.D.) of closed pubs is 2394.15 lower/8.4% of open pubs S.D. Open pub turnover has a greater spread.
3) Variations by Catchment Area
Page | 6Cardiff University
Map 3: Catchment areas of all pubs in rural Wales from 2007 to 2012.
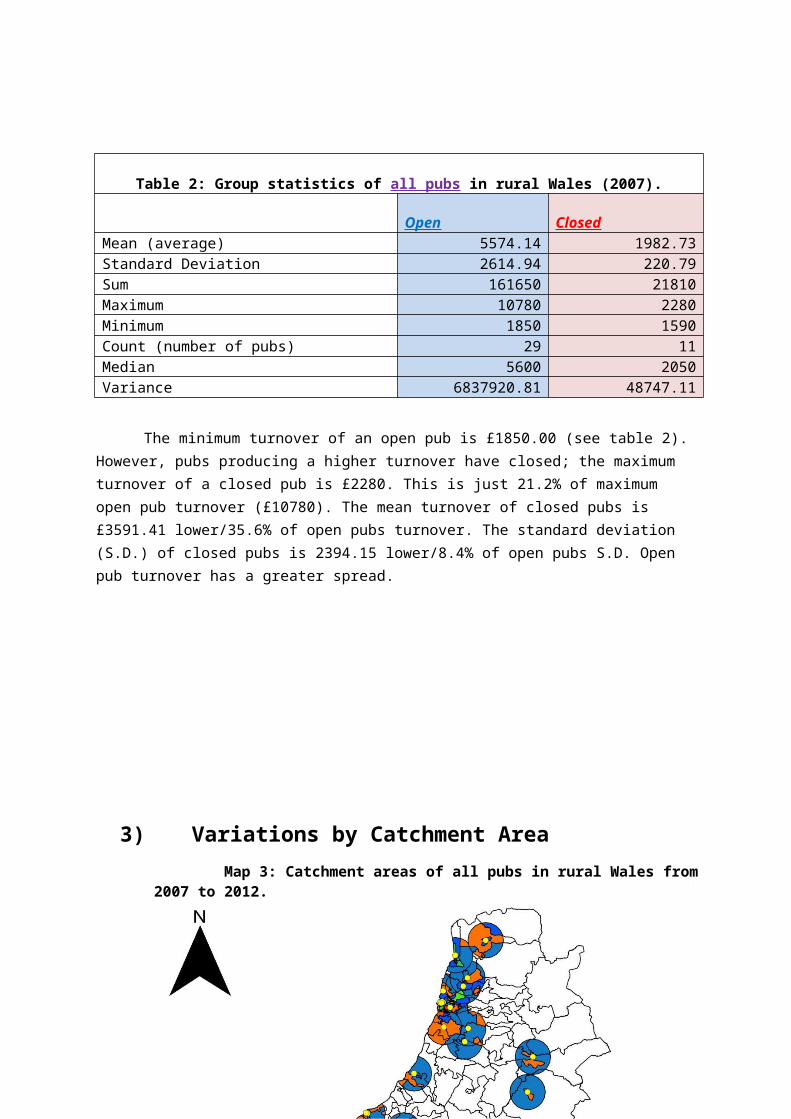
Table 3: Count and percentage of OACs located within 3km catchment areas of all pubs from 2007 to 2012.
Table 4: Count and percentage of OACs located within 3km catchment areas of closed pubs by 2012.
Output Area Classification Total Count Percentage (%) Output Area Classification Total Count Percentage (%)Accessible Countryside 83 9.96 Accessible Countryside 15 7.89Agricultural 167 20.05 Agricultural 57 30.00Aspiring Households 8 0.96 Aspiring Households 2 1.05Least Divergent 88 10.56 Least Divergent 14 7.37Older Blue Collar 22 2.64 Older Blue Collar 2 1.05Older Workers 43 5.16 Older Workers 3 1.58Prospering Older Families 15 1.80 Prospering Older Families 2 1.05Public Housing 8 0.96 Public Housing 2 1.05Settled in the City 122 14.65 Settled in the City 30 15.79Terrace Blue Collar 8 0.96 Terrace Blue Collar 2 1.05Thriving Suburbs 17 2.04 Thriving Suburbs 4 2.11Transient Communities 48 5.76 Transient Communities 12 6.32Village Life 116 13.93 Village Life 25 13.16Young Blue Collar 55 6.60 Young Blue Collar 11 5.79Young Families in Terraced Homes 33 3.96 Young Families in Terraced Homes 9 4.74TOTAL 833 100.00 TOTAL 190 100.00KEY:
ColourPercentage change from Table 4 to Table 3 (%)
+ 1-5% + 0-1% - 0-1% - 1-5% > -5%
Page | 7Cardiff University
Tables 3 & 4 are shaded to highlight pub closures within particular OACs. OACs shaded in blue account for a higher percentage of closed pub catchment areas. Specifically, “Agricultural” and “Settled in the City (SitC)” are the two highest total count of OACs within catchment areas, 57 and 30 respectively.
“Agricultural” counts for 30% of OACs within closed pub catchment areas compared with 20.05% for all pubs. In closed pub areas, “SitC” is 1.24% higher than for catchment areas of all pubs.

Table 5: Turnover of all pubs by Output Area Classifications within catchment areas from 2007 to 2012.
Output Area Classifications Maximum Minimum Mean (average)Standard Deviation
Accessible Countryside 10780 1590 5133.13 2403.20Agricultural 10780 1590 4570.84 2872.48Aspiring Households 8790 1590 5193.75 2306.11Least Divergent 10780 1590 4556.36 2529.42Older Blue Collar 8790 1590 3726.82 2067.05Older Workers 10780 1590 3606.51 2394.63Prospering Older Families 8790 1590 4154.67 2259.49Public Housing 8790 1590 5165.00 2343.39Settled in the City 10780 1590 5221.56 2350.62Terrace Blue Collar 8790 1590 5165.00 2343.39Thriving Suburbs 8790 1590 5270.59 2258.27Transient Communities 8790 1590 5193.75 2306.11Village Life 10780 1590 4795.00 2751.83Young Blue Collar 10780 1590 4567.27 2485.09Young Families in Terraced Homes 8790 1590 5098.48 2333.97TOTAL 145780.00 23850 71418.73 36005.05AVERAGE 9718.67 1590.00 4761.25 2400.34
Table 6: Turnover of closed pubs by Output Area Classifications within catchment areas from 2007 to 2012.
Output Area Classifications Maximum Minimum Mean (average)Standard Deviation
Accessible Countryside 2280 1590 1927.33 323.82Agricultural 2280 1590 1982.81 203.39Aspiring Households 2280 1590 1935.00 345.00Least Divergent 2280 1590 1921.43 298.97Older Blue Collar 2280 1590 1935.00 345.00Older Workers 2280 1590 1973.33 286.86Prospering Older Families 2280 1590 1935.00 345.00Public Housing 2050 1590 1820.00 230.00Settled in the City 2280 1590 1935.00 345.00Terrace Blue Collar 2050 1590 1820.00 230.00Thriving Suburbs 2280 1590 1935.00 345.00Transient Communities 2280 1590 1935.00 345.00Village Life 2280 1590 1995.20 217.96Young Blue Collar 2280 1590 1861.82 256.08Young Families in Terraced Homes 2280 1590 1947.78 327.27TOTAL 33740.00 23850 28859.70 4444.35AVERAGE 2249.33 1590.00 1923.98 296.29
Page | 8Cardiff University
Tables 3 & 4 are shaded to highlight pub closures within particular OACs. OACs shaded in blue account for a higher percentage of closed pub catchment areas. Specifically, “Agricultural” and “Settled in the City (SitC)” are the two highest total count of OACs within catchment areas, 57 and 30 respectively.
“Agricultural” counts for 30% of OACs within closed pub catchment areas compared with 20.05% for all pubs. In closed pub areas, “SitC” is 1.24% higher than for catchment areas of all pubs.

Tables 5 & 6 show that the catchment area of the pub with minimum turnover (£1590) ecompassed every OAC. The catchment area of all/closed pubs with maximum turnover (£10780/£2280 respectively) intersected with multiple OACs including “Agricultural” and “SitC”. The largest mean turnover of all/closed pubs is £5270.59 (“Thriving Suburbs”) and £1982.81 (“Agriculture”) respectively. The smallest mean turnover of all/closed pubs is £3605.51 (“Older Workers”) and £1820 (“Public Housing”) respectively. “Agricultural” features the largest S.D. (2872.48) of all pub turnover and smallest (203.39) of closed pubs.
4) Discussion, Limitations and Conclusions
The mean and S.D. of closed pub turnover for all OACs is ~40% and ~12.4% respecitvely of all pubs. Closed pubs feature low turnover between £1590-£2280, suggesting a higher turnover is needed to continue business. Yet, table 1 shows the minimum turnover for an open pub is £1850, there must be a contextual reason for the pub to stay open. For example, a strategic necessity by the owner who may use the pub to compliment additional ventures.
Tables 3-4 indicate that OACs of the ‘+1-5%’ category are linked to continued pub business. Furthermore, the tables highlight that higher percentage presence of“Agricultural” and “SitC” OACs in closed pub buffer zones identifies them as poor for public house business. Conversely, table 6 shows that “Agricultural” offers the second highest mean turnover for closed pubs. This report shall conclude by investigating limitations to explain contradictions above.
This report largely compares all pubs to closed pubs. Comparing open to closed pubs would more clearly represent the differences in turnover and OAC statistics. Maps 1-3 feature a scale issue where pubs cluster, map 4 (appendix) is an appropriate solution that visualises pubs on a closer scale. Finally, maps 6-7 (appendix) show that data from an entire OAC is accounted for when the buffer zone intersection is with the tip of an OAC. The significance of the OAC should be reduced by the percentage of its land within pub catchment area.
Word count: 549
5) References
Esri. 2014. Overview: What is GIS? [Online]. Available at: http://www.esri.com/what-is-gis/overview#overview_panel [Accessed: 25 March 2014].
Output Area Classification User Group - OAC. 2014. THE OUTPUT AREA CLASSIFICATION [Online]. Available at: http://areaclassification.org.uk/ [Accessed: 25 March 2014].
Page | 9Cardiff University

6) Appendix
Page | 10Cardiff University
Map 4: Close-up of pub opening and closures in rural Wales from 2007 to 2012.
Data source: Orford, 2014.

Page | 11Cardiff University
Map 5: Average monthly turnover of pubs by quantiles in rural Wales (2007).
Data source: Orford, 2014.

Page | 12Cardiff University
Data source: Orford, 2014.
OACs within catchment area
Map 6: Intersection of all pub catchment areas and OACs in rural Wales from 2007 to 2012.

Page | 13Cardiff University
Data source: Orford, 2014.
OACs within catchment area