c/108/15 - summary update on the programme and budget …
TRANSCRIPT

C/108/15
Original: English 16 October 2017
COUNCIL 108th Session
SUMMARY UPDATE ON THE
PROGRAMME AND BUDGET FOR 2017

C/108/15
i
TABLE OF CONTENTS Introduction ............................................................................................................................. 1
Summary tables ...................................................................................................................... 2
PART I – ADMINISTRATION ............................................................................................................... 3 Administrative Part of the Budget – Object of expenditure .................................................. 5
Financing of the Administrative Part of the Budget .............................................................. 7
PART II – OPERATIONS ...................................................................................................................... 11 Summary table ........................................................................................................................ 12
Anticipated voluntary contributions to the Operational Part of the Budget for 2017 ........ 13
Overview .................................................................................................................................. 15
Geographical breakdown of the Operational Part of the Budget ......................................... 17
Sources and application of Operational Support Income ..................................................... 18


C/108/15
1
SUMMARY UPDATE ON THE PROGRAMME AND BUDGET FOR 2017
INTRODUCTION
1. The Summary update on the Programme and Budget for 2017 presents an update to the Programme and Budget for 2017 (C/107/6/Rev.1) and the Revision of the Programme and Budget for 2017 (S/20/11). Based on the current available funding, adjustments have been made in the present document to reflect the funding status and projected level of activities that are being undertaken during the course of 2017. 2. The Administrative Part of the Budget remains unchanged at CHF 50,690,324. 3. The Operational Part of the Budget has increased from USD 1.496 billion to USD 1.738 billion owing to additional funding received for ongoing projects and new activities initiated since the approval of the Revision of the Programme and Budget for 2017 (S/20/11). The increase of USD 242 million is primarily due to significantly higher levels of project activity for services provided under Movement, Emergency and Post-crisis Migration Management, and Regulating Migration. 4. The level of Operational Support Income (OSI) is maintained at USD 79.8 million. With the level of activities reported in this document, the estimated OSI will be achieved by the end of the year. 5. The present document includes a summary of the revised Operational Part of the Budget, a table listing anticipated voluntary contributions and a geographical breakdown providing a regional overview.

C/108/15
2
SUMMARY TABLES
Part I – Administration
2017 Revision (S/20/11) Total costs
CHF
Revision
CHF
Revised estimate
Total costs CHF
Administration 50 690 324 50 690 324
Part II – Operations
Services/Support
2017 Revision (S/20/11) Total costs
USD
Revision
USD
Revised estimate
Total costs USD
I. Movement, Emergency and Post-crisis Migration Management 855 637 500 147 662 700 1 003 300 200
II. Migration Health 152 518 800 13 254 600 165 773 400
III. Migration and Development 48 531 200 5 343 800 53 875 000
IV. Regulating Migration 328 896 600 81 913 500 410 810 100
V. Facilitating Migration 63 663 900 (2 486 800) 61 177 100
VI. Migration Policy and Research 5 727 000 2 551 500 8 278 500
VII. Land, Property and Reparation Programmes 27 084 200 (11 095 300) 15 988 900
VIII. General Programme Support 14 007 800 4 954 000 18 961 800
Total 1 496 067 000 242 098 000 1 738 165 000
C/108/15
3
PART I
ADMINISTRATION
(in Swiss francs)
C/108/15
4
PART I – ADMINISTRATION (in Swiss francs)
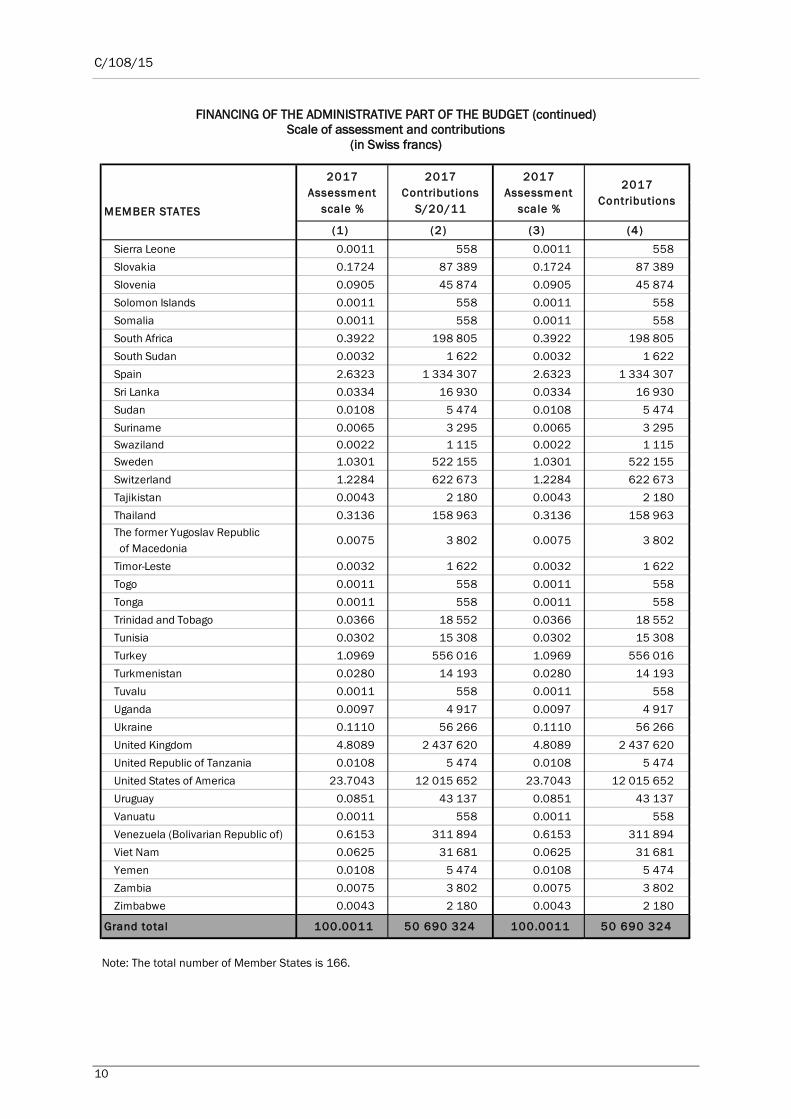
6. The Administrative Part of the Budget remains unchanged at CHF 50,690,324 and its application is outlined in the object of expenditure table on pages 5 and 6. In order to provide the Administration with the flexibility it needs to function effectively, some slight shifts may be made between budget line items, but this will not affect the total budget level. 7. The scale of assessment and contributions also remains unchanged, with a total of 166 Member States, as presented on pages 7, 8, 9 and 10.
C/108/15
5
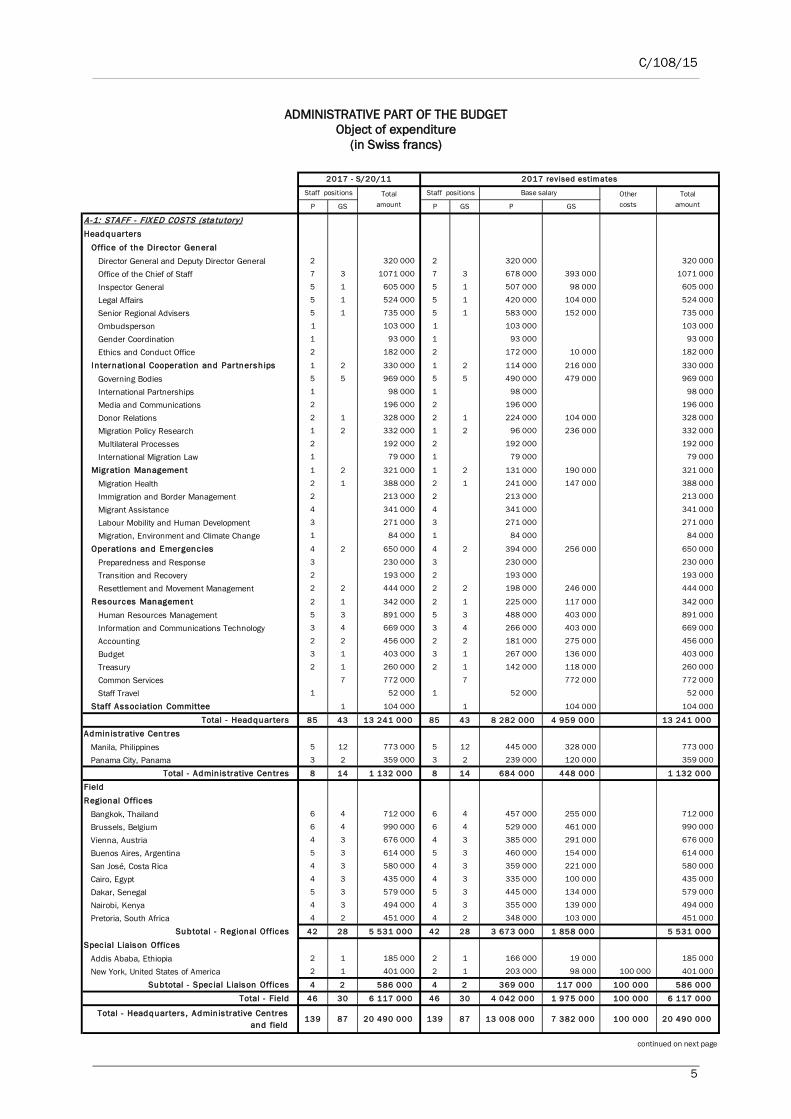
ADMINISTRATIVE PART OF THE BUDGET Object of expenditure
(in Swiss francs)
Staff positions Staff positions Base salary
P GS P GS P GS
A-1: STAFF - FIXED COSTS (sta tutory)Headquarters
Office of the Director GeneralDirector General and Deputy Director General 2 320 000 2 320 000 320 000
Office of the Chief of Staff 7 3 1071 000 7 3 678 000 393 000 1071 000
Inspector General 5 1 605 000 5 1 507 000 98 000 605 000
Legal Affairs 5 1 524 000 5 1 420 000 104 000 524 000
Senior Regional Advisers 5 1 735 000 5 1 583 000 152 000 735 000
Ombudsperson 1 103 000 1 103 000 103 000
Gender Coordination 1 93 000 1 93 000 93 000
Ethics and Conduct Office 2 182 000 2 172 000 10 000 182 000
International Cooperation and Partnerships 1 2 330 000 1 2 114 000 216 000 330 000
Governing Bodies 5 5 969 000 5 5 490 000 479 000 969 000
International Partnerships 1 98 000 1 98 000 98 000
Media and Communications 2 196 000 2 196 000 196 000
Donor Relations 2 1 328 000 2 1 224 000 104 000 328 000
Migration Policy Research 1 2 332 000 1 2 96 000 236 000 332 000
Multilateral Processes 2 192 000 2 192 000 192 000
International Migration Law 1 79 000 1 79 000 79 000
Migration Management 1 2 321 000 1 2 131 000 190 000 321 000
Migration Health 2 1 388 000 2 1 241 000 147 000 388 000
Immigration and Border Management 2 213 000 2 213 000 213 000
Migrant Assistance 4 341 000 4 341 000 341 000
Labour Mobility and Human Development 3 271 000 3 271 000 271 000
Migration, Environment and Climate Change 1 84 000 1 84 000 84 000
Operations and Emergencies 4 2 650 000 4 2 394 000 256 000 650 000
Preparedness and Response 3 230 000 3 230 000 230 000
Transition and Recovery 2 193 000 2 193 000 193 000
Resettlement and Movement Management 2 2 444 000 2 2 198 000 246 000 444 000
Resources Management 2 1 342 000 2 1 225 000 117 000 342 000
Human Resources Management 5 3 891 000 5 3 488 000 403 000 891 000
Information and Communications Technology 3 4 669 000 3 4 266 000 403 000 669 000
Accounting 2 2 456 000 2 2 181 000 275 000 456 000
Budget 3 1 403 000 3 1 267 000 136 000 403 000
Treasury 2 1 260 000 2 1 142 000 118 000 260 000
Common Services 7 772 000 7 772 000 772 000
Staff Travel 1 52 000 1 52 000 52 000
Staff Association Committee 1 104 000 1 104 000 104 000
Total - Headquarters 85 43 13 241 000 85 43 8 282 000 4 959 000 13 241 000
Administrative CentresManila, Philippines 5 12 773 000 5 12 445 000 328 000 773 000
Panama City, Panama 3 2 359 000 3 2 239 000 120 000 359 000
Total - Administrative Centres 8 14 1 132 000 8 14 684 000 448 000 1 132 000
FieldRegional Offices
Bangkok, Thailand 6 4 712 000 6 4 457 000 255 000 712 000
Brussels, Belgium 6 4 990 000 6 4 529 000 461 000 990 000
Vienna, Austria 4 3 676 000 4 3 385 000 291 000 676 000
Buenos Aires, Argentina 5 3 614 000 5 3 460 000 154 000 614 000
San José, Costa Rica 4 3 580 000 4 3 359 000 221 000 580 000
Cairo, Egypt 4 3 435 000 4 3 335 000 100 000 435 000
Dakar, Senegal 5 3 579 000 5 3 445 000 134 000 579 000
Nairobi, Kenya 4 3 494 000 4 3 355 000 139 000 494 000
Pretoria, South Africa 4 2 451 000 4 2 348 000 103 000 451 000
Subtotal - Regional Offices 42 28 5 531 000 42 28 3 673 000 1 858 000 5 531 000
Special Liaison OfficesAddis Ababa, Ethiopia 2 1 185 000 2 1 166 000 19 000 185 000
New York, United States of America 2 1 401 000 2 1 203 000 98 000 100 000 401 000
Subtotal - Special Liaison Offices 4 2 586 000 4 2 369 000 117 000 100 000 586 000
Total - Field 46 30 6 117 000 46 30 4 042 000 1 975 000 100 000 6 117 000
Total - Headquarters , Administrative Centresand field
139 87 20 490 000 139 87 13 008 000 7 382 000 100 000 20 490 000
continued on next page
Totalamount
Othercosts
Totalamount
2017 - S/20/11 2017 revised estimates

C/108/15
6
ADMINISTRATIVE PART OF THE BUDGET (continued) Object of expenditure
(in Swiss francs)
P - Professional and higher categories; GS - General Service category.
Staff positions Staff positions Base salary
P GS P GS P GS
A-1: STAFF - FIXED COSTS (sta tutory) - ContinuedOther s taff benefits
Post adjustment 8 299 000 8 299 000 8 299 000
Health and accident insurances 1 590 000 1 348 000 242 000 1 590 000
Contribution to UNJSPF 4 941 000 4 018 000 923 000 4 941 000
Terminal emoluments 700 000 700 000 700 000
A -1: Subtotal - Staff fixed costs (s tatutory) 139 87 36 020 000 139 87 26 673 000 8 547 000 800 000 36 020 000
A -2: STAFF - VARIABLE COSTS (sta tutory)Mobility and hardship allowance 550 000 550 000 550 000
Family allowance 692 000 300 000 392 000 692 000
Language allowance 101 000 101 000 101 000
Rent subsidy 343 000 343 000 343 000
Education grant 1 791 000 1 791 000 1 791 000
Home leave 255 000 255 000 255 000
Travel on appointment or transfer 350 000 350 000 350 000
Installation grant 440 000 440 000 440 000
A -2: Subtotal - Staff var iable costs (s tatutory) 4 522 000 3 239 000 493 000 790 000 4 522 000
Total - Staff salar ies and benefits 139 87 40 542 000 139 87 29 912 000 9 040 000 1 590 000 40 542 000
B -1: NON-STAFF - FIXED COSTS (sta tutory)Amortization, rental and maintenance of premises 1 353 760 1 353 760 1 353 760
B -2: NON-STAFF - VARIABLE COSTSGeneral office
Purchase and maintenance of office equipment and furniture
325 000 325 000 325 000
Hardware, software and maintenance services 1 870 000 1 870 000 1 870 000
Office supplies, printing and other services 410 000 410 000 410 000
Total - General office 3 958 760 3 958 760 3 958 760
CommunicationsElectronic mail 514 000 514 000 514 000
Telephone 245 000 245 000 245 000
Facsimile 50 000 50 000 50 000
Postage 176 000 176 000 176 000
Total - Communications 985 000 985 000 985 000
Contractual servicesExternal audit 120 000 120 000 120 000
Staff development and learning 892 586 892 586 892 586
Consultants 55 000 55 000 55 000
Insurance, bank charges, security, etc. 631 978 631 978 631 978
Total - Contractual services 1 699 564 1 699 564 1 699 564
Governing body sess ionsSalaries 335 000 335 000 335 000
Documentation 35 000 35 000 35 000
Rental of space, equipment, etc. 65 000 65 000 65 000
Total - Governing body sess ions 435 000 435 000 435 000
Travel and representation 1 170 000 1 170 000 1 170 000
UN-related cost-shar ing fees 1 900 000 1 900 000 1 900 000
B-2: Subtotal - Non-staff - Variable costs 8 794 564 8 794 564 8 794 564
Total - Non-staff costs 10 148 324 10 148 324 10 148 324
GRAND TOTAL 139 87 50 690 324 139 87 29 912 000 9 040 000 11 738 324 50 690 324
2017 - S/20/11 2017 revised estimates
Totalamount
Othercosts
Totalamount

C/108/15
7
FINANCING OF THE ADMINISTRATIVE PART OF THE BUDGET Scale of assessment and contributions
(in Swiss francs)
MEMBER STATES
(1) (2) (3) (4)
Afghanistan 0.0065 3 295 0.0065 3 295 Albania 0.0086 4 359 0.0086 4 359 Algeria 0.1735 87 947 0.1735 87 947 Angola 0.0108 5 474 0.0108 5 474 Antigua and Barbuda 0.0022 1 115 0.0022 1 115 Argentina 0.9611 487 179 0.9611 487 179 Armenia 0.0065 3 295 0.0065 3 295 Australia 2.5181 1 276 419 2.5181 1 276 419 Austria 0.7758 393 251 0.7758 393 251 Azerbaijan 0.0647 32 796 0.0647 32 796 Bahamas 0.0151 7 654 0.0151 7 654 Bangladesh 0.0108 5 474 0.0108 5 474 Belarus 0.0603 30 566 0.0603 30 566 Belgium 0.9536 483 378 0.9536 483 378 Belize 0.0011 558 0.0011 558 Benin 0.0032 1 622 0.0032 1 622 Bolivia (Plurinational State of) 0.0129 6 539 0.0129 6 539 Bosnia and Herzegovina 0.0140 7 097 0.0140 7 097 Botswana 0.0151 7 654 0.0151 7 654 Brazil 4.1193 2 088 064 4.1193 2 088 064 Bulgaria 0.0485 24 585 0.0485 24 585 Burkina Faso 0.0043 2 180 0.0043 2 180 Burundi 0.0011 558 0.0011 558 Cabo Verde 0.0011 558 0.0011 558 Cambodia 0.0043 2 180 0.0043 2 180 Cameroon 0.0108 5 474 0.0108 5 474 Canada 3.1474 1 595 410 3.1474 1 595 410 Central African Republic 0.0011 558 0.0011 558 Chad 0.0054 2 737 0.0054 2 737 Chile 0.4299 217 915 0.4299 217 915 China 8.5349 4 326 320 8.5349 4 326 320 Colombia 0.3470 175 893 0.3470 175 893 Comoros 0.0011 558 0.0011 558 Congo 0.0065 3 295 0.0065 3 295 Costa Rica 0.0506 25 649 0.0506 25 649 Côte d’Ivoire 0.0097 4 917 0.0097 4 917 Croatia 0.1067 54 086 0.1067 54 086 Cyprus 0.0463 23 469 0.0463 23 469 Czechia 0.3707 187 907 0.3707 187 907 Democratic Republic of the Congo 0.0086 4 359 0.0086 4 359 Denmark 0.6293 318 991 0.6293 318 991 Djibouti 0.0011 558 0.0011 558 Dominican Republic 0.0496 25 142 0.0496 25 142
continued on next page
2017Assessment
scale %
2017 Contributions
S/20/11
2017Assessment
scale %
2017 Contributions

C/108/15
8
FINANCING OF THE ADMINISTRATIVE PART OF THE BUDGET (continued) Scale of assessment and contributions
(in Swiss francs)
MEMBER STATES
(1) (2) (3) (4)
Ecuador 0.0722 36 598 0.0722 36 598 Egypt 0.1638 83 030 0.1638 83 030 El Salvador 0.0151 7 654 0.0151 7 654 Eritrea 0.0011 558 0.0011 558 Estonia 0.0409 20 732 0.0409 20 732 Ethiopia 0.0108 5 474 0.0108 5 474 Fiji 0.0032 1 622 0.0032 1 622 Finland 0.4913 249 039 0.4913 249 039 France 5.2356 2 653 912 5.2356 2 653 912 Gabon 0.0183 9 276 0.0183 9 276 Gambia 0.0011 558 0.0011 558 Georgia 0.0086 4 359 0.0086 4 359 Germany 6.8841 3 489 533 6.8841 3 489 533 Ghana 0.0172 8 719 0.0172 8 719 Greece 0.5075 257 251 0.5075 257 251 Guatemala 0.0302 15 308 0.0302 15 308 Guinea 0.0022 1 115 0.0022 1 115 Guinea-Bissau 0.0011 558 0.0011 558 Guyana 0.0022 1 115 0.0022 1 115 Haiti 0.0032 1 622 0.0032 1 622 Holy See 0.0011 558 0.0011 558 Honduras 0.0086 4 359 0.0086 4 359 Hungary 0.1735 87 947 0.1735 87 947 Iceland 0.0248 12 571 0.0248 12 571 India 0.7941 402 527 0.7941 402 527 Iran (Islamic Republic of) 0.5075 257 251 0.5075 257 251 Ireland 0.3610 182 990 0.3610 182 990 Israel 0.4633 234 846 0.4633 234 846 Italy 4.0385 2 047 106 4.0385 2 047 106 Jamaica 0.0097 4 917 0.0097 4 917 Japan 10.4299 5 286 891 10.4299 5 286 891 Jordan 0.0216 10 949 0.0216 10 949 Kazakhstan 0.2058 104 320 0.2058 104 320 Kenya 0.0194 9 834 0.0194 9 834 Kiribati 0.0011 558 0.0011 558 Kyrgyzstan 0.0022 1 115 0.0022 1 115 Latvia 0.0539 27 322 0.0539 27 322 Lesotho 0.0011 558 0.0011 558 Liberia 0.0011 558 0.0011 558 Libya 0.1347 68 279 0.1347 68 279 Lithuania 0.0776 39 335 0.0776 39 335 Luxembourg 0.0690 34 976 0.0690 34 976 Madagascar 0.0032 1 622 0.0032 1 622
continued on next page
2017Assessment
scale %
2017 Contributions
S/20/11
2017Assessment
scale %
2017 Contributions

C/108/15
9
FINANCING OF THE ADMINISTRATIVE PART OF THE BUDGET (continued) Scale of assessment and contributions
(in Swiss francs)
MEMBER STATES
(1) (2) (3) (4)
Malawi 0.0022 1 115 0.0022 1 115 Maldives 0.0022 1 115 0.0022 1 115 Mali 0.0032 1 622 0.0032 1 622 Malta 0.0172 8 719 0.0172 8 719 Marshall Islands 0.0011 558 0.0011 558 Mauritania 0.0022 1 115 0.0022 1 115 Mauritius 0.0129 6 539 0.0129 6 539 Mexico 1.5462 783 765 1.5462 783 765 Micronesia (Federated States of) 0.0011 558 0.0011 558 Mongolia 0.0054 2 737 0.0054 2 737 Montenegro 0.0043 2 180 0.0043 2 180 Morocco 0.0582 29 501 0.0582 29 501 Mozambique 0.0043 2 180 0.0043 2 180 Myanmar 0.0108 5 474 0.0108 5 474 Namibia 0.0108 5 474 0.0108 5 474 Nauru 0.0011 558 0.0011 558 Nepal 0.0065 3 295 0.0065 3 295 Netherlands 1.5969 809 465 1.5969 809 465 New Zealand 0.2888 146 392 0.2888 146 392 Nicaragua 0.0043 2 180 0.0043 2 180 Niger 0.0022 1 115 0.0022 1 115 Nigeria 0.2252 114 153 0.2252 114 153 Norway 0.9148 463 710 0.9148 463 710 Pakistan 0.1002 50 791 0.1002 50 791 Panama 0.0366 18 552 0.0366 18 552 Papua New Guinea 0.0043 2 180 0.0043 2 180 Paraguay 0.0151 7 654 0.0151 7 654 Peru 0.1465 74 261 0.1465 74 261 Philippines 0.1778 90 126 0.1778 90 126 Poland 0.9062 459 351 0.9062 459 351 Portugal 0.4224 214 114 0.4224 214 114 Republic of Korea 2.1970 1 113 654 2.1970 1 113 654 Republic of Moldova 0.0043 2 180 0.0043 2 180 Romania 0.1983 100 518 0.1983 100 518 Rwanda 0.0022 1 115 0.0022 1 115 Saint Kitts and Nevis 0.0011 558 0.0011 558 Saint Lucia 0.0011 558 0.0011 558 Saint Vincent and the Grenadines 0.0011 558 0.0011 558 Samoa 0.0011 558 0.0011 558 Sao Tome and Principe 0.0011 558 0.0011 558 Senegal 0.0054 2 737 0.0054 2 737 Serbia 0.0345 17 488 0.0345 17 488 Seychelles 0.0011 558 0.0011 558
continued on next page
2017Assessment
scale %
2017 Contributions
S/20/11
2017Assessment
scale %
2017 Contributions
C/108/15
10
FINANCING OF THE ADMINISTRATIVE PART OF THE BUDGET (continued) Scale of assessment and contributions
(in Swiss francs)
Note: The total number of Member States is 166.
MEMBER STATES
(1) (2) (3) (4)
Sierra Leone 0.0011 558 0.0011 558 Slovakia 0.1724 87 389 0.1724 87 389 Slovenia 0.0905 45 874 0.0905 45 874 Solomon Islands 0.0011 558 0.0011 558 Somalia 0.0011 558 0.0011 558 South Africa 0.3922 198 805 0.3922 198 805 South Sudan 0.0032 1 622 0.0032 1 622 Spain 2.6323 1 334 307 2.6323 1 334 307 Sri Lanka 0.0334 16 930 0.0334 16 930 Sudan 0.0108 5 474 0.0108 5 474 Suriname 0.0065 3 295 0.0065 3 295 Swaziland 0.0022 1 115 0.0022 1 115 Sweden 1.0301 522 155 1.0301 522 155 Switzerland 1.2284 622 673 1.2284 622 673 Tajikistan 0.0043 2 180 0.0043 2 180 Thailand 0.3136 158 963 0.3136 158 963 The former Yugoslav Republic of Macedonia
0.0075 3 802 0.0075 3 802
Timor-Leste 0.0032 1 622 0.0032 1 622 Togo 0.0011 558 0.0011 558 Tonga 0.0011 558 0.0011 558 Trinidad and Tobago 0.0366 18 552 0.0366 18 552 Tunisia 0.0302 15 308 0.0302 15 308 Turkey 1.0969 556 016 1.0969 556 016 Turkmenistan 0.0280 14 193 0.0280 14 193 Tuvalu 0.0011 558 0.0011 558 Uganda 0.0097 4 917 0.0097 4 917 Ukraine 0.1110 56 266 0.1110 56 266 United Kingdom 4.8089 2 437 620 4.8089 2 437 620 United Republic of Tanzania 0.0108 5 474 0.0108 5 474 United States of America 23.7043 12 015 652 23.7043 12 015 652 Uruguay 0.0851 43 137 0.0851 43 137 Vanuatu 0.0011 558 0.0011 558 Venezuela (Bolivarian Republic of) 0.6153 311 894 0.6153 311 894 Viet Nam 0.0625 31 681 0.0625 31 681 Yemen 0.0108 5 474 0.0108 5 474 Zambia 0.0075 3 802 0.0075 3 802 Zimbabwe 0.0043 2 180 0.0043 2 180
Grand total 100.0011 50 690 324 100.0011 50 690 324
2017Assessment
scale %
2017 Contributions
S/20/11
2017Assessment
scale %
2017 Contributions
C/108/15
11
PART II
OPERATIONS
(in US dollars)
C/108/15
12
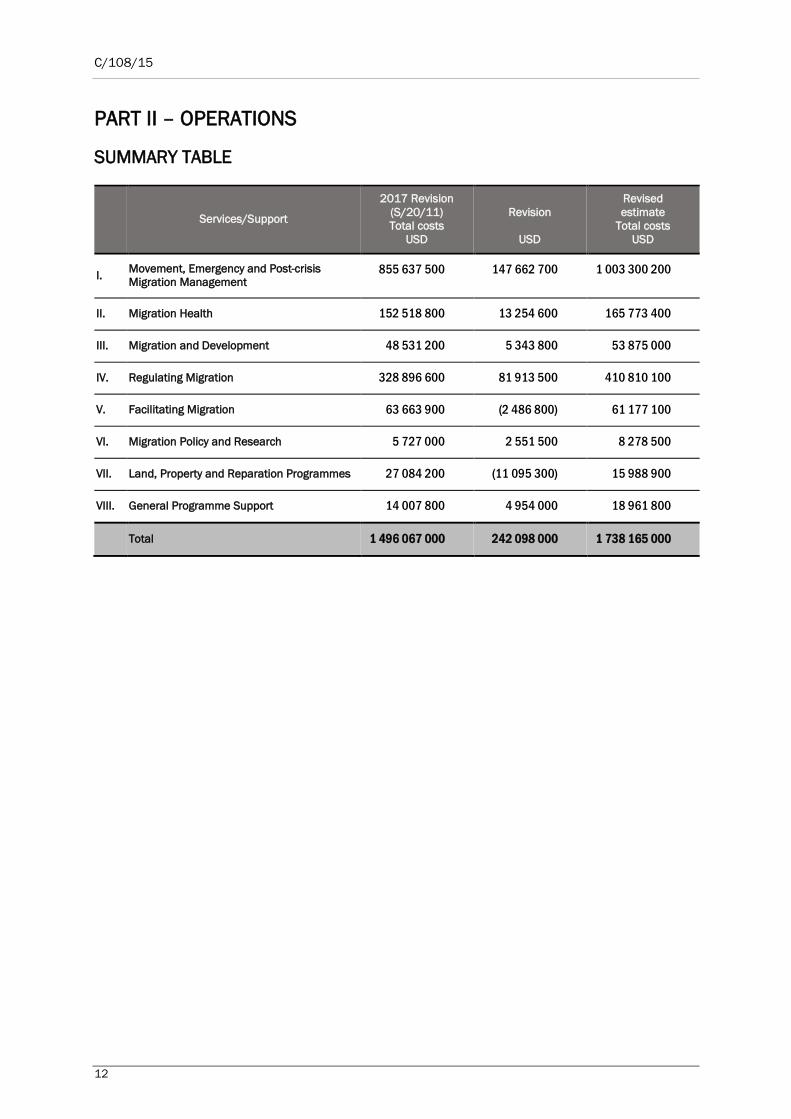
PART II – OPERATIONS
SUMMARY TABLE
Services/Support
2017 Revision (S/20/11) Total costs
USD
Revision
USD
Revised estimate
Total costs USD
I. Movement, Emergency and Post-crisis Migration Management
855 637 500 147 662 700 1 003 300 200
II. Migration Health 152 518 800 13 254 600 165 773 400
III. Migration and Development 48 531 200 5 343 800 53 875 000
IV. Regulating Migration 328 896 600 81 913 500 410 810 100
V. Facilitating Migration 63 663 900 (2 486 800) 61 177 100
VI. Migration Policy and Research 5 727 000 2 551 500 8 278 500
VII. Land, Property and Reparation Programmes 27 084 200 (11 095 300) 15 988 900
VIII. General Programme Support 14 007 800 4 954 000 18 961 800
Total 1 496 067 000 242 098 000 1 738 165 000

C/108/15
13
ANTICIPATED VOLUNTARY CONTRIBUTIONS TO THE OPERATIONAL PART OF THE BUDGET FOR 2017
Unearmarkeda Earmarked TotalUSD USD USD
MEMBER STATES
Argentina 14 342 100 14 342 100
Australia 76 530 300 76 530 300 Austriab 39 600 4 672 600 4 712 200 Belgiumb 601 000 10 944 200 11 545 200
Belize 5 000 5 000 Bulgariab 2 071 300 2 071 300
Canada 62 538 200 62 538 200
Chile 330 100 330 100
China 637 900 637 900
Colombia 20 919 100 20 919 100
Costa Rica 5 000 5 000 Croatiab 327 000 327 000 Cyprusb 610 700 610 700 Czechiab 736 000 736 000 Denmarkb 2 356 100 2 356 100
Dominican Republic 5 000 5 000
El Salvador 5 000 5 000 Estoniab 435 900 435 900 Finlandb 9 949 300 9 949 300 Franceb 11 992 300 11 992 300 Germanyb 98 424 800 98 424 800 Greeceb 19 186 900 19 186 900
Guatemala 5 000 5 000
Guyana 549 000 549 000
Honduras 210 200 210 200 Hungaryb 606 400 606 400
Iceland 282 600 282 600 Irelandb 1 733 800 1 733 800 Italyb 34 597 600 34 597 600
Japan 60 790 500 60 790 500 Latviab 165 900 165 900 Lithuaniab 1 160 900 1 160 900 Luxembourgb 1 163 300 1 163 300 Maltab 137 300 137 300
Mexico 1 142 900 1 142 900 Netherlandsb 30 107 800 30 107 800
New Zealand 1 904 300 1 904 300
Nicaragua 5 000 5 000
Norway 19 744 900 19 744 900
Panama 5 000 5 000
Papua New Guinea 2 539 500 2 539 500 Paraguay 354 900 354 900
continued on next page

C/108/15
14
ANTICIPATED VOLUNTARY CONTRIBUTIONS TO THE OPERATIONAL PART OF THE BUDGET FOR 2017 (continued)
Unearmarkeda Earmarked TotalUSD USD USD
MEMBER STATES (continued)
Peru 54 052 900 54 052 900
Philippines 5 413 300 5 413 300 Polandb 440 600 440 600 Portugalb 751 900 751 900
Republic of Korea 3 543 100 3 543 100 Romaniab 1 116 900 1 116 900
Serbia 54 100 54 100 Slovakiab 1 150 100 1 150 100 Sloveniab 87 300 87 300 Spainb 2 650 200 2 650 200 Swedenb 32 385 200 32 385 200
Switzerland 22 057 500 22 057 500
Thailand 35 800 35 800
Timor-Leste 402 700 402 700
The former Yugoslav Republic of Macedonia 118 100 118 100
Turkey 3 228 100 3 228 100 United Kingdomb 81 759 800 81 759 800
United States of America 2 000 000 499 932 100 501 932 100 Uruguay 669 700 669 700
Total - Member States 2 640 600 1 204 081 000 1 206 721 600
OTHERS
Kuwait 4 897 700 4 897 700
Qatar 288 300 288 300
Saudi Arabia 4 363 300 4 363 300
United Arab Emirates 195 500 195 500
UNSC resolution 1244‑administered Kosovo 973 000 973 000
United Nations organizations 117 294 500 117 294 500 European Unionb 231 251 800 231 251 800
Refugee Loan Fund repayments 53 000 000 53 000 000
Migrants, sponsors, voluntary agencies and others 110 246 000 110 246 000
Private sector 4 568 900 4 568 900
Sasakawa Endowment Fund interest 5 000 5 000 Interest income 4 359 400 4 359 400
Grand total 7 000 000 1 731 165 000 1 738 165 000 a Out of the unearmarked contributions from the Governments of Austria, Belgium and the United States of America, a significant portion is set aside for the IOM Development Fund. The total contribution from Belgium is EUR 1,000,000 (equivalent to USD 1,202,000). The remainder has been allocated to projects.b Consolidated contributions from the European Union (EU) and IOM Member States of the EU total USD 583,614,500.

C/108/15
15
OVERVIEW 8. The total Operational Part of the Budget is estimated at USD 1.738 billion, which represents an increase of USD 242 million, or 16 per cent, compared with the approved Revision of the Programme and Budget for 2017 (S/20/11) with its total budget of approximately USD 1.496 billion. Adjustments have been made in the present document to reflect the projections for funded activities being implemented by the Organization until the end of 2017. 9. A list of anticipated voluntary contributions from donors for projects under the Operational Part of the Budget for 2017 is shown on pages 13 and 14. 10. A brief summary explaining the revised budget by programme area is outlined below, and a table showing the geographical breakdown is provided on page 17. Most programme areas and regions show increases in the level of activities. 11. A summary of the sources and application of the OSI of USD 79.8 million is provided on page 18. Movement, Emergency and Post-crisis Migration Management 12. Budgeted resources have increased from USD 855.6 million to USD 1.003 billion. The increase of USD 147.7 million is mainly due to resettlement assistance provided to France, Germany and the United Kingdom; humanitarian assistance provided to internally displaced populations and conflict-affected populations in Greece, Iraq, Libya, South Sudan and Yemen; and community stabilization initiatives in the Central African Republic, Greece and the Philippines. Migration Health 13. Budgeted resources have increased from USD 152.5 million to USD 165.8 million. The increase of USD 13.3 million relates mainly to health assessment activities for resettlement in Canada and the United States of America; and health-care intervention activities in Ghana, Guinea, Guinea-Bissau, Senegal, Sierra Leone and Yemen. Migration and Development 14. Budgeted resources have increased from USD 48.5 million to USD 53.9 million. The increase of USD 5.4 million is mainly due to infrastructure works in Argentina, for which IOM provides technical and administrative assistance; and activities to increase the developmental impact of labour migration in Myanmar. Regulating Migration 15. Budgeted resources have increased from USD 328.9 million to USD 410.8 million. The increase of USD 81.9 million relates primarily to voluntary return and reintegration support provided to migrants and unsuccessful asylum seekers, particularly in Europe. Facilitating Migration 16. Budgeted resources have decreased from USD 63.7 million to USD 61.2 million. The decrease of USD 2.5 million mainly relates to travel assistance under self-payer programmes in South American countries and family assistance programmes for Syrians. Migration Policy and Research 17. Budgeted resources have increased from USD 5.7 million to USD 8.3 million. The increase of USD 2.6 million relates primarily to migration policy activities and research focused on migration dynamics, trends and policies.

C/108/15
16
Land, Property and Reparation Programmes 18. Budgeted resources have decreased from USD 27.1 million to USD 16.0 million. The decrease of USD 11.1 million is mainly due to a slowdown in activities related to land restitution policies for internally displaced persons and the strengthening of institutions providing support, including psychosocial and physical rehabilitation, to vulnerable populations in Colombia. General Programme Support 19. Budgeted resources have increased from USD 14.0 million to USD 19.0 million. The increase of USD 5.0 million relates mainly to humanitarian assistance to support the Libyan authorities in managing migration flows by improving human rights compliance; and various projects to strengthen IOM internal control mechanisms and the Organization’s project management capacity.

C/108/15
17
GEOGRAPHICAL BREAKDOWN OF THE OPERATIONAL PART OF THE BUDGET (in US dollars)
OVERALL 2017 SUMMARY
Africa Middle East
Latin America and the
Caribbean
North America
Asia and Oceania Europe
Global Support/ Services
Total
I. Movement, Emergency and Post-crisis Migration Management
301 318 100 302 389 300 119 593 000 4 981 700 132 845 700 116 376 000 25 796 400 1 003 300 200
II. Migration Health 67 092 700 28 181 800 5 946 200 40 440 900 14 189 300 9 922 500 165 773 400
III. Migration and Development 15 435 100 170 100 22 661 500 3 335 500 4 804 700 7 468 100 53 875 000
IV. Regulating Migration 75 839 600 8 193 200 22 089 100 1 702 200 83 444 700 216 591 200 2 950 100 410 810 100
V. Facilitating Migration 5 408 400 7 599 100 11 766 100 465 600 16 978 900 7 964 100 10 994 900 61 177 100
VI. Migration Policy and Research 1 401 200 408 500 172 000 10 500 913 600 1 470 800 3 901 900 8 278 500
VII. Land, Property and Reparation Programmes 14 637 400 1 179 100 172 400 15 988 900
VIII. General Programme Support 1 860 400 632 000 109 300 960 000 1 058 300 14 341 800 18 961 800
Grand total 468 355 500 347 574 000 196 974 600 7 160 000 280 098 400 362 626 800 75 375 700 1 738 165 000
The geographical breakdown in the Revision of the Programme and Budget for 2017 (S/20/11) is reproduced below for the purposes of comparison.
OVERALL 2017 SUMMARY (S/20/11)
Africa Middle East
Latin America and the
Caribbean
North America
Asia and Oceania Europe
Global Support/ Services
Total
I. Movement, Emergency and Post-crisis Migration Management
226 490 200 268 701 000 155 640 900 4 981 700 114 751 400 68 966 700 16 105 600 855 637 500
II. Migration Health 62 693 000 24 843 900 5 648 400 37 857 300 13 725 600 7 750 600 152 518 800
III. Migration and Development 12 407 300 22 608 700 1 458 100 4 736 000 7 321 100 48 531 200
IV. Regulating Migration 38 427 300 3 892 100 22 082 100 408 400 73 007 500 189 081 400 1 997 800 328 896 600
V. Facilitating Migration 4 596 300 7 618 200 19 741 700 465 600 13 534 900 6 756 800 10 950 400 63 663 900
VI. Migration Policy and Research 1 401 200 408 500 838 600 1 470 800 1 607 900 5 727 000
VII. Land, Property and Reparation Programmes 26 052 200 942 200 89 800 27 084 200
VIII. General Programme Support 9 200 632 000 95 500 955 500 220 600 12 095 000 14 007 800
Grand total 346 024 500 306 095 700 251 869 500 5 855 700 243 345 500 285 047 700 57 828 400 1 496 067 000

C/108/15
18
SOURCES AND APPLICATION OF OPERATIONAL SUPPORT INCOME SUMMARY TABLE (in US dollars)
Sources 2017
Revision
(S/20/11) Revision
Revised estimate
Total costs
PROJECT-RELATED OVERHEAD INCOME
General overhead 61 100 000 61 100 000
Overhead to cover staff security 11 700 000 11 700 000
Total project-related overhead income 72 800 000 72 800 000
MISCELLANEOUS INCOME
Unearmarked contributions 3 300 000 (659 400) 2 640 600
Interest income 3 700 000 659 400 4 359 400
Total miscellaneous income 7 000 000 7 000 000
Total 79 800 000 79 800 000
Application 2017
Revision
(S/20/11)
Revision Revised estimate
Total costs
PROJECT-RELATED OVERHEAD INCOME
Staff and services for Headquarters 12 194 000 12 194 000
Staff and services for Manila Administrative Centre 8 389 000 8 389 000
Staff and services for Panama Administrative Centre 2 532 000 2 532 000
Staff and services for Regional Offices 17 910 000 17 910 000
Staff and services for Special Liaison Offices 1 044 000 1 044 000
Staff and services for Country Offices 5 785 000 5 785 000
African Capacity Building Centre 484 000 484 000
Global Migration Data Analysis Centre 710 000 710 000
Global Activity/Support 6 152 000 6 152 000
Information Management Competence Centre (PRISM) 2 400 000 2 400 000
Staff security 11 700 000 11 700 000
Unbudgeted activities and structures 3 500 000 3 500 000
Total project-related overhead income 72 800 000 72 800 000
MISCELLANEOUS INCOME
IOM Development Fund – Line 1 1 400 000 1 400 000
IOM Development Fund – Line 2 5 600 000 5 600 000
Total miscellaneous income 7 000 000 7 000 000
Total 79 800 000 79 800 000